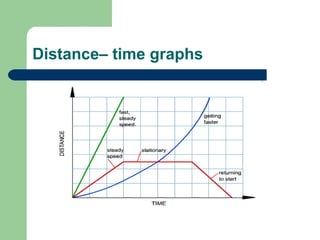
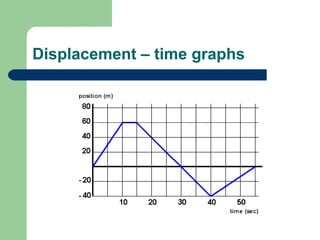
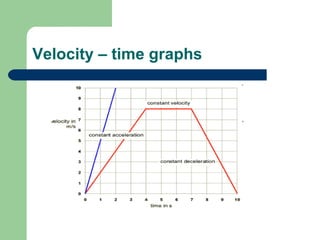
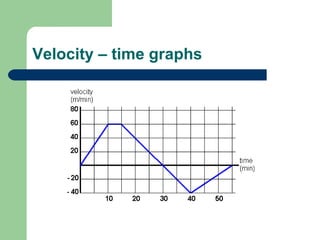
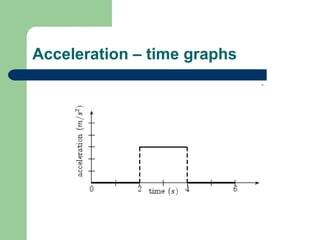
Kinematics  Topic 2.1 2.1.7 – Draw and analyse distance – time graphs, displacement – time graphs, velocity – time graphs and acceleration – time graphs. 2.1.8 – Calculate and interpret the gradients of displacement – time graphs and velocity – time graphs, and the areas under velocity – time graphs and acceleration – time graphs.
Distance– time graphs
Displacement – time graphs
Graph info Increasing slope means increasing velocity Constant slope means constant velocity Decreasing slope means decreasing velocity Horizontal point (zero slope) means zero velocity Negative slope indicates negative velocity Flattening curve implies velocity becoming less negative Continuing zero slope implies the object is at rest
Velocity – time graphs
Graph info Positive slope means positive acceleration Horizontal line (zero slope) means zero acceleration Negative slope means negative acceleration
Acceleration – time graphs

Kinematics

  • 1.
    Kinematics Topic2.1 2.1.7 – Draw and analyse distance – time graphs, displacement – time graphs, velocity – time graphs and acceleration – time graphs. 2.1.8 – Calculate and interpret the gradients of displacement – time graphs and velocity – time graphs, and the areas under velocity – time graphs and acceleration – time graphs.
  • 2.
  • 3.
  • 4.
    Graph info Increasingslope means increasing velocity Constant slope means constant velocity Decreasing slope means decreasing velocity Horizontal point (zero slope) means zero velocity Negative slope indicates negative velocity Flattening curve implies velocity becoming less negative Continuing zero slope implies the object is at rest
  • 5.
  • 6.
  • 7.
    Graph info Positiveslope means positive acceleration Horizontal line (zero slope) means zero acceleration Negative slope means negative acceleration
  • 8.