How Automation is Driving Efficiency Through the Last Mile of Reporting
Keynote technicals intraday future levels
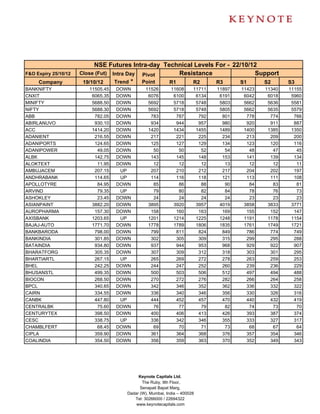
1. NSE Futures Intra-day Technical Levels For - 22/10/12
F&O Expiry 25/10/12 Close (Fut)
Intra Day Pivot Resistance Support
Company 19/10/12 Trend * Point R1 R2 R3 S1 S2 S3
BANKNIFTY 11505.45 DOWN 11526 11608 11711 11897 11423 11340 11155
CNXIT 6065.35 DOWN 6076 6100 6134 6191 6042 6018 5960
MINIFTY 5688.50 DOWN 5692 5718 5748 5803 5662 5636 5581
NIFTY 5688.30 DOWN 5692 5718 5748 5805 5662 5635 5579
ABB 782.05 DOWN 783 787 792 801 778 774 766
ABIRLANUVO 930.10 DOWN 934 944 957 980 920 911 887
ACC 1414.20 DOWN 1420 1434 1455 1489 1400 1385 1350
ADANIENT 216.55 DOWN 217 221 225 234 213 209 200
ADANIPORTS 124.65 DOWN 125 127 129 134 123 120 116
ADANIPOWER 49.05 DOWN 50 50 52 54 48 47 45
ALBK 142.75 DOWN 143 145 148 153 141 139 134
ALOKTEXT 11.95 DOWN 12 12 12 13 12 12 11
AMBUJACEM 207.15 UP 207 210 212 217 204 202 197
ANDHRABANK 114.65 UP 114 116 118 121 113 111 108
APOLLOTYRE 84.95 DOWN 85 86 88 90 84 83 81
ARVIND 79.35 UP 79 80 82 84 78 76 73
ASHOKLEY 23.45 DOWN 24 24 24 24 23 23 23
ASIANPAINT 3882.20 DOWN 3895 3920 3957 4019 3858 3833 3771
AUROPHARMA 157.30 DOWN 158 160 163 169 155 152 147
AXISBANK 1203.65 UP 1201 1214 1225 1248 1191 1178 1154
BAJAJ-AUTO 1771.70 DOWN 1778 1789 1806 1835 1761 1749 1721
BANKBARODA 798.00 DOWN 799 811 824 849 786 774 749
BANKINDIA 301.85 DOWN 302 305 309 315 299 295 288
BATAINDIA 934.80 DOWN 937 944 953 968 929 922 907
BHARATFORG 305.35 DOWN 307 309 312 318 303 301 295
BHARTIARTL 267.15 UP 265 269 272 278 263 259 253
BHEL 242.25 DOWN 244 247 252 260 239 236 229
BHUSANSTL 499.35 DOWN 500 503 506 512 497 494 488
BIOCON 268.50 DOWN 270 272 276 282 266 264 258
BPCL 340.65 DOWN 342 346 352 362 336 332 322
CAIRN 334.55 DOWN 336 340 346 356 330 326 316
CANBK 447.80 UP 444 452 457 470 440 432 419
CENTRALBK 75.60 DOWN 76 77 79 82 74 73 70
CENTURYTEX 398.50 DOWN 400 406 413 426 393 387 374
CESC 338.75 UP 336 342 346 355 333 327 317
CHAMBLFERT 68.45 DOWN 69 70 71 73 68 67 64
CIPLA 359.90 DOWN 361 364 368 376 357 354 346
COALINDIA 354.50 DOWN 356 359 363 370 352 349 343
Keynote Capitals Ltd.
The Ruby, 9th Floor,
Senapati Bapat Marg,
Dadar (W), Mumbai, India – 400028
Tel: 30266000 / 22694322
www.keynotecapitals.com
2. NSE Futures Intra-day Technical Levels For - 22/10/12
F&O Expiry 25/10/12 Close (Fut) Intra Day Pivot Resistance Support
Company 19/10/12 Trend * Point R1 R2 R3 S1 S2 S3
COLPAL 1250.20 UP 1245 1260 1269 1293 1236 1221 1197
CROMPGREAV 130.20 DOWN 131 133 136 140 129 127 122
DABUR 131.45 DOWN 132 134 136 140 130 128 124
DENABANK 110.75 DOWN 111 113 115 118 109 108 104
DISHTV 76.05 DOWN 77 78 81 84 75 74 70
DIVISLAB 1129.45 DOWN 1132 1144 1159 1185 1117 1105 1078
DLF 206.60 UP 206 209 212 218 204 201 195
DRREDDY 1705.95 DOWN 1707 1718 1730 1754 1695 1683 1659
EXIDEIND 148.65 DOWN 154 161 173 191 142 136 117
FEDERALBNK 484.40 DOWN 487 491 497 508 480 476 465
FINANTECH 1008.80 DOWN 1014 1024 1040 1066 998 987 961
GAIL 361.30 DOWN 363 368 376 388 356 350 337
GMRINFRA 22.60 DOWN 23 23 24 25 22 22 21
GODREJIND 307.70 UP 306 312 316 326 302 296 285
GRASIM 3422.35 DOWN 3442 3472 3522 3602 3393 3363 3283
GSPL 79.30 DOWN 80 81 83 85 78 77 74
GUJFLUORO 360.00 UP 359 364 368 376 355 350 341
GVKPIL 13.55 DOWN 14 14 14 15 13 13 13
HAVELLS 652.40 DOWN 653 659 665 676 647 641 630
HCLTECH 605.40 UP 601 612 618 635 595 584 567
HDFC 753.55 DOWN 754 761 768 781 747 741 728
HDFCBANK 629.00 DOWN 631 634 639 648 626 622 613
HDIL 102.30 DOWN 103 105 107 112 100 98 94
HEROMOTOCO 1844.60 UP 1835 1859 1873 1911 1821 1797 1759
HEXAWARE 110.40 DOWN 111 112 114 117 109 108 105
HINDALCO 115.15 DOWN 116 117 119 123 114 113 109
HINDPETRO 301.00 DOWN 301 303 305 309 299 298 294
HINDUNILVR 568.70 DOWN 570 574 578 587 565 562 554
HINDZINC 133.35 DOWN 134 136 138 141 132 131 127
IBREALEST 62.60 DOWN 63 65 68 72 60 58 54
ICICIBANK 1059.95 DOWN 1065 1076 1091 1118 1049 1038 1012
IDBI 99.55 DOWN 100 101 103 106 98 97 94
IDEA 81.10 UP 81 82 83 84 80 79 78
IDFC 152.50 DOWN 154 156 159 163 151 149 144
IFCI 29.95 DOWN 30 31 31 33 29 29 28
IGL 254.65 DOWN 256 258 262 268 252 250 244
INDHOTEL 66.55 DOWN 67 69 71 74 65 64 61
INDIACEM 98.20 DOWN 99 102 106 112 95 93 86
INDUSINDBK 363.15 UP 363 365 368 372 361 358 353
INFY 2384.05 DOWN 2384 2401 2417 2450 2368 2351 2319
IOB 81.30 DOWN 82 83 85 88 80 79 76
Keynote Capitals Ltd.
The Ruby, 9th Floor,
Senapati Bapat Marg,
Dadar (W), Mumbai, India – 400028
Tel: 30266000 / 22694322
www.keynotecapitals.com
3. NSE Futures Intra-day Technical Levels For - 22/10/12
F&O Expiry 25/10/12 Close (Fut) Intra Day Pivot Resistance Support
Company 19/10/12 Trend * Point R1 R2 R3 S1 S2 S3
IOC 259.20 UP 258 260 261 264 257 255 253
IRB 146.50 DOWN 147 150 153 158 144 141 135
ITC 297.65 UP 296 301 304 312 293 288 280
IVRCLINFRA 45.15 UP 45 46 47 49 44 43 42
JINDALSTEL 408.45 DOWN 411 415 422 434 404 399 388
JISLJALEQS 70.75 DOWN 71 73 75 79 69 67 63
JPASSOCIAT 93.55 DOWN 94 95 97 99 92 91 88
JPPOWER 38.25 UP 38 39 39 41 37 37 35
JSWENERGY 61.80 DOWN 63 64 65 68 61 60 57
JSWSTEEL 736.45 DOWN 737 743 750 762 730 724 712
JUBLFOOD 1312.00 DOWN 1319 1331 1350 1381 1300 1288 1257
KOTAKBANK 629.50 UP 629 639 649 668 620 610 590
KTKBANK 131.50 UP 131 134 136 141 129 126 121
LICHSGFIN 248.80 DOWN 250 255 261 271 244 240 230
LT 1635.00 DOWN 1637 1653 1670 1703 1620 1605 1572
LUPIN 573.15 DOWN 575 578 584 593 570 566 557
M&M 825.35 DOWN 829 837 849 869 817 809 790
MARUTI 1372.10 DOWN 1374 1382 1393 1411 1363 1355 1336
MCDOWELL-N 1278.60 UP 1271 1290 1302 1332 1260 1241 1210
MCLEODRUSS 309.95 DOWN 312 314 318 324 308 306 299
MPHASIS 399.90 UP 400 403 406 412 397 393 387
MRF 10182.60 DOWN 10190 10213 10244 10298 10159 10136 10082
NCC 47.70 DOWN 48 50 51 54 46 45 42
NHPC 22.20 UP 22 22 23 23 22 22 21
NMDC 186.45 DOWN 187 189 191 194 185 184 181
NTPC 166.35 DOWN 167 168 170 173 165 164 161
OFSS 2950.60 DOWN 2956 2964 2978 3000 2942 2934 2912
ONGC 279.50 UP 278 282 284 289 276 273 267
OPTOCIRCUI 127.15 DOWN 128 130 132 137 125 124 119
ORIENTBANK 295.15 DOWN 296 300 306 316 290 286 276
PANTALOONR 196.65 UP 196 199 202 209 193 189 183
PEL 475.30 UP 473 479 483 493 469 463 453
PETRONET 169.25 UP 168 173 177 187 164 159 149
PFC 199.40 UP 199 202 205 212 196 192 186
PNB 825.65 DOWN 828 836 846 863 818 811 794
POWERGRID 119.40 DOWN 120 120 121 123 119 118 117
PTC 67.85 DOWN 68 69 70 71 67 66 65
PUNJLLOYD 51.75 DOWN 52 53 54 56 51 50 48
RANBAXY 540.60 DOWN 544 550 560 575 535 529 513
RAYMOND 379.90 DOWN 383 387 393 404 376 372 361
RCOM 60.00 DOWN 60 61 63 66 59 58 55
Keynote Capitals Ltd.
The Ruby, 9th Floor,
Senapati Bapat Marg,
Dadar (W), Mumbai, India – 400028
Tel: 30266000 / 22694322
www.keynotecapitals.com
4. NSE Futures Intra-day Technical Levels For - 22/10/12
F&O Expiry 25/10/12 Close (Fut)
Intra Day Pivot Resistance Support
Company 19/10/12 Trend * Point R1 R2 R3 S1 S2 S3
RECLTD 217.10 UP 216 220 223 231 213 208 200
RELCAPITAL 441.60 DOWN 446 452 463 480 435 429 411
RELIANCE 804.10 DOWN 806 811 818 830 799 794 782
RELINFRA 508.65 DOWN 511 517 524 538 503 497 483
RENUKA 34.55 DOWN 35 35 36 38 34 33 32
RPOWER 101.35 DOWN 102 104 107 111 99 98 93
SAIL 82.40 DOWN 83 83 84 85 82 81 80
SBIN 2258.00 DOWN 2259 2283 2309 2359 2234 2210 2160
SCI 55.75 DOWN 56 57 58 60 55 54 52
SESAGOA 169.45 DOWN 170 171 173 177 168 166 163
SIEMENS 688.90 DOWN 690 694 699 709 685 680 671
SINTEX 70.60 DOWN 71 72 74 76 70 69 66
SOUTHBANK 23.50 DOWN 24 24 24 25 23 23 23
SRTRANSFIN 635.20 DOWN 637 641 646 655 632 628 619
STER 100.35 UP 100 102 103 105 99 98 96
SUNPHARMA 695.70 UP 694 702 708 721 688 680 667
SUNTV 363.45 DOWN 365 373 382 399 356 348 331
SUZLON 14.95 DOWN 15 15 15 16 15 15 14
SYNDIBANK 123.85 UP 124 125 127 129 122 121 118
TATACHEM 326.40 DOWN 327 329 331 334 325 324 320
TATACOMM 251.00 UP 251 253 256 260 249 246 241
TATAGLOBAL 158.35 DOWN 160 163 167 174 156 153 146
TATAMOTORS 269.30 DOWN 270 273 277 284 266 263 257
TATAMTRDVR 166.55 DOWN 167 169 171 174 165 163 160
TATAPOWER 105.10 DOWN 106 107 108 110 104 103 101
TATASTEEL 408.00 DOWN 409 413 417 425 405 401 393
TCS 1288.10 DOWN 1293 1305 1322 1352 1276 1263 1233
TECHM 930.65 DOWN 933 943 956 980 920 909 886
TITAN 279.35 DOWN 280 282 285 290 277 275 270
UCOBANK 78.80 DOWN 79 80 82 85 77 76 73
ULTRACEMCO 2014.60 DOWN 2025 2043 2071 2118 1996 1978 1931
UNIONBANK 209.75 DOWN 210 213 215 220 207 205 200
UNIPHOS 118.80 DOWN 120 121 123 127 117 116 112
UNITECH 26.60 UP 27 27 28 29 26 25 24
VIJAYABANK 57.05 DOWN 58 58 60 62 56 55 53
VOLTAS 118.50 DOWN 119 121 123 128 117 115 111
WELCORP 98.45 DOWN 99 101 103 107 97 95 91
WIPRO 345.05 DOWN 346 349 353 359 343 340 334
Keynote Capitals Ltd.
The Ruby, 9th Floor,
Senapati Bapat Marg,
Dadar (W), Mumbai, India – 400028
Tel: 30266000 / 22694322
www.keynotecapitals.com
5. NSE Futures Intra-day Technical Levels For - 22/10/12
F&O Expiry 25/10/12 Close (Fut)Intra Day Pivot Resistance Support
Company 19/10/12 Trend * Point R1 R2 R3 S1 S2 S3
YESBANK 384.10 DOWN 385 389 395 404 379 375 365
ZEEL 192.60 UP 192 197 201 209 188 184 176
Sanjay Bhatia (AVP – Technical Research), Email Id sanjay@keynotecapitals.net
Pivot Point: Intra- Day Trading Tool. - The key to the use of this tool is the use of Stop Loss
Intra Day Trend: It is valid only till the point where Price trades above Pivot Point. For Eg. “UP” would be valid till Price
remains above Pivot Point. It would become “DOWN” in event Price trades below Pivot Point.
Pivot Point (PP): This is a trigger point for Intra Day Buy / Sell based on the price range of the previous day.
R1: Resistance 1: 1st Resistance level over Pivot Point, R2: Resistance 2: Next Resistance level after R1.
R3: Resistance 3: Next Resistance level after R2.
S1: Support 1: 1st Support level after Pivot Point, S2: Support 2: Next Support level after S1.
S3: Support 3: Next Support level after S2.
Note: As per this tool, the trader should take BUY position just above the Pivot Point and keep the Pivot Point level as stop
loss and the first target would be R1 level (Resistance 1). If R1 is crossed then R2 (Resistance 2) becomes the next target
with the stop loss placed at R1 level. If R2 is crossed then R3 (Resistance 3) becomes the next target with the stop loss
placed at R2 level.
Similarly if price goes below the Pivot Point the trader should take a SELL position and keep the Pivot Point level as the
stop loss and the first target would be S1 level (Support 1). If S1 level is breached then S2 level (Support 2) becomes the
next target with the stop loss placed at S1 level. If S2 level is breached then S3 level (Support 3) becomes the next target
with the stop loss placed at S2 level.
Disclaimer: This document is not for public distribution and has been furnished to you solely for your information and must not be reproduced
or redistributed to any other person. Persons into whose possession this document may come are required to observe these restrictions. This
material is for the personal information of the authorized recipient, and we are not soliciting any action based upon it. This report is not to be
construed as an offer to sell or the solicitation of an offer to buy any security in any jurisdiction where such an offer or solicitation would be
illegal. It is for the general information of clients of Keynote Capitals Ltd. It does not constitute a personal recommendation or take into account
the particular investment objectives, financial situations, or needs of individual clients. We have reviewed the report and in so far as it includes
current or historical information, it is believed to be reliable though its accuracy or completeness cannot be guaranteed. Neither Keynote
Capitals Ltd., nor any person connected with it, accepts any liability arising from the use of this document. The recipients of this material
should rely on their own investigations and take their own professional advice. Price and value of the investments referred to in this material
may go up or down. Past performance is not a guide for future performance. Certain transactions including those involving futures, options and
other derivatives as well as non-investment grade securities involve substantial risk and are not suitable for all investors. Reports based on
technical analysis centers on studying charts of a stock’s price movement and trading volume, as opposed to focusing on a company’s
fundamentals and as such, may not match with a report on a company’s fundamentals. Opinions expressed are our current opinions as of the
date appearing on this material only. While we endeavor to update on a reasonable basis the information discussed in this material, there may
be regulatory, compliance or other reasons that prevent us from doing so. Prospective investors and others are cautioned that any forward
looking statements are not predictions and may be subject to change without notice. Our proprietary trading and investment businesses may
make investment decisions that are inconsistent with the recommendations expressed herein. We and our affiliates, officers, directors, and
employees world wide may: (a) from time to time have long or short positions in and buy or sell the securities thereof of company (ies)
mentioned herein or (b) be engaged in any other transaction involving such securities and earn brokerage or other compensation or act as a
market maker in the financial instruments of the company (ies) discussed herein or act as advisor or lender/ borrower to such company (ies) or
have other potential conflict of interest with respect to any recommendation and related information and opinions. The analyst for this report
certifies that all of the views expressed in this report accurately reflect his or her personal views about the subject company or companies and
its or their securities, and no part of his or her compensation was, is or will be, directly or indirectly related to specific recommendations or
views expressed in this report. No part of this material may be duplicated in any form and/or redistributed without Keynote Capitals Ltd’s., prior
written consent.
Keynote Capitals Ltd.
The Ruby, 9th Floor,
Senapati Bapat Marg,
Dadar (W), Mumbai, India – 400028
Tel: 30266000 / 22694322
www.keynotecapitals.com