Download to read offline

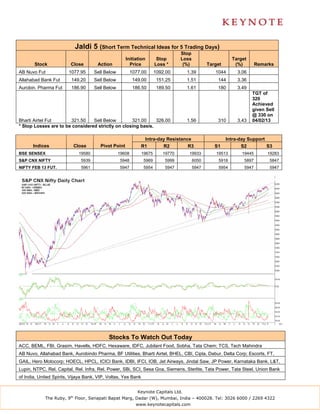

The daily technical outlook report provides an analysis of the previous day's market performance and a technical outlook. It summarizes that the domestic markets opened higher but failed to sustain gains due to lack of buying support and saw increased selling pressure. The Nifty closed slightly lower and slipped below its 50-day simple moving average, which is a negative technical sign. The report provides technical analysis indicators showing negative divergences that warn of further downside potential, and identifies support and resistance levels for the Nifty.


