Download to read offline


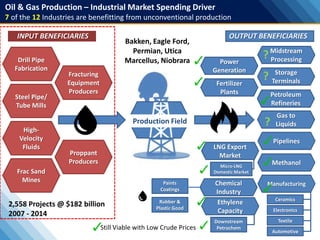
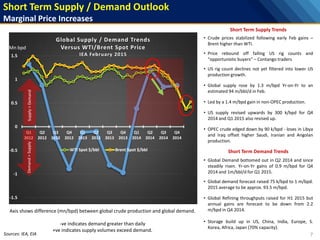
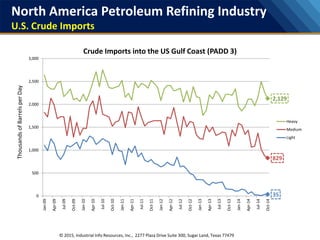
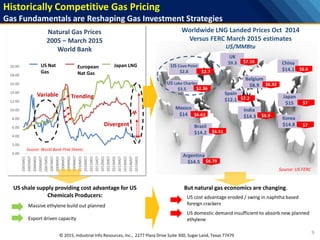
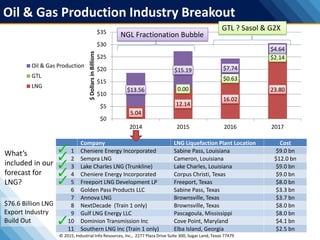
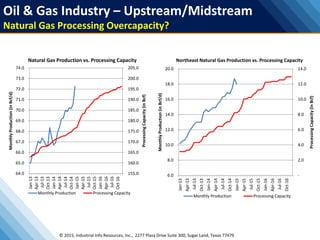
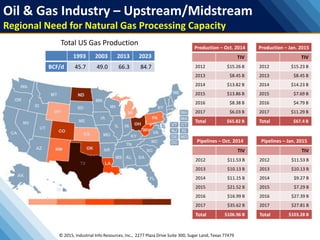
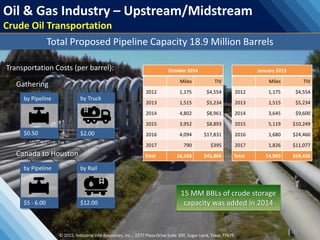


This document provides an overview and forecast of opportunities, trends, and projects in the oil and gas midstream/downstream sectors from 2015-2017. It summarizes that total investment in pipelines is forecast to be $106.96 billion, with the largest amount in 2017, while investment in production is forecast to be $65.82 billion, with the largest amount occurring in 2014. The document also outlines various LNG export terminal projects totaling $76.6 billion and increases in natural gas processing capacity requirements regionally through 2023.


