SlideShare a Scribd company logo
1 of 67
Download to read offline
Cooper and GLNG Investor Visit
20 - 23 April 2015
Moomba gas processing plant, GLNG Fairview Hub 4, GLNG LNG tanks
Disclaimer and
important notice
COOPER AND GLNG INVESTOR VISIT - APRIL 20152 |
This presentation contains forward looking statements that are subject to risk factors associated with the oil and gas industry. It is believed that the expectations reflected
in these statements are reasonable, but they may be affected by a range of variables which could cause actual results or trends to differ materially, including but not
limited to: price fluctuations, actual demand, currency fluctuations, geotechnical factors, drilling and production results, gas commercialisation, development progress,
operating results, engineering estimates, reserve estimates, loss of market, industry competition, environmental risks, physical risks, legislative, fiscal and regulatory
developments, economic and financial markets conditions in various countries, approvals and cost estimates.
All references to dollars, cents or $ in this document are to Australian currency, unless otherwise stated. All references to project completion percentages are on a value
of work done basis, unless otherwise stated.
EBITDAX (earnings before interest, tax, depreciation, depletion, exploration, evaluation and impairment), EBIT (earnings before interest and tax) and underlying profit are
non-IFRS measures that are presented to provide an understanding of the performance of Santos’ operations. Underlying profit excludes the impacts of asset
acquisitions, disposals and impairments, as well as items that are subject to significant variability from one period to the next, including the effects of fair value
adjustments and fluctuations in exchange rates. The non-IFRS financial information is unaudited however the numbers have been extracted from the audited financial
statements.
This presentation refers to estimates of petroleum reserves and contingent resources contained in Santos’ Annual Reserves Statement released to the ASX on 20 February
2015 (Annual Reserves Statement). Santos confirms that it is not aware of any new information or data that materially affects the information included in the Annual
Reserves Statement and that all the material assumptions and technical parameters underpinning the estimates in the Annual Reserves Statement continue to apply and
have not materially changed.
The 2P reserve and 2C contingent resource estimates on slides 18 and 21 are based on, and fairly represent, information and supporting documentation prepared by, or
under the supervision of, Marie-louise Lees, Anthony Western and Wade Bard who are full time employees of Santos Limited and members of the Society of Petroleum
Engineers.
The estimates of petroleum reserves and contingent resources contained in this presentation are as at 31 December 2014. Santos prepares its petroleum reserves and
contingent resources estimates in accordance with the Petroleum Resources Management System (PRMS) sponsored by the Society of Petroleum Engineers (SPE). Unless
otherwise stated, all references to petroleum reserves and contingent resources quantities in this presentation are Santos’ net share. Reference points for Santos’
petroleum reserves and contingent resources and production are defined points within Santos’ operations where normal exploration and production business ceases, and
quantities of produced product are measured under defined conditions prior to custody transfer. Fuel, flare and vent consumed to the reference points are excluded.
Petroleum reserves and contingent resources are aggregated by arithmetic summation by category and as a result, proved reserves may be a very conservative estimate
due to the portfolio effects of arithmetic summation. Petroleum reserves and contingent resources are typically prepared by deterministic methods with support from
probabilistic methods. Petroleum reserves replacement ratio is the ratio of the change in petroleum reserves (excluding production) divided by production. Conversion
factors: 1PJ of sales gas and ethane equals 171,937 boe; 1 tonne of LPG equals 8.458 boe; 1 barrel of condensate equals 0.935 boe; 1 barrel of crude oil equals 1 boe.
Santos’ Eastern Australia Operations
Leveraging the past to create value for the future
James Baulderstone
Vice President Eastern Australia
Moomba processing plant, Cooper Basin
East Australia value
remains strong
Gas capacity, production and resource position on track to meet
commitments
Significant cost savings in response to fall in oil price
Value creation through integrated portfolio of
resources and infrastructure
4 |
Cooper
delivery
COOPER AND GLNG INVESTOR VISIT - APRIL 2015
Converting
strategic
potential
Future
reserves
&
resources
Unconv-
entional
gas
Gas demand continues to drive Cooper’s long term potential
Santos has a unique integrated value proposition
Strong record of growing expected recovery with large future
potential
Reserve build and production dictated by forward capex
Cooper infill reserve conversions - positives and negatives
Encouraging results across all 3 play types
Cooper Deep Coal looks highly prospective
5 | COOPER AND GLNG INVESTOR VISIT - APRIL 2015
Safety performance Strong emphasis on Process Safety and Work Health
Safety
Process Safety
─ Proactive safety critical maintenance embedded
─ Plant and Pipeline Integrity Programs (8,000km pipe
network)
Contractor Management
─ Robust systems and processes to drive contractor
performance
─ Driving improved safety culture and safety leadership
Personnel Safety
─ Cooper Basin 4 months LTI free
─ Driving behaviour including in-vehicle monitoring
─ Working in the heat
─ Drilling safety focus on dropped objects, automated
equipment, well control and competency and leadership
Contractor CEO Safety Forum
Cooper Basin
6 |
Key themes continue to drive forward outlook
COOPER AND GLNG INVESTOR VISIT - APRIL 2015
Sustainability of East Coast business in
challenging market conditions
Transformational increase in natural gas
demand
Infrastructure positions business to deliver long
term value
Moomba Plant, Cooper Basin
Cooper Gas Performance
7 |
Improved key metrics
Gas well head
capacity
Q-Q production
Reserves and
resources
EBITDAX
margin
Cost Control
 Increased well head capacity by 15% YE 2012 to YE 2014
(from 393 to 453 mmscf/d)
15%
 Grown Q1 to Q1 gas production for the last two years
(from Q113 13.7 PJ, Q114 14.4 PJ, Q115 14.8 PJ)
8%
 Cooper expected recovery increased by 17% since 2007
(36% when contingent conventional resource bookings included)
17%
 Strong EBITDAX margin of greater than 55% for past three
years
>55%
 16% reduction in forecasted year end well costs versus
2014

COOPER AND GLNG INVESTOR VISIT - APRIL 2015
16%




Cooper meeting the cost
challenge
8 |
Reducing costs - critical response to challenging
market conditions
Cost savings delivered across all areas…
 25% reduction in overall 2015 Cooper Basin capital spend vs
2014
 Work program reductions and efficiency initiatives resulted in
20% workforce reduction
 35% reduction in Moomba accommodation levels since
December 2014 (1250 to <800)
 16% reduction in forecasted year end well costs versus 2014
 25% reduction in drilling rig day rates
 20-40% reduction in well evaluation costs
 $450k/well savings on frac and completions
…continuing to drive lower
0
1,000
2,000
3,000
4,000
5,000
6,000
7,000
8,000
2014
Actual
2015
Budget
End
2015
Forecast
Drill Frac Complete
Decreasing well costs1
AUD ‘000
1 Well costs for a standard single vertical well with 5 fracture stages
COOPER AND GLNG INVESTOR VISIT - APRIL 2015
2H 2014: 32 wells drilled, 24 wells
fractured (203 stages), 23 wells brought
online, monthly performance above or
tracking forecast
1Q 2015: 2 pads exceeded expectations,
further 2 pads on track to deliver AFE
expectations
Cooper infill – Big Lake
9 |
Big Lake demonstrating sound development metrics
Excellent execution efficiencies and solid reservoir performance
0
1
2
3
4
5
6
7
Wells by pad
Pad B Pad F Pad C Pad H
Pad J Pad I Single Pad G
Big Lake Infill Programme: Well Head first 30
day average rates
mmscf/d
Wells drilled
Capital
2P developed
Capacity add
Development cost
Big Lake Overview
32
$270-275 million
100 bcf
~76 mmscf/d
~$4 GJ
COOPER AND GLNG INVESTOR VISIT - APRIL 2015
10 | COOPER AND GLNG INVESTOR VISIT - APRIL 2015
Strategy and market
opportunity
Converting strategic potential into value
COOPER AND GLNG INVESTOR VISIT - APRIL 2015
Eastern Australia
gas market portfolio
Positioned to capitalise on the changing market
dynamics with Cooper playing a central role
Gas prices likely to remain robust at >A$8/GJ
Transformation of gas market re-rates Santos’ portfolio:
─ New sources of gas required pre-2020 to meet
demand
─ Uncontracted gas reserves more valuable (Cooper,
Kipper)
─ Opportunity to unlock Cooper Basin large undeveloped
gas resources
─ Evaluation of new supply, Narrabri Gas Project,
offshore Vic supply (Sole, VIC/P44)
-
500
1,000
1,500
2,000
2,500
2014 2016 2018 2020 2022 2024
APLNG
GLNG
QCLNG
PowerGen
Retail, C&I
Tripling of Eastern Australia Gas Demand (PJ)
Domestic
Customers
Resources
Trading
Capability
Pipeline
Capacity
Storage
Facilities
LNG
Production
Facilities
2015
Transition
year
11 |
Scale of demand presents opportunities for Cooper asset
Moomba is open for business, 3rd Party processing
Increasing ability to trade and transport gas
Gas storage in Cooper (70 PJ existing plus greenfield
opportunities)
Changing market dynamics Santos’ integrated value proposition
0
500
1,000
1,500
2,000
2,500
2014 2018 2022 2026 2030
Market opportunity Significant opportunity to supply uncontracted demand
12 |
SOURCE: CORE ENERGY GROUP 2014, EASTERN AUSTRALIA GAS OUTLOOK 2035
COOPER AND GLNG INVESTOR VISIT - APRIL 2015
Eastern Australia contracted supply and demand
PJ
Current contracted supply is
insufficient to meet forecast demand
Uncontracted and new supply
projects will be needed to meet
growing demand
Santos is ideally placed to take
advantage of this opportunity:
─ Existing and new supply projects
─ Integrated infrastructure position
─ Processing third party volumes
─ Supply portfolio
Total East Coast Demand
Market opportunity
Contracted supply
(domestic and LNG)
Leverage our strategic
infrastructure footprint
Linking resources and market through our unique
infrastructure positions
13 |
Aggregate
/ Arbitrage
Process Store
Optimise Cooper Basin storage
(brownfield, greenfield):
─ 70 PJ existing capacity at
Moomba/LDB and
Ballera/Chookoo
─ Multiple greenfield sites scoped
Seasonal buy-sell arbitrage
Third party storage services
Moomba is “open for business”
Increases throughput:
increased revenue and reduced
unit costs
Third party oil business well
established processing
~20,000 bopd
Aggregate third party raw and
sales gas at Moomba
Manage supply volatility through
gas storage and supply portfolio
Realise arbitrage value to strong
Queensland markets
COOPER AND GLNG INVESTOR VISIT - APRIL 2015
0
2
4
6
8
2012 2013 2014
Cooper Oil Strong production combined with well established and
growing third party revenue stream
14 |
Cooper has an established third
party1 oil business
Third party sales have typically
achieved a >10% gross margin
Increased throughput drives
revenue and reduces unit costs
for Santos’ base business
1 Third party is defined as a JV with no parties the same as the SACB JV
Third party oil volumes1
mmbbl
Cooper oil production and EBITDAX margin
STO mmbbl
0%
50%
100%
0
1
2
3
4
2012 2013 2014
Production (lhs) EBITDAX margin (rhs)
Cooper oil production has
remained strong ~3 million bbl
per year
Robust 5 year rolling average 2P
RRR of 67% in a mature basin
Scale-able business, 2015
scaled down – ready for higher
oil prices
Percent
COOPER AND GLNG INVESTOR VISIT - APRIL 2015
15 | COOPER AND GLNG INVESTOR VISIT - APRIL 2015
Cooper Gas Balancing resource conversion, delivering contracted
volumes and future growth potential
Big Lake, Cooper Basin
16 | COOPER AND GLNG INVESTOR VISIT - APRIL 2015
0
1,000
2,000
3,000
4,000
5,000
6,000
7,000
2007 08 09 10 11 12 13 2014
Santos estimated expected recovery1, year end 2007–14
PJ, net Santos
Cumulative
Production
2P reserves
1 Estimated expected recovery is equal to cumulative production plus remaining 2P reserves
2 2C resources (excludes unconventional contingent resources)
Contingent
resources2
17%
36%
Increased expected recovery
by 17% in a mature basin
Conventional 2C bookings
also strong demonstrating
positive long term trend
Constrained exploration and
appraisal drilling resulted in
slowing of conversion
YE14 2P reserves ~15 years
of production
Cooper Basin gas reserves
and resources
Expected recovery increased by 17% since 2007
17 | COOPER AND GLNG INVESTOR VISIT - APRIL 2015
Cooper Basin reserves
and resources
Strong growth in conventional 2P since 2010
Greater Tindilpie downside result and Horizon “gross up”
impacting reserve build
2011 2P Reserves Target
1,000 PJ target predicated on:
─ Early infill pilot results
─ US analogues
─ Ongoing appraisal program
2P reserve additions slowed due
to Greater Tindilpie outcome and
requirement to “gross up”
Horizon contract
Unconventional 2C at 1,721 PJ
excluded from the analysis
867 972
1,224
1,225
0
250
500
750
1,000
1,250
1,500
1,750
2,000
2,250
YE 2010 2P and
2C
Production 2P added 2P revised YE 2014 2P and
2C
Comparing year end 2P reserves and 2C resources, 2010-2014, by area
507 PJ
PJ Net Santos
264 PJ
Net add
of 369
PJ
2C resource excludes unconventional contingent resource
138 PJ
2P 2C
Delivering Horizon
18 |
750
376
0
200
400
600
800
1,000
1,200
Original
Horizon
Volume
Gross up JV
requirement
“Gross up” of Horizon
PJ
1126
Grossing up of Horizon has necessitated a focus on
deliverability
750 for
Horizon
376 for
other JV
partners
Origin and Beach elected not to supply equity
volumes into the Horizon contract
Required a ~50% increase in developed 2P to meet
the contractual commitment (750 to 1126 PJ)
Necessitated capital to be prioritised on development
over reserve build in implementation period
Well capacity build on track to meet Horizon contract
COOPER AND GLNG INVESTOR VISIT - APRIL 2015
Building well capacity Focused effort to increase well capacity from 2012
Recent cuts to forward capex will reduce capacity in the short
term
19 |
Capacity increased by ~15%
2012-14
Recent capex reductions will
result in deferred drilling and
lower capacity (rigs from 7 to 3)
Train 8 capex deferral maintains
2015 Moomba sales capacity at
~375 TJ/d – retain ability to
quickly expand processing to
420 TJ/d
Appraisal drilling continues to
rebuild future well inventory
COOPER AND GLNG INVESTOR VISIT - APRIL 2015
Cooper gas drilling & well capacity1 build
1 Well capacity is gross raw gas capacity including CO2, fuel, flare & vent and in gross terms.
Wells
Capacity
mmscf/d
2010 2011 2012 2013 2014 2015F 2016F
0
100
200
300
400
500
600
0
10
20
30
40
50
60
70
80
90
2010 2011 2012 2013 2014 2015F 2016F
Exploration and appraisal wells
Development wells
Well capacity forecast (rhs)
Current
Exploration and appraisal wells
Development wells
Well capacity forecast (rhs)
Previous
Wells
Well capacity (rhs)
Historic
393
453
20 | COOPER AND GLNG INVESTOR VISIT - APRIL 2015
Cooper infill program Greater Tindilpie disappointed whilst Big Lake
delivered on expectation
 GT prioritised as considered most suitable for large pad drilling to
achieve US-like cost savings
 Cowralli 16 well pad drilled in 2013; delivered on time and under
budget however downside result on expected production and 2P
developed reserves
 Initial production rates <50% AFE at 16 mmscf/d
 Results confirmed GIIP but more challenging to extract
 Large scale development program yielded a more efficient field
development versus historical practice
 32 wells drilled, capacity add of 76 mmscf/d, 100 bcf 2P reserve
developed at a development cost of ~$4GJ
 Development concept of 4-6 well pads with targeted frac placement
 Execution efficiencies quantum step change for Cooper Basin:
 Achieving up to 4 stages per day (up from 2 per day on a
standalone vertical)
 20% lower well costs, comparing a 2010 vs 2015 drill of
normalised scoped well, driven by pad efficiencies
Greater
Tindilpie (GT)
Development
Drilling
Big Lake Infill
Drilling
Drilling at Big Lake
21 | COOPER AND GLNG INVESTOR VISIT - APRIL 2015
Future of the Cooper
Basin
Existing resources are only part of the future –
independent experts highlight multi-tcf conventional
upside potential1
Greater Tindilpie
“Significant GIP resource”
124
171
SA Northern Fields
“Liquids rich”
2P YE
124
SA Core (including Big
Lake/Moomba)
“Legacy field appraisal and
development opportunities”
SWQ
“Greenfield under explored”
2C YE
2014
2010
100
2014
2010
2014
2010
15
80
66
420
2P YE 2C YE
2P YE 2C YE
2014
2010
2014
2010
213 108
149
2P YE 2C YE
2014
2010 450
612 2014
2010
910
524
171
171
1 Assessments of overall Cooper Basin conventional prospective resources conducted independently by Core Energy and USGS
 Core Energy: Eastern Australia Gas Outlook – 2035, November 2014
 USGS: World Conventional Gas Resources
PJ, STO
PJ, STO
PJ, STO
PJ, STO
2014
2010
173
Production
22 | COOPER AND GLNG INVESTOR VISIT - APRIL 2015
Queensland Cooper gas Highly under-explored area with green and brownfield growth
opportunities
Opportunity to explore, appraise and commercialise conventional
resources
Attractive brownfield opportunities for current ~176 bcf 2C STO
plus
Material prospective resources
Windorah-Marama1
 Greenfield project
 Initial phase sanctioned
December 2014
 Expect to produce 15 bcf 2P
STO and commercialise 26 bcf
2C STO
 Significant prospective
resources
Barrolka-Durham Downs2
 Brownfield project
 3D seismic acquired over Coolah,
currently processing
 Appraisal and development
drilling in progress
Future potential3
 Exploration drilling in ATP1189P
 Exploration and appraisal drilling
in the Southern area (Theta
Thoar)
23 |
Unconventional exploration – WORK IN PROGRESS
COOPER AND GLNG INVESTOR VISIT - APRIL 2015
Cooper unconventional
exploration
Moving from testing to enhancing flow rates
Roswell-2 horizontal well
World scale Cooper
unconventional resource
potential
Work program: understanding geology, targeting
sweet spots, testing well designs to lower costs and
increase flow rate
24 |
Pre-discovery Exploration
Exploration
Appraisal
Development
Appraisal
Development
Prove hydrocarbon
volume & content
Confirm resource
potential with flow
to surface
“Crack the Code”
Optimise region,
target &
technology
Defining rate &
reserve variability
over development
area
Execution
~12 months ~2 years ~2 - 3 years >3 years
Decades of
Production
Seismic, studies &
exploration well
Vertical wells,
frac tests
Vertical vs
horizontal wells
Pilot
wells
Multiple
wells
COOPER AND GLNG INVESTOR VISIT - APRIL 2015
Cooper (3 Plays – Tight Gas, Deep Coal, Shale)
 Proven gas accumulation, over 3,000 ft of continuous gas
column
 Four proven unconventional targets with demonstrated gas
flows from all zones
 Large resource potential with booked contingent resources
 Unconventional targets are thick, over-pressured, extensive
and fraccable
Future work program
Cooper Liquids-rich Deep Coal
Progressing via SACBJV add-on coal frac
program and world-class R&D activities
Prospective Resource Contingent Resource Reserve
Amadeus Basin (Mereenie)
Tight gas & hybrid shale play
with existing infrastructure
McArthur Basin
Thick stacked marine
shale with rich liquids
potential
Cooper Basin
Large GIP with 3 Plays,,
Deep Coal with liquids
potential; Tight Gas & Shale
25 |
Three plays successfully tested with program moving
to target sweet spots
Unconventional resources
 Vast opportunity
across 3
unconventional plays
 Systematically
identifying sweet
spots & testing well
designs
 Results encouraging
 3 unconventional
wells on production
(M-191, 193H, 194)
Nappamerri
Trough
Moomba
Big Lake
Patchawarra
Trough
˃ Langmuir-1 flowed at peak rate of 1.5 mmscf/d
˃ Moomba-194 five stage frac achieved peak rate of 3.5 mmscf/d
˃ 3D seismic acquired in Gaschnitz area for sweet spot identification
˃ Further 3 wells drilled in Gaschnitz area accessing stacked BCG tight sands,
shales and deep coal
˃ Moomba-191 flowed at commercial rates >3.0 mmscf/d
˃ Roswell-2H, 5 frac, 1500ft horizontal, flowed stable rate of 0.8 mmscf/d
˃ Moomba-193H, 10 frac, 3000ft horizontal; first horizontal shale producer
connected in the basin; currently flowing at 1.1 mmscf/d
˃ Roswell-1: Deep dry gas coal frac test: single stage flowed ~0.4mmscf/d
˃ 10 deep coal ‘add-on’ frac stages now flow tested across Cooper Basin;
averaging 0.3 mmscf/d with up to 1 mmscf/d achieved. Condensate
observed at 10-70 bbl/mmscf from Patchawarra Trough coals
˃ PEL 570 liquids-rich Deep Coal Play; drilling the first dedicated deep
coal well with ~5 stages planned; and 3D-seismic
˃ Tirrawarra South-1 flowed 0.3 mmscf/d from Deep Coal with condensate at
~40bbls/mmscf; to be connected as first dedicated deep coal
producer in the basin
Multiple
Targets
Shale &
Deep Dry
Gas Coal
Condensate
Rich Deep
Coal
COOPER AND GLNG INVESTOR VISIT - APRIL 2015
26 | COOPER AND GLNG INVESTOR VISIT - APRIL 2015
Unconventional appraisal Unique RQ / CQ characteristics requires innovative and
iterative learning to unlock the resource potential
Region Targets
Reservoir
Quality
Completion
Quality
Comments
Patchawarra
Trough
Deep Coal
› High RQ, “the source-rock” with high gas content and
liquids in some areas
› Add-on coal frac program in SACBJV development wells
is de-risking CQ
› Rates per frac stage encouraging
Nappamerri
Trough
Tight Sand,
Shale, Hybrid
Shale, Deep
Coal
› Multi-lithologies within large gas column provides
multiple opportunities
› Strong overpressure – positive for drive and volumes
› Requires effective fracturing in high stress environment
Moomba Big
Lake
Shale, Hybrid
Shale
› Shale has low RQ (storage) & minor over-pressure
› Requires higher frac effectiveness (CQ) to compensate
The economic success of unconventional resource plays depends upon the interplay between:
Reservoir Quality (RQ) “how good is the rock?”
Completions Quality (CQ) “what can we do to the rock to make it flow?”
3
2
1
Rank
27 | COOPER AND GLNG INVESTOR VISIT - APRIL 2015
Cooper Basin’s
unconventional resources
Patchawarra Trough Deep Coal showing encouraging
results
Encouraging flow results with
high liquids content (10-100
bbl/mmscf)
Step change in flow
performance: 0.4 mmscf/d and
increasing flow rates over time
Potential to add-fracs to future
conventional wells enhancing
base business economics
Highly material prospective
resource
0
200
400
600
800
1,000
1,200
1 2 3 4 5 6 7 8 9 10 11 12 13 14 15 16 17 18 19 20 21 22 23 24
RateperStage(mscf/d)
Projects in chronological order
Improved Frac DesignInitial Frac Design
2013
Increasing flow rates from effective fracture stimulation
East Australia value
remains strong
Gas capacity, production and resource position on track to meet
commitments
Significant cost savings in response to fall in oil price
Value creation through integrated portfolio of
resources and infrastructure
28 |
Cooper
delivery
COOPER AND GLNG INVESTOR VISIT - APRIL 2015
Converting
strategic
potential
Future
reserves
&
resources
Unconv-
entional
gas
Gas demand continues to drive Cooper’s long term potential
Santos has a unique integrated value proposition
Strong record of growing expected recovery with large future
potential
Reserve build and production dictated by forward capex
Cooper infill reserve conversions - positives and negatives
Encouraging results across all 3 play types
Cooper Deep Coal looks highly prospective
GLNG
GLNG Plant, Curtis Island
Trevor Brown, Vice President Queensland
Rod Duke, Vice President Downstream GLNG
Project overview Integrated LNG project on track for first LNG around
the end of the third quarter of 2015, within US$18.5
billion budget
COOPER AND GLNG INVESTOR VISIT - APRIL 201530 |
Project partners
Santos (30% and operator), PETRONAS, Total and
KOGAS
Project scope
Existing and sanctioned gross upstream compression
capacity 725 TJ/day, additional capacity to be sanctioned
Incremental gas supply and infrastructure projects
420 kilometre gas transmission pipeline
2 train LNG plant and associated infrastructure
LNG plant
capacity
7.8 mtpa of LNG; 7.2 mtpa has been sold to PETRONAS
and KOGAS
Gross capital
cost estimate
US$18.5 billion1 from FID to the end of 2015 when the
second train is expected to be ready for start-up
Gross sustaining
capex
~A$900 million average per annum over 2016-20
~A$500 million average per annum post 2020
LNG train
ramp-up
Train 1 first LNG expected around end 3Q 2015;
LNG production expected to ramp-up over 3-6 months
Train 2 expected to be ready for start-up by the end of
2015; LNG production expected to ramp-up over 2-3
years
1 Based on foreign exchange rates which are consistent with the
assumptions used at FID (A$/US$ 0.87 average over 2011-15).
Project progress On track for first LNG around the end of the third quarter of 2015
GLNG provides positive free cash flow at US$40/bbl oil
Fairview Hubs 4 and 5 operational
and produced at above nameplate
capacity
Commissioning well progressed at
Roma Hub 2, incremental
140 TJ/d compression capacity
expected to be sanctioned mid-
2015
420 km gas transmission pipeline
complete and delivering gas to LNG
plant
120 km Comet Ridge to Wallumbilla
pipeline loop complete and
commissioned
COOPER AND GLNG INVESTOR VISIT - APRIL 201531 |
Gas introduced into the LNG plant
and first two gas turbine
generators fired
Train 1 piping and cabling nearing
completion
First LNG tank dried and purged
Loading jetty complete
Plant commissioning on track
First LNG around the end 3Q 2015
Over 9,000 PJ of dedicated
reserves and resources
Fairview wells performing
strongly, expected field capacity
~600 TJ/d by end 2015
Roma wells online and
dewatering in line with
expectations
Santos portfolio & third party gas
provides 410-570 TJ/day in 2016
Underground storage delivery
rate >100 TJ/day
LNG plant
and port
Surface
facilities &
pipelines
Gas supply
Safety performance
Continuous improvement in lost
time injury frequency rate
(LTIFR) since FID
─ 2014 LTIFR of 0.34 per million
hours worked
─ 2015 YTD1 has LTIFR at 0
─ 4.1 million hours worked1 in 2015
100% safety critical maintenance
achieved in 2014 upstream operations
Over 80 million hours worked since FID, including
4 million hours worked in 2015 to date
COOPER AND GLNG INVESTOR VISIT - APRIL 201532 |
1 As at 10 April 2015
0.9
0.8
0.5
0.34
0
0.00
0.25
0.50
0.75
1.00
2011 2012 2013 2014 2015YTD
Annual LTIFR since FID
Celebrating 8 million job safe hours in Batangas module yard
GLNG expenditure
guidance
US$18.5 billion1 capex from FID to the end of 2015
2016-20 average capex estimate A$900 million average per annum
GLNG provides positive free cash flow at US$40/bbl oil
COOPER AND GLNG INVESTOR VISIT - APRIL 201533 |
Capital expenditure estimate
FID to end of
2015
US$18.5 billion1
2016-2020
~A$900 million average per
annum
Post 2020
~A$500 million average per
annum
1 Based on foreign exchange rates which are consistent with the assumptions used at FID (A$/US$
0.87 average over 2011-15).
Vast majority of 2016-20 expenditure is the upstream, and
includes:
─ Drilling and completion of new wells (~200 per annum)
─ Connections of new wells, including wellpads, gas gathering lines, water
pipelines, and power/communications infrastructure
─ Additional compression, water treatment facilities and ponds, trunklines,
transmission lines and roads
─ Capitalised cost of staff working on upstream capex projects and wages
associated with engineering, procurement and construction of upstream
capex projects
─ Exploration and appraisal
─ Domestic gas stay-in-business capex
Includes maintenance capex for the LNG plant and gas
transmission pipeline
Opex average cost estimate
Upstream field
(excludes electricity and carbon)
~A$1.25/GJ
Downstream
(pipeline, plant and port)
~A$150 million per annum
Upstream
Hub 4, Fairview
GLNG upstream delivery
Performance of Fairview wells continues
to exceed expectations
─ Well capacity expected to be ~600 TJ/day by
the end of 2015
Roma well capacity growing in line with
expectations
Fairview Hubs 4 and 5 operational and
produced above nameplate capacity
Construction complete at Roma Hub 2,
with commissioning well advanced,
incremental 140 TJ/d compression
capacity expected to be sanctioned
mid-2015
Pipeline compressor station complete
120 km Comet Ridge to Wallumbilla
pipeline loop complete and commissioned
Upstream is supplying gas to the LNG plant
COOPER AND GLNG INVESTOR VISIT - APRIL 201535 |
Fairview Hub 5
Gas supply
5,603
2,228
1,202
0
2,000
4,000
6,000
8,000
10,000
2014
2C CSG
2P Santos
portfolio &
3rd party
2P CSG
GLNG has an integrated gas supply portfolio of
indigenous gas, Santos portfolio gas, third party
supply and gas storage
GLNG proved reserves grew by 22% and proved
and probable reserves by 4% in 2014, primarily
due to positive re-assessments in the Fairview,
Roma and Scotia fields
GLNG has secured up to 2,228 PJ of Santos
portfolio and third party gas supply agreements
GLNG also has 1,202 PJ of 2C resources
Over 9,000 PJ of dedicated 2P reserves and 2C
resources at the end of 2014
YE 2014 GLNG dedicated 2P and 2C
(GLNG share PJ)
9,033
36 | COOPER AND GLNG INVESTOR VISIT - APRIL 2015
Third party gas supply Third party gas generates significant value for the
project
37 |
Supplier Quantity TJ/day Starts Term Delivery point Price basis
Santos portfolio
‘Horizon’
750 PJ 140 2015 15 years Wallumbilla Oil-linked
Origin 365 PJ 100 2015 10 years Wallumbilla Oil-linked
Origin 194 PJ1 50-1001 2016 5 years Wallumbilla Oil-linked
Other suppliers 85 PJ
10-15
60-100
2015
2016
7 years
21 months
Wallumbilla Oil-linked
Meridian JV 445 PJ2 20-65 2015 20 years GLNG GTP Oil-linked3
Combabula/
Spring Gully
389 PJ4 30 2015 20 years Fairview Oil-linked
1 100 PJ firm volume over 5 years. Origin has the option to supply additional volumes of up to 94 PJ during the same period.
2 Source: WestSide Corporation Target Statement of 16 May 2014. Excludes additional gas production by the Meridian Joint Venture beyond 65 TJ/day. Volumes subject to
Meridian field production performance and implementation of expansion plans.
3 Oil-linked from 2016.
4 Santos share 2P reserves in the APLNG-operated Combabula, Spring Gully and Ramyard fields at the end of 2014.
Secured up to 2,228 PJ
Santos portfolio and third
party supply
Attractive oil-linked gross
margins
Provides operational
flexibility in LNG train ramp-
up and operation
COOPER AND GLNG INVESTOR VISIT - APRIL 2015
Fairview
The Fairview field is located in south-central Queensland, about 100 km north
of Roma
Fairview is a mature field, with over 20 years of production history
GLNG ownership 76.07% (ATP 526P); 100% (ATP 655P)
Land tenure is a mixture of Santos-owned property, privately-owned property,
leasehold and state-owned property
The area is sparsely populated: the nearest town, Injune — about 25 km to
Fairview’s south-west — has a population of around 400
Historically, wells produced to the three Fairview hub compression stations F-
CS-01, F-CS-02 and F-CS-03. Two additional compression stations (F-HCS-04
and F-HCS-05) are now operational in the north and south-eastern part of the
field
Initial development targeted the north and south-eastern part of the field,
with an infill drilling program and the Eastern Flank development sanctioned
post FID
The initial GLNG upstream development is focussed on
the mature Fairview field
38 | COOPER AND GLNG INVESTOR VISIT - APRIL 2015
Fairview tenures
Fairview well performance Performance continues to exceed expectations – gross
field well capacity expected to be ~600 TJ/day by the
end of 2015
Fairview well performance as at March 2015
347 wells connected
Optimum gas
capacity (TJ/day)
Optimum water
capacity (bbl/day)
Current average
water capacity
372 bbl/day
Total well stock
average gas capacity
1.63 TJ/day
Performance of Fairview wells continues
to exceed expectations
Well capacity expected to be ~600
TJ/day by the end of 2015
Excellent gas rates up to
22 TJ/day, with 9 wells with optimum
capacities >10 TJ/day
Current average capacity of 183 wells
connected in May 2014 now 2.38 TJ/d
(increase from 2.2 TJ/d)
High turn-down capacity
134 new wells connected since Oct 2014
and dewatering
Average gas capacity of total connected
well stock 1.63 TJ/d including new wells
in dewatering phase
As new wells dewater, average gas
capacity expected to increase
39 | COOPER AND GLNG INVESTOR VISIT - APRIL 2015
Current average capacity of 183 wells
connected in May 2014 now 2.38 TJ/d
(increase from 2.2 TJ/d)
134 new wells connected since Oct 2014
and dewatering. As new wells dewater,
average gas capacity expected to increase.
Significant gas in place confirmed in Early Permian coals directly
beneath Fairview Field and close to existing infrastructure
─ Net coal up to 50 metres thick in Waddy Brae area
─ Encouraging performance from Early Permian East pilots –
Waddy Brae and Dawson Bend-3 with gas rates >700 mscf/d
achieved
Appraisal of Bandanna coals on flanks of Fairview field
progressing with solid results:
─ Yebna North area on the far Eastern Flank production rates
higher than expected for depth
─ Yebna North-1 test rate 388 mscf/d from coal at 1,180 metres
Significant upside potential exists in the Early
Permian coals and on the flanks of Fairview
Fairview upside potential
Yebna North 1
Bandanna Pilot
Dawson Bend 3
Early Permian Pilot
Waddy Brae
Early Permian
Pilot
COOPER AND GLNG INVESTOR VISIT - APRIL 201540 |
Yebna North 1, production testing
Roma
The Roma field is situated in south-central Queensland,
some 300 km north-west of Brisbane
On trend with APLNG and QCLNG key field development
areas
Covering approximately 3,000 km2, the development area
consists of four ATPs (ATP 336 and ATP 631, 708 and 665),
11 PLs and 2 PLAs
GLNG ownership: 100%, except ATP 631P (81.9%)
Drilling has initially been focussed in the western acreage
All produced gas will be exported from the hub
compressors at Roma Hub 2 (R-HCS-02) via a 3 km, 20”
line connected to a tie-in point to the CRWP pipeline
Santos has a long history operating in the Roma area
Roma tenures
COOPER AND GLNG INVESTOR VISIT - APRIL 201541 |
Roma well performance Online and dewatering, supporting average well
capacity of 0.5 TJ/day
271 development wells
drilled
120 wells online and dewatering
in line with expectations
Average gas capacity growing
month-on-month as wells
progressively connected and
dewatered
8 wells are flowing >0.5 TJ/d,
highest of these 2.1 TJ/d
Strong gas rates from early
producers
Strong water rates from recent
connections
42 | COOPER AND GLNG INVESTOR VISIT - APRIL 2015
Roma well performance as at April 2015
120 wells connected
Optimum gas
capacity (TJ/day)
Optimum water
capacity (bbl/day)
Roma field performance Strong gas and water production performance from
the Hermitage and Pleasant Hills area
COOPER AND GLNG INVESTOR VISIT - APRIL 201543 |
Best results observed in areas already dewatered
by pilot production
Results provide confidence in ongoing gas build
Roma RM02-04-01 (Hermitage area) now over
2 mmscf/d and RM08-06-02 (Pleasant Hills)
>1 mmscf/d
Roma RM02-04-1 well - actual production
Roma RM08-06-2 well - actual production
RM02-04-1
RM08-06-21
Hermitage Area
Pleasant Hills Area
Raslie Area
Roma Phase 1
Gas(mscf/d)Gas(mscf/d)
Water(bwpd)Water(bwpd)
Scotia and Arcadia
Scotia Area
The Scotia area is located about 100 km west of
the Fairview assets. The three Scotia licence
areas include PL 176, ATP 868P and ATP 803P.
PL 176 planned as the first phase. Gas production
can be delivered via the executed APLNG Swap
agreement
Additional targets both within PL 176 and in the
ATPs are in the exploration and appraisal phase
Arcadia
The Arcadia field is situated in south-central Queensland,
approximately 400 km north-west of Brisbane
Encouraging results from Sunnyholt Pilot area with
>1 mmscf/d and continuing to ramp
The gas transmission pipeline to Gladstone runs through
the Arcadia development area with bespoke tie-in point
A phased future development strategy is being
pursued in Scotia and Arcadia
Arcadia tenures
44 | COOPER AND GLNG INVESTOR VISIT - APRIL 2015
Scotia tenures
Sunnyholt pilot
─ Scotia - Deep sands and basement volcanics
─ Arcadia - Early Permian - thick coals up to 75 m intersected
─ Roma - Permian CSG & Conventional Plays
─ Arcadia - flanks & extended Reach
drilling
─ Clematis Creek area
─ ATP 803 and ATP 868
─ Northern Comet Ridge close to KP
128 Tie-In
─ Fairview - Early Permian (east)
─ Fairview Flanks - Bandanna
─ Scotia - Western Flank
─ Scotia - Mid-Baralaba coals
─ Roma - Western flank
─ Fairview - Early Permian (west)
1
2
1
2
1
4
1
4
5
3
Resource growth
opportunities
Numerous Brownfield opportunities, encouraging pilot results close to existing
infrastructure
Greenfield opportunities are benefitting from knowledge of reservoir behaviour
and technology applications in core areas
Several different plays with large GIIP have been identified across the GLNG
portfolio, although significant subsurface uncertainty remains
In addition to the four core GLNG areas numerous
growth opportunities exist across GLNG portfolio
Appraisal Phase (Brownfield)
Exploration Phase
Appraisal Phase (Greenfield)
2
3
3
4
5
3
1
4
2
3
1
2
6
6
3
Fairview Field
Scotia
Field
Arcadia Field
Roma Field
2
COOPER AND GLNG INVESTOR VISIT - APRIL 201545 |
Drilling and completions Multi-well pads continue to drive greater efficiency,
lower costs and a smaller environmental footprint
COOPER AND GLNG INVESTOR VISIT - APRIL 201546 |
Over 600 wells drilled since FID
At peak drilling, ten drilling rig and five completion rigs
were operational in GLNG assets
Current rig fleet of 1 drilling rig and 2 completion rigs
across GLNG fields
Significant reduction in drilling and completion costs per
well since FID
─ Custom designed drilling rigs and factory drilling approach
continues to drive lower well costs
─ Roma drill costs dropped from $427/ft to $233/ft by 2014
─ Fairview drill costs have dropped from $532/ft to $388/ft
Expect to drill ~200 wells average per annum post-2015
0
100
200
300
400
500
600
700
2012 Avg
(29 wells)
2013 Avg
(40 wells)
FV Eastern Flank
(71 wells)
Fairview deviated well drilling cost performance
$ / ft drilled
Upstream infrastructure
COOPER AND GLNG INVESTOR VISIT - APRIL 201547 |
Integrated upstream development with connections
to APLNG and QCLNG
RUGS
>100 TJ/d
Upstream gas processing Hubs are supplying gas to the LNG plant and have
produced above nameplate capacity
COOPER AND GLNG INVESTOR VISIT - APRIL 201548 |
Existing 170 TJ/day existing gross gas
capacity at Fairview and Scotia
Fairview Hub 5
160 TJ/day gross gas capacity
4 ML/day water handling facilities
Operational
Fairview Hub 4
250 TJ/day gross gas capacity
20 ML/day water handling facilities
Operational
Roma Hub 2
145 TJ/day gross gas capacity
10 ML/day water handling facilities
Construction complete and
commissioning well underway
Fairview Hub 4
COOPER AND GLNG INVESTOR VISIT - APRIL 201549 |
Fairview Hub 5 160 TJ/day capacity - Facility operational
COOPER AND GLNG INVESTOR VISIT - APRIL 201550 |
Fairview Hub 4 250 TJ/day capacity - Facility operational
COOPER AND GLNG INVESTOR VISIT - APRIL 201551 |
Roma Hub 2 145 TJ/day capacity - Construction complete and commissioning well
underway
Upstream operations
philosophy
Upstream is controlled from Brisbane operations
centre utilising world class technology to drive down
operating costs and maximise productivity
52 |
Great Situational awareness
Define and develop scope
Right information at the right time
Focus on cost of production
Collaborative Planning
Schedule and Optimise
Right people together using
collaborative technology
Functional Teams
Operation
Centre
Decisive Action
Operate and Execute
Rapid response & turnaround
Field Asset Teams
Brisbane control room Well site
COOPER AND GLNG INVESTOR VISIT - APRIL 2015
Pipeline compressor
station (PCS)
Connection point to the gas
transmission pipeline to
Gladstone
PCS is the collection point for
all of GLNG’s upstream gas
infrastructure, including:
─ Existing hubs (CS1, CS2, CS3)
─ New hubs (FV04, FV05, RM02)
─ CRW Pipeline and Loop
Complete and operational
The pipeline compressor station is complete and
operational
COOPER AND GLNG INVESTOR VISIT - APRIL 201553 |
Pipeline compressor station, Fairview
Roma underground
storage (RUGS)
Gas storage in three depleted
conventional Roma gas fields:
Pleasant Hills, Grafton Range and
Pickanjinnie
15 injection wells on-line
Maximum underground storage
injection and delivery rate
>100 TJ/day
Capacity 70 PJ
Key infrastructure providing
operational flexibility
Opportunity for investment in
additional gas storage capacity
RUGS provides significant gas storage capacity
adjacent to the Wallumbilla gas hub
54 |
RUGS storage fields
COOPER AND GLNG INVESTOR VISIT - APRIL 2015
Incremental gas supply
and infrastructure
projects
In addition to the project scope approved at FID, the
following projects have been sanctioned:
─ Fairview Eastern Flank, Fairview Infill
─ Roma West Phase 2A
─ CRWP Loop
─ Upstream electrification
─ Marine crossing tunnel
─ QGC pipeline interconnects
Optimisation studies ongoing for investment in additional
upstream development and compression capacity
─ Roma Phase 2B: additional 140 TJ/d hub compression capacity
expected to be sanctioned mid-2015
─ Scotia: additional development expected to be sanctioned end-
2015
Incremental infrastructure and field development
projects delivered on or ahead of schedule and on or
under budget
COOPER AND GLNG INVESTOR VISIT - APRIL 201555 |
Saxon Rig 187, Fairview drilling
Landholder and
community engagement
We manage a pastoral/irrigation business on our key sites
co-existing with CSG production:
1,500 Droughtmaster breeding herd on 43,000 hectares
Irrigation with produced water of 1,260 hectare of Chinchilla Whitegums (1.3 million trees)
Forage crops of 234 hectare Laucaena and 450 hectare Buffel grass irrigated with produced
water
Our employees understand how to work with agri-business from their own experience of co-
existence
We respect and proactively engage with landholders
and the local community
COOPER AND GLNG INVESTOR VISIT - APRIL 201556 |
GLNG has 720 agreements in place with 647 landholders
We ensure success by:
Upfront discussions with the landholders to understand
their operations now and in the long term
Monitoring works to minimise disturbance during
construction and working to rectify issues quickly
Dedicated landholder advisers based in the field from the
communities they work with
Downstream
GLNG Plant, Curtis Island
Downstream overview Plant commissioning is well underway
First LNG expected around the end of the third quarter of
2015
Location Curtis Island, Gladstone, Queensland
EPC contractor Bechtel
Technology ConocoPhillips Optimized Cascade Liquefaction
technology and a modular construction scheme
LNG plant
capacity
2 x 3.9mtpa trains (7.8 mtpa)
LNG contracts 7.2 mtpa has been sold to PETRONAS and KOGAS
Scope
Modular train construction: 82 modules for train 1 and
29 for train 2 (111 in total). Modules built at Batangas
in the Philippines and shipped to Curtis Island for
assembly
2 x 140,000 cubic metre LNG storage tanks
360 metre jetty
LNG train
ramp-up
Train 1 first LNG expected around the end of the third
quarter of 2015
LNG production expected to ramp-up over 3-6 months
Train 2 ready for start-up expected by end-2015
LNG production expected to ramp-up over 2-3 years
LNG tanks, February 2015
58 | COOPER AND GLNG INVESTOR VISIT - APRIL 2015
GLNG downstream
LNG Train 1 piping and cabling nearing completion with loop testing well
advanced
LNG Train 2 piping installation and cable pulling underway
Gas introduced to plant in March 2015 and flare lit
First two Train 1 gas turbine generators running
Other Train 1 utilities commissioned and operating
Drying and purging of LNG Tank B complete and underway on Tank A,
following which tanks will be ready to receive LNG
LNG loading jetty complete
107 Santos GLNG staff embedded in integrated Bechtel/GLNG
commissioning and start-up team
QGC interconnects complete with first gas flowed in March 2015
420-kilometre gas transmission pipeline complete and supplying gas to
LNG plant
Expect to deliver first LNG around the end of the third quarter of 2015
Commissioning well underway and expect first
LNG around the end of the third quarter of 2015
COOPER AND GLNG INVESTOR VISIT - APRIL 201559 |
GLNG flare stack, Curtis Island, March 2015
Gas inlet and
refrigerant storage
Utilities area
Includes Central Control
Building
Camp
accommodation
1,680 beds
Flare
100 metres tall
Train 1
3.9 mtpa nameplate capacity
Train 2
3.9 mtpa nameplate capacity
LNG jetty
360m long, 4 loading arms
Two LNG tanks
280,000m3 combined capacity
COOPER AND GLNG INVESTOR VISIT - APRIL 201560 |
February 2015
COOPER AND GLNG INVESTOR VISIT - APRIL 201561 |
Train 1 piping and cabling nearing completion with loop testing well advanced
Train 2 piping installation and cable pulling underway
February 2015
COOPER AND GLNG INVESTOR VISIT - APRIL 201562 |
Drying and purging of LNG Tank B complete and underway on Tank A,
following which tanks will be ready to receive LNG
February 2015
COOPER AND GLNG INVESTOR VISIT - APRIL 201563 |
LNG jetty is complete
February 2015
GLNG plant control room, Curtis Island
Commissioning and
operations
107 Santos GLNG staff
embedded in integrated
Bechtel/GLNG commissioning
and start-up team
Gas has been introduced to
LNG plant
LNG plant commissioning
team includes GLNG operators
and maintenance staff
Experienced GLNG partner
secondees working in key
commissioning and start-up
coordination roles
13 commissioning cargoes
sold
Integrated commissioning and operations team
COOPER AND GLNG INVESTOR VISIT - APRIL 201564 |
GLNG On track for first LNG around the end of the third
quarter of 2015, within US$18.5 billion budget
COOPER AND GLNG INVESTOR VISIT - APRIL 201565 |
Milestone Date
Marine crossing tunnelling completed February2014
Last Train 1 module installed June 2014
First LNG tank hydrotested July 2014
Pipeline commissioning commenced August 2014
Second LNG tank hydrotested September 2014
Last Train 2 module installed November 2014
Pipeline commissioned and gassed-up to Curtis Island November 2014
First commissioning gas to LNG plant March 2015
First LNG Train 1 Around end 3Q 2015
Train 2 ready for start-up End 2015
COOPER AND GLNG INVESTOR VISIT - APRIL 201566 |
APLNG
QCLNG
GLNG
Curtis Island, February 2015
Contact Information
Head Office Adelaide
Ground Floor, Santos Centre
60 Flinders Street
Adelaide, South Australia 5000
GPO Box 2455
Adelaide, South Australia 5001
Telephone: +61 8 8116 5000
Useful email contacts
Share register enquiries:
web.queries@computershare.com.au
Investor enquiries:
investor.relations@santos.com
Website:
www.santos.com
COOPER AND GLNG INVESTOR VISIT - APRIL 201567 |
Saxon Rig 187, CSG Drilling
Andrew Nairn
Group Executive Investor Relations
Direct: + 61 8 8116 5314
Email: andrew.nairn@santos.com
Andrew Hay
Manager Investor Relations
Direct: + 61 8 8116 7722
Email: andrew.hay3@santos.com
Sophie Hansson
Investor Relations Manager
Direct: + 61 8 8116 5671
Email: sophie.hansson@santos.com

More Related Content

What's hot

Approach 2 q14 results presentation final
Approach 2 q14 results presentation finalApproach 2 q14 results presentation final
Approach 2 q14 results presentation finalApproachResources
 
2014.02.24 (final) 4 q & fy13 results presentation
2014.02.24 (final) 4 q & fy13 results presentation2014.02.24 (final) 4 q & fy13 results presentation
2014.02.24 (final) 4 q & fy13 results presentationApproachResources
 
2014.02.24 (final) 4 q & fy13 results presentation
2014.02.24 (final) 4 q & fy13 results presentation2014.02.24 (final) 4 q & fy13 results presentation
2014.02.24 (final) 4 q & fy13 results presentationApproachResources
 
2014 December GSOO Stakeholder Presentation
2014 December GSOO Stakeholder Presentation2014 December GSOO Stakeholder Presentation
2014 December GSOO Stakeholder PresentationJoachim Tan
 
3 q14 results presentation vfinal
3 q14 results presentation vfinal3 q14 results presentation vfinal
3 q14 results presentation vfinalApproachResources
 
Arex 1 q15 results presentation
Arex 1 q15 results presentationArex 1 q15 results presentation
Arex 1 q15 results presentationApproachResources
 
Plg refc presentation 2015 v gb 16 9 aspect final 030115
Plg refc presentation 2015 v gb 16 9 aspect final 030115Plg refc presentation 2015 v gb 16 9 aspect final 030115
Plg refc presentation 2015 v gb 16 9 aspect final 030115PLG Consulting
 
2014 investor seminar asx
2014 investor seminar asx2014 investor seminar asx
2014 investor seminar asxSantos Ltd
 
January 2014 Investor Presentation
January 2014 Investor PresentationJanuary 2014 Investor Presentation
January 2014 Investor PresentationApproachResources
 
2014.05.08 (final) 1 q14 results presentation
2014.05.08 (final) 1 q14 results presentation2014.05.08 (final) 1 q14 results presentation
2014.05.08 (final) 1 q14 results presentationApproachResources
 
Sand ridge energy for h_weil on 3.24.15
Sand ridge energy for h_weil on 3.24.15Sand ridge energy for h_weil on 3.24.15
Sand ridge energy for h_weil on 3.24.15SandRidgeEnergyInc
 
2014.06 rbc 1x1 presentation
2014.06 rbc 1x1 presentation2014.06 rbc 1x1 presentation
2014.06 rbc 1x1 presentationApproachResources
 
Arex 2 q15 results presentation
Arex 2 q15 results presentationArex 2 q15 results presentation
Arex 2 q15 results presentationApproachResources
 
150825 2015 half year results 2 pp-1a82e52f-ff49-4a17-9cc5-e5f333a6d5a5-0
150825 2015 half year results 2 pp-1a82e52f-ff49-4a17-9cc5-e5f333a6d5a5-0150825 2015 half year results 2 pp-1a82e52f-ff49-4a17-9cc5-e5f333a6d5a5-0
150825 2015 half year results 2 pp-1a82e52f-ff49-4a17-9cc5-e5f333a6d5a5-0absmartkarma
 
3 q14 results presentation vfinal (2)
3 q14 results presentation vfinal (2)3 q14 results presentation vfinal (2)
3 q14 results presentation vfinal (2)ApproachResources
 
Liquefied Natural Gas Limited Year-End Financial Report - June 30, 2016
Liquefied Natural Gas Limited Year-End Financial Report - June 30, 2016Liquefied Natural Gas Limited Year-End Financial Report - June 30, 2016
Liquefied Natural Gas Limited Year-End Financial Report - June 30, 2016Marcellus Drilling News
 
Company website presentation february 2015
Company website presentation february 2015Company website presentation february 2015
Company website presentation february 2015AnteroResources
 
Company website presentation (a) february 2015
Company website presentation (a) february 2015Company website presentation (a) february 2015
Company website presentation (a) february 2015AnteroResources
 

What's hot (20)

DUG Permian Basin 2015
DUG Permian Basin 2015DUG Permian Basin 2015
DUG Permian Basin 2015
 
Approach 2 q14 results presentation final
Approach 2 q14 results presentation finalApproach 2 q14 results presentation final
Approach 2 q14 results presentation final
 
2014.02.24 (final) 4 q & fy13 results presentation
2014.02.24 (final) 4 q & fy13 results presentation2014.02.24 (final) 4 q & fy13 results presentation
2014.02.24 (final) 4 q & fy13 results presentation
 
2014.02.24 (final) 4 q & fy13 results presentation
2014.02.24 (final) 4 q & fy13 results presentation2014.02.24 (final) 4 q & fy13 results presentation
2014.02.24 (final) 4 q & fy13 results presentation
 
2014 December GSOO Stakeholder Presentation
2014 December GSOO Stakeholder Presentation2014 December GSOO Stakeholder Presentation
2014 December GSOO Stakeholder Presentation
 
3 q14 results presentation vfinal
3 q14 results presentation vfinal3 q14 results presentation vfinal
3 q14 results presentation vfinal
 
Dej april2015
Dej april2015Dej april2015
Dej april2015
 
Arex 1 q15 results presentation
Arex 1 q15 results presentationArex 1 q15 results presentation
Arex 1 q15 results presentation
 
Plg refc presentation 2015 v gb 16 9 aspect final 030115
Plg refc presentation 2015 v gb 16 9 aspect final 030115Plg refc presentation 2015 v gb 16 9 aspect final 030115
Plg refc presentation 2015 v gb 16 9 aspect final 030115
 
2014 investor seminar asx
2014 investor seminar asx2014 investor seminar asx
2014 investor seminar asx
 
January 2014 Investor Presentation
January 2014 Investor PresentationJanuary 2014 Investor Presentation
January 2014 Investor Presentation
 
2014.05.08 (final) 1 q14 results presentation
2014.05.08 (final) 1 q14 results presentation2014.05.08 (final) 1 q14 results presentation
2014.05.08 (final) 1 q14 results presentation
 
Sand ridge energy for h_weil on 3.24.15
Sand ridge energy for h_weil on 3.24.15Sand ridge energy for h_weil on 3.24.15
Sand ridge energy for h_weil on 3.24.15
 
2014.06 rbc 1x1 presentation
2014.06 rbc 1x1 presentation2014.06 rbc 1x1 presentation
2014.06 rbc 1x1 presentation
 
Arex 2 q15 results presentation
Arex 2 q15 results presentationArex 2 q15 results presentation
Arex 2 q15 results presentation
 
150825 2015 half year results 2 pp-1a82e52f-ff49-4a17-9cc5-e5f333a6d5a5-0
150825 2015 half year results 2 pp-1a82e52f-ff49-4a17-9cc5-e5f333a6d5a5-0150825 2015 half year results 2 pp-1a82e52f-ff49-4a17-9cc5-e5f333a6d5a5-0
150825 2015 half year results 2 pp-1a82e52f-ff49-4a17-9cc5-e5f333a6d5a5-0
 
3 q14 results presentation vfinal (2)
3 q14 results presentation vfinal (2)3 q14 results presentation vfinal (2)
3 q14 results presentation vfinal (2)
 
Liquefied Natural Gas Limited Year-End Financial Report - June 30, 2016
Liquefied Natural Gas Limited Year-End Financial Report - June 30, 2016Liquefied Natural Gas Limited Year-End Financial Report - June 30, 2016
Liquefied Natural Gas Limited Year-End Financial Report - June 30, 2016
 
Company website presentation february 2015
Company website presentation february 2015Company website presentation february 2015
Company website presentation february 2015
 
Company website presentation (a) february 2015
Company website presentation (a) february 2015Company website presentation (a) february 2015
Company website presentation (a) february 2015
 

Similar to Cooper and GLNG Investor Visit

Presentation given at CLSA investors' forum in Hong Kong
Presentation given at CLSA investors' forum in Hong KongPresentation given at CLSA investors' forum in Hong Kong
Presentation given at CLSA investors' forum in Hong KongSantos Ltd
 
Is unconventional oil and gas a sustainable game changer?
Is unconventional oil and gas a sustainable game changer?Is unconventional oil and gas a sustainable game changer?
Is unconventional oil and gas a sustainable game changer?Energy Intelligence
 
Macquarie Australia Conference Presentation
Macquarie Australia Conference PresentationMacquarie Australia Conference Presentation
Macquarie Australia Conference PresentationSantos Ltd
 
Phillips 66 -2015-investor-update-1_q-2015_p66-com
Phillips 66 -2015-investor-update-1_q-2015_p66-comPhillips 66 -2015-investor-update-1_q-2015_p66-com
Phillips 66 -2015-investor-update-1_q-2015_p66-cominvestor_phillips66
 
EnerCom’s The Oil and Gas Conference 21 Presentation
EnerCom’s The Oil and Gas Conference 21 PresentationEnerCom’s The Oil and Gas Conference 21 Presentation
EnerCom’s The Oil and Gas Conference 21 PresentationApproachResources
 
Arex 3 q15 results presentation
Arex 3 q15 results presentationArex 3 q15 results presentation
Arex 3 q15 results presentationApproachResources
 
Antero Resources Company Presentation April 2015
Antero Resources Company Presentation April 2015Antero Resources Company Presentation April 2015
Antero Resources Company Presentation April 2015Marcellus Drilling News
 
Company Overview - April 2015
Company Overview - April 2015Company Overview - April 2015
Company Overview - April 2015AnteroResources
 
Scotia Howard Weil 43rd Annual Energy Conference Presentation
Scotia Howard Weil 43rd Annual Energy Conference PresentationScotia Howard Weil 43rd Annual Energy Conference Presentation
Scotia Howard Weil 43rd Annual Energy Conference PresentationApproachResources
 
Petrobras at Glance
Petrobras at GlancePetrobras at Glance
Petrobras at GlancePetrobras
 
Petrobras at a Glance - 2015
Petrobras at a Glance - 2015Petrobras at a Glance - 2015
Petrobras at a Glance - 2015Petrobras
 
Victory Energy (VYEY) Investor Presentation
Victory Energy (VYEY) Investor PresentationVictory Energy (VYEY) Investor Presentation
Victory Energy (VYEY) Investor PresentationDerek Gradwell
 
Arex 4 q and fy15 results presentation
Arex 4 q and fy15 results presentationArex 4 q and fy15 results presentation
Arex 4 q and fy15 results presentationApproachResources
 
2017 scotia howard weil energy conference final
2017 scotia howard weil energy conference final2017 scotia howard weil energy conference final
2017 scotia howard weil energy conference finalGib Knight
 
EnerCom's The Oil and Gas Conference 19
EnerCom's The Oil and Gas Conference 19EnerCom's The Oil and Gas Conference 19
EnerCom's The Oil and Gas Conference 19ApproachResources
 
Marketing Presentation, July 2014
 Marketing Presentation, July 2014 Marketing Presentation, July 2014
Marketing Presentation, July 2014Lake Shore Gold
 
2014.03 howard weil conference presentation
2014.03 howard weil conference presentation2014.03 howard weil conference presentation
2014.03 howard weil conference presentationApproachResources
 

Similar to Cooper and GLNG Investor Visit (20)

Presentation given at CLSA investors' forum in Hong Kong
Presentation given at CLSA investors' forum in Hong KongPresentation given at CLSA investors' forum in Hong Kong
Presentation given at CLSA investors' forum in Hong Kong
 
Is unconventional oil and gas a sustainable game changer?
Is unconventional oil and gas a sustainable game changer?Is unconventional oil and gas a sustainable game changer?
Is unconventional oil and gas a sustainable game changer?
 
Macquarie Australia Conference Presentation
Macquarie Australia Conference PresentationMacquarie Australia Conference Presentation
Macquarie Australia Conference Presentation
 
2015 credit suisse final
2015 credit suisse final2015 credit suisse final
2015 credit suisse final
 
Phillips 66 -2015-investor-update-1_q-2015_p66-com
Phillips 66 -2015-investor-update-1_q-2015_p66-comPhillips 66 -2015-investor-update-1_q-2015_p66-com
Phillips 66 -2015-investor-update-1_q-2015_p66-com
 
EnerCom’s The Oil and Gas Conference 21 Presentation
EnerCom’s The Oil and Gas Conference 21 PresentationEnerCom’s The Oil and Gas Conference 21 Presentation
EnerCom’s The Oil and Gas Conference 21 Presentation
 
Arex 3 q15 results presentation
Arex 3 q15 results presentationArex 3 q15 results presentation
Arex 3 q15 results presentation
 
Antero Resources Company Presentation April 2015
Antero Resources Company Presentation April 2015Antero Resources Company Presentation April 2015
Antero Resources Company Presentation April 2015
 
Company Overview - April 2015
Company Overview - April 2015Company Overview - April 2015
Company Overview - April 2015
 
Scotia Howard Weil 43rd Annual Energy Conference Presentation
Scotia Howard Weil 43rd Annual Energy Conference PresentationScotia Howard Weil 43rd Annual Energy Conference Presentation
Scotia Howard Weil 43rd Annual Energy Conference Presentation
 
Petrobras at Glance
Petrobras at GlancePetrobras at Glance
Petrobras at Glance
 
Petrobras at a Glance - 2015
Petrobras at a Glance - 2015Petrobras at a Glance - 2015
Petrobras at a Glance - 2015
 
Victory Energy (VYEY) Investor Presentation
Victory Energy (VYEY) Investor PresentationVictory Energy (VYEY) Investor Presentation
Victory Energy (VYEY) Investor Presentation
 
Arex 4 q and fy15 results presentation
Arex 4 q and fy15 results presentationArex 4 q and fy15 results presentation
Arex 4 q and fy15 results presentation
 
2017 scotia howard weil energy conference final
2017 scotia howard weil energy conference final2017 scotia howard weil energy conference final
2017 scotia howard weil energy conference final
 
EnerCom's The Oil and Gas Conference 19
EnerCom's The Oil and Gas Conference 19EnerCom's The Oil and Gas Conference 19
EnerCom's The Oil and Gas Conference 19
 
2014 Enercom Presentation
2014 Enercom Presentation2014 Enercom Presentation
2014 Enercom Presentation
 
Marketing Presentation, July 2014
 Marketing Presentation, July 2014 Marketing Presentation, July 2014
Marketing Presentation, July 2014
 
2014.03 howard weil conference presentation
2014.03 howard weil conference presentation2014.03 howard weil conference presentation
2014.03 howard weil conference presentation
 
Phillips 66 2015 baml-p66.com
Phillips 66   2015 baml-p66.comPhillips 66   2015 baml-p66.com
Phillips 66 2015 baml-p66.com
 

More from Santos Ltd

CEO SEAAOC speech
CEO SEAAOC speechCEO SEAAOC speech
CEO SEAAOC speechSantos Ltd
 
2016 Investor Day ASX Presentation
2016 Investor Day ASX Presentation2016 Investor Day ASX Presentation
2016 Investor Day ASX PresentationSantos Ltd
 
Edith Dornwell Intern
Edith Dornwell InternEdith Dornwell Intern
Edith Dornwell InternSantos Ltd
 
2015 Second Quarter Activities Report
2015 Second Quarter Activities Report2015 Second Quarter Activities Report
2015 Second Quarter Activities ReportSantos Ltd
 
300415 2015 AGM-Addresses
300415 2015 AGM-Addresses300415 2015 AGM-Addresses
300415 2015 AGM-AddressesSantos Ltd
 
Fact Sheet Community Benefits
Fact Sheet Community BenefitsFact Sheet Community Benefits
Fact Sheet Community BenefitsSantos Ltd
 
Fact Sheet Shale Gas
Fact Sheet Shale GasFact Sheet Shale Gas
Fact Sheet Shale GasSantos Ltd
 
Fact Sheet Hydraulic Fracturing
Fact Sheet Hydraulic FracturingFact Sheet Hydraulic Fracturing
Fact Sheet Hydraulic FracturingSantos Ltd
 
Fact Sheet Natural Gas
Fact Sheet Natural GasFact Sheet Natural Gas
Fact Sheet Natural GasSantos Ltd
 
Fact sheet CSG
Fact sheet CSGFact sheet CSG
Fact sheet CSGSantos Ltd
 
Fact sheet - LNG
Fact sheet - LNGFact sheet - LNG
Fact sheet - LNGSantos Ltd
 
230114 Fourth Quarter Activities Report
230114 Fourth Quarter Activities Report230114 Fourth Quarter Activities Report
230114 Fourth Quarter Activities ReportSantos Ltd
 
Worlds longest bike
Worlds longest bikeWorlds longest bike
Worlds longest bikeSantos Ltd
 
2015 Santos Tour Down Under
2015 Santos Tour Down Under2015 Santos Tour Down Under
2015 Santos Tour Down UnderSantos Ltd
 
Santos brings OzHarvest to WA
Santos brings OzHarvest to WASantos brings OzHarvest to WA
Santos brings OzHarvest to WASantos Ltd
 
Pwc report- Oil and gas industry-Sept-2014
Pwc report- Oil and gas industry-Sept-2014Pwc report- Oil and gas industry-Sept-2014
Pwc report- Oil and gas industry-Sept-2014Santos Ltd
 
Yasmin Allen appointed to Santos Board
Yasmin Allen appointed to Santos BoardYasmin Allen appointed to Santos Board
Yasmin Allen appointed to Santos BoardSantos Ltd
 
Santos_Third Quarter Activities Report
Santos_Third Quarter Activities ReportSantos_Third Quarter Activities Report
Santos_Third Quarter Activities ReportSantos Ltd
 
Santos indonesia 2014 (linked in)
Santos indonesia 2014 (linked in)Santos indonesia 2014 (linked in)
Santos indonesia 2014 (linked in)Santos Ltd
 
SantosLtd_Our Graduates
SantosLtd_Our GraduatesSantosLtd_Our Graduates
SantosLtd_Our GraduatesSantos Ltd
 

More from Santos Ltd (20)

CEO SEAAOC speech
CEO SEAAOC speechCEO SEAAOC speech
CEO SEAAOC speech
 
2016 Investor Day ASX Presentation
2016 Investor Day ASX Presentation2016 Investor Day ASX Presentation
2016 Investor Day ASX Presentation
 
Edith Dornwell Intern
Edith Dornwell InternEdith Dornwell Intern
Edith Dornwell Intern
 
2015 Second Quarter Activities Report
2015 Second Quarter Activities Report2015 Second Quarter Activities Report
2015 Second Quarter Activities Report
 
300415 2015 AGM-Addresses
300415 2015 AGM-Addresses300415 2015 AGM-Addresses
300415 2015 AGM-Addresses
 
Fact Sheet Community Benefits
Fact Sheet Community BenefitsFact Sheet Community Benefits
Fact Sheet Community Benefits
 
Fact Sheet Shale Gas
Fact Sheet Shale GasFact Sheet Shale Gas
Fact Sheet Shale Gas
 
Fact Sheet Hydraulic Fracturing
Fact Sheet Hydraulic FracturingFact Sheet Hydraulic Fracturing
Fact Sheet Hydraulic Fracturing
 
Fact Sheet Natural Gas
Fact Sheet Natural GasFact Sheet Natural Gas
Fact Sheet Natural Gas
 
Fact sheet CSG
Fact sheet CSGFact sheet CSG
Fact sheet CSG
 
Fact sheet - LNG
Fact sheet - LNGFact sheet - LNG
Fact sheet - LNG
 
230114 Fourth Quarter Activities Report
230114 Fourth Quarter Activities Report230114 Fourth Quarter Activities Report
230114 Fourth Quarter Activities Report
 
Worlds longest bike
Worlds longest bikeWorlds longest bike
Worlds longest bike
 
2015 Santos Tour Down Under
2015 Santos Tour Down Under2015 Santos Tour Down Under
2015 Santos Tour Down Under
 
Santos brings OzHarvest to WA
Santos brings OzHarvest to WASantos brings OzHarvest to WA
Santos brings OzHarvest to WA
 
Pwc report- Oil and gas industry-Sept-2014
Pwc report- Oil and gas industry-Sept-2014Pwc report- Oil and gas industry-Sept-2014
Pwc report- Oil and gas industry-Sept-2014
 
Yasmin Allen appointed to Santos Board
Yasmin Allen appointed to Santos BoardYasmin Allen appointed to Santos Board
Yasmin Allen appointed to Santos Board
 
Santos_Third Quarter Activities Report
Santos_Third Quarter Activities ReportSantos_Third Quarter Activities Report
Santos_Third Quarter Activities Report
 
Santos indonesia 2014 (linked in)
Santos indonesia 2014 (linked in)Santos indonesia 2014 (linked in)
Santos indonesia 2014 (linked in)
 
SantosLtd_Our Graduates
SantosLtd_Our GraduatesSantosLtd_Our Graduates
SantosLtd_Our Graduates
 

Recently uploaded

High Profile Call Girls Kolkata Gayatri 🤌 8250192130 🚀 Vip Call Girls Kolkata
High Profile Call Girls Kolkata Gayatri 🤌  8250192130 🚀 Vip Call Girls KolkataHigh Profile Call Girls Kolkata Gayatri 🤌  8250192130 🚀 Vip Call Girls Kolkata
High Profile Call Girls Kolkata Gayatri 🤌 8250192130 🚀 Vip Call Girls Kolkataanamikaraghav4
 
OKC Thunder Reveal Game 2 Playoff T Shirts
OKC Thunder Reveal Game 2 Playoff T ShirtsOKC Thunder Reveal Game 2 Playoff T Shirts
OKC Thunder Reveal Game 2 Playoff T Shirtsrahman018755
 
CALL ON ➥8923113531 🔝Call Girls Vineet Khand Lucknow best Night Fun service 🧦
CALL ON ➥8923113531 🔝Call Girls Vineet Khand Lucknow best Night Fun service  🧦CALL ON ➥8923113531 🔝Call Girls Vineet Khand Lucknow best Night Fun service  🧦
CALL ON ➥8923113531 🔝Call Girls Vineet Khand Lucknow best Night Fun service 🧦anilsa9823
 
Malad Escorts, (Pooja 09892124323), Malad Call Girls Service
Malad Escorts, (Pooja 09892124323), Malad Call Girls ServiceMalad Escorts, (Pooja 09892124323), Malad Call Girls Service
Malad Escorts, (Pooja 09892124323), Malad Call Girls ServicePooja Nehwal
 
Russian Call Girls Kolkata Indira 🤌 8250192130 🚀 Vip Call Girls Kolkata
Russian Call Girls Kolkata Indira 🤌  8250192130 🚀 Vip Call Girls KolkataRussian Call Girls Kolkata Indira 🤌  8250192130 🚀 Vip Call Girls Kolkata
Russian Call Girls Kolkata Indira 🤌 8250192130 🚀 Vip Call Girls Kolkataanamikaraghav4
 
VIP 7001035870 Find & Meet Hyderabad Call Girls Shamirpet high-profile Call Girl
VIP 7001035870 Find & Meet Hyderabad Call Girls Shamirpet high-profile Call GirlVIP 7001035870 Find & Meet Hyderabad Call Girls Shamirpet high-profile Call Girl
VIP 7001035870 Find & Meet Hyderabad Call Girls Shamirpet high-profile Call Girladitipandeya
 
Sustainability Leadership, April 26 2024
Sustainability Leadership, April 26 2024Sustainability Leadership, April 26 2024
Sustainability Leadership, April 26 2024TeckResourcesLtd
 
Methanex Investor Presentation (April 2024)
Methanex Investor Presentation (April 2024)Methanex Investor Presentation (April 2024)
Methanex Investor Presentation (April 2024)Methanex Corporation
 
VIP Kolkata Call Girls Bidhannagar 8250192130 Available With Room
VIP Kolkata Call Girls Bidhannagar 8250192130 Available With RoomVIP Kolkata Call Girls Bidhannagar 8250192130 Available With Room
VIP Kolkata Call Girls Bidhannagar 8250192130 Available With Roomrran7532
 
VIP 7001035870 Find & Meet Hyderabad Call Girls Abids high-profile Call Girl
VIP 7001035870 Find & Meet Hyderabad Call Girls Abids high-profile Call GirlVIP 7001035870 Find & Meet Hyderabad Call Girls Abids high-profile Call Girl
VIP 7001035870 Find & Meet Hyderabad Call Girls Abids high-profile Call Girladitipandeya
 
如何办理密苏里大学堪萨斯分校毕业证(文凭)UMKC学位证书
如何办理密苏里大学堪萨斯分校毕业证(文凭)UMKC学位证书如何办理密苏里大学堪萨斯分校毕业证(文凭)UMKC学位证书
如何办理密苏里大学堪萨斯分校毕业证(文凭)UMKC学位证书Fir La
 

Recently uploaded (20)

Preet Vihar (Delhi) 9953330565 Escorts, Call Girls Services
Preet Vihar (Delhi) 9953330565 Escorts, Call Girls ServicesPreet Vihar (Delhi) 9953330565 Escorts, Call Girls Services
Preet Vihar (Delhi) 9953330565 Escorts, Call Girls Services
 
High Profile Call Girls Kolkata Gayatri 🤌 8250192130 🚀 Vip Call Girls Kolkata
High Profile Call Girls Kolkata Gayatri 🤌  8250192130 🚀 Vip Call Girls KolkataHigh Profile Call Girls Kolkata Gayatri 🤌  8250192130 🚀 Vip Call Girls Kolkata
High Profile Call Girls Kolkata Gayatri 🤌 8250192130 🚀 Vip Call Girls Kolkata
 
Call Girls 🫤 Mahipalpur ➡️ 9999965857 ➡️ Delhi 🫦 Russian Escorts FULL ENJOY
Call Girls 🫤 Mahipalpur ➡️ 9999965857  ➡️ Delhi 🫦  Russian Escorts FULL ENJOYCall Girls 🫤 Mahipalpur ➡️ 9999965857  ➡️ Delhi 🫦  Russian Escorts FULL ENJOY
Call Girls 🫤 Mahipalpur ➡️ 9999965857 ➡️ Delhi 🫦 Russian Escorts FULL ENJOY
 
Vip Call Girls Vasant Kunj ➡️ Delhi ➡️ 9999965857 No Advance 24HRS Live
Vip Call Girls Vasant Kunj ➡️ Delhi ➡️ 9999965857 No Advance 24HRS LiveVip Call Girls Vasant Kunj ➡️ Delhi ➡️ 9999965857 No Advance 24HRS Live
Vip Call Girls Vasant Kunj ➡️ Delhi ➡️ 9999965857 No Advance 24HRS Live
 
OKC Thunder Reveal Game 2 Playoff T Shirts
OKC Thunder Reveal Game 2 Playoff T ShirtsOKC Thunder Reveal Game 2 Playoff T Shirts
OKC Thunder Reveal Game 2 Playoff T Shirts
 
CALL ON ➥8923113531 🔝Call Girls Vineet Khand Lucknow best Night Fun service 🧦
CALL ON ➥8923113531 🔝Call Girls Vineet Khand Lucknow best Night Fun service  🧦CALL ON ➥8923113531 🔝Call Girls Vineet Khand Lucknow best Night Fun service  🧦
CALL ON ➥8923113531 🔝Call Girls Vineet Khand Lucknow best Night Fun service 🧦
 
@9999965857 🫦 Sexy Desi Call Girls Vaishali 💓 High Profile Escorts Delhi 🫶
@9999965857 🫦 Sexy Desi Call Girls Vaishali 💓 High Profile Escorts Delhi 🫶@9999965857 🫦 Sexy Desi Call Girls Vaishali 💓 High Profile Escorts Delhi 🫶
@9999965857 🫦 Sexy Desi Call Girls Vaishali 💓 High Profile Escorts Delhi 🫶
 
Model Call Girl in Udyog Vihar Delhi reach out to us at 🔝9953056974🔝
Model Call Girl in Udyog Vihar Delhi reach out to us at 🔝9953056974🔝Model Call Girl in Udyog Vihar Delhi reach out to us at 🔝9953056974🔝
Model Call Girl in Udyog Vihar Delhi reach out to us at 🔝9953056974🔝
 
Malad Escorts, (Pooja 09892124323), Malad Call Girls Service
Malad Escorts, (Pooja 09892124323), Malad Call Girls ServiceMalad Escorts, (Pooja 09892124323), Malad Call Girls Service
Malad Escorts, (Pooja 09892124323), Malad Call Girls Service
 
Russian Call Girls Kolkata Indira 🤌 8250192130 🚀 Vip Call Girls Kolkata
Russian Call Girls Kolkata Indira 🤌  8250192130 🚀 Vip Call Girls KolkataRussian Call Girls Kolkata Indira 🤌  8250192130 🚀 Vip Call Girls Kolkata
Russian Call Girls Kolkata Indira 🤌 8250192130 🚀 Vip Call Girls Kolkata
 
Escort Service Call Girls In Shalimar Bagh, 99530°56974 Delhi NCR
Escort Service Call Girls In Shalimar Bagh, 99530°56974 Delhi NCREscort Service Call Girls In Shalimar Bagh, 99530°56974 Delhi NCR
Escort Service Call Girls In Shalimar Bagh, 99530°56974 Delhi NCR
 
VIP 7001035870 Find & Meet Hyderabad Call Girls Shamirpet high-profile Call Girl
VIP 7001035870 Find & Meet Hyderabad Call Girls Shamirpet high-profile Call GirlVIP 7001035870 Find & Meet Hyderabad Call Girls Shamirpet high-profile Call Girl
VIP 7001035870 Find & Meet Hyderabad Call Girls Shamirpet high-profile Call Girl
 
Sustainability Leadership, April 26 2024
Sustainability Leadership, April 26 2024Sustainability Leadership, April 26 2024
Sustainability Leadership, April 26 2024
 
Methanex Investor Presentation (April 2024)
Methanex Investor Presentation (April 2024)Methanex Investor Presentation (April 2024)
Methanex Investor Presentation (April 2024)
 
Call Girls 🫤 Hauz Khas ➡️ 9999965857 ➡️ Delhi 🫦 Russian Escorts FULL ENJOY
Call Girls 🫤 Hauz Khas ➡️ 9999965857  ➡️ Delhi 🫦  Russian Escorts FULL ENJOYCall Girls 🫤 Hauz Khas ➡️ 9999965857  ➡️ Delhi 🫦  Russian Escorts FULL ENJOY
Call Girls 🫤 Hauz Khas ➡️ 9999965857 ➡️ Delhi 🫦 Russian Escorts FULL ENJOY
 
VIP Kolkata Call Girls Bidhannagar 8250192130 Available With Room
VIP Kolkata Call Girls Bidhannagar 8250192130 Available With RoomVIP Kolkata Call Girls Bidhannagar 8250192130 Available With Room
VIP Kolkata Call Girls Bidhannagar 8250192130 Available With Room
 
VIP 7001035870 Find & Meet Hyderabad Call Girls Abids high-profile Call Girl
VIP 7001035870 Find & Meet Hyderabad Call Girls Abids high-profile Call GirlVIP 7001035870 Find & Meet Hyderabad Call Girls Abids high-profile Call Girl
VIP 7001035870 Find & Meet Hyderabad Call Girls Abids high-profile Call Girl
 
Call Girls Service Green Park @9999965857 Delhi 🫦 No Advance VVIP 🍎 SERVICE
Call Girls Service Green Park @9999965857 Delhi 🫦 No Advance  VVIP 🍎 SERVICECall Girls Service Green Park @9999965857 Delhi 🫦 No Advance  VVIP 🍎 SERVICE
Call Girls Service Green Park @9999965857 Delhi 🫦 No Advance VVIP 🍎 SERVICE
 
如何办理密苏里大学堪萨斯分校毕业证(文凭)UMKC学位证书
如何办理密苏里大学堪萨斯分校毕业证(文凭)UMKC学位证书如何办理密苏里大学堪萨斯分校毕业证(文凭)UMKC学位证书
如何办理密苏里大学堪萨斯分校毕业证(文凭)UMKC学位证书
 
Call Girls In South Delhi 📱 9999965857 🤩 Delhi 🫦 HOT AND SEXY VVIP 🍎 SERVICE
Call Girls In South Delhi 📱  9999965857  🤩 Delhi 🫦 HOT AND SEXY VVIP 🍎 SERVICECall Girls In South Delhi 📱  9999965857  🤩 Delhi 🫦 HOT AND SEXY VVIP 🍎 SERVICE
Call Girls In South Delhi 📱 9999965857 🤩 Delhi 🫦 HOT AND SEXY VVIP 🍎 SERVICE
 

Cooper and GLNG Investor Visit

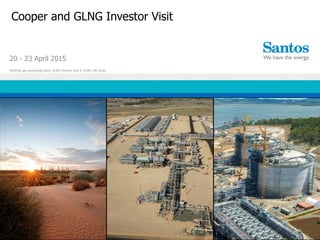
  • 1. Cooper and GLNG Investor Visit 20 - 23 April 2015 Moomba gas processing plant, GLNG Fairview Hub 4, GLNG LNG tanks
  • 2. Disclaimer and important notice COOPER AND GLNG INVESTOR VISIT - APRIL 20152 | This presentation contains forward looking statements that are subject to risk factors associated with the oil and gas industry. It is believed that the expectations reflected in these statements are reasonable, but they may be affected by a range of variables which could cause actual results or trends to differ materially, including but not limited to: price fluctuations, actual demand, currency fluctuations, geotechnical factors, drilling and production results, gas commercialisation, development progress, operating results, engineering estimates, reserve estimates, loss of market, industry competition, environmental risks, physical risks, legislative, fiscal and regulatory developments, economic and financial markets conditions in various countries, approvals and cost estimates. All references to dollars, cents or $ in this document are to Australian currency, unless otherwise stated. All references to project completion percentages are on a value of work done basis, unless otherwise stated. EBITDAX (earnings before interest, tax, depreciation, depletion, exploration, evaluation and impairment), EBIT (earnings before interest and tax) and underlying profit are non-IFRS measures that are presented to provide an understanding of the performance of Santos’ operations. Underlying profit excludes the impacts of asset acquisitions, disposals and impairments, as well as items that are subject to significant variability from one period to the next, including the effects of fair value adjustments and fluctuations in exchange rates. The non-IFRS financial information is unaudited however the numbers have been extracted from the audited financial statements. This presentation refers to estimates of petroleum reserves and contingent resources contained in Santos’ Annual Reserves Statement released to the ASX on 20 February 2015 (Annual Reserves Statement). Santos confirms that it is not aware of any new information or data that materially affects the information included in the Annual Reserves Statement and that all the material assumptions and technical parameters underpinning the estimates in the Annual Reserves Statement continue to apply and have not materially changed. The 2P reserve and 2C contingent resource estimates on slides 18 and 21 are based on, and fairly represent, information and supporting documentation prepared by, or under the supervision of, Marie-louise Lees, Anthony Western and Wade Bard who are full time employees of Santos Limited and members of the Society of Petroleum Engineers. The estimates of petroleum reserves and contingent resources contained in this presentation are as at 31 December 2014. Santos prepares its petroleum reserves and contingent resources estimates in accordance with the Petroleum Resources Management System (PRMS) sponsored by the Society of Petroleum Engineers (SPE). Unless otherwise stated, all references to petroleum reserves and contingent resources quantities in this presentation are Santos’ net share. Reference points for Santos’ petroleum reserves and contingent resources and production are defined points within Santos’ operations where normal exploration and production business ceases, and quantities of produced product are measured under defined conditions prior to custody transfer. Fuel, flare and vent consumed to the reference points are excluded. Petroleum reserves and contingent resources are aggregated by arithmetic summation by category and as a result, proved reserves may be a very conservative estimate due to the portfolio effects of arithmetic summation. Petroleum reserves and contingent resources are typically prepared by deterministic methods with support from probabilistic methods. Petroleum reserves replacement ratio is the ratio of the change in petroleum reserves (excluding production) divided by production. Conversion factors: 1PJ of sales gas and ethane equals 171,937 boe; 1 tonne of LPG equals 8.458 boe; 1 barrel of condensate equals 0.935 boe; 1 barrel of crude oil equals 1 boe.
  • 3. Santos’ Eastern Australia Operations Leveraging the past to create value for the future James Baulderstone Vice President Eastern Australia Moomba processing plant, Cooper Basin
  • 4. East Australia value remains strong Gas capacity, production and resource position on track to meet commitments Significant cost savings in response to fall in oil price Value creation through integrated portfolio of resources and infrastructure 4 | Cooper delivery COOPER AND GLNG INVESTOR VISIT - APRIL 2015 Converting strategic potential Future reserves & resources Unconv- entional gas Gas demand continues to drive Cooper’s long term potential Santos has a unique integrated value proposition Strong record of growing expected recovery with large future potential Reserve build and production dictated by forward capex Cooper infill reserve conversions - positives and negatives Encouraging results across all 3 play types Cooper Deep Coal looks highly prospective
  • 5. 5 | COOPER AND GLNG INVESTOR VISIT - APRIL 2015 Safety performance Strong emphasis on Process Safety and Work Health Safety Process Safety ─ Proactive safety critical maintenance embedded ─ Plant and Pipeline Integrity Programs (8,000km pipe network) Contractor Management ─ Robust systems and processes to drive contractor performance ─ Driving improved safety culture and safety leadership Personnel Safety ─ Cooper Basin 4 months LTI free ─ Driving behaviour including in-vehicle monitoring ─ Working in the heat ─ Drilling safety focus on dropped objects, automated equipment, well control and competency and leadership Contractor CEO Safety Forum
  • 6. Cooper Basin 6 | Key themes continue to drive forward outlook COOPER AND GLNG INVESTOR VISIT - APRIL 2015 Sustainability of East Coast business in challenging market conditions Transformational increase in natural gas demand Infrastructure positions business to deliver long term value Moomba Plant, Cooper Basin
  • 7. Cooper Gas Performance 7 | Improved key metrics Gas well head capacity Q-Q production Reserves and resources EBITDAX margin Cost Control  Increased well head capacity by 15% YE 2012 to YE 2014 (from 393 to 453 mmscf/d) 15%  Grown Q1 to Q1 gas production for the last two years (from Q113 13.7 PJ, Q114 14.4 PJ, Q115 14.8 PJ) 8%  Cooper expected recovery increased by 17% since 2007 (36% when contingent conventional resource bookings included) 17%  Strong EBITDAX margin of greater than 55% for past three years >55%  16% reduction in forecasted year end well costs versus 2014  COOPER AND GLNG INVESTOR VISIT - APRIL 2015 16%    
  • 8. Cooper meeting the cost challenge 8 | Reducing costs - critical response to challenging market conditions Cost savings delivered across all areas…  25% reduction in overall 2015 Cooper Basin capital spend vs 2014  Work program reductions and efficiency initiatives resulted in 20% workforce reduction  35% reduction in Moomba accommodation levels since December 2014 (1250 to <800)  16% reduction in forecasted year end well costs versus 2014  25% reduction in drilling rig day rates  20-40% reduction in well evaluation costs  $450k/well savings on frac and completions …continuing to drive lower 0 1,000 2,000 3,000 4,000 5,000 6,000 7,000 8,000 2014 Actual 2015 Budget End 2015 Forecast Drill Frac Complete Decreasing well costs1 AUD ‘000 1 Well costs for a standard single vertical well with 5 fracture stages COOPER AND GLNG INVESTOR VISIT - APRIL 2015
  • 9. 2H 2014: 32 wells drilled, 24 wells fractured (203 stages), 23 wells brought online, monthly performance above or tracking forecast 1Q 2015: 2 pads exceeded expectations, further 2 pads on track to deliver AFE expectations Cooper infill – Big Lake 9 | Big Lake demonstrating sound development metrics Excellent execution efficiencies and solid reservoir performance 0 1 2 3 4 5 6 7 Wells by pad Pad B Pad F Pad C Pad H Pad J Pad I Single Pad G Big Lake Infill Programme: Well Head first 30 day average rates mmscf/d Wells drilled Capital 2P developed Capacity add Development cost Big Lake Overview 32 $270-275 million 100 bcf ~76 mmscf/d ~$4 GJ COOPER AND GLNG INVESTOR VISIT - APRIL 2015
  • 10. 10 | COOPER AND GLNG INVESTOR VISIT - APRIL 2015 Strategy and market opportunity Converting strategic potential into value
  • 11. COOPER AND GLNG INVESTOR VISIT - APRIL 2015 Eastern Australia gas market portfolio Positioned to capitalise on the changing market dynamics with Cooper playing a central role Gas prices likely to remain robust at >A$8/GJ Transformation of gas market re-rates Santos’ portfolio: ─ New sources of gas required pre-2020 to meet demand ─ Uncontracted gas reserves more valuable (Cooper, Kipper) ─ Opportunity to unlock Cooper Basin large undeveloped gas resources ─ Evaluation of new supply, Narrabri Gas Project, offshore Vic supply (Sole, VIC/P44) - 500 1,000 1,500 2,000 2,500 2014 2016 2018 2020 2022 2024 APLNG GLNG QCLNG PowerGen Retail, C&I Tripling of Eastern Australia Gas Demand (PJ) Domestic Customers Resources Trading Capability Pipeline Capacity Storage Facilities LNG Production Facilities 2015 Transition year 11 | Scale of demand presents opportunities for Cooper asset Moomba is open for business, 3rd Party processing Increasing ability to trade and transport gas Gas storage in Cooper (70 PJ existing plus greenfield opportunities) Changing market dynamics Santos’ integrated value proposition
  • 12. 0 500 1,000 1,500 2,000 2,500 2014 2018 2022 2026 2030 Market opportunity Significant opportunity to supply uncontracted demand 12 | SOURCE: CORE ENERGY GROUP 2014, EASTERN AUSTRALIA GAS OUTLOOK 2035 COOPER AND GLNG INVESTOR VISIT - APRIL 2015 Eastern Australia contracted supply and demand PJ Current contracted supply is insufficient to meet forecast demand Uncontracted and new supply projects will be needed to meet growing demand Santos is ideally placed to take advantage of this opportunity: ─ Existing and new supply projects ─ Integrated infrastructure position ─ Processing third party volumes ─ Supply portfolio Total East Coast Demand Market opportunity Contracted supply (domestic and LNG)
  • 13. Leverage our strategic infrastructure footprint Linking resources and market through our unique infrastructure positions 13 | Aggregate / Arbitrage Process Store Optimise Cooper Basin storage (brownfield, greenfield): ─ 70 PJ existing capacity at Moomba/LDB and Ballera/Chookoo ─ Multiple greenfield sites scoped Seasonal buy-sell arbitrage Third party storage services Moomba is “open for business” Increases throughput: increased revenue and reduced unit costs Third party oil business well established processing ~20,000 bopd Aggregate third party raw and sales gas at Moomba Manage supply volatility through gas storage and supply portfolio Realise arbitrage value to strong Queensland markets COOPER AND GLNG INVESTOR VISIT - APRIL 2015
  • 14. 0 2 4 6 8 2012 2013 2014 Cooper Oil Strong production combined with well established and growing third party revenue stream 14 | Cooper has an established third party1 oil business Third party sales have typically achieved a >10% gross margin Increased throughput drives revenue and reduces unit costs for Santos’ base business 1 Third party is defined as a JV with no parties the same as the SACB JV Third party oil volumes1 mmbbl Cooper oil production and EBITDAX margin STO mmbbl 0% 50% 100% 0 1 2 3 4 2012 2013 2014 Production (lhs) EBITDAX margin (rhs) Cooper oil production has remained strong ~3 million bbl per year Robust 5 year rolling average 2P RRR of 67% in a mature basin Scale-able business, 2015 scaled down – ready for higher oil prices Percent COOPER AND GLNG INVESTOR VISIT - APRIL 2015
  • 15. 15 | COOPER AND GLNG INVESTOR VISIT - APRIL 2015 Cooper Gas Balancing resource conversion, delivering contracted volumes and future growth potential Big Lake, Cooper Basin
  • 16. 16 | COOPER AND GLNG INVESTOR VISIT - APRIL 2015 0 1,000 2,000 3,000 4,000 5,000 6,000 7,000 2007 08 09 10 11 12 13 2014 Santos estimated expected recovery1, year end 2007–14 PJ, net Santos Cumulative Production 2P reserves 1 Estimated expected recovery is equal to cumulative production plus remaining 2P reserves 2 2C resources (excludes unconventional contingent resources) Contingent resources2 17% 36% Increased expected recovery by 17% in a mature basin Conventional 2C bookings also strong demonstrating positive long term trend Constrained exploration and appraisal drilling resulted in slowing of conversion YE14 2P reserves ~15 years of production Cooper Basin gas reserves and resources Expected recovery increased by 17% since 2007
  • 17. 17 | COOPER AND GLNG INVESTOR VISIT - APRIL 2015 Cooper Basin reserves and resources Strong growth in conventional 2P since 2010 Greater Tindilpie downside result and Horizon “gross up” impacting reserve build 2011 2P Reserves Target 1,000 PJ target predicated on: ─ Early infill pilot results ─ US analogues ─ Ongoing appraisal program 2P reserve additions slowed due to Greater Tindilpie outcome and requirement to “gross up” Horizon contract Unconventional 2C at 1,721 PJ excluded from the analysis 867 972 1,224 1,225 0 250 500 750 1,000 1,250 1,500 1,750 2,000 2,250 YE 2010 2P and 2C Production 2P added 2P revised YE 2014 2P and 2C Comparing year end 2P reserves and 2C resources, 2010-2014, by area 507 PJ PJ Net Santos 264 PJ Net add of 369 PJ 2C resource excludes unconventional contingent resource 138 PJ 2P 2C
  • 18. Delivering Horizon 18 | 750 376 0 200 400 600 800 1,000 1,200 Original Horizon Volume Gross up JV requirement “Gross up” of Horizon PJ 1126 Grossing up of Horizon has necessitated a focus on deliverability 750 for Horizon 376 for other JV partners Origin and Beach elected not to supply equity volumes into the Horizon contract Required a ~50% increase in developed 2P to meet the contractual commitment (750 to 1126 PJ) Necessitated capital to be prioritised on development over reserve build in implementation period Well capacity build on track to meet Horizon contract COOPER AND GLNG INVESTOR VISIT - APRIL 2015
  • 19. Building well capacity Focused effort to increase well capacity from 2012 Recent cuts to forward capex will reduce capacity in the short term 19 | Capacity increased by ~15% 2012-14 Recent capex reductions will result in deferred drilling and lower capacity (rigs from 7 to 3) Train 8 capex deferral maintains 2015 Moomba sales capacity at ~375 TJ/d – retain ability to quickly expand processing to 420 TJ/d Appraisal drilling continues to rebuild future well inventory COOPER AND GLNG INVESTOR VISIT - APRIL 2015 Cooper gas drilling & well capacity1 build 1 Well capacity is gross raw gas capacity including CO2, fuel, flare & vent and in gross terms. Wells Capacity mmscf/d 2010 2011 2012 2013 2014 2015F 2016F 0 100 200 300 400 500 600 0 10 20 30 40 50 60 70 80 90 2010 2011 2012 2013 2014 2015F 2016F Exploration and appraisal wells Development wells Well capacity forecast (rhs) Current Exploration and appraisal wells Development wells Well capacity forecast (rhs) Previous Wells Well capacity (rhs) Historic 393 453
  • 20. 20 | COOPER AND GLNG INVESTOR VISIT - APRIL 2015 Cooper infill program Greater Tindilpie disappointed whilst Big Lake delivered on expectation  GT prioritised as considered most suitable for large pad drilling to achieve US-like cost savings  Cowralli 16 well pad drilled in 2013; delivered on time and under budget however downside result on expected production and 2P developed reserves  Initial production rates <50% AFE at 16 mmscf/d  Results confirmed GIIP but more challenging to extract  Large scale development program yielded a more efficient field development versus historical practice  32 wells drilled, capacity add of 76 mmscf/d, 100 bcf 2P reserve developed at a development cost of ~$4GJ  Development concept of 4-6 well pads with targeted frac placement  Execution efficiencies quantum step change for Cooper Basin:  Achieving up to 4 stages per day (up from 2 per day on a standalone vertical)  20% lower well costs, comparing a 2010 vs 2015 drill of normalised scoped well, driven by pad efficiencies Greater Tindilpie (GT) Development Drilling Big Lake Infill Drilling Drilling at Big Lake
  • 21. 21 | COOPER AND GLNG INVESTOR VISIT - APRIL 2015 Future of the Cooper Basin Existing resources are only part of the future – independent experts highlight multi-tcf conventional upside potential1 Greater Tindilpie “Significant GIP resource” 124 171 SA Northern Fields “Liquids rich” 2P YE 124 SA Core (including Big Lake/Moomba) “Legacy field appraisal and development opportunities” SWQ “Greenfield under explored” 2C YE 2014 2010 100 2014 2010 2014 2010 15 80 66 420 2P YE 2C YE 2P YE 2C YE 2014 2010 2014 2010 213 108 149 2P YE 2C YE 2014 2010 450 612 2014 2010 910 524 171 171 1 Assessments of overall Cooper Basin conventional prospective resources conducted independently by Core Energy and USGS  Core Energy: Eastern Australia Gas Outlook – 2035, November 2014  USGS: World Conventional Gas Resources PJ, STO PJ, STO PJ, STO PJ, STO 2014 2010 173 Production
  • 22. 22 | COOPER AND GLNG INVESTOR VISIT - APRIL 2015 Queensland Cooper gas Highly under-explored area with green and brownfield growth opportunities Opportunity to explore, appraise and commercialise conventional resources Attractive brownfield opportunities for current ~176 bcf 2C STO plus Material prospective resources Windorah-Marama1  Greenfield project  Initial phase sanctioned December 2014  Expect to produce 15 bcf 2P STO and commercialise 26 bcf 2C STO  Significant prospective resources Barrolka-Durham Downs2  Brownfield project  3D seismic acquired over Coolah, currently processing  Appraisal and development drilling in progress Future potential3  Exploration drilling in ATP1189P  Exploration and appraisal drilling in the Southern area (Theta Thoar)
  • 23. 23 | Unconventional exploration – WORK IN PROGRESS COOPER AND GLNG INVESTOR VISIT - APRIL 2015 Cooper unconventional exploration Moving from testing to enhancing flow rates Roswell-2 horizontal well
  • 24. World scale Cooper unconventional resource potential Work program: understanding geology, targeting sweet spots, testing well designs to lower costs and increase flow rate 24 | Pre-discovery Exploration Exploration Appraisal Development Appraisal Development Prove hydrocarbon volume & content Confirm resource potential with flow to surface “Crack the Code” Optimise region, target & technology Defining rate & reserve variability over development area Execution ~12 months ~2 years ~2 - 3 years >3 years Decades of Production Seismic, studies & exploration well Vertical wells, frac tests Vertical vs horizontal wells Pilot wells Multiple wells COOPER AND GLNG INVESTOR VISIT - APRIL 2015 Cooper (3 Plays – Tight Gas, Deep Coal, Shale)  Proven gas accumulation, over 3,000 ft of continuous gas column  Four proven unconventional targets with demonstrated gas flows from all zones  Large resource potential with booked contingent resources  Unconventional targets are thick, over-pressured, extensive and fraccable Future work program Cooper Liquids-rich Deep Coal Progressing via SACBJV add-on coal frac program and world-class R&D activities Prospective Resource Contingent Resource Reserve Amadeus Basin (Mereenie) Tight gas & hybrid shale play with existing infrastructure McArthur Basin Thick stacked marine shale with rich liquids potential Cooper Basin Large GIP with 3 Plays,, Deep Coal with liquids potential; Tight Gas & Shale
  • 25. 25 | Three plays successfully tested with program moving to target sweet spots Unconventional resources  Vast opportunity across 3 unconventional plays  Systematically identifying sweet spots & testing well designs  Results encouraging  3 unconventional wells on production (M-191, 193H, 194) Nappamerri Trough Moomba Big Lake Patchawarra Trough ˃ Langmuir-1 flowed at peak rate of 1.5 mmscf/d ˃ Moomba-194 five stage frac achieved peak rate of 3.5 mmscf/d ˃ 3D seismic acquired in Gaschnitz area for sweet spot identification ˃ Further 3 wells drilled in Gaschnitz area accessing stacked BCG tight sands, shales and deep coal ˃ Moomba-191 flowed at commercial rates >3.0 mmscf/d ˃ Roswell-2H, 5 frac, 1500ft horizontal, flowed stable rate of 0.8 mmscf/d ˃ Moomba-193H, 10 frac, 3000ft horizontal; first horizontal shale producer connected in the basin; currently flowing at 1.1 mmscf/d ˃ Roswell-1: Deep dry gas coal frac test: single stage flowed ~0.4mmscf/d ˃ 10 deep coal ‘add-on’ frac stages now flow tested across Cooper Basin; averaging 0.3 mmscf/d with up to 1 mmscf/d achieved. Condensate observed at 10-70 bbl/mmscf from Patchawarra Trough coals ˃ PEL 570 liquids-rich Deep Coal Play; drilling the first dedicated deep coal well with ~5 stages planned; and 3D-seismic ˃ Tirrawarra South-1 flowed 0.3 mmscf/d from Deep Coal with condensate at ~40bbls/mmscf; to be connected as first dedicated deep coal producer in the basin Multiple Targets Shale & Deep Dry Gas Coal Condensate Rich Deep Coal COOPER AND GLNG INVESTOR VISIT - APRIL 2015
  • 26. 26 | COOPER AND GLNG INVESTOR VISIT - APRIL 2015 Unconventional appraisal Unique RQ / CQ characteristics requires innovative and iterative learning to unlock the resource potential Region Targets Reservoir Quality Completion Quality Comments Patchawarra Trough Deep Coal › High RQ, “the source-rock” with high gas content and liquids in some areas › Add-on coal frac program in SACBJV development wells is de-risking CQ › Rates per frac stage encouraging Nappamerri Trough Tight Sand, Shale, Hybrid Shale, Deep Coal › Multi-lithologies within large gas column provides multiple opportunities › Strong overpressure – positive for drive and volumes › Requires effective fracturing in high stress environment Moomba Big Lake Shale, Hybrid Shale › Shale has low RQ (storage) & minor over-pressure › Requires higher frac effectiveness (CQ) to compensate The economic success of unconventional resource plays depends upon the interplay between: Reservoir Quality (RQ) “how good is the rock?” Completions Quality (CQ) “what can we do to the rock to make it flow?” 3 2 1 Rank
  • 27. 27 | COOPER AND GLNG INVESTOR VISIT - APRIL 2015 Cooper Basin’s unconventional resources Patchawarra Trough Deep Coal showing encouraging results Encouraging flow results with high liquids content (10-100 bbl/mmscf) Step change in flow performance: 0.4 mmscf/d and increasing flow rates over time Potential to add-fracs to future conventional wells enhancing base business economics Highly material prospective resource 0 200 400 600 800 1,000 1,200 1 2 3 4 5 6 7 8 9 10 11 12 13 14 15 16 17 18 19 20 21 22 23 24 RateperStage(mscf/d) Projects in chronological order Improved Frac DesignInitial Frac Design 2013 Increasing flow rates from effective fracture stimulation
  • 28. East Australia value remains strong Gas capacity, production and resource position on track to meet commitments Significant cost savings in response to fall in oil price Value creation through integrated portfolio of resources and infrastructure 28 | Cooper delivery COOPER AND GLNG INVESTOR VISIT - APRIL 2015 Converting strategic potential Future reserves & resources Unconv- entional gas Gas demand continues to drive Cooper’s long term potential Santos has a unique integrated value proposition Strong record of growing expected recovery with large future potential Reserve build and production dictated by forward capex Cooper infill reserve conversions - positives and negatives Encouraging results across all 3 play types Cooper Deep Coal looks highly prospective
  • 29. GLNG GLNG Plant, Curtis Island Trevor Brown, Vice President Queensland Rod Duke, Vice President Downstream GLNG
  • 30. Project overview Integrated LNG project on track for first LNG around the end of the third quarter of 2015, within US$18.5 billion budget COOPER AND GLNG INVESTOR VISIT - APRIL 201530 | Project partners Santos (30% and operator), PETRONAS, Total and KOGAS Project scope Existing and sanctioned gross upstream compression capacity 725 TJ/day, additional capacity to be sanctioned Incremental gas supply and infrastructure projects 420 kilometre gas transmission pipeline 2 train LNG plant and associated infrastructure LNG plant capacity 7.8 mtpa of LNG; 7.2 mtpa has been sold to PETRONAS and KOGAS Gross capital cost estimate US$18.5 billion1 from FID to the end of 2015 when the second train is expected to be ready for start-up Gross sustaining capex ~A$900 million average per annum over 2016-20 ~A$500 million average per annum post 2020 LNG train ramp-up Train 1 first LNG expected around end 3Q 2015; LNG production expected to ramp-up over 3-6 months Train 2 expected to be ready for start-up by the end of 2015; LNG production expected to ramp-up over 2-3 years 1 Based on foreign exchange rates which are consistent with the assumptions used at FID (A$/US$ 0.87 average over 2011-15).
  • 31. Project progress On track for first LNG around the end of the third quarter of 2015 GLNG provides positive free cash flow at US$40/bbl oil Fairview Hubs 4 and 5 operational and produced at above nameplate capacity Commissioning well progressed at Roma Hub 2, incremental 140 TJ/d compression capacity expected to be sanctioned mid- 2015 420 km gas transmission pipeline complete and delivering gas to LNG plant 120 km Comet Ridge to Wallumbilla pipeline loop complete and commissioned COOPER AND GLNG INVESTOR VISIT - APRIL 201531 | Gas introduced into the LNG plant and first two gas turbine generators fired Train 1 piping and cabling nearing completion First LNG tank dried and purged Loading jetty complete Plant commissioning on track First LNG around the end 3Q 2015 Over 9,000 PJ of dedicated reserves and resources Fairview wells performing strongly, expected field capacity ~600 TJ/d by end 2015 Roma wells online and dewatering in line with expectations Santos portfolio & third party gas provides 410-570 TJ/day in 2016 Underground storage delivery rate >100 TJ/day LNG plant and port Surface facilities & pipelines Gas supply
  • 32. Safety performance Continuous improvement in lost time injury frequency rate (LTIFR) since FID ─ 2014 LTIFR of 0.34 per million hours worked ─ 2015 YTD1 has LTIFR at 0 ─ 4.1 million hours worked1 in 2015 100% safety critical maintenance achieved in 2014 upstream operations Over 80 million hours worked since FID, including 4 million hours worked in 2015 to date COOPER AND GLNG INVESTOR VISIT - APRIL 201532 | 1 As at 10 April 2015 0.9 0.8 0.5 0.34 0 0.00 0.25 0.50 0.75 1.00 2011 2012 2013 2014 2015YTD Annual LTIFR since FID Celebrating 8 million job safe hours in Batangas module yard
  • 33. GLNG expenditure guidance US$18.5 billion1 capex from FID to the end of 2015 2016-20 average capex estimate A$900 million average per annum GLNG provides positive free cash flow at US$40/bbl oil COOPER AND GLNG INVESTOR VISIT - APRIL 201533 | Capital expenditure estimate FID to end of 2015 US$18.5 billion1 2016-2020 ~A$900 million average per annum Post 2020 ~A$500 million average per annum 1 Based on foreign exchange rates which are consistent with the assumptions used at FID (A$/US$ 0.87 average over 2011-15). Vast majority of 2016-20 expenditure is the upstream, and includes: ─ Drilling and completion of new wells (~200 per annum) ─ Connections of new wells, including wellpads, gas gathering lines, water pipelines, and power/communications infrastructure ─ Additional compression, water treatment facilities and ponds, trunklines, transmission lines and roads ─ Capitalised cost of staff working on upstream capex projects and wages associated with engineering, procurement and construction of upstream capex projects ─ Exploration and appraisal ─ Domestic gas stay-in-business capex Includes maintenance capex for the LNG plant and gas transmission pipeline Opex average cost estimate Upstream field (excludes electricity and carbon) ~A$1.25/GJ Downstream (pipeline, plant and port) ~A$150 million per annum
  • 35. GLNG upstream delivery Performance of Fairview wells continues to exceed expectations ─ Well capacity expected to be ~600 TJ/day by the end of 2015 Roma well capacity growing in line with expectations Fairview Hubs 4 and 5 operational and produced above nameplate capacity Construction complete at Roma Hub 2, with commissioning well advanced, incremental 140 TJ/d compression capacity expected to be sanctioned mid-2015 Pipeline compressor station complete 120 km Comet Ridge to Wallumbilla pipeline loop complete and commissioned Upstream is supplying gas to the LNG plant COOPER AND GLNG INVESTOR VISIT - APRIL 201535 | Fairview Hub 5
  • 36. Gas supply 5,603 2,228 1,202 0 2,000 4,000 6,000 8,000 10,000 2014 2C CSG 2P Santos portfolio & 3rd party 2P CSG GLNG has an integrated gas supply portfolio of indigenous gas, Santos portfolio gas, third party supply and gas storage GLNG proved reserves grew by 22% and proved and probable reserves by 4% in 2014, primarily due to positive re-assessments in the Fairview, Roma and Scotia fields GLNG has secured up to 2,228 PJ of Santos portfolio and third party gas supply agreements GLNG also has 1,202 PJ of 2C resources Over 9,000 PJ of dedicated 2P reserves and 2C resources at the end of 2014 YE 2014 GLNG dedicated 2P and 2C (GLNG share PJ) 9,033 36 | COOPER AND GLNG INVESTOR VISIT - APRIL 2015
  • 37. Third party gas supply Third party gas generates significant value for the project 37 | Supplier Quantity TJ/day Starts Term Delivery point Price basis Santos portfolio ‘Horizon’ 750 PJ 140 2015 15 years Wallumbilla Oil-linked Origin 365 PJ 100 2015 10 years Wallumbilla Oil-linked Origin 194 PJ1 50-1001 2016 5 years Wallumbilla Oil-linked Other suppliers 85 PJ 10-15 60-100 2015 2016 7 years 21 months Wallumbilla Oil-linked Meridian JV 445 PJ2 20-65 2015 20 years GLNG GTP Oil-linked3 Combabula/ Spring Gully 389 PJ4 30 2015 20 years Fairview Oil-linked 1 100 PJ firm volume over 5 years. Origin has the option to supply additional volumes of up to 94 PJ during the same period. 2 Source: WestSide Corporation Target Statement of 16 May 2014. Excludes additional gas production by the Meridian Joint Venture beyond 65 TJ/day. Volumes subject to Meridian field production performance and implementation of expansion plans. 3 Oil-linked from 2016. 4 Santos share 2P reserves in the APLNG-operated Combabula, Spring Gully and Ramyard fields at the end of 2014. Secured up to 2,228 PJ Santos portfolio and third party supply Attractive oil-linked gross margins Provides operational flexibility in LNG train ramp- up and operation COOPER AND GLNG INVESTOR VISIT - APRIL 2015
  • 38. Fairview The Fairview field is located in south-central Queensland, about 100 km north of Roma Fairview is a mature field, with over 20 years of production history GLNG ownership 76.07% (ATP 526P); 100% (ATP 655P) Land tenure is a mixture of Santos-owned property, privately-owned property, leasehold and state-owned property The area is sparsely populated: the nearest town, Injune — about 25 km to Fairview’s south-west — has a population of around 400 Historically, wells produced to the three Fairview hub compression stations F- CS-01, F-CS-02 and F-CS-03. Two additional compression stations (F-HCS-04 and F-HCS-05) are now operational in the north and south-eastern part of the field Initial development targeted the north and south-eastern part of the field, with an infill drilling program and the Eastern Flank development sanctioned post FID The initial GLNG upstream development is focussed on the mature Fairview field 38 | COOPER AND GLNG INVESTOR VISIT - APRIL 2015 Fairview tenures
  • 39. Fairview well performance Performance continues to exceed expectations – gross field well capacity expected to be ~600 TJ/day by the end of 2015 Fairview well performance as at March 2015 347 wells connected Optimum gas capacity (TJ/day) Optimum water capacity (bbl/day) Current average water capacity 372 bbl/day Total well stock average gas capacity 1.63 TJ/day Performance of Fairview wells continues to exceed expectations Well capacity expected to be ~600 TJ/day by the end of 2015 Excellent gas rates up to 22 TJ/day, with 9 wells with optimum capacities >10 TJ/day Current average capacity of 183 wells connected in May 2014 now 2.38 TJ/d (increase from 2.2 TJ/d) High turn-down capacity 134 new wells connected since Oct 2014 and dewatering Average gas capacity of total connected well stock 1.63 TJ/d including new wells in dewatering phase As new wells dewater, average gas capacity expected to increase 39 | COOPER AND GLNG INVESTOR VISIT - APRIL 2015 Current average capacity of 183 wells connected in May 2014 now 2.38 TJ/d (increase from 2.2 TJ/d) 134 new wells connected since Oct 2014 and dewatering. As new wells dewater, average gas capacity expected to increase.
  • 40. Significant gas in place confirmed in Early Permian coals directly beneath Fairview Field and close to existing infrastructure ─ Net coal up to 50 metres thick in Waddy Brae area ─ Encouraging performance from Early Permian East pilots – Waddy Brae and Dawson Bend-3 with gas rates >700 mscf/d achieved Appraisal of Bandanna coals on flanks of Fairview field progressing with solid results: ─ Yebna North area on the far Eastern Flank production rates higher than expected for depth ─ Yebna North-1 test rate 388 mscf/d from coal at 1,180 metres Significant upside potential exists in the Early Permian coals and on the flanks of Fairview Fairview upside potential Yebna North 1 Bandanna Pilot Dawson Bend 3 Early Permian Pilot Waddy Brae Early Permian Pilot COOPER AND GLNG INVESTOR VISIT - APRIL 201540 | Yebna North 1, production testing
  • 41. Roma The Roma field is situated in south-central Queensland, some 300 km north-west of Brisbane On trend with APLNG and QCLNG key field development areas Covering approximately 3,000 km2, the development area consists of four ATPs (ATP 336 and ATP 631, 708 and 665), 11 PLs and 2 PLAs GLNG ownership: 100%, except ATP 631P (81.9%) Drilling has initially been focussed in the western acreage All produced gas will be exported from the hub compressors at Roma Hub 2 (R-HCS-02) via a 3 km, 20” line connected to a tie-in point to the CRWP pipeline Santos has a long history operating in the Roma area Roma tenures COOPER AND GLNG INVESTOR VISIT - APRIL 201541 |
  • 42. Roma well performance Online and dewatering, supporting average well capacity of 0.5 TJ/day 271 development wells drilled 120 wells online and dewatering in line with expectations Average gas capacity growing month-on-month as wells progressively connected and dewatered 8 wells are flowing >0.5 TJ/d, highest of these 2.1 TJ/d Strong gas rates from early producers Strong water rates from recent connections 42 | COOPER AND GLNG INVESTOR VISIT - APRIL 2015 Roma well performance as at April 2015 120 wells connected Optimum gas capacity (TJ/day) Optimum water capacity (bbl/day)
  • 43. Roma field performance Strong gas and water production performance from the Hermitage and Pleasant Hills area COOPER AND GLNG INVESTOR VISIT - APRIL 201543 | Best results observed in areas already dewatered by pilot production Results provide confidence in ongoing gas build Roma RM02-04-01 (Hermitage area) now over 2 mmscf/d and RM08-06-02 (Pleasant Hills) >1 mmscf/d Roma RM02-04-1 well - actual production Roma RM08-06-2 well - actual production RM02-04-1 RM08-06-21 Hermitage Area Pleasant Hills Area Raslie Area Roma Phase 1 Gas(mscf/d)Gas(mscf/d) Water(bwpd)Water(bwpd)
  • 44. Scotia and Arcadia Scotia Area The Scotia area is located about 100 km west of the Fairview assets. The three Scotia licence areas include PL 176, ATP 868P and ATP 803P. PL 176 planned as the first phase. Gas production can be delivered via the executed APLNG Swap agreement Additional targets both within PL 176 and in the ATPs are in the exploration and appraisal phase Arcadia The Arcadia field is situated in south-central Queensland, approximately 400 km north-west of Brisbane Encouraging results from Sunnyholt Pilot area with >1 mmscf/d and continuing to ramp The gas transmission pipeline to Gladstone runs through the Arcadia development area with bespoke tie-in point A phased future development strategy is being pursued in Scotia and Arcadia Arcadia tenures 44 | COOPER AND GLNG INVESTOR VISIT - APRIL 2015 Scotia tenures Sunnyholt pilot
  • 45. ─ Scotia - Deep sands and basement volcanics ─ Arcadia - Early Permian - thick coals up to 75 m intersected ─ Roma - Permian CSG & Conventional Plays ─ Arcadia - flanks & extended Reach drilling ─ Clematis Creek area ─ ATP 803 and ATP 868 ─ Northern Comet Ridge close to KP 128 Tie-In ─ Fairview - Early Permian (east) ─ Fairview Flanks - Bandanna ─ Scotia - Western Flank ─ Scotia - Mid-Baralaba coals ─ Roma - Western flank ─ Fairview - Early Permian (west) 1 2 1 2 1 4 1 4 5 3 Resource growth opportunities Numerous Brownfield opportunities, encouraging pilot results close to existing infrastructure Greenfield opportunities are benefitting from knowledge of reservoir behaviour and technology applications in core areas Several different plays with large GIIP have been identified across the GLNG portfolio, although significant subsurface uncertainty remains In addition to the four core GLNG areas numerous growth opportunities exist across GLNG portfolio Appraisal Phase (Brownfield) Exploration Phase Appraisal Phase (Greenfield) 2 3 3 4 5 3 1 4 2 3 1 2 6 6 3 Fairview Field Scotia Field Arcadia Field Roma Field 2 COOPER AND GLNG INVESTOR VISIT - APRIL 201545 |
  • 46. Drilling and completions Multi-well pads continue to drive greater efficiency, lower costs and a smaller environmental footprint COOPER AND GLNG INVESTOR VISIT - APRIL 201546 | Over 600 wells drilled since FID At peak drilling, ten drilling rig and five completion rigs were operational in GLNG assets Current rig fleet of 1 drilling rig and 2 completion rigs across GLNG fields Significant reduction in drilling and completion costs per well since FID ─ Custom designed drilling rigs and factory drilling approach continues to drive lower well costs ─ Roma drill costs dropped from $427/ft to $233/ft by 2014 ─ Fairview drill costs have dropped from $532/ft to $388/ft Expect to drill ~200 wells average per annum post-2015 0 100 200 300 400 500 600 700 2012 Avg (29 wells) 2013 Avg (40 wells) FV Eastern Flank (71 wells) Fairview deviated well drilling cost performance $ / ft drilled
  • 47. Upstream infrastructure COOPER AND GLNG INVESTOR VISIT - APRIL 201547 | Integrated upstream development with connections to APLNG and QCLNG RUGS >100 TJ/d
  • 48. Upstream gas processing Hubs are supplying gas to the LNG plant and have produced above nameplate capacity COOPER AND GLNG INVESTOR VISIT - APRIL 201548 | Existing 170 TJ/day existing gross gas capacity at Fairview and Scotia Fairview Hub 5 160 TJ/day gross gas capacity 4 ML/day water handling facilities Operational Fairview Hub 4 250 TJ/day gross gas capacity 20 ML/day water handling facilities Operational Roma Hub 2 145 TJ/day gross gas capacity 10 ML/day water handling facilities Construction complete and commissioning well underway Fairview Hub 4
  • 49. COOPER AND GLNG INVESTOR VISIT - APRIL 201549 | Fairview Hub 5 160 TJ/day capacity - Facility operational
  • 50. COOPER AND GLNG INVESTOR VISIT - APRIL 201550 | Fairview Hub 4 250 TJ/day capacity - Facility operational
  • 51. COOPER AND GLNG INVESTOR VISIT - APRIL 201551 | Roma Hub 2 145 TJ/day capacity - Construction complete and commissioning well underway
  • 52. Upstream operations philosophy Upstream is controlled from Brisbane operations centre utilising world class technology to drive down operating costs and maximise productivity 52 | Great Situational awareness Define and develop scope Right information at the right time Focus on cost of production Collaborative Planning Schedule and Optimise Right people together using collaborative technology Functional Teams Operation Centre Decisive Action Operate and Execute Rapid response & turnaround Field Asset Teams Brisbane control room Well site COOPER AND GLNG INVESTOR VISIT - APRIL 2015
  • 53. Pipeline compressor station (PCS) Connection point to the gas transmission pipeline to Gladstone PCS is the collection point for all of GLNG’s upstream gas infrastructure, including: ─ Existing hubs (CS1, CS2, CS3) ─ New hubs (FV04, FV05, RM02) ─ CRW Pipeline and Loop Complete and operational The pipeline compressor station is complete and operational COOPER AND GLNG INVESTOR VISIT - APRIL 201553 | Pipeline compressor station, Fairview
  • 54. Roma underground storage (RUGS) Gas storage in three depleted conventional Roma gas fields: Pleasant Hills, Grafton Range and Pickanjinnie 15 injection wells on-line Maximum underground storage injection and delivery rate >100 TJ/day Capacity 70 PJ Key infrastructure providing operational flexibility Opportunity for investment in additional gas storage capacity RUGS provides significant gas storage capacity adjacent to the Wallumbilla gas hub 54 | RUGS storage fields COOPER AND GLNG INVESTOR VISIT - APRIL 2015
  • 55. Incremental gas supply and infrastructure projects In addition to the project scope approved at FID, the following projects have been sanctioned: ─ Fairview Eastern Flank, Fairview Infill ─ Roma West Phase 2A ─ CRWP Loop ─ Upstream electrification ─ Marine crossing tunnel ─ QGC pipeline interconnects Optimisation studies ongoing for investment in additional upstream development and compression capacity ─ Roma Phase 2B: additional 140 TJ/d hub compression capacity expected to be sanctioned mid-2015 ─ Scotia: additional development expected to be sanctioned end- 2015 Incremental infrastructure and field development projects delivered on or ahead of schedule and on or under budget COOPER AND GLNG INVESTOR VISIT - APRIL 201555 | Saxon Rig 187, Fairview drilling
  • 56. Landholder and community engagement We manage a pastoral/irrigation business on our key sites co-existing with CSG production: 1,500 Droughtmaster breeding herd on 43,000 hectares Irrigation with produced water of 1,260 hectare of Chinchilla Whitegums (1.3 million trees) Forage crops of 234 hectare Laucaena and 450 hectare Buffel grass irrigated with produced water Our employees understand how to work with agri-business from their own experience of co- existence We respect and proactively engage with landholders and the local community COOPER AND GLNG INVESTOR VISIT - APRIL 201556 | GLNG has 720 agreements in place with 647 landholders We ensure success by: Upfront discussions with the landholders to understand their operations now and in the long term Monitoring works to minimise disturbance during construction and working to rectify issues quickly Dedicated landholder advisers based in the field from the communities they work with
  • 58. Downstream overview Plant commissioning is well underway First LNG expected around the end of the third quarter of 2015 Location Curtis Island, Gladstone, Queensland EPC contractor Bechtel Technology ConocoPhillips Optimized Cascade Liquefaction technology and a modular construction scheme LNG plant capacity 2 x 3.9mtpa trains (7.8 mtpa) LNG contracts 7.2 mtpa has been sold to PETRONAS and KOGAS Scope Modular train construction: 82 modules for train 1 and 29 for train 2 (111 in total). Modules built at Batangas in the Philippines and shipped to Curtis Island for assembly 2 x 140,000 cubic metre LNG storage tanks 360 metre jetty LNG train ramp-up Train 1 first LNG expected around the end of the third quarter of 2015 LNG production expected to ramp-up over 3-6 months Train 2 ready for start-up expected by end-2015 LNG production expected to ramp-up over 2-3 years LNG tanks, February 2015 58 | COOPER AND GLNG INVESTOR VISIT - APRIL 2015
  • 59. GLNG downstream LNG Train 1 piping and cabling nearing completion with loop testing well advanced LNG Train 2 piping installation and cable pulling underway Gas introduced to plant in March 2015 and flare lit First two Train 1 gas turbine generators running Other Train 1 utilities commissioned and operating Drying and purging of LNG Tank B complete and underway on Tank A, following which tanks will be ready to receive LNG LNG loading jetty complete 107 Santos GLNG staff embedded in integrated Bechtel/GLNG commissioning and start-up team QGC interconnects complete with first gas flowed in March 2015 420-kilometre gas transmission pipeline complete and supplying gas to LNG plant Expect to deliver first LNG around the end of the third quarter of 2015 Commissioning well underway and expect first LNG around the end of the third quarter of 2015 COOPER AND GLNG INVESTOR VISIT - APRIL 201559 | GLNG flare stack, Curtis Island, March 2015
  • 60. Gas inlet and refrigerant storage Utilities area Includes Central Control Building Camp accommodation 1,680 beds Flare 100 metres tall Train 1 3.9 mtpa nameplate capacity Train 2 3.9 mtpa nameplate capacity LNG jetty 360m long, 4 loading arms Two LNG tanks 280,000m3 combined capacity COOPER AND GLNG INVESTOR VISIT - APRIL 201560 | February 2015
  • 61. COOPER AND GLNG INVESTOR VISIT - APRIL 201561 | Train 1 piping and cabling nearing completion with loop testing well advanced Train 2 piping installation and cable pulling underway February 2015
  • 62. COOPER AND GLNG INVESTOR VISIT - APRIL 201562 | Drying and purging of LNG Tank B complete and underway on Tank A, following which tanks will be ready to receive LNG February 2015
  • 63. COOPER AND GLNG INVESTOR VISIT - APRIL 201563 | LNG jetty is complete February 2015
  • 64. GLNG plant control room, Curtis Island Commissioning and operations 107 Santos GLNG staff embedded in integrated Bechtel/GLNG commissioning and start-up team Gas has been introduced to LNG plant LNG plant commissioning team includes GLNG operators and maintenance staff Experienced GLNG partner secondees working in key commissioning and start-up coordination roles 13 commissioning cargoes sold Integrated commissioning and operations team COOPER AND GLNG INVESTOR VISIT - APRIL 201564 |
  • 65. GLNG On track for first LNG around the end of the third quarter of 2015, within US$18.5 billion budget COOPER AND GLNG INVESTOR VISIT - APRIL 201565 | Milestone Date Marine crossing tunnelling completed February2014 Last Train 1 module installed June 2014 First LNG tank hydrotested July 2014 Pipeline commissioning commenced August 2014 Second LNG tank hydrotested September 2014 Last Train 2 module installed November 2014 Pipeline commissioned and gassed-up to Curtis Island November 2014 First commissioning gas to LNG plant March 2015 First LNG Train 1 Around end 3Q 2015 Train 2 ready for start-up End 2015
  • 66. COOPER AND GLNG INVESTOR VISIT - APRIL 201566 | APLNG QCLNG GLNG Curtis Island, February 2015
  • 67. Contact Information Head Office Adelaide Ground Floor, Santos Centre 60 Flinders Street Adelaide, South Australia 5000 GPO Box 2455 Adelaide, South Australia 5001 Telephone: +61 8 8116 5000 Useful email contacts Share register enquiries: web.queries@computershare.com.au Investor enquiries: investor.relations@santos.com Website: www.santos.com COOPER AND GLNG INVESTOR VISIT - APRIL 201567 | Saxon Rig 187, CSG Drilling Andrew Nairn Group Executive Investor Relations Direct: + 61 8 8116 5314 Email: andrew.nairn@santos.com Andrew Hay Manager Investor Relations Direct: + 61 8 8116 7722 Email: andrew.hay3@santos.com Sophie Hansson Investor Relations Manager Direct: + 61 8 8116 5671 Email: sophie.hansson@santos.com