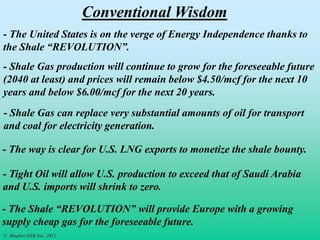
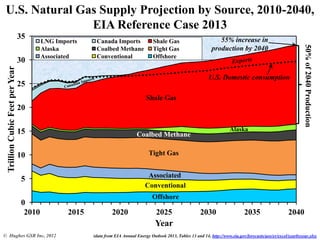
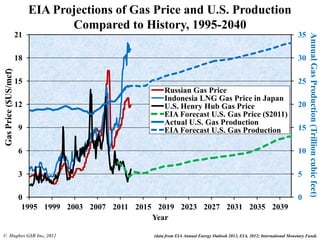
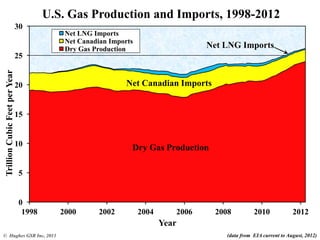
Drawing on his 'Drill, Baby. Drill' report for the Post-Carbon Institute, J. David Hughes explains how shale gas production in the US has already peaked and how a further reliance on shale gas will lead to a drilling treadmill.
Nichols is the editor/associate publisher of Hydrocarbon Processing magazine. At present, he manages all content and business development for Hydrocarbon Processing, as well as data/content for Gulf Publishing Company’s Data Division. This includes all data content for Hydrocarbon Processing’s Construction Boxscore Database, annual Market Data Book and US Gas Plant Directory.
The very first Drilling Productivity Report (DRP) issued by the U.S. Energy Information Administation. The report, using charts and graphs, shows how efficient (or not) rigs are at drilling, and how productive (or not) wells are, by region/shale play. Among the very important metrics tracked is the decline rate of newly drilled wells–how quickly the gas and oil flowing out of shale wells peters out. This first report shows the Marcellus Shale has (astonishingly) hit 12 billion cubic feet per day of natural gas production.
The monthly tabulation and prediction from the U.S. Energy Information Administration on production and activity in the largest 7 U.S. shale plays. All 7 shale plays will experience a decrease in natural gas production from the previous month due to low commodity prices.
The Drilling Productivity Report uses recent data on the total number of drilling rigs in operation along with estimates of drilling productivity and estimated changes in production from existing oil and natural gas wells to provide estimated changes in oil and natural gas production for six key fields. EIA's approach does not distinguish between oil-directed rigs and gas-directed rigs because once a well is completed it may produce both oil and gas; more than half of the wells produce both.
The monthly tabulation and prediction from the U.S. Energy Information Administration on production and activity in the largest 7 U.S. shale plays. All 7 shale plays will experience a decrease in natural gas production from the previous month due to low commodity prices.
Monthly report from the U.S. Energy Information Administration that shows total oil and gas output from the country's seven most actively drilled shale plays. This latest report shows that the Marcellus continues to dominate, producing more than twice the output (in natural gas) of any other shale play. Fully 37% of all natgas being produced by U.S. shale plays comes from the Marcellus.
The monthly Drilling Productivity Report from the U.S. Energy Information Administration. This one, issued in December 2014, shows that oil output from the top seven U.S. shale plays (the Marcellus and Utica being two of them) will increase from 5.2 to 5.3 million barrels per day, and natural gas production will increase from 44.1 to 44.7 billion cubic feet per day by January 2015.
Market Research Report : Oil and gas market in china 2014 - SampleNetscribes, Inc.
For the complete report, get in touch with us at: info@netscribes.com
Abstract:
Netscribes latest market research report titled Oil and Gas Market in China 2014 states that the market is expected to witness rapid growth owing to high untapped oil and gas reserves in the country. Rise in population and growing urbanization has led to a surge in energy demand in China. Increasing energy requirement in the country will have a favorable impact on the demand for oil and gas market in China. Growing petrochemical sector and automotive sector is also expected to foster growth of this market. These factors will ensure that the market continues to exhibit steady future growth. However, the market also experiences some pain points. Target to reduce CO2 emission also acts as the greatest hindrance to the development. Increase in foreign dependence for oil and gas supply and growing emphasis on renewable energy utilization to act as a major challenge to the Chinese oil and gas market. Although Chinese players are making overseas investments with a view to reduce foreign dependence for oil and gas. Players are also venturing into construction and expansion of oil and gas terminals with a view to obtain a secure supply of natural gas.
The Government of China is actively involved in the development of the domestic oil and gas market. Different pricing and tax reforms were introduced by the government with a view to promote the market. Chinese 12th five year plan has outlined several steps to develop the oil and gas industry in China. Oil and gas market has grown over the past decade at a remarkable rate in China and is expected to grow rapidly owing to increasing energy requirements in the coming future.
Table of Contents:
A monthly report from the U.S. Energy Information Administration that uses recent data on the total number of drilling rigs in operation along with estimates of drilling productivity and estimated changes in production from existing oil and natural gas wells to provide estimated changes in oil and natural gas production for six key fields.
The monthly Drilling Productivity Report from the EIA that shows, by major shale basin, the productivity for both new and existing wells--for both oil and gas. This month's report shows that the Marcellus will officially blow by 16 billion cubic feet per day of production in December.
The Ultimate Guide to Enhanced Oil Recovery (EOR). Spending ($m) & Production (bpd) Forecasts for Chemical (Polymer, Alkaline, Surfactant), Gas (CO2 Injection, Nitrogen Injection, Natural Gas Injection), Thermal (Steam Injection (Steam Flood, Cyclic Steam Simulation (CSS)), Steam Assisted Gravity Drainage (SAGD), In-Situ Combustion, Heavy Oil Recovery Technologies Including Leading Company Analysis for Thermal EOR, Chemical EOR and CO2 EOR
The LNG Fuel Tipping Point and Competitive AdvantageJohn Hatley PE
Macro marketplace drivers with a micro business case example demonstrate the robustness of gas as a preferred fuel. Environmental currency is sustaining while investment returns wax and wain with energy price shifts. For ocean car carriers, the clean logistics brings strong BRAND image gains centered around environmental stewardship to often out-weighs other criteria.
The Major Tight Oil Basins - March 2020ShaleProfile
In this insights report, we will take a close look at the latest developments in the major tight oil basins in the US, including the Permian, Williston, Eagle Ford and the DJ-Niobrara.
Here’s what we cover in this report:
- Where does the horizontal rig count stand today?
- How much oil is produced from horizontal wells in these basins?
- What are the top 10 oil-producing counties?
- How do the basins compare in well performance?
- Who are the top operators based on well productivity?
Mercer Capital's Value Focus: Energy Industry | Q4 2014 | Segment: Oilfield S...Mercer Capital
Mercer Capital's Energy Industry newsletter provides perspective on valuation issues. Each newsletter also typically includes a macroeconomic trends, industry trends, and guideline public company metrics.
Monthly report issued by the U.S. Energy Information Administration that tabulates production for both oil and gas by major shale region in the U.S. The April report shows, for the first time, U.S. shale plays producing less oil and natural gas in May than they did in April.
Presentation geert de cock lembork_fracking_english_final_shortgdecock
This presentation was made during an event on October 26, 2012 in Lembork, where Food & Water Europe was invited by a local group. We informed local residents about the risks, negative impacts and the exaggerated benefits of shale gas for Poland.
Zittel shale gas European-perspective-14-may-2013-2gdecock
Drawing on his 'Fossil and Nuclear Fuels: The Energy Outlook' report for the Energy Watch Group, Werner Zittel explains how shale gas production in Europe will be expensive to extract and not make a significant impact on European gas prices or the import dependency of select EU Member States.
Polish official (Andrzej Jasiński Advisor to Deputy Prime Minister, Minister of Economy, Adviser to the Chief Inspector for Environment Protection, Ministry of Environment Poland
Presentation geert de cock kartuzy_fracking_english_final_longgdecock
This presentation was made during an event on October 25, 2012 in Kartuzy, where Food & Water Europe was invited by a local group. We informed local residents about the risks, negative impacts and the exaggerated benefits of shale gas for Poland.
Presentation geert de cock kartuzy_fracking_polish_final_longgdecock
Ta prezentacja została wykonana podczas imprezy w dniu 25 października 2012 w Kartuzach, gdzie Food & Water Europe został zaproszony przez grupy lokalnej. Poinformowaliśmy lokalnych mieszkańców o zagrożeniach, negatywnego wpływu i wyolbrzymionych korzyści gazu łupkowego w Polsce.
This is the slide deck from Texas State SBDC's Knowledge Transfer session titled, "The Importance and Impact of Team and Culture," presented in Round Rock, Texas on October 17, 2013. Presenters included: Jason Seats, Managing Director of Austin Techstars, Paul O'Brien, Growth Hacker & Founder of SEOBrien, Paula Soileau, Co-Founder of Affintus and Casey Amidon, VP HR of Drillinginfo.
The session included a case study of the hugely successful Austin tech company, Drillinginfo, which now has over 500 employees world-wide, has been ranked among Austin's "Top Work Places" 3 years running, is recognized as one of the 50 fastest growing companies in Austin 9 years in a row and whose CEO (Allen Gilmer) won the coveted Ernst & Young "Entrepreneur of the Year" award in 2012.
The session was video-taped and will be added to the Texas State SBDC websites.
The monthly tabulation and prediction from the U.S. Energy Information Administration on production and activity in the largest 7 U.S. shale plays. All 7 shale plays will experience a decrease in natural gas production from the previous month due to low commodity prices.
A monthly report on how productive (or effective) drilling in six major U.S. shale plays has been over the previous 30 days. This is the report for November 2013.
The monthly tabulation and prediction from the U.S. Energy Information Administration on production and activity in the largest 7 U.S. shale plays. All 7 shale plays will experience a decrease in natural gas production from the previous month due to low commodity prices.
The monthly Drilling Productivity Report issued by the U.S. Energy Information Administration--for July 2014. This report shows once again the Marcellus continues to increase production--up 28% from a year earlier. The Marcellus now accounts for 16% of all US natgas production.
The monthly tabulation and prediction from the U.S. Energy Information Administration on production and activity in the largest 7 U.S. shale plays. All 7 shale plays will experience a decrease in natural gas production from the previous month due to low commodity prices.
The monthly tabulation and prediction from the U.S. Energy Information Administration on production and activity in the largest 7 U.S. shale plays. Only the Utica Shale saw an increase in natural gas production from the previous month.
The monthly tabulation and prediction from the U.S. Energy Information Administration on production and activity in the largest 7 U.S. shale plays. This month's report features a first since the report was begun: natural gas production in the mighty Marcellus Shale declined from the previous month. Only the Utica Shale saw an increase in natural gas production from the previous month.
The monthly tabulation and prediction from the U.S. Energy Information Administration on production and activity in the largest 7 U.S. shale plays. All 7 shale plays will experience a decrease in natural gas production from the previous month due to low commodity prices.
The U.S. Energy Information Administration's monthly Drilling Productivity Report for January 2015. The report shows expected production for shale oil and gas for the country's 7 largest shale plays. As in previous months, the Marcellus and Utica regions continue to expand their production rapidly.
The monthly tabulation and prediction from the U.S. Energy Information Administration on production and activity in the largest 7 U.S. shale plays. All 7 shale plays will experience a decrease in natural gas production from the previous month due to low commodity prices.
The monthly Drilling Productivity Report from the U.S. Energy Information Administration for August 2014. This edition of the DPR includes, for the first time, the Utica Shale.
The monthly tabulation and prediction from the U.S. Energy Information Administration on production and activity in the largest 7 U.S. shale plays. All 7 shale plays will experience a decrease in natural gas production from the previous month due to low commodity prices.
The monthly report from the U.S. Energy Information Administration that tracks oil and natural gas production by the top 7 U.S. shale plays. This month's report shows total gas and oil production from shale plays continues to decline, except for that in the Marcellus and Utica Shale.
An astonishing, first-of-its-kind, report by the NYT assessing damage in Ukraine. Even if the war ends tomorrow, in many places there will be nothing to go back to.
03062024_First India Newspaper Jaipur.pdfFIRST INDIA
Find Latest India News and Breaking News these days from India on Politics, Business, Entertainment, Technology, Sports, Lifestyle and Coronavirus News in India and the world over that you can't miss. For real time update Visit our social media handle. Read First India NewsPaper in your morning replace. Visit First India.
CLICK:- https://firstindia.co.in/
#First_India_NewsPaper
31052024_First India Newspaper Jaipur.pdfFIRST INDIA
Find Latest India News and Breaking News these days from India on Politics, Business, Entertainment, Technology, Sports, Lifestyle and Coronavirus News in India and the world over that you can't miss. For real time update Visit our social media handle. Read First India NewsPaper in your morning replace. Visit First India.
CLICK:- https://firstindia.co.in/
#First_India_NewsPaper
01062024_First India Newspaper Jaipur.pdfFIRST INDIA
Find Latest India News and Breaking News these days from India on Politics, Business, Entertainment, Technology, Sports, Lifestyle and Coronavirus News in India and the world over that you can't miss. For real time update Visit our social media handle. Read First India NewsPaper in your morning replace. Visit First India.
CLICK:- https://firstindia.co.in/
#First_India_NewsPaper
El Puerto de Algeciras continúa un año más como el más eficiente del continente europeo y vuelve a situarse en el “top ten” mundial, según el informe The Container Port Performance Index 2023 (CPPI), elaborado por el Banco Mundial y la consultora S&P Global.
El informe CPPI utiliza dos enfoques metodológicos diferentes para calcular la clasificación del índice: uno administrativo o técnico y otro estadístico, basado en análisis factorial (FA). Según los autores, esta dualidad pretende asegurar una clasificación que refleje con precisión el rendimiento real del puerto, a la vez que sea estadísticamente sólida. En esta edición del informe CPPI 2023, se han empleado los mismos enfoques metodológicos y se ha aplicado un método de agregación de clasificaciones para combinar los resultados de ambos enfoques y obtener una clasificación agregada.
‘वोटर्स विल मस्ट प्रीवेल’ (मतदाताओं को जीतना होगा) अभियान द्वारा जारी हेल्पलाइन नंबर, 4 जून को सुबह 7 बजे से दोपहर 12 बजे तक मतगणना प्रक्रिया में कहीं भी किसी भी तरह के उल्लंघन की रिपोर्ट करने के लिए खुला रहेगा।
1. The Shale Revolution in North America:
Myths and Realities
Beyond the Hype: Economics of Shale Gas in Europe
EU Parliament
Brussels, Belgium
May 14, 2013
J. David Hughes
Post Carbon Institute
36. University of Texas Barnett Study Heralded as a Good News
Story of Long Term Growth by Wall Street Journal (Feb 2013)
Peak 2012
60% Decline by 2030
51. And there is no such thing
as a FREE LUNCH
There has been a great deal of
pushback by many in the
general public and in State and
National governments to
environmental issues surrounding
hydraulic fracturing
52. - Methane contamination of groundwater
- Disposal of produced fracture fluid
potentially contaminating groundwater
and inducing earthquakes
-Industrial footprint – truck traffic, air
emissions etc.
-Full cycle greenhouse gas emissions
which may be worse than coal
- High levels of water consumption
53. • High field decline rates require a drilling treadmill to maintain
production – 30-50% of production must be replaced each year
with more drilling.
• High quality shale plays are not ubiquitous - 88% of shale gas
production comes from 6 of 30 plays; 81% of tight oil
production comes from 2 of 21 plays.
• The drilling treadmill will accelerate as sweet spots are drilled off
and well quality declines as drilling moves into more
marginal areas.
• Over-hyped in terms of long term supply especially at low forecast
prices.
• Collateral environmental impacts associated with fracking have
already, and will continue to create public opposition to
unfettered access to drill sites which are mandatory to
maintain supply.
The Shale “REVOLUTION”
54. • US “Energy Independence” with the forecast energy trajectory is
highly unlikely, barring a radical reduction in consumption.
• Almost all eggs are in the shale basket as a hope in meeting U.S.
energy supply growth projections from oil and gas.
Implications
• Replicating the “Shale Revolution”, to the extent it exists, will
take much longer in Europe, if ever. There is no reason to expect
that the geology will be much different – the greatest potential will
lie in a few plays and parts thereof. Higher population densities
will make surface access for the large number of drilling locations
required much more difficult. Due to high population densities
the collateral environmental impacts of fracking are likely to be
even more apparent – and opposed – than they are in the U.S.
• The “Shale Revolution” has been a “game-changer” in that it has
temporarily reversed a terminal decline in supplies from
conventional sources. Long term sustainability is highly
questionable and environmental impacts are a major concern.