Download to read offline


![29
OR = 3.9 [95% CI: 1.4-10.9]
CirculatoryDisease](https://image.slidesharecdn.com/kevincumminsstatpradoxes020316-160311193240/75/Kevin-Cummins-Statistical-Phenomenon-02-09-16-29-2048.jpg)
![30
CirculatoryDisease
OR = 1.3 [95% CI: 0.9-2.3]](https://image.slidesharecdn.com/kevincumminsstatpradoxes020316-160311193240/75/Kevin-Cummins-Statistical-Phenomenon-02-09-16-30-2048.jpg)

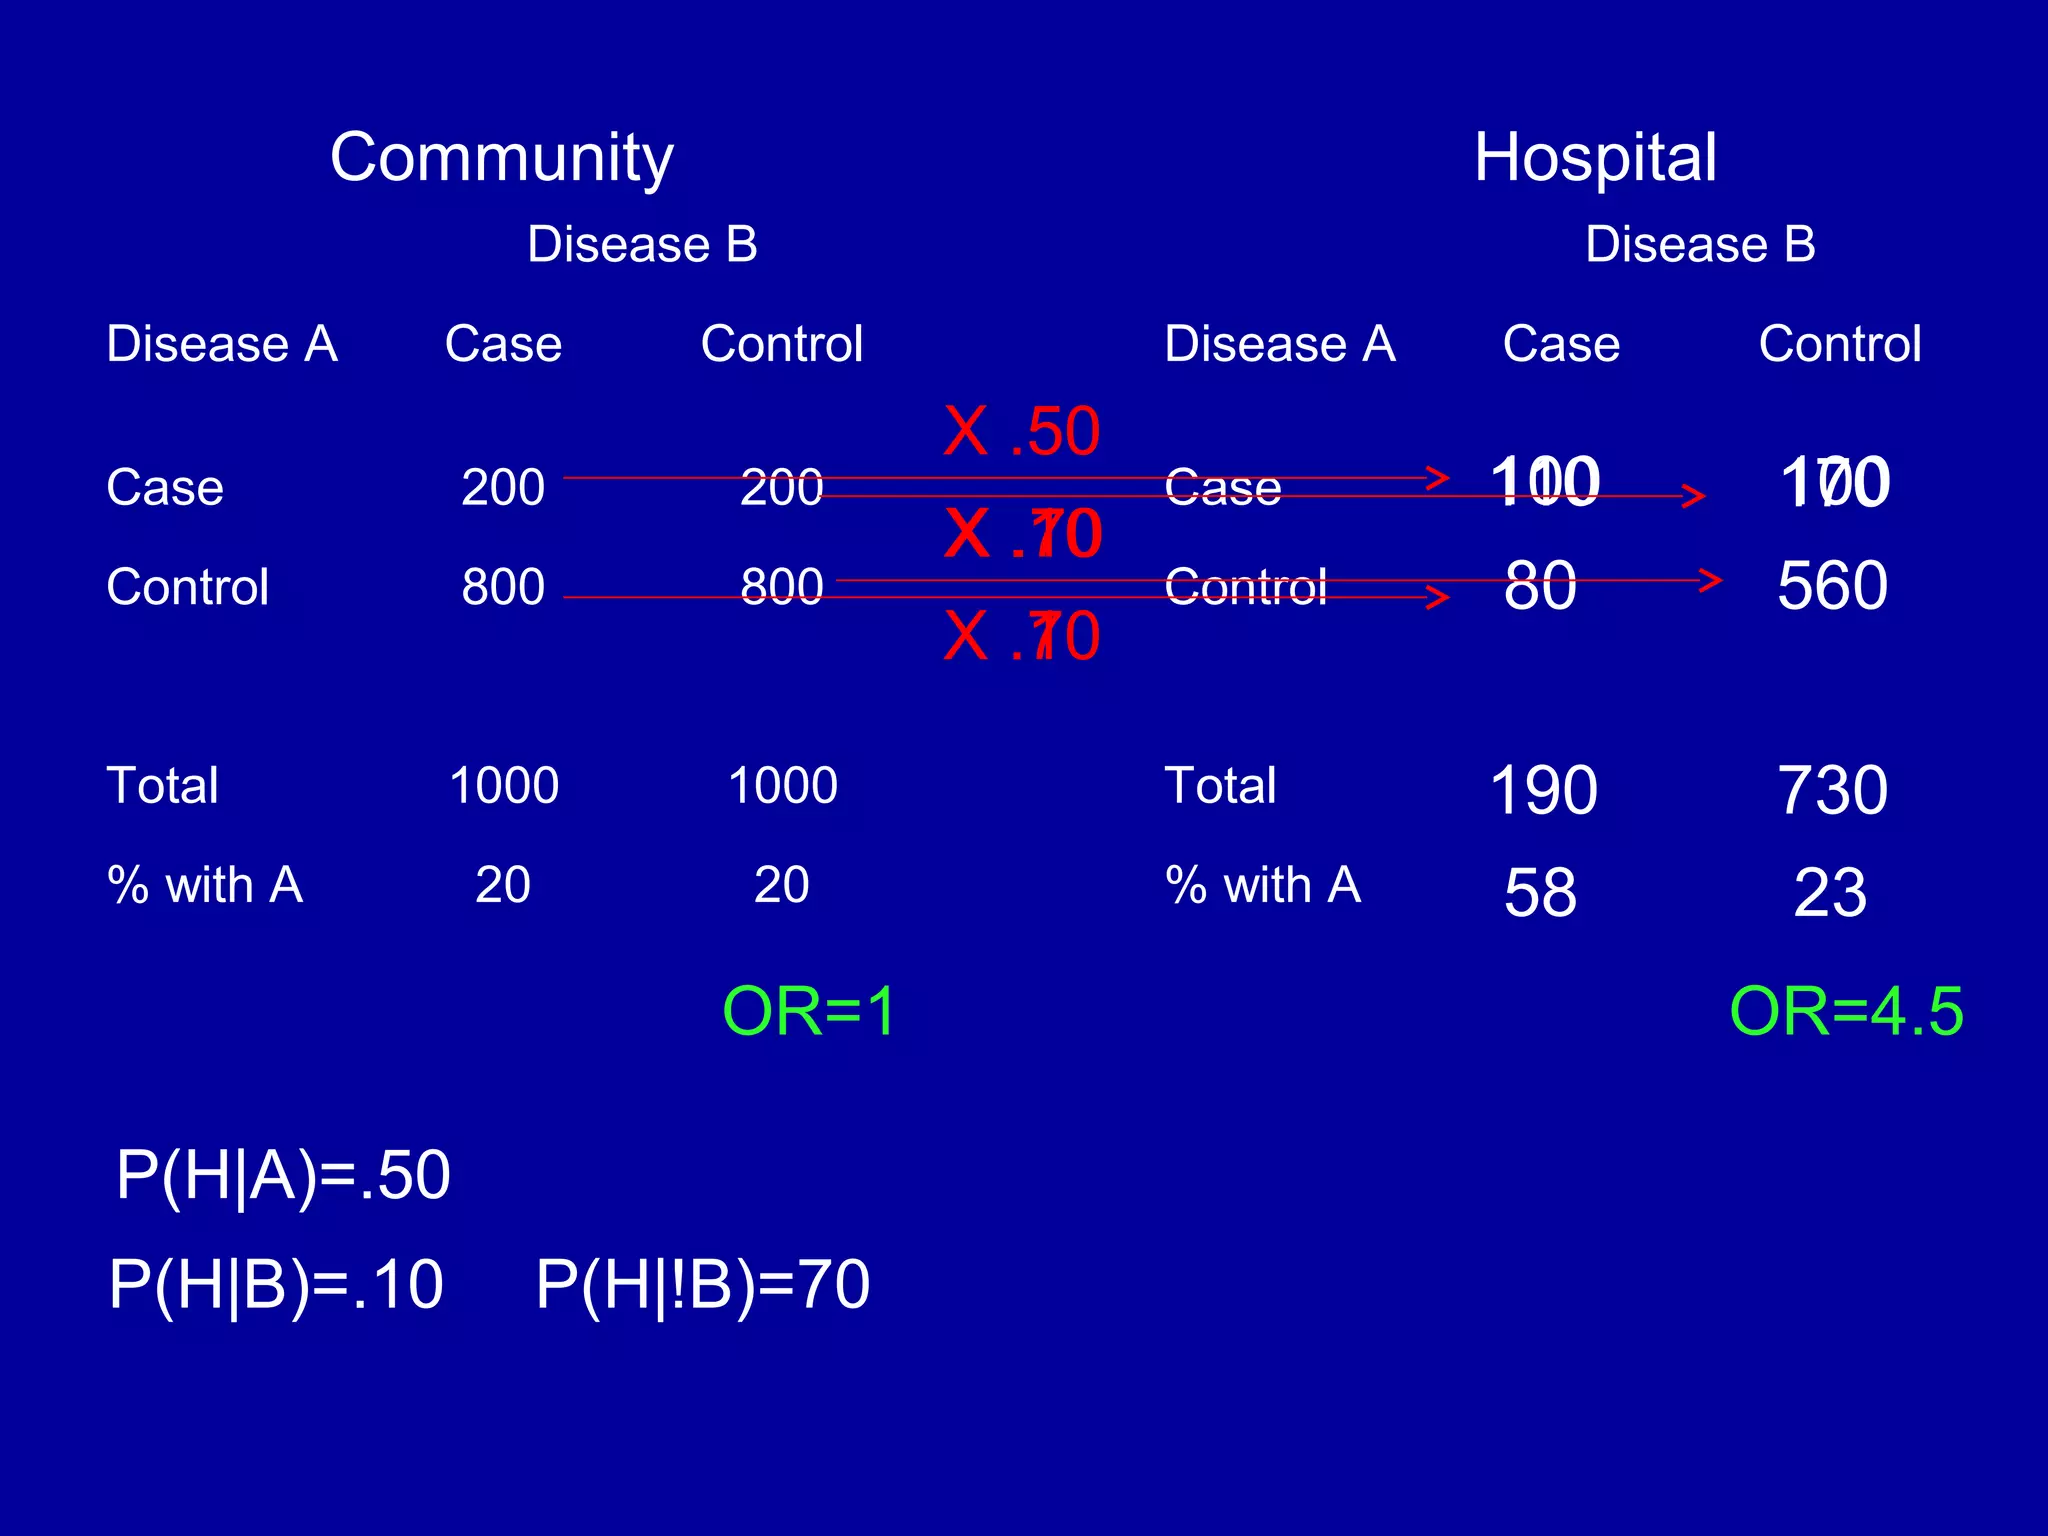
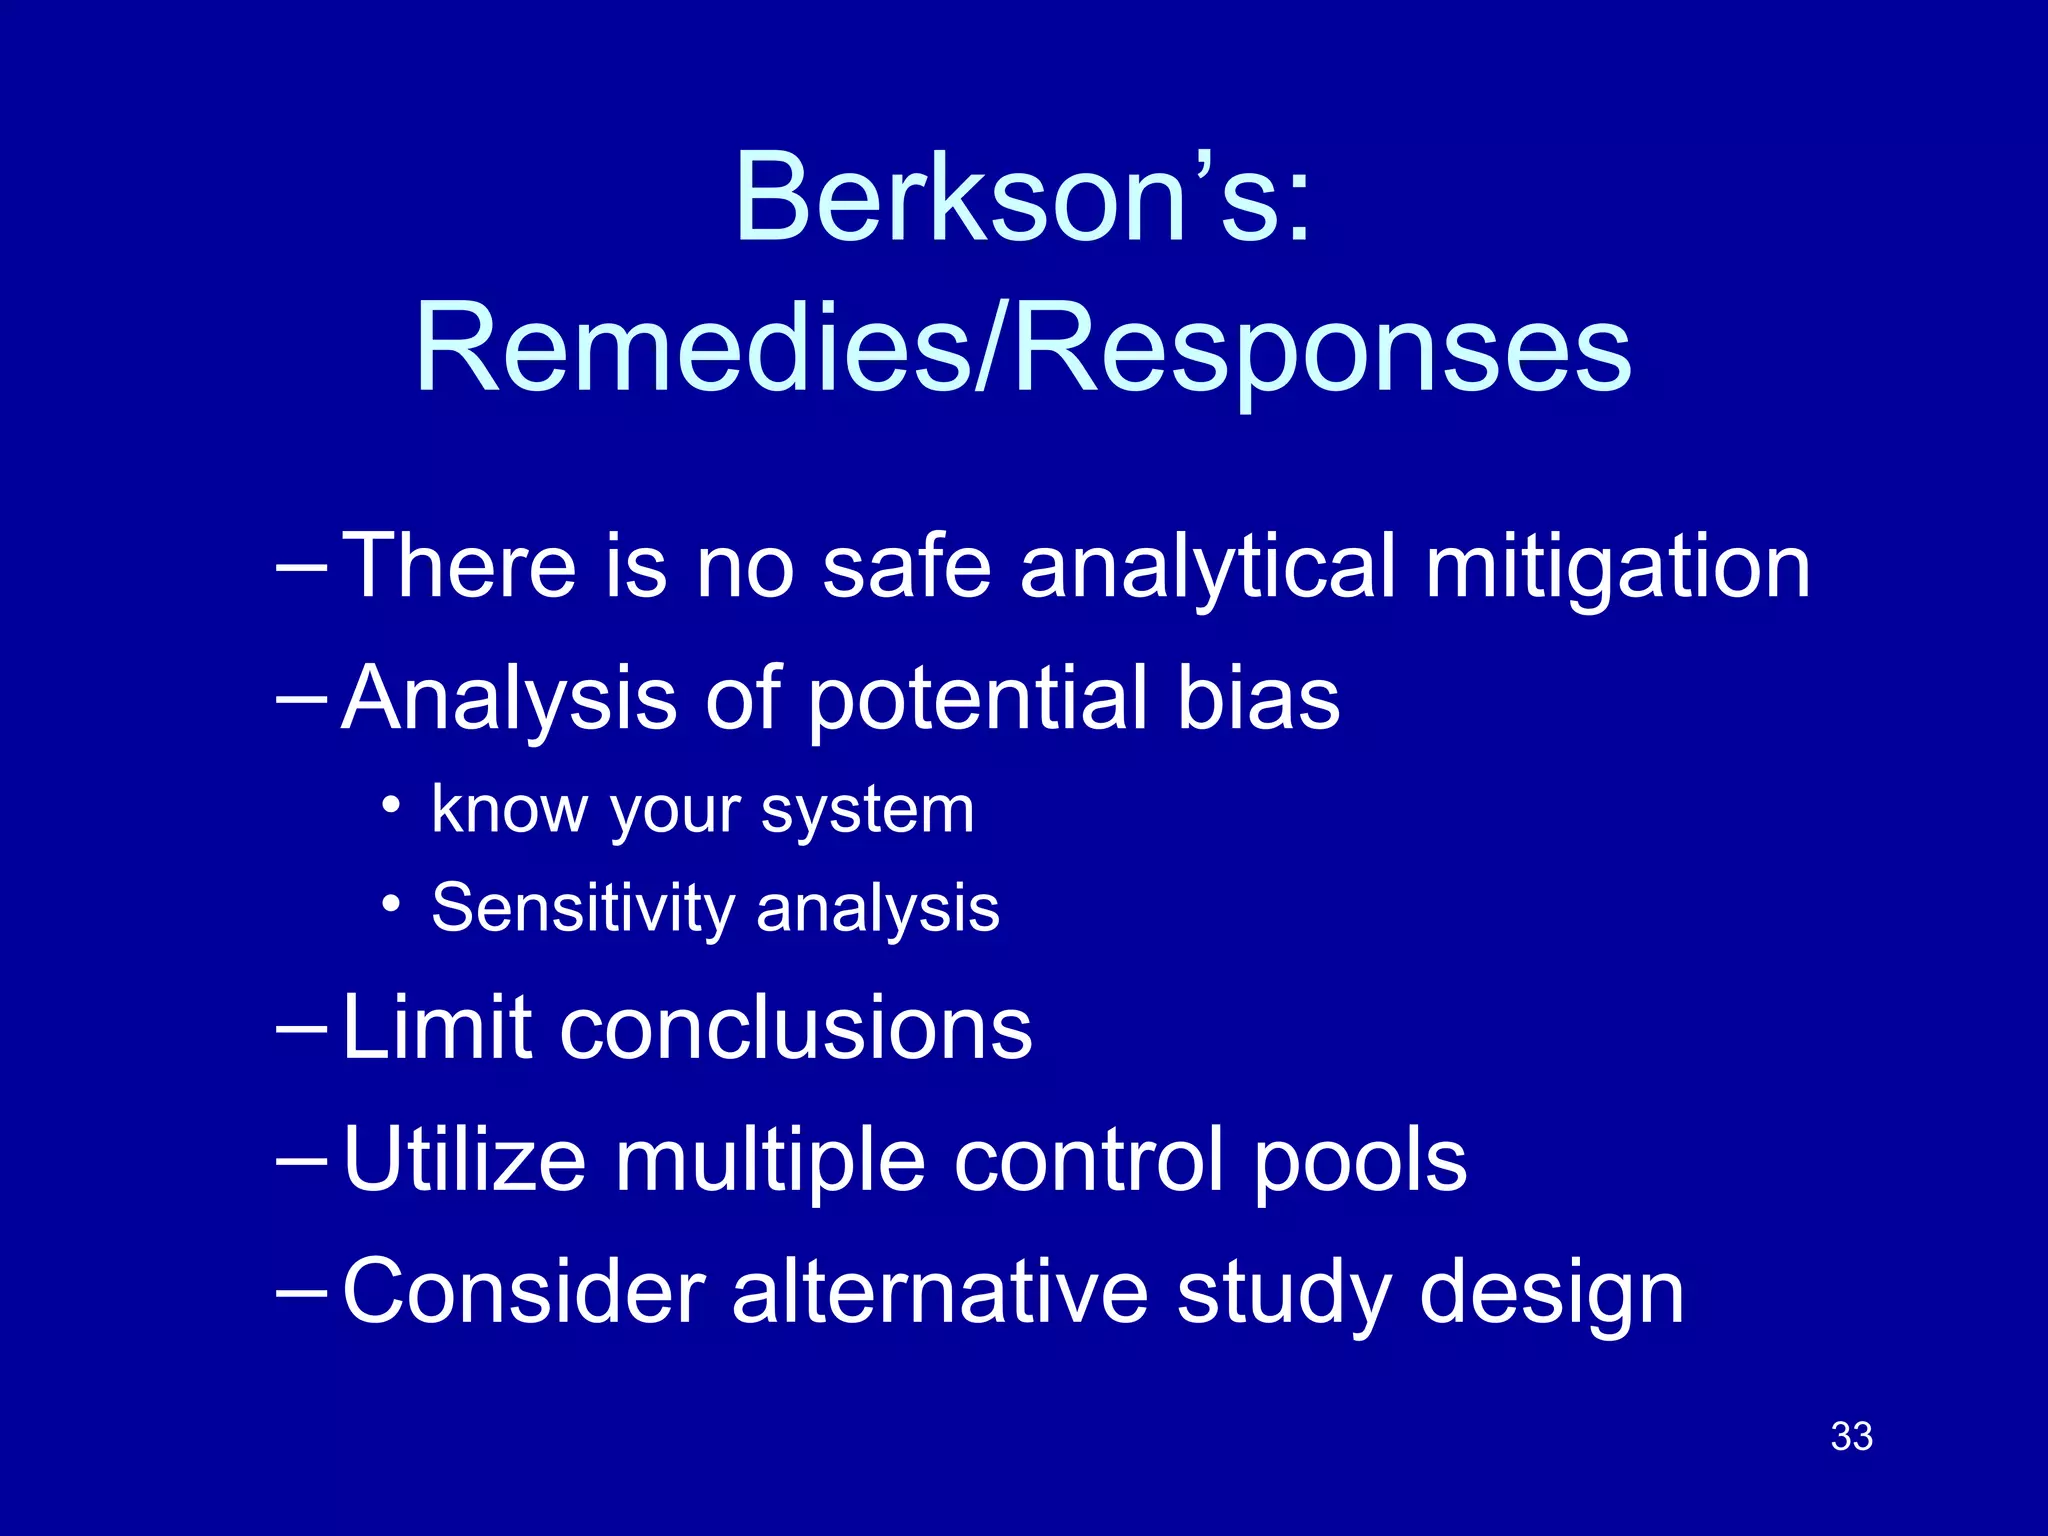


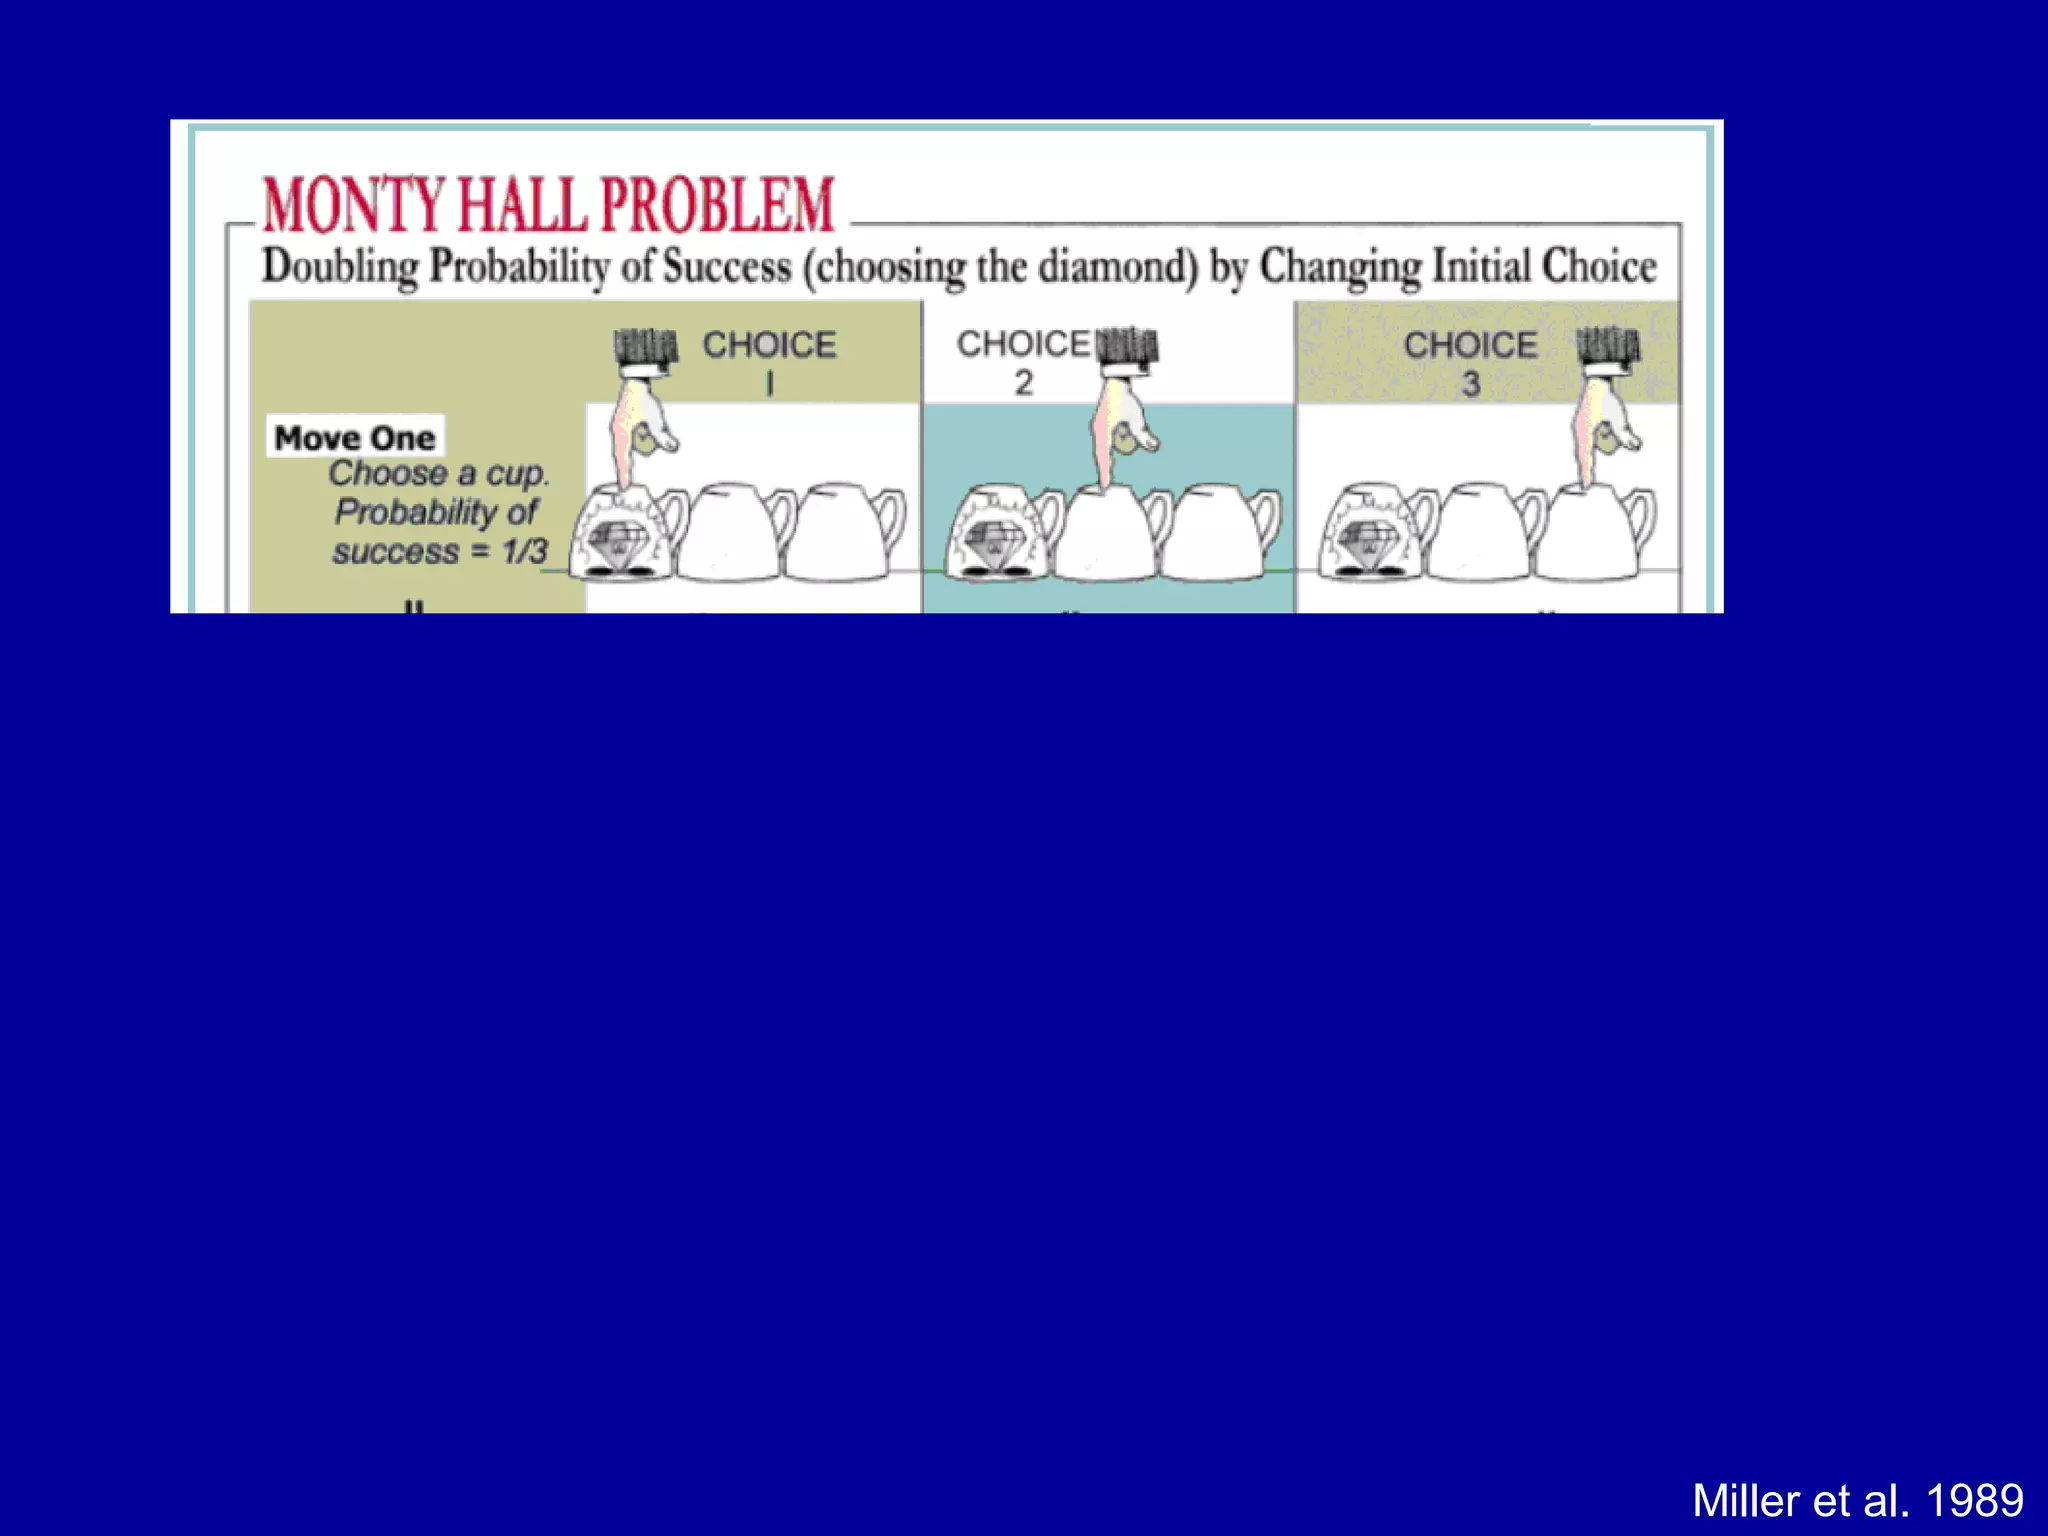
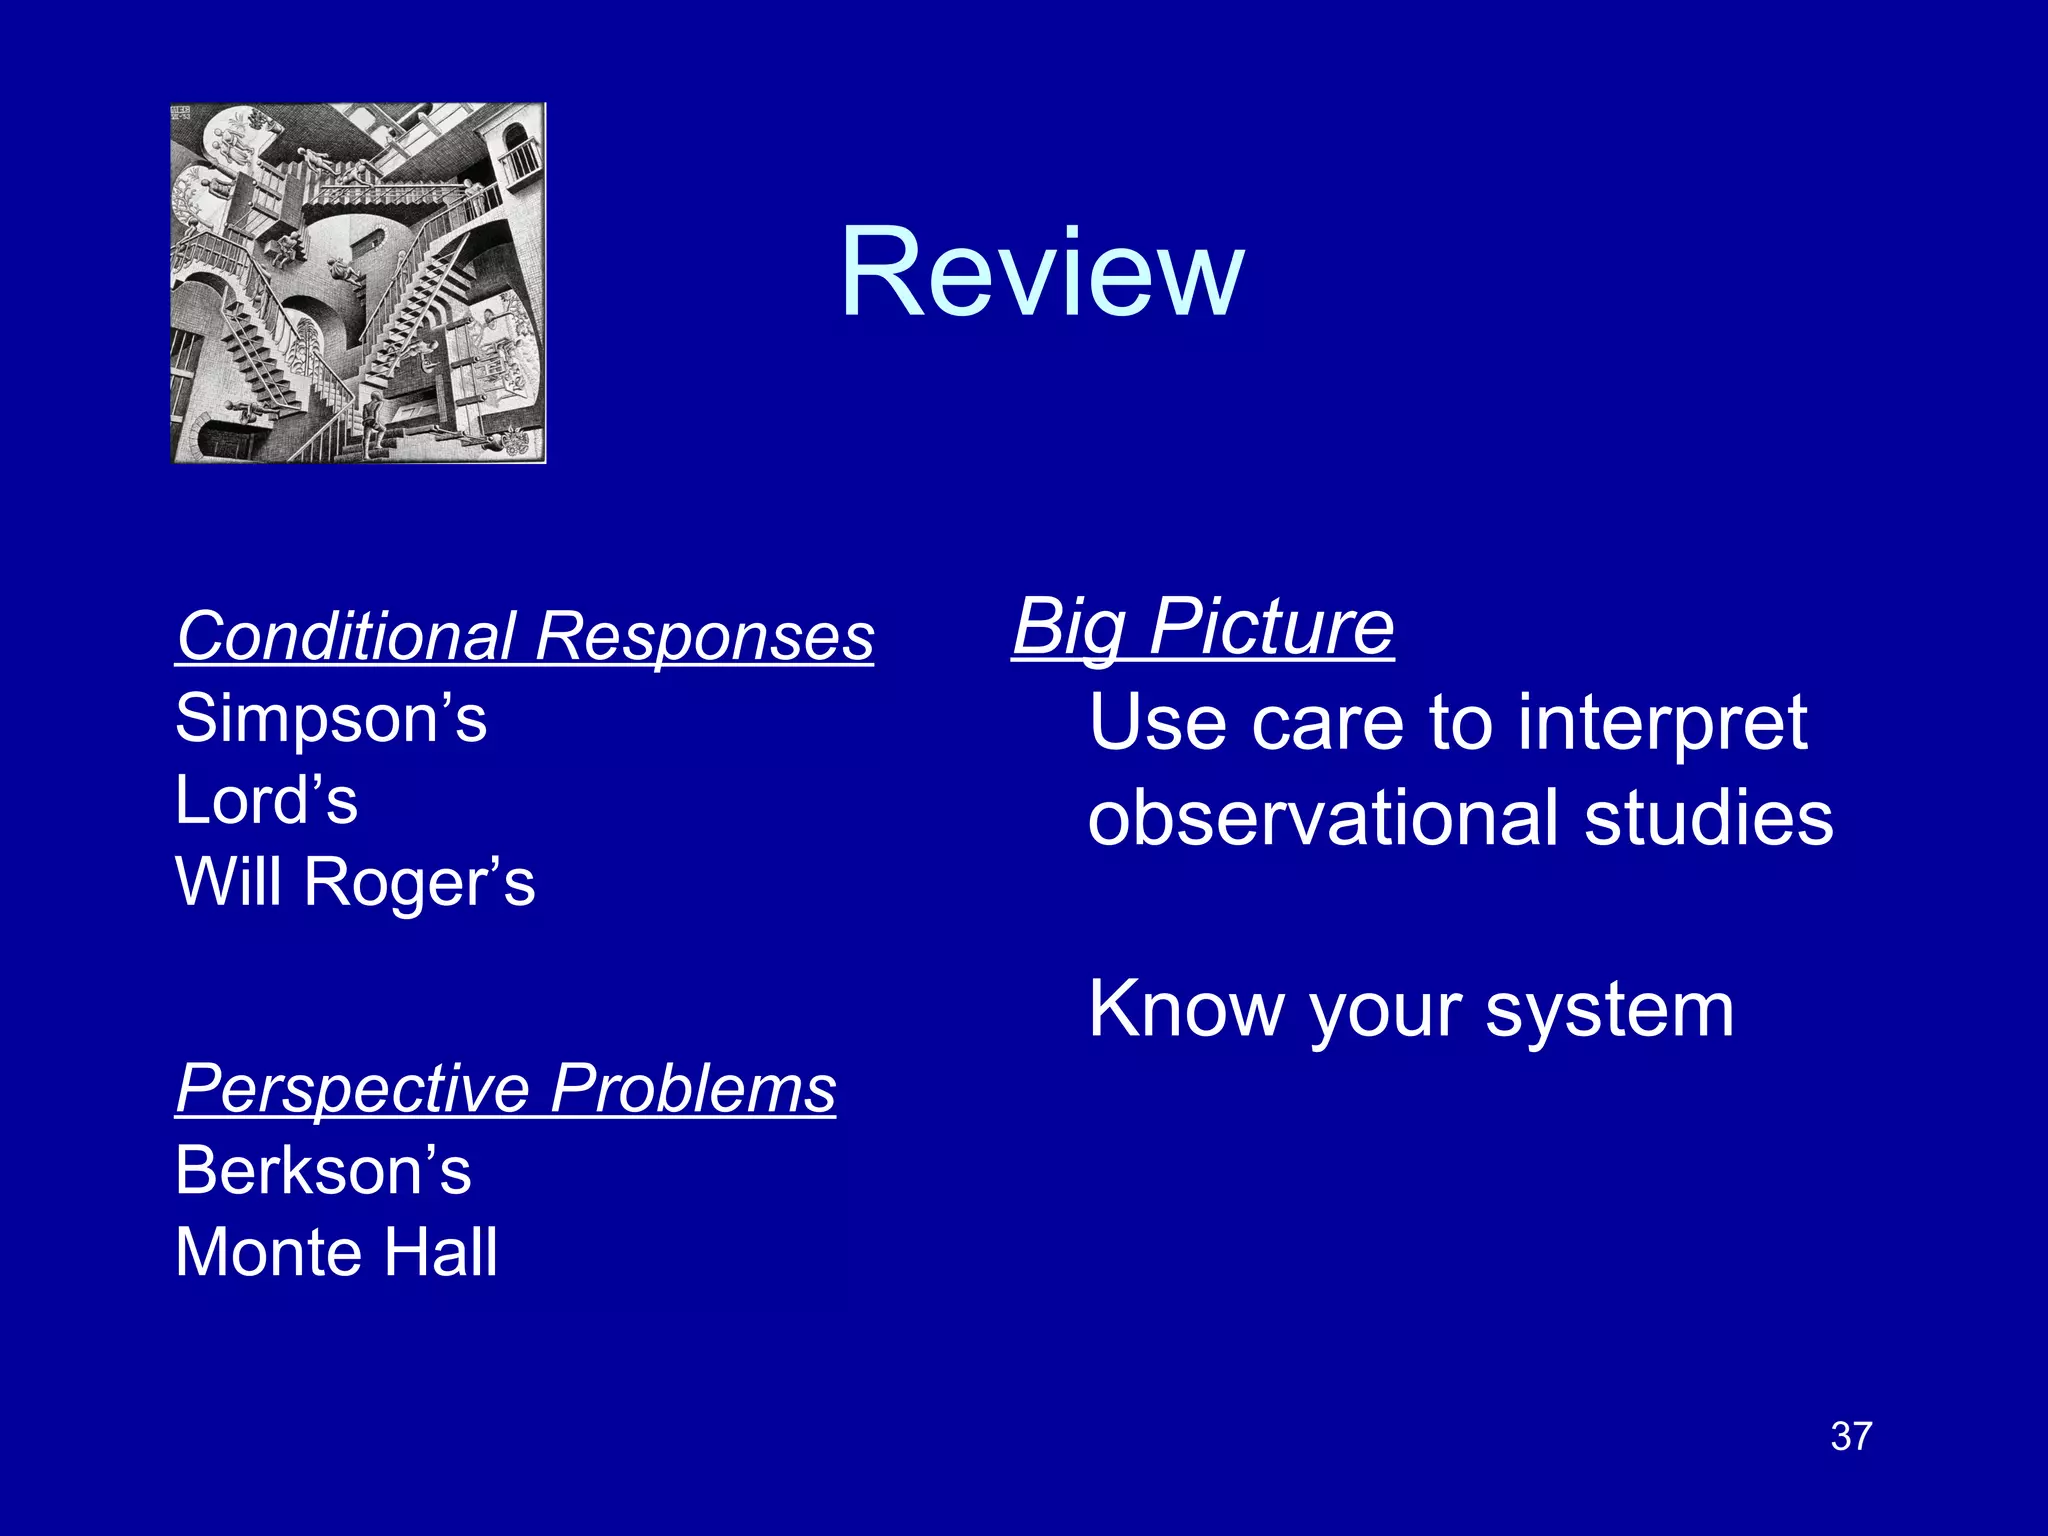


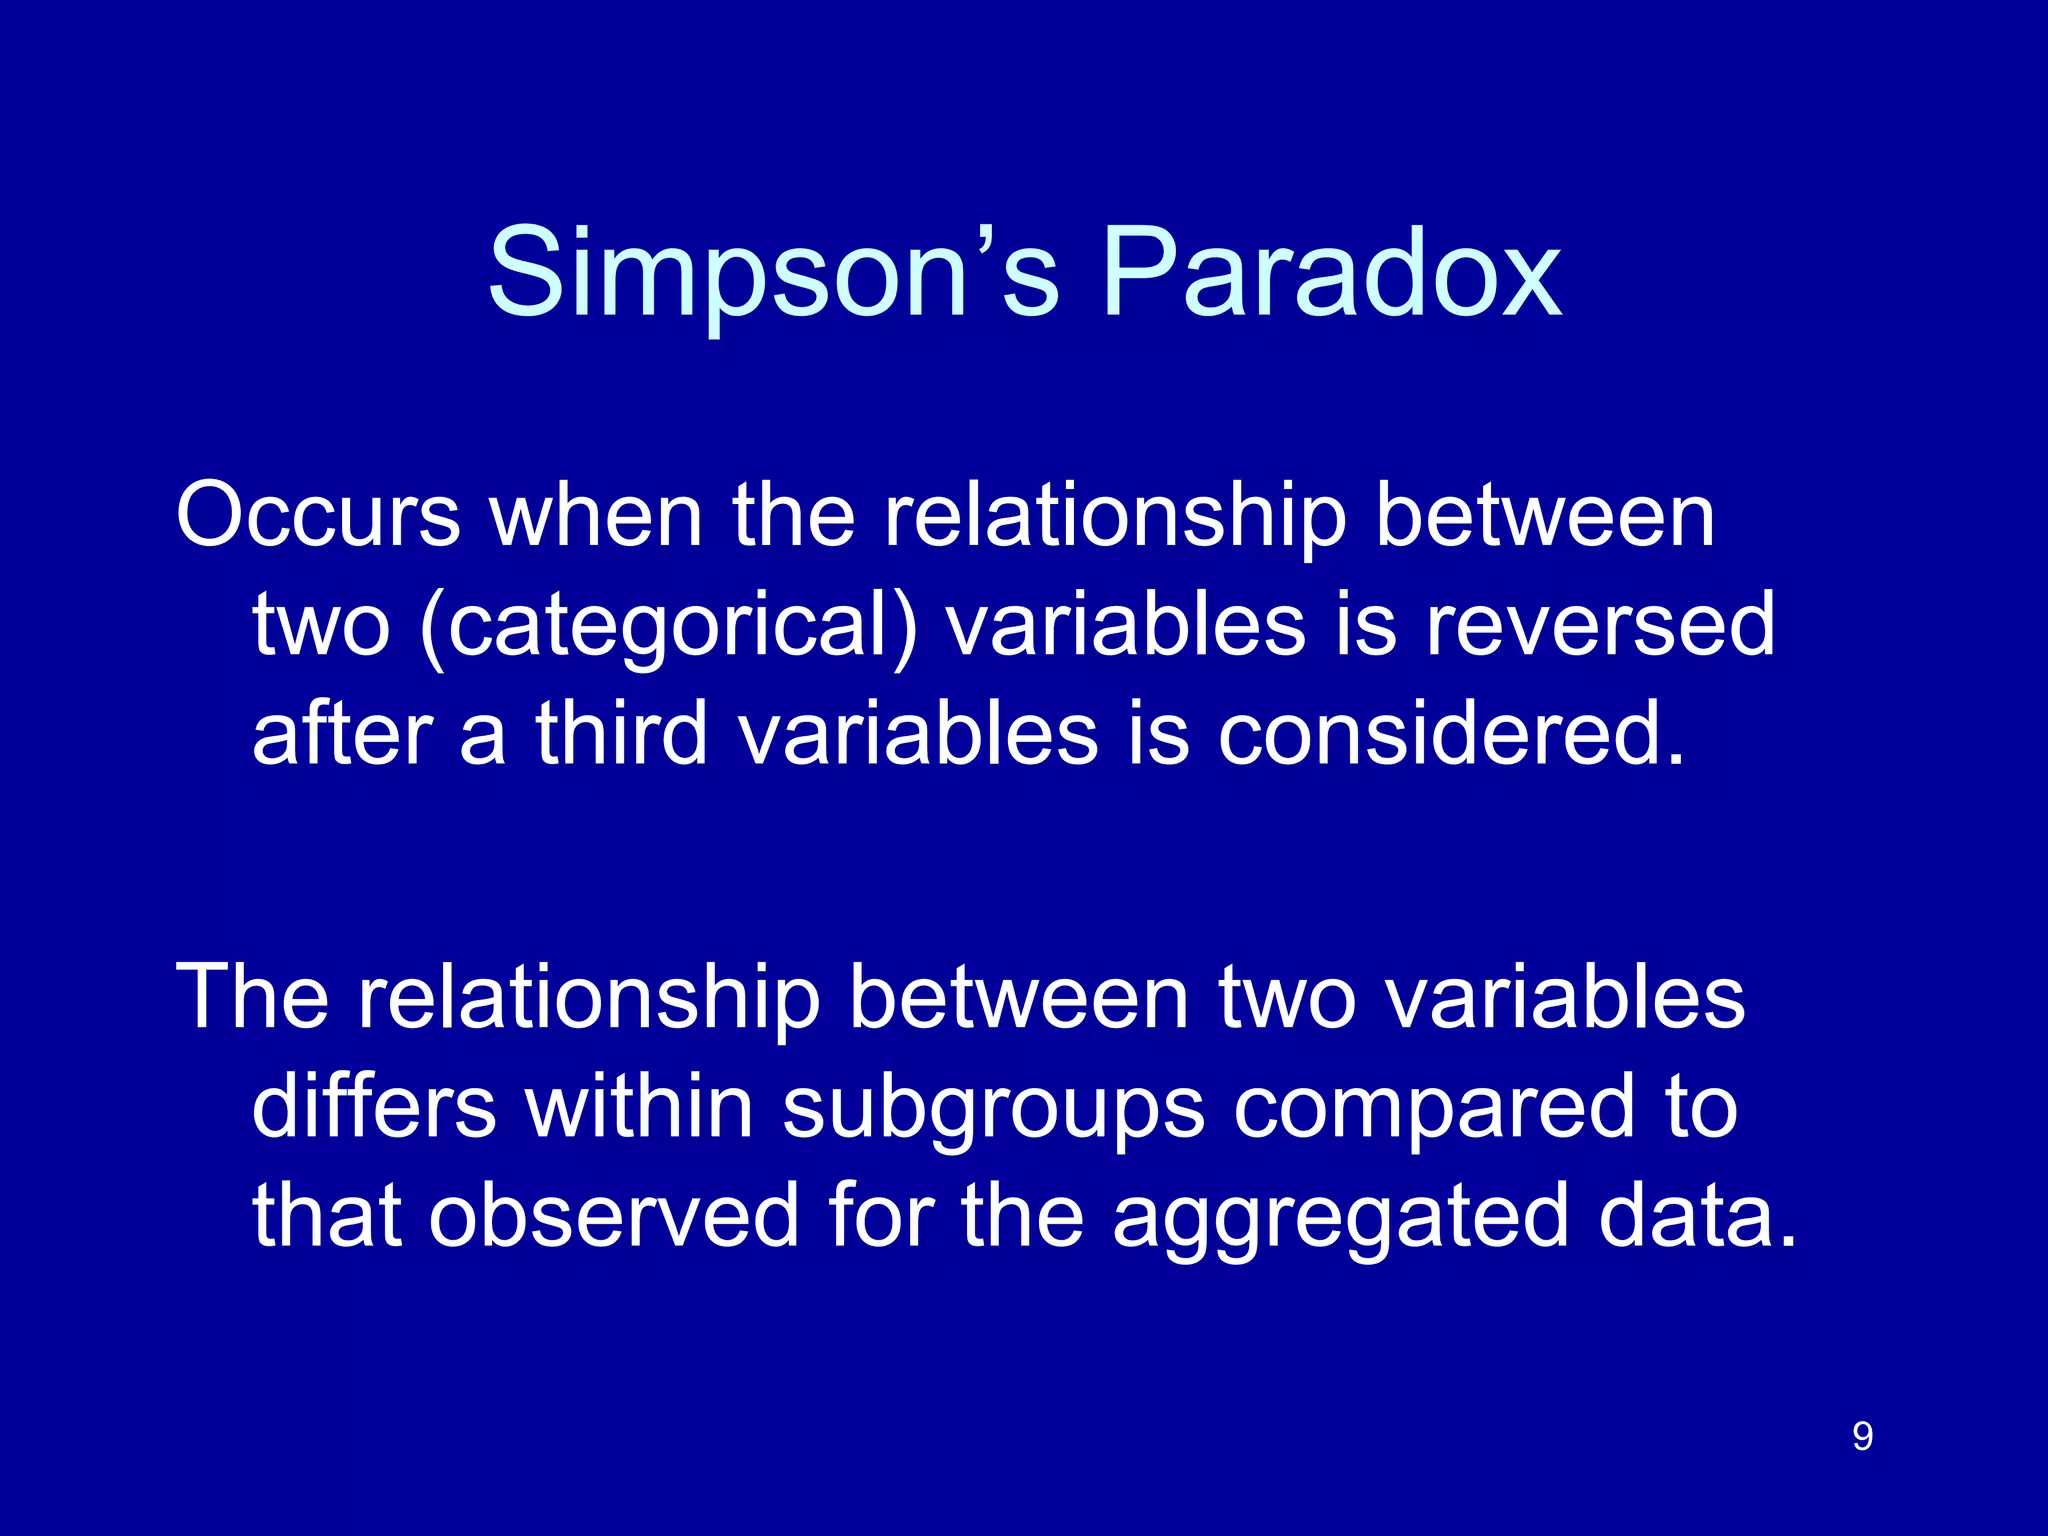
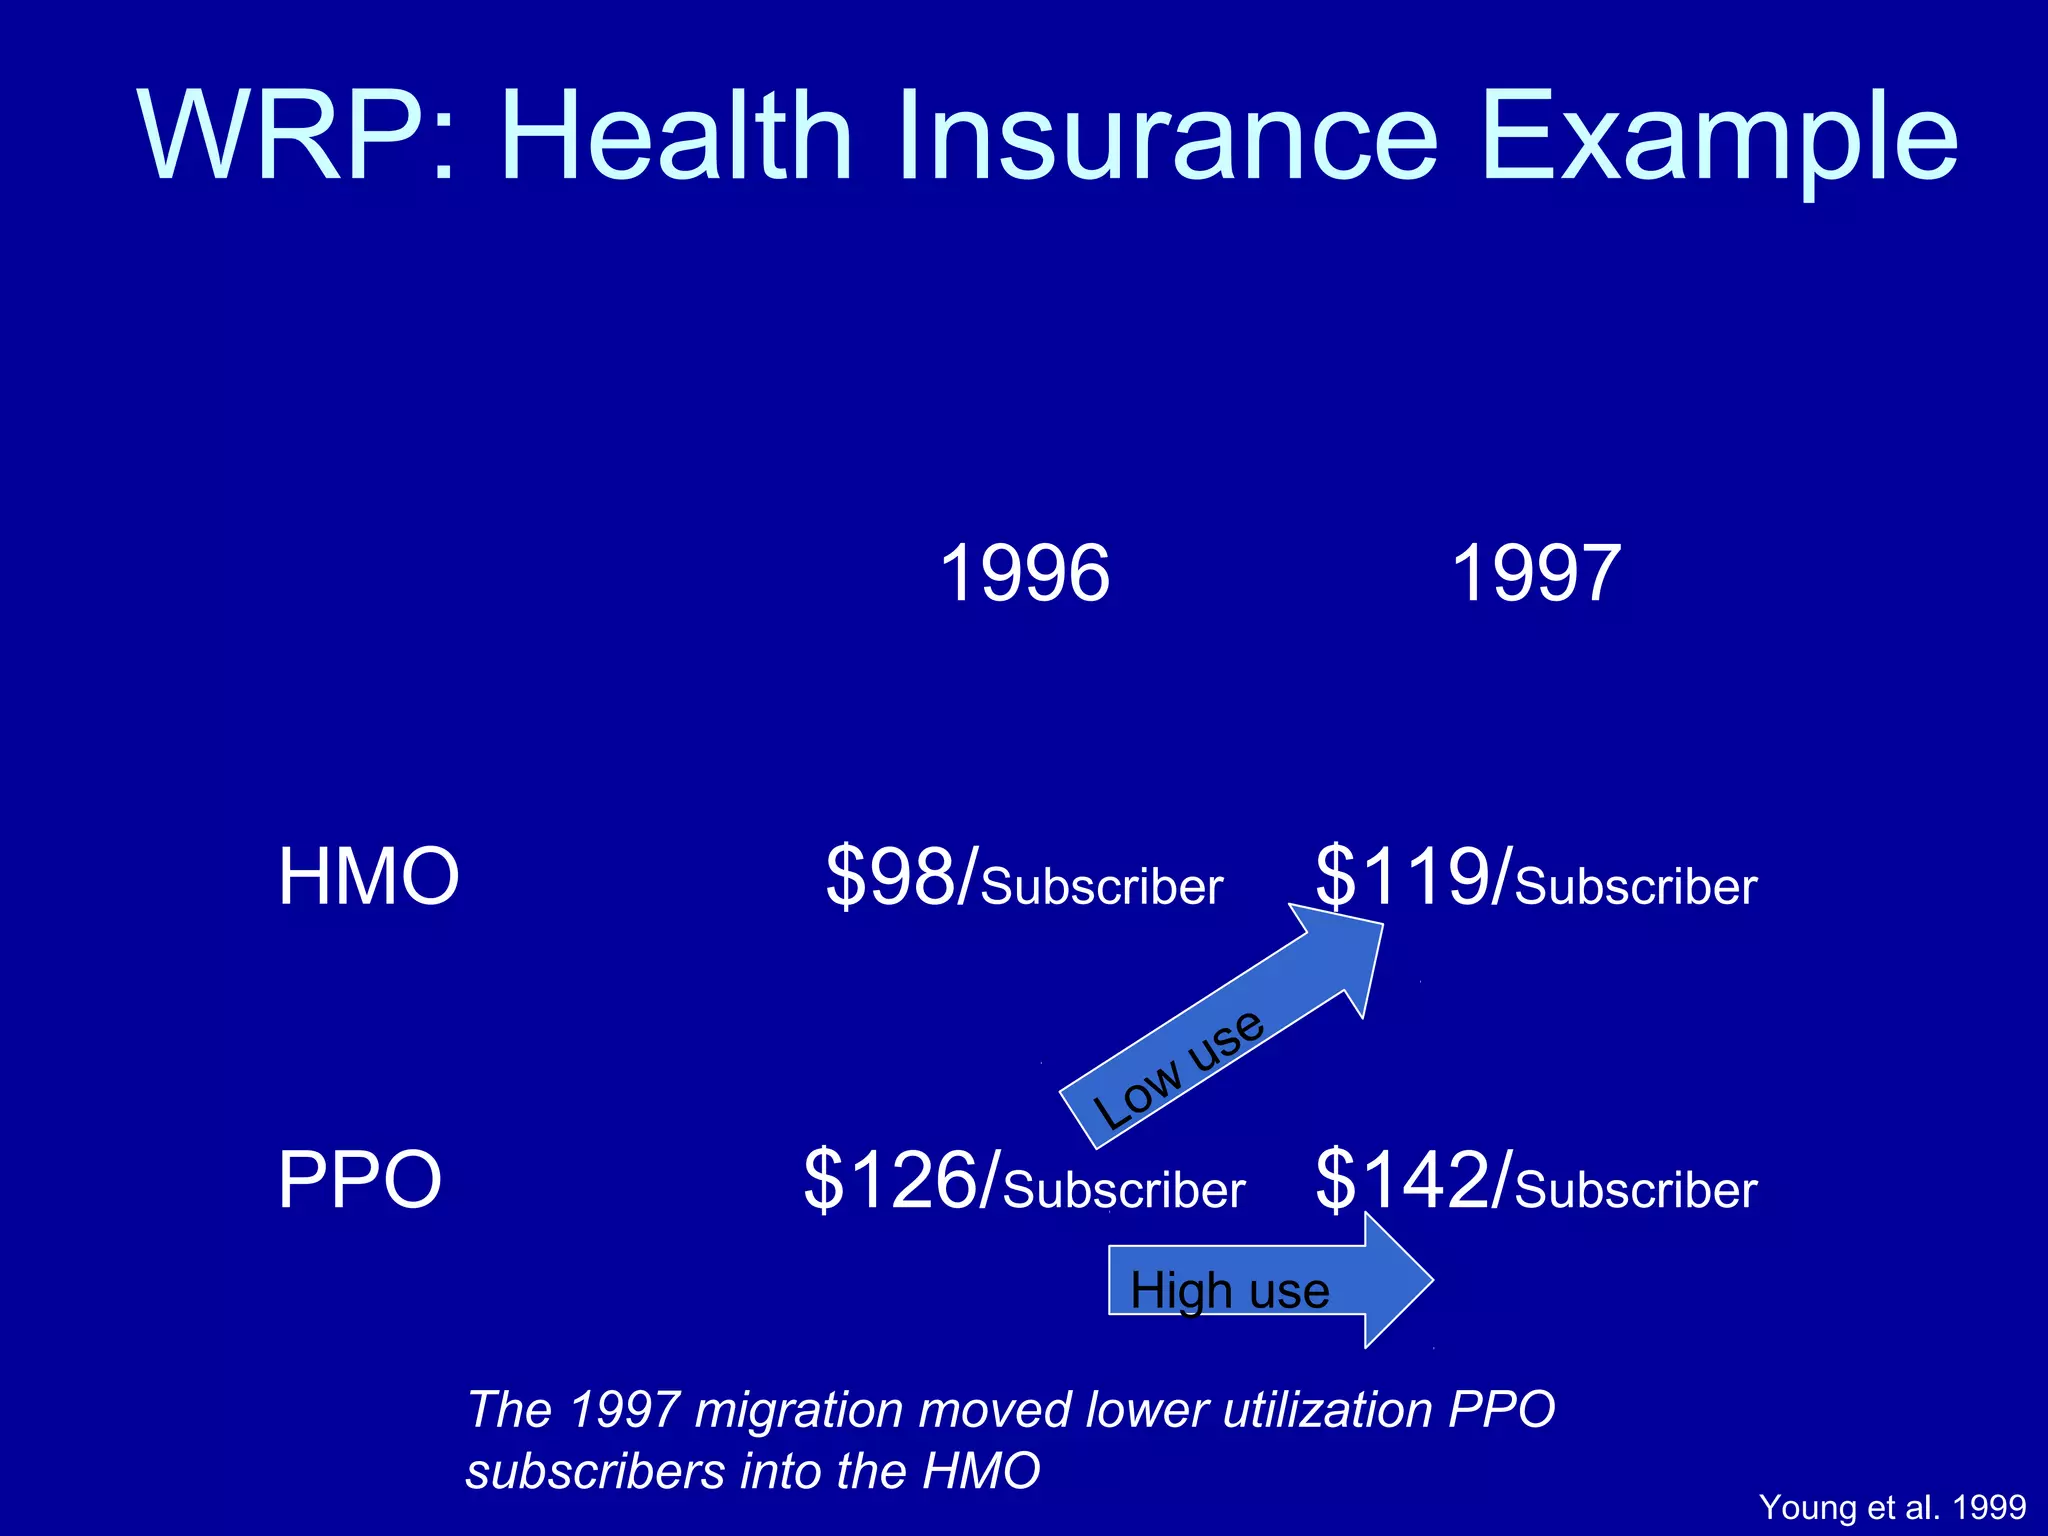
The document discusses several statistical paradoxes such as Simpson's Paradox, Will Rogers Paradox, Lord's Paradox, Berkson's Paradox, and the Monty Hall Problem, highlighting their implications in observational research. It provides definitions, outlines objectives for understanding these issues, and suggests remedies to mitigate their effects in statistical analysis. Additionally, it emphasizes the importance of proper study design and awareness of potential biases in interpreting data.