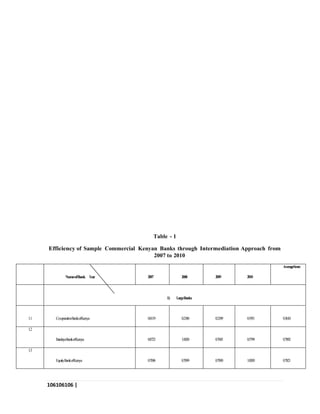
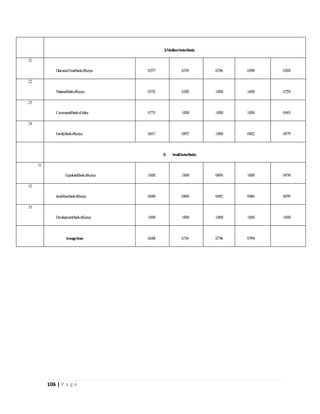
Oasis International Resource Centre
Vol. 1, Issue 1. pp. 98-106
D OI AIJMEG 2016 Africa International Journal of Management
ISSN 2518-0827 Education and Governance
Copy right © 2016
Kenyan Efficiency in Financial Sector after the Financial Crisis
1Dr. Isaiah Onsarigo Miencha 2Dr. Bichang’a Evans
1Head of the Department, Banking and Finance School of Business, All Nations University
Ghana Corresponding Author Email: drimiencha@anuc.edu.gh
2Lecturer Jomo Kenyatta University of Agriculture and Technology Eldoret Campus
ABSTRACT Received April 2016 Accepted May 2016
This study aims to find the efficiency of selected Kenyan sample commercial banks. As the
banking industry is the main sector that contributes significantly to the development of the
national economy and hence the efficiency of commercial banks gains significantly. The analysis
of the study, using intermediation approach, reveals the efficiency of Kenyan commercial
banks. However, the efficiency of sample banks showed inefficiency in some areas during the
study period. But small banks showed better efficiency scores during the study period.
Keywords: Banking, Data Envelopment Analysis, Kenyan Commercial Banks.
INTRODUCTION
Banking industry is the major contributor to
the economy of any country and hence the
efficiency of banks gains significantly. After
the Financial Crisis in 1997 and 2008, the
efficiency of Kenya’s commercial banks to
the Total Factor Productivity (TFP) growth
was sharply declining due to enormous
Non-Performing Loans (NPLs), stemming
from inappropriate lending to real estate
sector (borrowing short but lending long)
and the heavier repayment burden with
foreign currency liabilities (Central Bank of
Kenya-Bank Supervision Annual Report
2011).
However, after the Crisis, Kenya’s
commercial banks made profits and
regained peoples’ trust. Due to the
importance of commercial banks to the
Government, households and investors, the
profitability of banks is one of the most
important issues for research. Moreover,
people particularly the investors; expect
better performance and efficiency of
commercial banks under any circumstances.
Statement of the Problem
Banking efficiency is an important study for
policy makers and many others who rely on
100100100 |
P a g e
the banking sector. Therefore, the present
study investigates the efficiency of Kenyan
banking sector. Many firms in the service
industry face the problem of not producing
better results in terms of efficiency. In
particular, the last decade witnessed
continuous changes in regulation,
technology up gradation and competition in
the global financial services industry are no
exception to this. The efficiency in the
operation of banks has become an
important issue in Kenya. It is therefore
crucial to benchmark the performance of
banks operating in Kenya and hence this
study.
Literature Review
An attempt has been made in this section to
review the selected research work already
undertaken in the area of this study, in
order to understand the methodology
employed and the gaps in the research.
The efficiency of banking sector is one of the
most interesting economic issues for
economists all over the world. This is
evident from several attempts to investigate
the efficiency of commercial banks by a
number of economists, both in Kenya and
abroad. Charnes, Cooper and Rhodes (1978)
applied a nonlinear programming model to
measure the relative efficiency of Decision
Making Units (DMUs). A study by Haslem
et al., (1999) used Data Envelopment
Analysis to analyze the efficiency of U.S.
Banks operating internationally. It was
found that the management should focus on
overall efficiency but with particular
attention to inputs, especially cash and real
capital and to foreign loans among the
outputs. Saha and Ravisankar (2000) found
that Public Sector Banks (PSB) accounted for
about 85 percent of the Indian commercial
banking business and supported the DEA
Methodology to be useful and suitable for
rating the efficiency of Indian Banks. Casu
and Molyneux (2000) employed DEA to
investigate the efficiency in European
banking systems. The study examined
whether the productive efficiency of
European banking systems has been
improved and converged towards a
common European frontier.
Miencha and Selvam (2011) found that
private banks in Kenya performed well,
with better liquidity assets, compared to
public banks and foreign banks for the
growth of the economy. The study found
that banks have still a long way to go to
sustain their competitive success.
According to Joshi and Bhalerao (2011),
there was efficiency of major commercial
banks in India and most of the banks were
satisfactorily efficient. The average
performance of the banking sector ranges
above 80 percent, which indicates the
appropriate conversion of inputs into
outputs. The public and private sector are
equally efficient but the private sector has
an edge over the public sector.
Miencha et al., (2013) employed DEA to
investigate the efficiency in Kenyan
commercial banks. The study examined the
productive efficiency of Kenyan banking
systems has been improved and converged
towards a common the region frontier.
Miencha and Selvam (2013), in their study,
the managerial efficiency, off balance sheet
activities (non-traditional activities) and
101101101 |
P a g e
profitability were the most influential
determinants of Technical Efficiency.
The literature review reveals that with the
exception of a few, no comprehensive
effort has been made recently towards a
critical analysis of the efficiency level of the
Kenyan commercial banks. In this context,
the present study would be a significant
venture at analyzing the efficiency of
Kenyan Commercial Banks.
Objective of the Study
The present study examines the financial
efficiency of banks in Kenya using Data
Envelopment Analysis (DEA).
Hypotheses of the Study
The following two null hypotheses were
framed and tested for this study
NH1. There is no significant
difference in efficiency measurement
among Kenyan banking sector during the
study period
Methodology and Measurement
Sample Selection
As on March 31st 2008, there were totally 45
(5 Public Sector Banks, 28 Private Sector
Banks and 12 Foreign Sector Banks) in
Kenya. The present study covered only 10
Kenyan Commercial Banks, based on their
top performance i.e. three large banks, four
medium size banks, and three small banks.
Period of Study
The study period covered four years from
January 2007 to December 2010.
Sources of Data
This study was mainly based on secondary
data. The required data were collected
from Annual Report published by Central
Bank of Kenya, various reputed journals
and respective bank websites.
Data Envelopment Analysis
The Data Envelopment Analysis (DEA) is a
performance measurement technique used
for analyzing the relative efficiency of
productive units, having multiple inputs
and multiple outputs.
Efficiency
Weighted sum of Outputs
Weighted sum of Inputs
The present study suffers from the
following major limitations.
 The study examined the efficiency
of sample Kenyan Banks and not
their absolute efficiency.
 The study was based on only
secondary data.
Analysis of the Efficiency Sample
Commercial Kenyan Banks
For the purpose of this study, the analysis
of efficiency of sample commercial banks is
made below:
Efficiency of Sample Commercial
Kenyan Banks -Intermediation
Approach.
Efficiency of Sample Commercial Kenyan
Banks through Intermediation Approach
Table- 1 shows the analysis of efficiency of
commercial Kenyan banks through
intermediation approach. According to the
above Table, the average efficiency score of
sample commercial banks during 2007 –
2010 ranged from 0.6308 to 0.7994, which is
102102102 |
P a g e
fairly high but somewhat volatile and
lower than the average efficiency (0.6131 to
0.7508) by operation approach.
It is to be noted that in 2007, the average
efficiency for all sample banks was at
0.6308. Only two commercial banks,
namely, Development Bank of Kenya and
Equatorial Bank of Kenya were considered
efficient as these banks’ efficiency score
was 1.0000, whereas the other eight
commercial banks (Cooperative Bank of
Kenya, Barclays Bank of Kenya, Equity
Bank of Kenya, Diamond Trust Bank of
Kenya, National Bank of Kenya,
Commercial Bank of Africa-Kenya, Family
Bank and Jamii Bora Bank of Kenya) were
less efficient under the efficiency frontier. It
is to be noted from the analysis of the
above Table that the Cooperative Bank had
to raise its output by 18.81 percent,
Barclays Bank of Kenya by 12.77 percent,
National Bank of Kenya by 42.67 percent,
Equity Bank by 29.04 percent, Commercial
Bank by 22.67 percent, Family Bank of
Kenya by 34.83 percent and Jamii Bora
Bank by 34.31 percent for reaching
efficiency, with the same amount of input.
The Diamond Trust Bank was the least
efficient bank in 2007, with the efficiency
score of 0.2577, indicating that it had to
increase its output by 74.23 percent, with
the same amount of input.
According to the analysis of data for the
year 2008, the average efficiency for all
sample commercial banks increased to
0.7341 in 2008 from 0.6308 in 2007. The four
commercial banks, namely Barclays Bank
of Kenya, Development Bank of Kenya,
Equatorial Bank of Kenya and Commercial
Bank of Africa-Kenya were considered
efficient as their efficiency score was
1.0000. The Equity Bank of Kenya, Family
Bank of Kenya and Jamii Bora Bank of
Kenya, with an efficiency score of 0.7096,
0.8975, and 0.9693 respectively, had to
increase their output by 29.04, 1.25 and 3.07
percent respectively, with the same
amount of input. The Cooperative Bank of
Kenya and National Bank of Kenya were
the least efficient banks in 2008, with the
efficiency score of 0.2180 and 0.3283
respectively, indicating that they had to
raise their outputs by 78.20 and 67.17
percent respectively, to be regarded
efficient banks.
It is understood from the above Table that
the average efficiency for all sample
Kenyan commercial banks, through
intermediation approach, increased from
0.7341 in 2008 to 0.7746 in 2009. However,
there were four commercial banks which
were considered to be efficient. Those were
Development Bank of Kenya, National
Bank of Kenya, Commercial Bank of Africa
and Family Bank of Kenya whose
efficiency scores were exactly 1.0000. It is
to be noted that Cooperative Bank of
Kenya and Diamond Trust Bank of Kenya
were the least efficient in 2009. They had to
raise their output by 78.11 and 72.34
percent respectively, to be considered
efficient bank. The Barclays Bank of Kenya,
Equatorial Bank of Kenya, Equity Bank of
Kenya and Jamii Bora Bank of Kenya had
also produced their outputs under the
efficiency frontier, with the efficiency
scores of less than 1.0000, that is, 0.7045,
0.8918, 0.7090 and 0.9452 respectively,
indicating that these banks had to increase
their output by 29.56, 10.82, 29.10 and 5.48
103103103 |
P a g e
percent, respectively, with the same
amount of input.
It is observed from the above Table that in
2010, the average efficiency score via
intermediation approach for all sample
Kenyan Commercial Banks increased from
0.7746 in 2009 to 0.7994 in 2010. It is to be
noted that out of ten sample commercial
banks of Kenya, five of the commercial
banks, namely, Development Bank of
Kenya, Equatorial Bank of Kenya, National
Bank of Kenya, Equity Bank of Kenya and
Commercial Bank of Africa- Kenya were at
efficient zone, with an efficiency score of
exactly 1.0000. But two banks, Family Bank
of Kenya and Jamii Bora Bank of Kenya,
earned an efficiency score of 0.9622 and
0.9466 respectively, indicating that they
should increase their output by 3.78 and
5.34 percent respectively. It is shocking to
note that the Cooperative Bank of Kenya,
Barclays Bank of Kenya and Diamond
Trust Bank of Kenya, as observed from
above Table, were considered the least
efficient as their efficiency scores were at
0.1951, 0.5799 and 0.3098 respectively,
indicating that they should increase their
output by 80.49, 42.01 and 79.02 percent,
without increasing the amount of the input
in 2010.
The performance analysis of individual
banks through intermediation approach
during the period from 2007 to 2010 clearly
indicates that no commercial bank
considered efficient in all the years of the
study period. However, few sample banks,
namely, Barclays Bank of Kenya,
Development bank of Kenya, Equatorial
Bank of Kenya, Commercial Bank of
Africa, Family Bank of Kenya and Jamii
Bora Bank of Kenya were efficient in some
years, with the average efficiency score of
0.7892, 1.0000, 0.9730, 0.9433, 0.8779 and
0.8795 respectively. It is important to note
here that two banks, namely, Cooperative
Bank of Kenya and Diamond Trust Bank of
Kenya, were considered the least
performing banks with an average
efficiency score of 0.3610 and 0.2658
respectively from 2007 to 2010.
According to the results in Table - 1, it is
clearly understood that Kenyan
Commercial Banks taken for the study
were less efficient, with a fair efficiency
ranging from 0.6308 to 0.7994 under the
Intermediation Approach and 0.6132 to
0.7508 under Operation Approach.
The reason for the lower efficiency score
earned by sample Kenyan banks taken for
this study was probably the impact of
Financial Crisis in 1997 and 2008. Besides,
it is to be noted that prior to the Crisis,
every commercial bank in Kenya had lent
inappropriately to real estate business
(borrowing for short term but lending for
long term), which created enormous
amount of Non-Performing Loans (NPLs).
Conclusion
It is to be noted that the efficiency of
sample Kenyan Banks should be
improved. Few suggestions for improving
the efficiency of the sample Kenyan Banks
like they need to implement the policy of
'Know Your Customer', which would help
the banks to improve the business and the
probability of recovering the loans and
decreasing the risks in operations.
Secondly, instead of setting up permanent
104104104 |
P a g e
branches in remote areas, it is always
better to provide banking services through
Self Help Groups in such areas, by
identifying suitable and committed
persons and thus enabling banks to save
enormous human and monetary expenses.
Lastly, interacting with people for the
purpose explaining bank products to them,
and convincing them that banks are
committed towards development of people
rather than mere profits for banks, would
lead the people to access banking services
to the maximum, particularly in rural areas
where people still feel that the banks are
just organized moneylenders.
References
Miencha I. O. and Selvam
M. (2011) “The Performance Efficiency of
Commercial Banks in Kenya”, Competency
Building Strategies in Business and
Technology, 5th ed.945- 952
(Chennai: Masilamani Pathippagam
Chennai).
Saha A. ,2008 “Performance Indicators of
Banking Sector in Bangladesh: A
Comparative Overview
of NCBs, PCBs, SCBs, and FCBs”,
SMART Journal of Business Studies
4(1): 1 – 9.
Casu B and Molynuex P, 1998 “A
Comparative Study of Efficiency in
European Banking”, Center for
Financial
Institutions working papers, Wharton
School
Center for Financial Institutions,
University of Pennsylavania 35 (3): 1865-
1876.
Chansarn S, 2007 “The Efficiency in Thai
Financial Sector after the Financial
Crisis”The Economic Journal of Review 6
(10):54 – 68.
Charnes A, Cooper W. W. and Rhodes E
1978 “Measuring the Efficiency of
Decision
Making Units”,European Journal of
Operational Research 2 (10):429 - 444.
Halkos G and Salamouris D 2001 “
Efficiency Measures of the Greek
Banking
Sector: A Non-Parametric Approach for
the
period 1997 – 1999”,Munich Personal
RePec Archive 8 (6): 165 - 182.
Miencha O. I .and Murugesan S. (2011),
Financial Performance in Banking
Sector: A Study with Special
Reference to Kenyan Commercial
Banks
Using Data Envelopment Analysis
(DEA).
Research Journal of Social Sciences and
Management, 2(9), 48-53.
Miencha J. O, Murugesan
Selvam, Rajesh Ramkumar, and
Karpagam
V. (2013) Relative Efficiency of Kenyan
Commercial Banks, Journal of
International Business Management,7(3),
142-150.
Miencha I. O, Murugesan
Selvam,Vinayagamoorthi Vasanth,
Kasilingam Lingaraja and Mariappan
Raja
(2015), Efficiency Measurement of Kenyan
Commercial Banks, Mediterranean Journal of
Social Sciences, 6(4), 621 – 631.
Doi:10.5901/mjss.2015.v6n4s2p621
Rangakakulnuwat P. 2007. Technical
Efficiency of Thai Commercial Banks
between 2002 and 2005 .The UTCC
Journal,
24 (1): 129 - 138.
Supachet Chansarn2008 The Relative
Efficiency of Commercial Banks in
Thailand ,International Research Journal
of
Finance and Economics18(10):53 – 68.
Websites
www.cbk.co.ke
105105105 |
P a g e
www.barclaysbank.co.ke
106106106 |
P a g e
Table - 1
Efficiency of Sample Commercial Kenyan Banks through Intermediation Approach from
2007 to 2010
NameofBank Year 2007 2008 2009 2010
AverageScore
1) LargeBanks
1.1 Co-operativeBankofKenya 0.8119 0.2180 0.2189 0.1951 0.3610
1.2
BarclaysBankofKenya 0.8723 1.0000 0.7045 0.5799 0.7892
1.3
EquityBankofKenya 0.7096 0.7099 0.7090 1.0000 0.7821
2)MediumSectorBanks
2.1
DiamondTrustBankofKenya 0.2577 0.2191 0.2766 0.3098 0.2658
2.2
NationalBankofKenya 0.5733 0.3283 1.0000 1.0000 0.7254
2.3
CommercialBankofAfrica 0.7733 1.0000 1.0000 1.0000 0.9433
2.4
FamilyBankofKenya 0.6517 0.8975 1.0000 0.9622 0.8779
3) SmallSectorBanks
3.1
EquatorialBankofKenya 1.0000 1.0000 0.8918 1.0000 0.9730
3.2
JamiiBoraBankofKenya 0.6569 0.9693 0.9452 0.9466 0.8795
3.3
DevelopmentBankofKenya 1.0000 1.0000 1.0000 1.0000 1.0000
AverageScore 0.6308 0.7341 0.7746 0.7994
106 | P a g e

Kenyan efficiency-in-financial-sector-after-the-financial-crisis-edited-1

  • 1.
    Oasis International ResourceCentre Vol. 1, Issue 1. pp. 98-106 D OI AIJMEG 2016 Africa International Journal of Management ISSN 2518-0827 Education and Governance Copy right © 2016 Kenyan Efficiency in Financial Sector after the Financial Crisis 1Dr. Isaiah Onsarigo Miencha 2Dr. Bichang’a Evans 1Head of the Department, Banking and Finance School of Business, All Nations University Ghana Corresponding Author Email: drimiencha@anuc.edu.gh 2Lecturer Jomo Kenyatta University of Agriculture and Technology Eldoret Campus ABSTRACT Received April 2016 Accepted May 2016 This study aims to find the efficiency of selected Kenyan sample commercial banks. As the banking industry is the main sector that contributes significantly to the development of the national economy and hence the efficiency of commercial banks gains significantly. The analysis of the study, using intermediation approach, reveals the efficiency of Kenyan commercial banks. However, the efficiency of sample banks showed inefficiency in some areas during the study period. But small banks showed better efficiency scores during the study period. Keywords: Banking, Data Envelopment Analysis, Kenyan Commercial Banks. INTRODUCTION Banking industry is the major contributor to the economy of any country and hence the efficiency of banks gains significantly. After the Financial Crisis in 1997 and 2008, the efficiency of Kenya’s commercial banks to the Total Factor Productivity (TFP) growth was sharply declining due to enormous Non-Performing Loans (NPLs), stemming from inappropriate lending to real estate sector (borrowing short but lending long) and the heavier repayment burden with foreign currency liabilities (Central Bank of Kenya-Bank Supervision Annual Report 2011). However, after the Crisis, Kenya’s commercial banks made profits and regained peoples’ trust. Due to the importance of commercial banks to the Government, households and investors, the profitability of banks is one of the most important issues for research. Moreover, people particularly the investors; expect better performance and efficiency of commercial banks under any circumstances. Statement of the Problem Banking efficiency is an important study for policy makers and many others who rely on
  • 2.
    100100100 | P ag e the banking sector. Therefore, the present study investigates the efficiency of Kenyan banking sector. Many firms in the service industry face the problem of not producing better results in terms of efficiency. In particular, the last decade witnessed continuous changes in regulation, technology up gradation and competition in the global financial services industry are no exception to this. The efficiency in the operation of banks has become an important issue in Kenya. It is therefore crucial to benchmark the performance of banks operating in Kenya and hence this study. Literature Review An attempt has been made in this section to review the selected research work already undertaken in the area of this study, in order to understand the methodology employed and the gaps in the research. The efficiency of banking sector is one of the most interesting economic issues for economists all over the world. This is evident from several attempts to investigate the efficiency of commercial banks by a number of economists, both in Kenya and abroad. Charnes, Cooper and Rhodes (1978) applied a nonlinear programming model to measure the relative efficiency of Decision Making Units (DMUs). A study by Haslem et al., (1999) used Data Envelopment Analysis to analyze the efficiency of U.S. Banks operating internationally. It was found that the management should focus on overall efficiency but with particular attention to inputs, especially cash and real capital and to foreign loans among the outputs. Saha and Ravisankar (2000) found that Public Sector Banks (PSB) accounted for about 85 percent of the Indian commercial banking business and supported the DEA Methodology to be useful and suitable for rating the efficiency of Indian Banks. Casu and Molyneux (2000) employed DEA to investigate the efficiency in European banking systems. The study examined whether the productive efficiency of European banking systems has been improved and converged towards a common European frontier. Miencha and Selvam (2011) found that private banks in Kenya performed well, with better liquidity assets, compared to public banks and foreign banks for the growth of the economy. The study found that banks have still a long way to go to sustain their competitive success. According to Joshi and Bhalerao (2011), there was efficiency of major commercial banks in India and most of the banks were satisfactorily efficient. The average performance of the banking sector ranges above 80 percent, which indicates the appropriate conversion of inputs into outputs. The public and private sector are equally efficient but the private sector has an edge over the public sector. Miencha et al., (2013) employed DEA to investigate the efficiency in Kenyan commercial banks. The study examined the productive efficiency of Kenyan banking systems has been improved and converged towards a common the region frontier. Miencha and Selvam (2013), in their study, the managerial efficiency, off balance sheet activities (non-traditional activities) and
  • 3.
    101101101 | P ag e profitability were the most influential determinants of Technical Efficiency. The literature review reveals that with the exception of a few, no comprehensive effort has been made recently towards a critical analysis of the efficiency level of the Kenyan commercial banks. In this context, the present study would be a significant venture at analyzing the efficiency of Kenyan Commercial Banks. Objective of the Study The present study examines the financial efficiency of banks in Kenya using Data Envelopment Analysis (DEA). Hypotheses of the Study The following two null hypotheses were framed and tested for this study NH1. There is no significant difference in efficiency measurement among Kenyan banking sector during the study period Methodology and Measurement Sample Selection As on March 31st 2008, there were totally 45 (5 Public Sector Banks, 28 Private Sector Banks and 12 Foreign Sector Banks) in Kenya. The present study covered only 10 Kenyan Commercial Banks, based on their top performance i.e. three large banks, four medium size banks, and three small banks. Period of Study The study period covered four years from January 2007 to December 2010. Sources of Data This study was mainly based on secondary data. The required data were collected from Annual Report published by Central Bank of Kenya, various reputed journals and respective bank websites. Data Envelopment Analysis The Data Envelopment Analysis (DEA) is a performance measurement technique used for analyzing the relative efficiency of productive units, having multiple inputs and multiple outputs. Efficiency Weighted sum of Outputs Weighted sum of Inputs The present study suffers from the following major limitations.  The study examined the efficiency of sample Kenyan Banks and not their absolute efficiency.  The study was based on only secondary data. Analysis of the Efficiency Sample Commercial Kenyan Banks For the purpose of this study, the analysis of efficiency of sample commercial banks is made below: Efficiency of Sample Commercial Kenyan Banks -Intermediation Approach. Efficiency of Sample Commercial Kenyan Banks through Intermediation Approach Table- 1 shows the analysis of efficiency of commercial Kenyan banks through intermediation approach. According to the above Table, the average efficiency score of sample commercial banks during 2007 – 2010 ranged from 0.6308 to 0.7994, which is
  • 4.
    102102102 | P ag e fairly high but somewhat volatile and lower than the average efficiency (0.6131 to 0.7508) by operation approach. It is to be noted that in 2007, the average efficiency for all sample banks was at 0.6308. Only two commercial banks, namely, Development Bank of Kenya and Equatorial Bank of Kenya were considered efficient as these banks’ efficiency score was 1.0000, whereas the other eight commercial banks (Cooperative Bank of Kenya, Barclays Bank of Kenya, Equity Bank of Kenya, Diamond Trust Bank of Kenya, National Bank of Kenya, Commercial Bank of Africa-Kenya, Family Bank and Jamii Bora Bank of Kenya) were less efficient under the efficiency frontier. It is to be noted from the analysis of the above Table that the Cooperative Bank had to raise its output by 18.81 percent, Barclays Bank of Kenya by 12.77 percent, National Bank of Kenya by 42.67 percent, Equity Bank by 29.04 percent, Commercial Bank by 22.67 percent, Family Bank of Kenya by 34.83 percent and Jamii Bora Bank by 34.31 percent for reaching efficiency, with the same amount of input. The Diamond Trust Bank was the least efficient bank in 2007, with the efficiency score of 0.2577, indicating that it had to increase its output by 74.23 percent, with the same amount of input. According to the analysis of data for the year 2008, the average efficiency for all sample commercial banks increased to 0.7341 in 2008 from 0.6308 in 2007. The four commercial banks, namely Barclays Bank of Kenya, Development Bank of Kenya, Equatorial Bank of Kenya and Commercial Bank of Africa-Kenya were considered efficient as their efficiency score was 1.0000. The Equity Bank of Kenya, Family Bank of Kenya and Jamii Bora Bank of Kenya, with an efficiency score of 0.7096, 0.8975, and 0.9693 respectively, had to increase their output by 29.04, 1.25 and 3.07 percent respectively, with the same amount of input. The Cooperative Bank of Kenya and National Bank of Kenya were the least efficient banks in 2008, with the efficiency score of 0.2180 and 0.3283 respectively, indicating that they had to raise their outputs by 78.20 and 67.17 percent respectively, to be regarded efficient banks. It is understood from the above Table that the average efficiency for all sample Kenyan commercial banks, through intermediation approach, increased from 0.7341 in 2008 to 0.7746 in 2009. However, there were four commercial banks which were considered to be efficient. Those were Development Bank of Kenya, National Bank of Kenya, Commercial Bank of Africa and Family Bank of Kenya whose efficiency scores were exactly 1.0000. It is to be noted that Cooperative Bank of Kenya and Diamond Trust Bank of Kenya were the least efficient in 2009. They had to raise their output by 78.11 and 72.34 percent respectively, to be considered efficient bank. The Barclays Bank of Kenya, Equatorial Bank of Kenya, Equity Bank of Kenya and Jamii Bora Bank of Kenya had also produced their outputs under the efficiency frontier, with the efficiency scores of less than 1.0000, that is, 0.7045, 0.8918, 0.7090 and 0.9452 respectively, indicating that these banks had to increase their output by 29.56, 10.82, 29.10 and 5.48
  • 5.
    103103103 | P ag e percent, respectively, with the same amount of input. It is observed from the above Table that in 2010, the average efficiency score via intermediation approach for all sample Kenyan Commercial Banks increased from 0.7746 in 2009 to 0.7994 in 2010. It is to be noted that out of ten sample commercial banks of Kenya, five of the commercial banks, namely, Development Bank of Kenya, Equatorial Bank of Kenya, National Bank of Kenya, Equity Bank of Kenya and Commercial Bank of Africa- Kenya were at efficient zone, with an efficiency score of exactly 1.0000. But two banks, Family Bank of Kenya and Jamii Bora Bank of Kenya, earned an efficiency score of 0.9622 and 0.9466 respectively, indicating that they should increase their output by 3.78 and 5.34 percent respectively. It is shocking to note that the Cooperative Bank of Kenya, Barclays Bank of Kenya and Diamond Trust Bank of Kenya, as observed from above Table, were considered the least efficient as their efficiency scores were at 0.1951, 0.5799 and 0.3098 respectively, indicating that they should increase their output by 80.49, 42.01 and 79.02 percent, without increasing the amount of the input in 2010. The performance analysis of individual banks through intermediation approach during the period from 2007 to 2010 clearly indicates that no commercial bank considered efficient in all the years of the study period. However, few sample banks, namely, Barclays Bank of Kenya, Development bank of Kenya, Equatorial Bank of Kenya, Commercial Bank of Africa, Family Bank of Kenya and Jamii Bora Bank of Kenya were efficient in some years, with the average efficiency score of 0.7892, 1.0000, 0.9730, 0.9433, 0.8779 and 0.8795 respectively. It is important to note here that two banks, namely, Cooperative Bank of Kenya and Diamond Trust Bank of Kenya, were considered the least performing banks with an average efficiency score of 0.3610 and 0.2658 respectively from 2007 to 2010. According to the results in Table - 1, it is clearly understood that Kenyan Commercial Banks taken for the study were less efficient, with a fair efficiency ranging from 0.6308 to 0.7994 under the Intermediation Approach and 0.6132 to 0.7508 under Operation Approach. The reason for the lower efficiency score earned by sample Kenyan banks taken for this study was probably the impact of Financial Crisis in 1997 and 2008. Besides, it is to be noted that prior to the Crisis, every commercial bank in Kenya had lent inappropriately to real estate business (borrowing for short term but lending for long term), which created enormous amount of Non-Performing Loans (NPLs). Conclusion It is to be noted that the efficiency of sample Kenyan Banks should be improved. Few suggestions for improving the efficiency of the sample Kenyan Banks like they need to implement the policy of 'Know Your Customer', which would help the banks to improve the business and the probability of recovering the loans and decreasing the risks in operations. Secondly, instead of setting up permanent
  • 6.
    104104104 | P ag e branches in remote areas, it is always better to provide banking services through Self Help Groups in such areas, by identifying suitable and committed persons and thus enabling banks to save enormous human and monetary expenses. Lastly, interacting with people for the purpose explaining bank products to them, and convincing them that banks are committed towards development of people rather than mere profits for banks, would lead the people to access banking services to the maximum, particularly in rural areas where people still feel that the banks are just organized moneylenders. References Miencha I. O. and Selvam M. (2011) “The Performance Efficiency of Commercial Banks in Kenya”, Competency Building Strategies in Business and Technology, 5th ed.945- 952 (Chennai: Masilamani Pathippagam Chennai). Saha A. ,2008 “Performance Indicators of Banking Sector in Bangladesh: A Comparative Overview of NCBs, PCBs, SCBs, and FCBs”, SMART Journal of Business Studies 4(1): 1 – 9. Casu B and Molynuex P, 1998 “A Comparative Study of Efficiency in European Banking”, Center for Financial Institutions working papers, Wharton School Center for Financial Institutions, University of Pennsylavania 35 (3): 1865- 1876. Chansarn S, 2007 “The Efficiency in Thai Financial Sector after the Financial Crisis”The Economic Journal of Review 6 (10):54 – 68. Charnes A, Cooper W. W. and Rhodes E 1978 “Measuring the Efficiency of Decision Making Units”,European Journal of Operational Research 2 (10):429 - 444. Halkos G and Salamouris D 2001 “ Efficiency Measures of the Greek Banking Sector: A Non-Parametric Approach for the period 1997 – 1999”,Munich Personal RePec Archive 8 (6): 165 - 182. Miencha O. I .and Murugesan S. (2011), Financial Performance in Banking Sector: A Study with Special Reference to Kenyan Commercial Banks Using Data Envelopment Analysis (DEA). Research Journal of Social Sciences and Management, 2(9), 48-53. Miencha J. O, Murugesan Selvam, Rajesh Ramkumar, and Karpagam V. (2013) Relative Efficiency of Kenyan Commercial Banks, Journal of International Business Management,7(3), 142-150. Miencha I. O, Murugesan Selvam,Vinayagamoorthi Vasanth, Kasilingam Lingaraja and Mariappan Raja (2015), Efficiency Measurement of Kenyan Commercial Banks, Mediterranean Journal of Social Sciences, 6(4), 621 – 631. Doi:10.5901/mjss.2015.v6n4s2p621 Rangakakulnuwat P. 2007. Technical Efficiency of Thai Commercial Banks between 2002 and 2005 .The UTCC Journal, 24 (1): 129 - 138. Supachet Chansarn2008 The Relative Efficiency of Commercial Banks in Thailand ,International Research Journal of Finance and Economics18(10):53 – 68. Websites www.cbk.co.ke
  • 7.
    105105105 | P ag e www.barclaysbank.co.ke
  • 8.
    106106106 | P ag e Table - 1 Efficiency of Sample Commercial Kenyan Banks through Intermediation Approach from 2007 to 2010 NameofBank Year 2007 2008 2009 2010 AverageScore 1) LargeBanks 1.1 Co-operativeBankofKenya 0.8119 0.2180 0.2189 0.1951 0.3610 1.2 BarclaysBankofKenya 0.8723 1.0000 0.7045 0.5799 0.7892 1.3 EquityBankofKenya 0.7096 0.7099 0.7090 1.0000 0.7821
  • 9.
    2)MediumSectorBanks 2.1 DiamondTrustBankofKenya 0.2577 0.21910.2766 0.3098 0.2658 2.2 NationalBankofKenya 0.5733 0.3283 1.0000 1.0000 0.7254 2.3 CommercialBankofAfrica 0.7733 1.0000 1.0000 1.0000 0.9433 2.4 FamilyBankofKenya 0.6517 0.8975 1.0000 0.9622 0.8779 3) SmallSectorBanks 3.1 EquatorialBankofKenya 1.0000 1.0000 0.8918 1.0000 0.9730 3.2 JamiiBoraBankofKenya 0.6569 0.9693 0.9452 0.9466 0.8795 3.3 DevelopmentBankofKenya 1.0000 1.0000 1.0000 1.0000 1.0000 AverageScore 0.6308 0.7341 0.7746 0.7994 106 | P a g e