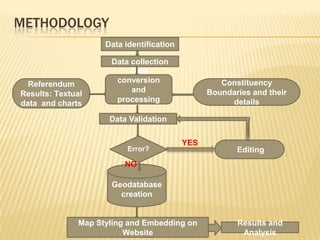
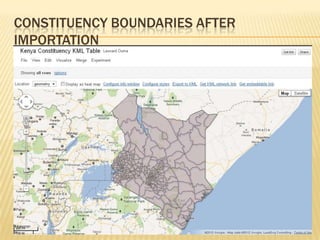
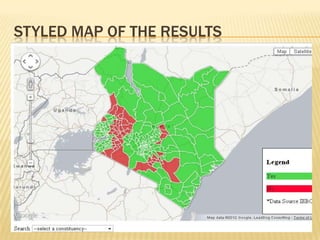
REPORTING ON ELECTION
 RESULTS USING GOOGLE MAPS

A CASE STUDY OF THE 2010 REFERENDUM RESULTS
IN KENYA


                 OUMA LEONARD ODHIAMBO
                       F19/1899/2007


      SUPERVISOR: MR. J.N MWENDA
PRESENTATION OVERVIEW
   Introduction
   Problem statement
   Objectives
   Methodology
                  Overview of methodology
                  Area of study

                  Data sources and tools
                  Data Preparation
   Results and analysis
   Conclusions & Recommendations
INTRODUCTION
   One of the most critical ways that individuals can influence
    governmental decision-making is through voting. Voting is a formal
    expression of preference for a candidate for office or for a proposed
    resolution of an issue. Voting generally takes place in the context of a
    large-scale national or regional election; however, local community
    elections can be just as critical to individual participation in government
   Article 21 of the Universal Declaration of Human Rights, adopted
    unanimously by the United Nations General Assembly in
    1948, recognizes the integral role that transparent and open elections
    play in ensuring the fundamental right to participatory government
   If elections are not properly managed, riots and even civil war can break
    out in a country. It is therefore important that election results be
    disseminated to the public as soon as practically possible through the
    available media.
PROBLEM STATEMENT
   Kenya’s first direct elections for Africans to the Legislative
    Council took place in 1957. In May 1963, elections were
    held based on the widely held principle of “one person, one
    vote.”
    Kenya has successfully held largely peaceful elections
    thereafter
   The December 2007 elections marked a radical departure
    from these positive trends. As the initial vote count came in
    to the ECK, opposition candidate appeared to have a
    substantial lead.
   As the count continued, however, the incumbent closed the
    gap and overtook his opponent by a substantial margin to
    win reelection amid largely substantiated claims of rigging (
    IFES Kenya, 2008), leading to protests and riots and
    discrediting of the ECK for its involvement
…………CONT’
   The protests escalated into unprecedented
    violence, leading to over 1,000 deaths and the internal
    displacement of more than 350,000 people
    (IREC, 2008)
   According to the IFES report, most of the operational
    tasks were still accomplished manually. In 2007, laptop
    computers sat unused while the tallying of results at
    polling stations was conducted by hand, leading to a
    delay in transmission to headquarters.
   The delay in announcement of the final results at the
    National Tallying Center, led to some media houses
    relying on unspecified sources to broadcast and
    announce results ahead of the ECK, in an effort to
    outdo each other (IREC, 2008).
…………….CONT’
   The Interim Independent Electoral Commission (IIEC) was formed to
    replace the ECK. Its mandate was to institutionalize sustainable
    electoral processes that would guarantee free and fair elections, part of
    which included the development of a modern system for
    collection, transmission and tallying of electoral data.
   IIEC was replaced by a permanent electoral body, the Independent
    Electoral and Boundaries Commission (IEBC) in line with the new
    constitution. It has embarked on various reform in the electoral system
    , including; the parallel vote tallying system, electronic voter registration
    and the electronic vote tallying and transmission.
   Geospatial technology integrated with information systems can easily
    help to solve some of the problems. This is achieved by disseminating
    all the results, final and provisional to the public through a dynamic map
    as the results tickle in.
OBJECTIVES
   The main objective of the study is to develop a Geospatial approach to
    some of these electoral problems to assist in prompt dissemination of
    electoral results to the public in an easy to understand and visually
    appealing media.
    The system will enable update of election results in the Google Fusion
    Tables* and the final output displayed as a Google Map on a dedicated
    website.
   The specific objectives:
        Mapping the electoral constituencies in Kenya
        To develop a database of the registered voters in each constituencies.
        Using the 2010 referendum results, prepare a Google Fusion Tables
         showing the results
        To display the results as map on a dedicated website, including the related
         charts.


               *A modern data management web application used to host, manage, collaborate
               on, visualize, and publish data and maps online.
METHODOLOGY
                    Data identification

                     Data collection
                          Data
  Referendum          conversion                   Constituency
                          and                   Boundaries and their
Results: Textual
                      processing                     details
data and charts
                     Data Validation

                                          YES
                          Error?                       Editing
                         NO

                     Geodatabase
                       creation


              Map Styling and Embedding on             Results and
                         Website                        Analysis
AREA OF STUDY

                   Kenya, officially the republic
                    of Kenya, lies between the
                    geographical coordinates 4°
                    North to 4° South of the
                    equator and Longitude
                    34°East to 41° East.
                   It is bordered by the Indian
                    Ocean to its south-
                    east, Tanzania to the
                    south, Uganda to the
                    west, South Sudan to the
                    north-west, Ethiopia to the
                    north and Somalia to the
                    north-east
WHY THE STUDY AREA

 Lack of election data at lower electoral levels
 Availability of reliable data at constituency
  level covering the entire country
 Need to show the national voting patterns in
  the 2010 Constitutional Referendum.
DATASETS
Datasets                  Source                   Description

2010 Constituency         Virtual Kenya            A KML file of the 210
Boundaries                (www.virtualkenya.org)   constituencies as at 2010.


2010 Referendum Results   IEBC                     A PDF document showing
in Kenya                  (www.iebc.or.ke)         the results at constituency
                                                   level


County Profiles           Kenya Open Data          A list of the 47 Counties
                          Initiative (KODI)        and the constituencies
                          (www.opendata.go.ke)     that fall in them
TOOLS
Hardware
    Computer with the specifications of 1 GB RAM and 3.0 GHz
     processor speed, 80 GB HDD.
    2 GB Flash Disk.
    Safaricom Broadband Modem and Simcard
    HP DeskJet F2483 Printer/Scanner.


Software
     Google Fusion Tables (Beta)*
     Notepad++
     PDF to Excel Converter
     Microsoft Office 2010.
     Fusion Table Layer Builder
                                                   *Experimental
DATA PREPARATION

 Data conversion from PDF to Microsoft Excel
 Importation of the results into Google Fusion
  Tables
 Importation of the constituency boundaries to
  fusion tables
 Merging the results with the boundaries

 Visualization and styling of the resultant map
RESULTS OF THE CONVERSION
RESULTS AS IMPORTED TO FUSION TABLES
CONSTITUENCY BOUNDARIES AFTER
IMPORTATION
MERGED TABLES
STYLED MAP OF THE RESULTS
ANALYSIS OF VOTER TURNOUT
OVERALL RESULTS
             Overall Results
            2%


      31%

                                     Yes
                               67%   No
                                     Rejected
DISCUSSION OF THE RESULTS
   This shows the interest by Kenyans to election
    related issues and the ease of access to
    internet, which has cut a niche to itself as means of
    sharing information by the public.
   With the landing of the fiber optic cables, access to
    the internet has become affordable to many and even
    much faster.
   According to latest statistics from US-based
    Ookla’s NetIndex, Kenya is second in the
    continent, after Ghana which has emerged as having
    the fastest broadband internet speeds in
    Africa., (Aptantech, 2012)), further enabling
    accessibility to such maps.
CONCLUSIONS

   In conclusion, it can be said that:
     It is possible to display election results on Google
      Maps.
     Possibilities for the results to be hosted on the
      internet.
     Possibilities to reduce errors in election results
      tallying and analysis.
     Chances of the public showing interest in such
      online maps and actually viewing them.
   N/B Care must be given to the data entry and
    editing
RECOMMENDATIONS
   With the advancement in technology in the country, there is need
    to embrace the electronic voting and merge the same with GIS or
    web mapping service that the commission may employ.
   The IEBC needs to build the capacity of their employees to be
    able to implement GIS related aspects of the elections. Such
    employees need to have skills in data
    capture, editing, transmission and visualization in a GIS
    environment. These might include GIS managers, GIS
    programmer, GIS analyst and data entry personnel.
   There is need to explore the internet as a possible avenue for
    release of election results to the public.
   There is need to extend the scope of the study to cover the
    County Assembly Wards. There is also need to incorporate road
    access so as to facilitate network analysis. This is important as
    influences the creation of the electoral units as per the new
    constitution.
THANK YOU

Kenya Election Results Mapping

  • 1.
    REPORTING ON ELECTION RESULTS USING GOOGLE MAPS A CASE STUDY OF THE 2010 REFERENDUM RESULTS IN KENYA OUMA LEONARD ODHIAMBO F19/1899/2007 SUPERVISOR: MR. J.N MWENDA
  • 2.
    PRESENTATION OVERVIEW  Introduction  Problem statement  Objectives  Methodology  Overview of methodology  Area of study  Data sources and tools  Data Preparation  Results and analysis  Conclusions & Recommendations
  • 3.
    INTRODUCTION  One of the most critical ways that individuals can influence governmental decision-making is through voting. Voting is a formal expression of preference for a candidate for office or for a proposed resolution of an issue. Voting generally takes place in the context of a large-scale national or regional election; however, local community elections can be just as critical to individual participation in government  Article 21 of the Universal Declaration of Human Rights, adopted unanimously by the United Nations General Assembly in 1948, recognizes the integral role that transparent and open elections play in ensuring the fundamental right to participatory government  If elections are not properly managed, riots and even civil war can break out in a country. It is therefore important that election results be disseminated to the public as soon as practically possible through the available media.
  • 4.
    PROBLEM STATEMENT  Kenya’s first direct elections for Africans to the Legislative Council took place in 1957. In May 1963, elections were held based on the widely held principle of “one person, one vote.”  Kenya has successfully held largely peaceful elections thereafter  The December 2007 elections marked a radical departure from these positive trends. As the initial vote count came in to the ECK, opposition candidate appeared to have a substantial lead.  As the count continued, however, the incumbent closed the gap and overtook his opponent by a substantial margin to win reelection amid largely substantiated claims of rigging ( IFES Kenya, 2008), leading to protests and riots and discrediting of the ECK for its involvement
  • 5.
    …………CONT’  The protests escalated into unprecedented violence, leading to over 1,000 deaths and the internal displacement of more than 350,000 people (IREC, 2008)  According to the IFES report, most of the operational tasks were still accomplished manually. In 2007, laptop computers sat unused while the tallying of results at polling stations was conducted by hand, leading to a delay in transmission to headquarters.  The delay in announcement of the final results at the National Tallying Center, led to some media houses relying on unspecified sources to broadcast and announce results ahead of the ECK, in an effort to outdo each other (IREC, 2008).
  • 6.
    …………….CONT’  The Interim Independent Electoral Commission (IIEC) was formed to replace the ECK. Its mandate was to institutionalize sustainable electoral processes that would guarantee free and fair elections, part of which included the development of a modern system for collection, transmission and tallying of electoral data.  IIEC was replaced by a permanent electoral body, the Independent Electoral and Boundaries Commission (IEBC) in line with the new constitution. It has embarked on various reform in the electoral system , including; the parallel vote tallying system, electronic voter registration and the electronic vote tallying and transmission.  Geospatial technology integrated with information systems can easily help to solve some of the problems. This is achieved by disseminating all the results, final and provisional to the public through a dynamic map as the results tickle in.
  • 7.
    OBJECTIVES  The main objective of the study is to develop a Geospatial approach to some of these electoral problems to assist in prompt dissemination of electoral results to the public in an easy to understand and visually appealing media.  The system will enable update of election results in the Google Fusion Tables* and the final output displayed as a Google Map on a dedicated website.  The specific objectives:  Mapping the electoral constituencies in Kenya  To develop a database of the registered voters in each constituencies.  Using the 2010 referendum results, prepare a Google Fusion Tables showing the results  To display the results as map on a dedicated website, including the related charts. *A modern data management web application used to host, manage, collaborate on, visualize, and publish data and maps online.
  • 8.
    METHODOLOGY Data identification Data collection Data Referendum conversion Constituency and Boundaries and their Results: Textual processing details data and charts Data Validation YES Error? Editing NO Geodatabase creation Map Styling and Embedding on Results and Website Analysis
  • 9.
    AREA OF STUDY  Kenya, officially the republic of Kenya, lies between the geographical coordinates 4° North to 4° South of the equator and Longitude 34°East to 41° East.  It is bordered by the Indian Ocean to its south- east, Tanzania to the south, Uganda to the west, South Sudan to the north-west, Ethiopia to the north and Somalia to the north-east
  • 10.
    WHY THE STUDYAREA  Lack of election data at lower electoral levels  Availability of reliable data at constituency level covering the entire country  Need to show the national voting patterns in the 2010 Constitutional Referendum.
  • 11.
    DATASETS Datasets Source Description 2010 Constituency Virtual Kenya A KML file of the 210 Boundaries (www.virtualkenya.org) constituencies as at 2010. 2010 Referendum Results IEBC A PDF document showing in Kenya (www.iebc.or.ke) the results at constituency level County Profiles Kenya Open Data A list of the 47 Counties Initiative (KODI) and the constituencies (www.opendata.go.ke) that fall in them
  • 12.
    TOOLS Hardware  Computer with the specifications of 1 GB RAM and 3.0 GHz processor speed, 80 GB HDD.  2 GB Flash Disk.  Safaricom Broadband Modem and Simcard  HP DeskJet F2483 Printer/Scanner. Software  Google Fusion Tables (Beta)*  Notepad++  PDF to Excel Converter  Microsoft Office 2010.  Fusion Table Layer Builder *Experimental
  • 13.
    DATA PREPARATION  Dataconversion from PDF to Microsoft Excel  Importation of the results into Google Fusion Tables  Importation of the constituency boundaries to fusion tables  Merging the results with the boundaries  Visualization and styling of the resultant map
  • 14.
    RESULTS OF THECONVERSION
  • 15.
    RESULTS AS IMPORTEDTO FUSION TABLES
  • 16.
  • 17.
  • 18.
    STYLED MAP OFTHE RESULTS
  • 20.
  • 21.
    OVERALL RESULTS Overall Results 2% 31% Yes 67% No Rejected
  • 24.
    DISCUSSION OF THERESULTS  This shows the interest by Kenyans to election related issues and the ease of access to internet, which has cut a niche to itself as means of sharing information by the public.  With the landing of the fiber optic cables, access to the internet has become affordable to many and even much faster.  According to latest statistics from US-based Ookla’s NetIndex, Kenya is second in the continent, after Ghana which has emerged as having the fastest broadband internet speeds in Africa., (Aptantech, 2012)), further enabling accessibility to such maps.
  • 25.
    CONCLUSIONS  In conclusion, it can be said that:  It is possible to display election results on Google Maps.  Possibilities for the results to be hosted on the internet.  Possibilities to reduce errors in election results tallying and analysis.  Chances of the public showing interest in such online maps and actually viewing them.  N/B Care must be given to the data entry and editing
  • 26.
    RECOMMENDATIONS  With the advancement in technology in the country, there is need to embrace the electronic voting and merge the same with GIS or web mapping service that the commission may employ.  The IEBC needs to build the capacity of their employees to be able to implement GIS related aspects of the elections. Such employees need to have skills in data capture, editing, transmission and visualization in a GIS environment. These might include GIS managers, GIS programmer, GIS analyst and data entry personnel.  There is need to explore the internet as a possible avenue for release of election results to the public.  There is need to extend the scope of the study to cover the County Assembly Wards. There is also need to incorporate road access so as to facilitate network analysis. This is important as influences the creation of the electoral units as per the new constitution.
  • 27.