Download to read offline

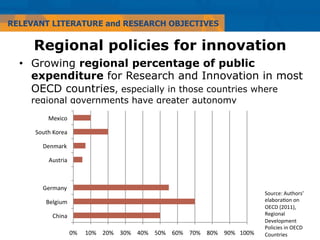


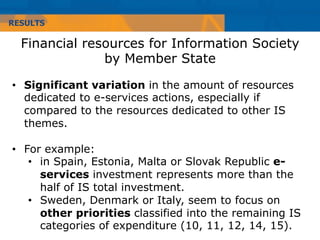


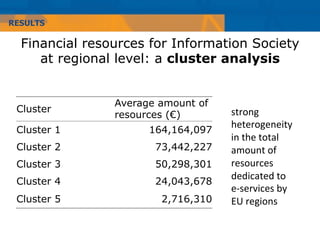


The document discusses the allocation of public resources for ICT and e-services within European regions, emphasizing the growing emphasis on regional policies for innovation. It analyzes data from the EU structural funds for 2007-2013, highlighting significant heterogeneity in resource dedication across member states and regions. Conclusions indicate a need for strategies that address varying levels of development and funding priorities in e-services investments.


