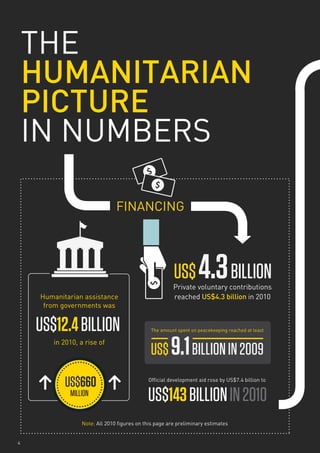
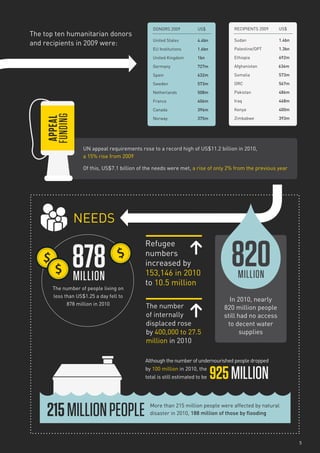
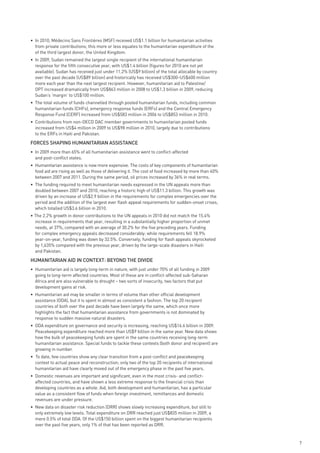
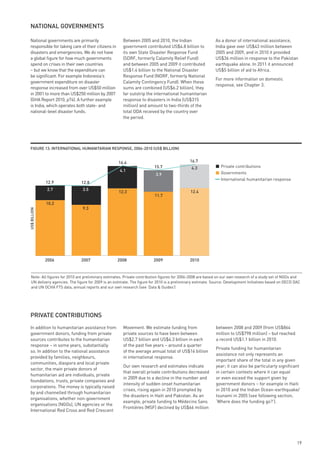
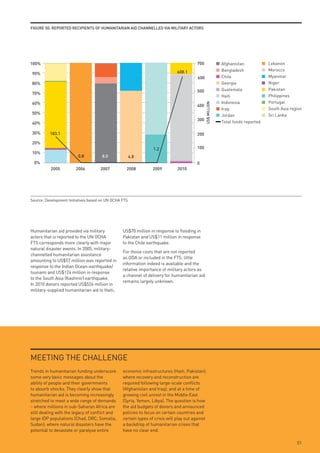
GHA
RepoRt 2011
Contents


FoRewoRd                                                            2

exeCutive summARy                                                   3

CHApteR 1: HumAnitARiAn FundinG                                     9
wHeRe does tHe FundinG Come FRom?                                   11
International governments                                           11
National governments                                                19
Private contributions                                               19

wHeRe does tHe FundinG Go?                                          22
Regional patterns                                                   22
Country variations                                                  23
Shifting trends                                                     25
Current drivers                                                     27
Same recipients, same donors?                                       32

How does tHe FundinG Get tHeRe?                                     37
Route and rationale                                                 37
Multilateral organisations                                          39
Non-governmental organisations                                      40
International Red Cross and Red Crescent Movement                   41
Donor funding choices beyond the OECD DAC                           42
Financing mechanisms                                                44
Military                                                            49
Meeting the challenge                                               51

CHApteR 2: FoRCes sHApinG HumAnitARiAn AssistAnCe                  53
Natural disasters, conflict and economic challenges                 54
Humanitarian needs: funding appeals                                 59
Proportionality in donor responses to crises                        62
Funding in accordance with assessed needs                           64

CHApteR 3: Beyond tHe divide: HumAnitARiAn AssistAnCe in Context   67
Development aid in humanitarian crises                              70
Tackling vulnerability                                              76
Domestic resources                                                  82
Humanitarian aid remains important, in context                      86

dAtA & Guides                                                      89
Key definitions, concepts and methodology                           91
Data sources                                                        94
Acronyms and abbreviations                                          96
Reference tables                                                    98

ACknowledGements                                                   105


                                                                         1
FoRewoRd

We believe that there is a real value in having objective data on resource flows. It can be
used as a shared evidence base for those who are working to achieve the best possible
use of resources for people vulnerable to crises and insecurity. The Global Humanitarian
Assistance (GHA) programme tries to present clear, unbiased, independent data in forms
that can be easily understood. In our 2011 evaluation, it was suggested that we should
offer more editorial comment about the numbers – but that we should ensure that this
was entirely transparent so that the impartiality of the data would not be compromised.
Below are some brief editorial comments about the implications of the analysis. In
addition to this report, readers can also access the original data from our website,
enabling them to examine the methodology and use it themselves, in order to draw their
own conclusions.
As we said in last year’s report, finance is about more than money. It affects the
organisations that are strengthened or neglected, the level of attention that is paid to
people, sectors or countries, the information to which funders have access and on which
they base future decisions, and the economic impact felt in locations where the money is
spent, as it travels through the layers of the humanitarian system. Financing is also one
of the few things over which donors have control. Our view, therefore, is that policies on
financing merit serious attention.
It is extremely encouraging to see that some of the financing aspects of the humanitarian
reform agenda have borne fruit. For instance, the pooled humanitarian funds of various
kinds (emergency response funds (ERFs), the Central Emergency Response Fund (CERF),
common humanitarian funds (CHFs)) are facilitating an increase in the number of donors
contributing, without creating impossible coordination challenges. It is also good to see
financing mechanisms being developed, in order to try to improve the quality of data that
is informing decisions so that funding can become more responsive to need.
International governments have spent US$90 billion on humanitarian response over
the past ten years, much of it in the same countries and going to the same people. What
outcomes should we expect? We, at Development Initiatives, believe that a reasonable
conclusion to be drawn from the data is that more attention should be given to the range of
results to which humanitarian assistance can, and should, contribute; these results include
long-term and systemic issues, contributions to increased resilience and poverty reduction,
reduced risks and protection of development gains. In focusing on results, we also believe
that humanitarian contributions must be considered in the context of the whole funding mix
so that different sources of finance and different instruments can be viewed together during
planning processes. More attention to this funding mix and to results could, in turn, lead
to progress on some very intractable problems such as the lack of investment in disaster
risk reduction, the need for stronger linkages between development and humanitarian
interventions and the lack of attention to coherence with domestic government actions in
respect to humanitarian assistance and reducing vulnerability.
A precondition for a more effective application of the funding mix is transparency. Unless
people are aware of the resources available they cannot take the first steps towards
using them more coherently. The environment for transparency is very positive both
amongst individual donors and collectively through the International Aid Transparency
Initiative (IATI), and there is more real-time data available on humanitarian assistance
than on development spending. We hope that the information we can provide in the GHA
reports and online will contribute to an ever improving use of all resources to address
vulnerability, insecurity, crisis and poverty. Don’t forget that we have a helpdesk and we
are always pleased to help provide data or information if we can.
Judith Randel
Co-Director, Development Initiatives


2
exeCutive
summARy


            3
THE
    HUMANITARIAN
    PICTURE
    IN NUMBERS


4
5
exeCutive summARy

Humanitarian aid is being stretched. Millions of people in sub-Saharan Africa are living
with conflict and its legacy; natural disasters such as the earthquake in Haiti and the floods
in Pakistan have the power to disrupt and sometimes even paralyse economic and social
infrastructure; recovery and reconstruction remain uneven following large-scale conflict in Iraq
and Afghanistan; and political turmoil is escalating in parts of the Middle East and North Africa.
In many instances the people already affected by crises face additional threats, their livelihoods
made more insecure by the effects of climate change and the vagaries of the global economy.
The international humanitarian response to these needs reached US$16.7 billion in 2010. If
this preliminary, partial estimate proves to be accurate when full final data is available, it will
have been the largest annual humanitarian response on record – higher even than in 2005,
the year of the Indian Ocean earthquake/tsunami and the South Asia (Kashmir) earthquake.
However, while the contributions of governments outside of the Organisation for Economic
Co-operation and Development (OECD) Development Assistance Committee (DAC) and those
of the private sector increased dramatically in 2010, it is not clear whether these actors will
become regular donors in years when there are no major natural disasters.
The overall humanitarian expenditure of OECD DAC member governments – the major
contributors to ongoing crises – is also estimated to have increased in 2010 (from
US$11.2 billion in 2009 to US$11.8 billion). But the substantial increases made by just
three donors (the United States, Japan and Canada) mask reductions by some of their
peers. Eight OECD DAC members look set to reduce their levels of expenditure for the third
consecutive year in 2010. While the overall international response to humanitarian crises
shows an upward trend, many governments are coming under pressure to justify existing
levels of aid spending.
In a global context of rising demand, escalating costs and budgetary constraints, the
need to target humanitarian financing effectively and equitably is ever more compelling.
In 2010, the level of needs that were unmet in the UN’s consolidated appeals process (CAP)
increased and humanitarian funding seems to have been more unevenly distributed across
crises, with complex emergencies in many cases receiving a lower proportion of their
funding requirements.
The effective targeting of humanitarian financing must include the effective coordination of
all resources to address vulnerability to crises – while it remains important for humanitarian
aid to be independent, neutral and based on need alone, it does not exist in a vacuum. Does it
make sense for humanitarian assistance, which in many cases is being spent year on year in
the same places, to be looked at in isolation from other types of potential funding?

wHeRe does HumAnitARiAn FundinG Come FRom?
wHeRe does it Go? How does it Get tHeRe?
• In reality global humanitarian assistance exceeds our US$16.7 billion estimate of the
  international humanitarian response from governments and private voluntary contributions
  in 2010. Not captured are the efforts of individuals, organisations and governments within
  crisis-affected countries themselves. We do not have a figure for the response of national
  governments but, by way of example, the Indian government has spent more than
  US$6.2 billion on emergencies in its own country over the past five years, far outweighing
  the US$315 million of humanitarian assistance it has received from international donors.
  Also not captured is the response of the military in delivering humanitarian assistance.
  In addition, it is difficult to draw a line around other types of aid flows that might go to
  people living in humanitarian crises.
• Governments contributed US$12.4 billion (preliminary estimate) in response to international
  humanitarian crises in 2010 – the highest volume on record. In 2009 expenditure contracted
  to US$11.7 billion following the 2008 spike (US$12.3 billion) in response to a number
  of natural disasters and the food price crisis, and as some donors shifted the emphasis
  of parts of their humanitarian programming to development.
• In 2009, the three largest government/institutional donors of humanitarian aid were the
  United States (US$4.4 billion), the European institutions (US$1.6 billion) and the United
  Kingdom (US$1 billion). In terms of generosity, however, Luxembourg, Sweden and Norway
  contributed the highest shares of gross national income (GNI) and Luxembourg, Norway
  and United Arab Emirates (UAE) contributed the most per person.
• In 2009, 61.7% of international government funding was directed through multilateral
  delivery agencies or funding mechanisms, 17.3% through NGOs and less than
  10% through the public sector.
• We estimate private voluntary contributions to have been in the region
  of US$4 billion in each of the past three years.


6
• In 2010, Médecins Sans Frontières (MSF) received US$1.1 billion for humanitarian activities
  from private contributions; this more or less equates to the humanitarian expenditure of the
  of the third largest donor, the United Kingdom.
• In 2009, Sudan remained the largest single recipient of the international humanitarian
  response for the fifth consecutive year, with US$1.4 billion (figures for 2010 are not yet
  available). Sudan has received just under 11.2% (US$9 billion) of the total allocable by country
  over the past decade (US$89 billion) and historically has received US$300–US$600 million
  more each year than the next largest recipient. However, humanitarian aid to Palestine/
  OPT increased dramatically from US$863 million in 2008 to US$1.3 billion in 2009, reducing
  Sudan’s ‘margin’ to US$100 million.
• The total volume of funds channelled through pooled humanitarian funds, including common
  humanitarian funds (CHFs), emergency response funds (ERFs) and the Central Emergency
  Response Fund (CERF) increased from US$583 million in 2006 to US$853 million in 2010.
• Contributions from non-OECD DAC member governments to humanitarian pooled funds
  increased from US$4 million in 2009 to US$98 million in 2010, largely due to contributions
  to the ERFs in Haiti and Pakistan.

FoRCes sHApinG HumAnitARiAn AssistAnCe
• In 2009 more than 65% of all humanitarian assistance went to conflict-affected
  and post-conflict states.
• Humanitarian assistance is now more expensive. The costs of key components of humanitarian
  food aid are rising as well as those of delivering it. The cost of food increased by more than 40%
  between 2007 and 2011. During the same period, oil prices increased by 36% in real terms.
• The funding required to meet humanitarian needs expressed in the UN appeals more than
  doubled between 2007 and 2010, reaching a historic high of US$11.3 billion. This growth was
  driven by an increase of US$2.9 billion in the requirements for complex emergencies over the
  period and the addition of the largest ever flash appeal requirements for sudden-onset crises,
  which totalled US$3.6 billion in 2010.
• The 2.2% growth in donor contributions to the UN appeals in 2010 did not match the 15.4%
  increase in requirements that year, resulting in a substantially higher proportion of unmet
  needs, at 37%, compared with an average of 30.2% for the five preceding years. Funding
  for complex emergency appeals decreased considerably: while requirements fell 18.9%
  year-on-year, funding was down by 32.5%. Conversely, funding for flash appeals skyrocketed
  by 1,635% compared with the previous year, driven by the large-scale disasters in Haiti
  and Pakistan.

HumAnitARiAn Aid in Context: Beyond tHe divide
• Humanitarian aid is largely long-term in nature, with just under 70% of all funding in 2009
  going to long-term affected countries. Most of these are in conflict-affected sub-Saharan
  Africa and are also vulnerable to drought – two sorts of insecurity, two factors that put
  development gains at risk.
• Humanitarian aid may be smaller in terms of volume than other official development
  assistance (ODA), but it is spent in almost as consistent a fashion. The top 20 recipient
  countries of both over the past decade have been largely the same, which once more
  highlights the fact that humanitarian assistance from governments is not dominated by
  response to sudden massive natural disasters.
• ODA expenditure on governance and security is increasing, reaching US$16.6 billion in 2009.
  Peacekeeping expenditure reached more than US$9 billion in the same year. New data shows
  how the bulk of peacekeeping funds are spent in the same countries receiving long-term
  humanitarian assistance. Special funds to tackle these contexts (both donor and recipient) are
  growing in number.
• To date, few countries show any clear transition from a post-conflict and peacekeeping
  context to actual peace and reconstruction; only two of the top 20 recipients of international
  humanitarian aid have clearly moved out of the emergency phase in the past five years.
• Domestic revenues are important and significant, even in the most crisis- and conflict-
  affected countries, and have shown a less extreme response to the financial crisis than
  developing countries as a whole. Aid, both development and humanitarian, has a particular
  value as a consistent flow of funds when foreign investment, remittances and domestic
  revenues are under pressure.
• New data on disaster risk reduction (DRR) shows slowly increasing expenditure, but still to
  only extremely low levels. Total expenditure on DRR reached just US$835 million in 2009, a
  mere 0.5% of total ODA. Of the US$150 billion spent on the biggest humanitarian recipients
  over the past five years, only 1% of that has been reported as DRR.


                                                                                                       7
THE STORY
Traditional responses to humanitarian crises are those that fall under the aegis      CREDIT
of ‘emergency response’: material relief assistance and services (shelter, water,     © IFRC / Olivier Matthys
medicines etc.); emergency food aid (short-term distribution and supplementary
feeding programmes); relief coordination, protection and support services
(coordination, logistics and communications). Humanitarian aid can also include
reconstruction and rehabilitation, as well as disaster prevention and preparedness.

This International Federation of Red Cross and Red Crescent Societies (IFRC) photo
was taken at a camp in Charsadda, Pakistan, following the floods in July 2010. The
camp housed 150 families left homeless and offered shelter, food and health care.

8
HumAnitARiAn
FundinG
In 2010, both the earthquake in Haiti and the floods in Pakistan were met with a global
humanitarian response. Local communities and organisations rallied to provide the most
immediate, life-saving assistance. UN flash appeals were launched for each, with appealing
agencies mobilising over US$1 billion in each case from governments, the private sector and
individuals. Saudi Arabia and Brazil were the leading contributors to Haiti’s emergency response
fund (ERF) and India was the largest government donor to support the Pakistan ERF, adding to
the assistance provided by traditional government donors and EU institutions. But assistance in
response to these types of emergency is not indicative of the bulk of humanitarian aid expenditure.
While big disasters attract the attention and new sources of funding that help to create the
spikes in global humanitarian expenditure in some years, most humanitarian aid is spent by the
same donors in the same places each year. Together with Ethiopia, Afghanistan and Palestine/
OPT, Sudan has dominated humanitarian aid for much of the last decade. In each of the last five
years, it has received over US$1.3 billion from government donors alone – roughly equivalent
to the global sums raised through the UN appeals for each of Pakistan and Haiti in 2010. At
the same time, the humanitarian budgets of these donors are responding to natural disasters,
conflict and the legacies that continue to undermine the stability and security of thousands of
families and communities from the long-running crises in Democratic Republic of Congo (DRC)
and Somalia to earthquake-affected Chile and China; from conflict recovery in Iraq to tsunami
recovery in Indonesia; and from Kenya to Zimbabwe. These very different situations highlight
the very different needs that humanitarian aid is expected to address – and how humanitarian
funding is being stretched way beyond that which is short-term and life-saving.
Wrapped up in the global response are not only decisions about how much to spend and where
to spend it, but also choices about who the funding will be entrusted to in order to ensure that
humanitarian work is delivered most effectively.
This section attempts to answer some basic questions about humanitarian aid.
Where does the money come from? Where does it go? How does it get there?


                                                                                                      9
GLOBAL
HUMANITARIAN
ASSISTANCE                                                                                         HER
                                                                                                       INTE
                                                                                                           RNATIONAL RE
                                                                                                                       SO
                                                                                                                         UR
                                                                                                                           CE
                                                                                                 OT                          S


                                                                                                        Other types of aid

                                                                                            Other types of foreign assistance

                               ITARIAN RE                                                              Humanitarian aid
                           UMAN          SPO
                         LH                                                                        delivered by the military
                       NA                   NS
                                              E:
                     IO
                   AT                            U
           N


                                                                S$
         ER


                            Governments
                                                                  16
      INT


                                                                    .7b

                             US$12.4bn
                                                                       n

                           (2010, preliminary estimate)
                                                                                                     Other international resources are
                                                                                                discussed in Chapter 3, Beyond the divide:
                                                                                                humanitarian aid in context. There is also
                                                                                                a short section on the military’s delivery of
                                                                                                humanitarian aid in Chapter 1, Section 1.3.


                          Private voluntary
                       contributions US$4.3bn                                     ESTIC RESPON
                                                                               DOM            SE
                           (2010, preliminary estimate)


                                                                           National institutions

                                                                         National governments

                             The international humanitarian
                           response is the main focus of the
                                  analysis in Chapter 1,
                           Humanitarian funding, although
                           the role of national governments
                            is also referenced in Section 1.1                            People
                                      of that chapter.


                                                                     Domestic response is difficult to quantify. The role of
                                                                      national governments in humanitarian response is
                                                                     covered in Chapter 1, Section 1.1. Their role in social
                                                                       protection is referenced in Chapter 3, Beyond the
                                                                     divide: humanitarian aid in context. The work of Red
                                                                      Cross/Crescent societies (‘national institutions’) is
QUANTIFIED                                                                    discussed in Chapter 1, Section 1.3.
PARTIALLY QUANTIFIED
UNQUANTIFIED
UNQUANTIFIABLE


10
1.1 wHeRe does tHe FundinG Come FRom?

inteRnAtionAl GoveRnments

Over the past ten years, governments                 government response in terms of volumes
have spent over US$90 billion of                     of humanitarian aid given – notably the
humanitarian aid in response to                      United States, the European institutions,
international humanitarian crises                    the United Kingdom, Germany and the
– over US$30 billion of which has                    Netherlands – the additional funding
been provided by the United States.                  mechanisms and ways of channelling
                                                     assistance created within the international
While members of the Organisation for
                                                     community over the past decade have
Economic Cooperation and Development’s
                                                     also helped increase the visibility of
(OECD) Development Assistance
                                                     humanitarian assistance from other
Committee (DAC) continue to dominate
                                                     governments.


FiGuRe 1: top 20 GoveRnment ContRiButoRs to inteRnAtionAl HumAnitARiAn Response, 2000–2009 (us$ Billion)


                                                                                                   10. Italy
                5. Netherlands                                                                    US$3.6bn
                   US$5.1bn
                                                         1. United States
                                                            US$31.0bn                                                 16.
                                                                                                                  Saudi Arabia
                                                                                                                   US$1.9bn


                                                                                                   6. Sweden
                                                                                                   US$4.4bn          17. Belgium
                                                                                                                      US$1.4bn
                    4. Germany
                     US$6.5bn


                                                                                                           8. Norway        20. UAE
                                                                                                           US$3.7bn        US$0.8bn
                                                                            3. United Kingdom
               13. Denmark                                                      US$8.2bn
                US$2.3bn                  2. EU institutions
                                              US$14.9bn                                                              18. Finland
                                                                                                                      US$1.1bn

                                                                                                      9. France
                                                                                                      US$3.6bn
                      12. Canada
                       US$2.6bn                                             7. Japan
                                                                            US$4.0bn
                                 15. Australia
                                  US$2.1bn                                               14. Switzerland
                                                   11. Spain
                                                                                            US$2.2bn
                                                   US$3.2bn       19. Ireland
                                                                  US$1.1bn


Note: The picture is dominated by 18 governments that are members of the Organisation for Economic Cooperation and Development (OECD)’s
Development Assistance Committee (DAC). They are joined by Saudi Arabia (16th largest government donor over 10 years) and United Arab Emirates
(UAE, 20th largest). The five OECD DAC members not included in the ‘top 20’ are: Austria (21st largest), Greece (22nd), Luxembourg (23rd), Portugal (24th)
and Korea (28th). Source: Development Initiatives based on OECD DAC and United Nations Office for the Coordination of Humanitarian Affairs (UN OCHA)
Financial Tracking Service (FTS) data

                                                                                                                                                         11
FiGuRe 2: Five lARGest GoveRnment donoRs oF HumAnitARiAn Aid, 2000–2009


                                     14                                                                                                Netherlands
                                                                                                                                       Germany
                                     12                                                                                                United Kingdom
                                                                                                                                       EU institutions
US$ BILLION (CONSTANT 2009 PRICES)


                                     10                                                                                                United States
                                                                                                                                       Total from OECD DAC members
                                     8                                                                                                 Total from non-OECD DAC governments
                                                                                                                                       Total from all governments
                                     6


                                     4


                                     2


                                     0
                                          2000    2001   2002     2003      2004       2005       2006      2007      2008      2009


      Note: This figure shows the five largest government donors in relation to the total from their OECD DAC peers, other governments (as captured
      by UN OCHA FTS) and the total provided by all governments. Source: Development Initiatives based on OECD DAC and UN OCHA FTS data


      Overall, the international government                                        and the earthquake in China); and 6%
      response to humanitarian crises is                                           higher than in 2009. Full final data is not yet
      estimated to have reached US$12.4 billion in                                 available for OECD DAC members in 2010,
      2010 – the highest total on record. This was                                 but it is likely (and is certainly the case for
      US$1 billion higher than in 2005, a year that                                other governments), that the increase will
      was previously described as ‘exceptional’ in                                 have been in response to the emergencies
      response to the Indian Ocean-earthquake/                                     in Haiti and Pakistan (see Section 1.2,
      tsunami and the South Asia (Kashmir)                                         ‘Where does the funding go?’).
      earthquake; slightly higher than in 2008
                                                                                   Looking back at the trends since 2000,
      (when the main response was to food
                                                                                   every couple of years there has been a
      insecurity, notably in Ethiopia, Cyclones
                                                                                   step change in response from OECD DAC
      Nargis (Myanmar) and Sidr (Bangladesh)
                                                                                   members. They provided between


      FiGuRe 3: HumAnitARiAn Aid FRom GoveRnment donoRs, 2000–2010


                                     14                                                                                                Total from non-OECD DAC governments
                                                                                                            12.3             12.4      Total from OECD DAC members
                                     12                                         11.4                                 11.7

                                                                                           10.2
                                     10                                                             9.3
                                                                          8.4
     US$ BILLION


                                                                 8.2
                                      8            7.1
                                            6.7           6.8
                                      6

                                      4

                                      2

                                     0
                                           2000   2001   2002   2003     2004   2005      2006     2007     2008    2009     2010e


      Note: Data for members of the OECD DAC includes core official development assistance (ODA) contributions to the United Nations High Commissioner for
      Refugees (UNHCR), UN Relief and Works Agency for Palestine Refugees in the Near East (UNRWA) and the World Food Programme (WFP) to 2009. Data
      for 2010 is an estimate based on partial preliminary data releases (constant 2009 prices). Data for non-OECD DAC members includes all other government
      humanitarian aid, as captured by UN OCHA FTS (current prices). Our distinction between these two groups of government donors is entirely driven by the
      data. Source: Development Initiatives based on OECD DAC and UN OCHA FTS data

   12
FiGuRe 4: HumAnitARiAn Aid FRom oeCd dAC GoveRnments, 2000–2009


                                     25                                                                                          11.8
                                                                                                                   11.4   11.2
                                                                                            10.8
US$ BILLION (CONSTANT 2009 PRICES)


                                                                                                     9.9
                                     20
                                                                                                            9.0
                                                                            8.1     8.2

                                     15                            6.7
                                              6.7         6.5


                                     10


                                      5


                                      0
                                          2000           2001     2002     2003     2004    2005    2006    2007   2008   2009   2010e


  Note: Data for 2010 is estimated, based on partial preliminary data release (constant 2009 prices). We do not yet have
  details of core multilateral ODA contributions to UNHCR, UNRWA and WFP that year. Source: Development Initiatives
  based on OECD DAC data


     US$6 billion and US$7 billion over the                                                 The volume of humanitarian aid reported      Saudi Arabia. It made up 98% of total
     period 2000-2002; between US$8 billion                                                 from other governments has fluctuated        contributions in 2001, 36% in 2008 and
     and US$10 billion over the period 2003-                                                between US$34.7 million in 2000 and          32% in 2010. On the basis of this data,
     2005; between US$9 billion and US$11                                                   US$622.5 million in 2010, and totals         (which is not directly comparable with that
     billion over the period 2005-2007; and                                                 US$4.4 billion over the 11-year period.      reported to the OECD DAC Secretariat by
     around US$12 billion since 2008.                                                       But while an upward trend is apparent,       its members), Saudi Arabia has contributed
                                                                                            there are fluctuations in reporting as       more than Belgium, Finland and Ireland;
     In the past, we have referred to this as
                                                                                            well as in giving.                           and UAE more than Austria, Greece,
     ‘the ratchet effect’ – where every major
                                                                                                                                         Luxembourg, Portugal, New Zealand
     headline crisis drives funding to new                                                  The spike in aid in 2005 was in part due
                                                                                                                                         and Korea.
     levels, which do tend to recede but are still                                          to the Indian Ocean-earthquake/tsunami.
     considerably higher than the year prior                                                Spikes in 2001 and 2008 however are
     to the crisis.                                                                         largely due to single contributions from


  FiGuRe 5: HumAnitARiAn Aid FRom non-oeCd dAC GoveRnments, 2000–2010


                                     1000                                                                           939
                                      900

                                      800

                                      700                   665
                                                                                             625                                  623
                                      600                                                                                 555
US$ MILLION


                                      500

                                      400
                                                                                                     287     311
                                      300
                                                                                      192
                                      200                                    155
                                                                     98
                                      100           35
                                          0
                                                2000       2001     2002     2003    2004    2005    2006   2007   2008   2009   2010


  Note: The number of donors reporting varies from 52 in 2000 to 99 in 2005 and from 87 in 2009 to 127 in 2010.
  Source: Development Initiatives based on UN OCHA FTS data


                                                                                                                                                                                 13
FiGuRe 6: tHe 30 lARGest GoveRnment ContRiButoRs oF HumAnitARiAn Aid oveR 10 yeARs, 2000-2009


RAnk donoR                               us$m       numBeR oF      sHARe       sHARe oF           peR Citizen, RAnk By              RAnk By
                                                    times A top    oF totAl    donoR’s            2009 (us$)   Amount               sHARe oF
                                                    10 donoR       pRovided By totAl odA                       Given peR            Gni, 2009
                                                                   GoveRnments                                 Citizen, 2009

     1    united states                    30,971         10            33.6%          14.9%            14              15                13

     2    eu institutions                  14,864         10            16.1%          13.4%             -                -                 -

     3    united kingdom                   8,183          10             8.9%          11.0%            17              12                 8

     4    Germany                          6,527          10             7.1%           7.4%            9               21                16

     5    netherlands                      5,094          10             5.5%           9.0%            31               7                 6

     6    sweden                           4,385          10             4.8%          13.0%            62               4                 2

     7    Japan                            4,026          5              4.4%           4.0%            2               28                26

     8    norway                           3,681          9              4.0%          11.5%            79               2                 3

     9    France                           3,597          9              3.9%           4.6%            7               22                21

     10   italy                            3,552          9              3.9%          11.4%            6               24                19

     11   spain                            3,223          4              3.5%           8.3%            14              14                 9

     12   Canada                           2,640          1              2.9%           7.9%            12              16                14

     13   denmark                          2,278          0              2.5%           8.5%            44               5                 5

     14   switzerland                      2,224          1              2.4%          12.4%            25               9                11

     15   Australia                        2,132          0              2.3%          10.2%            15              13                 12

     16   saudi Arabia                     1,894          2              2.1%             –             3               23                 18

     17   Belgium                          1,446          0              1.6%           8.1%            19              11                 10

     18   Finland                          1,148          0              1.2%          12.9%            29               8                 7

     19   ireland                          1,127          0              1.2%          13.8%            32               6                 4

     20   uAe                               755           0              0.8%             –             77               3                 93

     21   Austria                           548           0              0.6%           6.9%            9                20                17

     22   Greece                            445           0              0.5%           8.7%            4                26                20

     23   luxembourg                        405           0              0.4%           12.2%          121               1                 1

     24   portugal                          272           0              0.3%           5.6%            2                29                23

     25   new zealand                       234           0              0.3%           9.3%            6                23                15

     26   kuwait                            221           0              0.2%              –            11               17                93

     27   Russia                            175           0              0.2%              –            0                41                30

     28   korea                             146           0              0.2%           3.1%            0                39                32

     29   turkey                            134           0              0.1%              –            0                47                40

     30   China                              94           0              0.1%              –            0                93                86

Note: Data for members of the OECD DAC (23 governments plus EU institutions) includes core ODA to UNHCR, UNRWA and WFP as reported to the OECD
DAC (and core ODA to EU institutions for EU15 members). Data for China, Kuwait, Russia, Saudi Arabia, Turkey and UAE is from UN OCHA FTS. The amounts
include contributions through the UN’s Central Emergency Response Fund (CERF) and pooled funding mechanisms. The rankings are based on a list of 164
countries. Gross national income (GNI) data is also taken from the OECD DAC. Per citizen rankings are based on population data from UN Department of
Economic and Social Affairs

14
FiGuRe 7: 20 lARGest donoRs oveR Five yeARs, 2005-2009


              20 18.8
              18
              16
              14
US$ BILLION


              12
              10                      8.9
               8
               6                                           4.6
                                                                              3.8
               4                                                                           3.0             2.6         2.3        2.1         2.1         1.9         1.9         1.7
               2                                                                                                                                                                               1.4           1.3                1.1               1.1                0.9           0.8           0.7           0.7
               0
                 1. United States


                                    2. EU institutions


                                                         3. United Kingdom


                                                                             4. Germany


                                                                                          5. Netherlands


                                                                                                           6. Sweden


                                                                                                                       7. Spain


                                                                                                                                  8. France


                                                                                                                                              9. Norway


                                                                                                                                                          10. Italy


                                                                                                                                                                      11. Japan


                                                                                                                                                                                  12. Canada


                                                                                                                                                                                               13. Denmark


                                                                                                                                                                                                             14. Australia


                                                                                                                                                                                                                                15. Switzerland


                                                                                                                                                                                                                                                  16. Saudi Arabia


                                                                                                                                                                                                                                                                     17. Belgium


                                                                                                                                                                                                                                                                                   18. Ireland


                                                                                                                                                                                                                                                                                                 19. Finland


                                                                                                                                                                                                                                                                                                               20. UAE
 Source: Development Initiatives based on OECD DAC and UN OCHA FTS data


 There have been no major changes to                                                                                   Preliminary partial data (which does not
 the list of the top 20 donors when viewed                                                                             include donors’ totally unearmarked funds                                                             How GeneRous ARe
 over the past five years, compared with                                                                               – i.e. core contributions to UN agencies                                                              GoveRnments?
 the ten-year period. There have been a                                                                                or EU institutions), suggests that Spain’s                                                            Calculating contributions that
 few minor shifts within the list (France                                                                              expenditure may have dipped in 2010, along                                                            governments make takes on a
 and Norway have switched places, as                                                                                   with that of 12 other OECD DAC members.                                                               different perspective when looked
 have Switzerland/Australia and Finland/                                                                               The Netherlands’ humanitarian expenditure                                                             at alongside their national wealth.
 Ireland), and one significant one – Spain                                                                             contracted for the second year in a row,                                                              While the United States is by far
 and Japan change places as seventh and                                                                                as did that of Austria, Denmark, Greece,                                                              the largest humanitarian donor
 eleventh largest donors.                                                                                              Korea and Portugal. Ireland’s humanitarian                                                            overall, 12 countries contribute
                                                                                                                       aid declined for the third consecutive year.                                                          higher shares of their gross national
 In fact, Spain has doubled its humanitarian
                                                                                                                       However, overall, the dip in volumes from                                                             income (GNI). Luxembourg, Sweden,
 aid contributions since 2000, rising from
                                                                                                                       these donors is offset by large increases                                                             Norway, Ireland and Denmark
 fifteenth largest donor that year to become
                                                                                                                       in expenditure by the United States (up by                                                            are the ‘top five’ donors when
 the fifth largest in 2009 (the latest year for
                                                                                                                       some US$400 million), Canada (by US$129                                                               contributions are measured on this
 which we have full final data for OECD DAC
                                                                                                                       million) and Japan (by US$275 million). This                                                          basis. Another way of considering
 members). Its share of total government
                                                                                                                       is likely to be attributable to expenditure in                                                        generosity is to look at contributions
 contributions has risen from 2.8% to 5.4%.
                                                                                                                       Haiti and Pakistan.                                                                                   on a per citizen basis. Citizens of
                                                                                                                                                                                                                             Luxembourg, Norway, UAE, Sweden
                                                                                                                                                                                                                             and Denmark are the biggest
                                                                                                                                                                                                                             humanitarian donors on this basis,
                                                                                                                                                                                                                             providing US$44-US$121 per person
                                                                                                                                                                                                                             compared with US$14 per US citizen
                                                                                                                                                                                                                             or US$17 per UK citizen for example.


                                                                                                                                                                                                                                                                                                                   15
FiGuRe 8: inCReAses And deCReAses in HumAnitARiAn Aid expendituRe oF oeCd dAC memBeRs, 2008-2010


 us$m                                      2008                     2009                    2010
 Australia                                 135                       23                      -42
 Austria                                    28                       -7                      -13
 Belgium                                    27                       -6                       52
 Canada                                     67                       -9                      129
 denmark                                    16                      -34                      -51
 Finland                                   -23                       16                       -4
 France                                    -14                       16                       16
 Germany                                     6                       73                      -33
 Greece                                      3                       -2                      -10
 ireland                                   -18                      -67                       -5
 italy                                      28                       -3                      -68
 Japan                                     164                      -20                      275
 korea                                       8                       -5                       -3
 luxembourg                                  0                       6                        10
 netherlands                                36                      -84                      -73
 new zealand                                -2                       -9                       3
 norway                                    -35                      -44                       68
 portugal                                    0                       -0                       -1
 spain                                     182                       26                      -64
 sweden                                     38                       36                      -11
 switzerland                               -29                       -9                       2
 united kingdom                            160                      145                       -9
 united states                             1334                     -45                      430
 eu institutions                           296                     -346                       84

Note: The figures are based on partial data in each year. ‘Partial data’ refers to directly administered projects and activities
(sometimes also called ‘earmarked’ or ‘bilateral’ humanitarian aid) and does not include totally unearmarked (core) ODA
contributions to UN agencies or EU institutions. Source: Development Initiatives based on OECD DAC data


Saudi Arabia’s humanitarian aid increased              US$50 million, to make it the second
by US$174 million between 2009 and                     largest non-OECD DAC donor. Other
2010, US$50 million of which was due to                increases in contributions of humanitarian
its contribution to the Haiti emergency                aid and appearances in the top 10 list of
response fund (ERF), while UAE’s aid                   non-OECD DAC government donors in 2010
levels appear to have declined. Turkey’s               were similarly driven by response to these
reported contributions increased by                    two crises.


FiGuRe 9: top 10 non-oeCd dAC GoveRnments’ HumAnitARiAn Aid expendituRe, 2008-2010


 RAnk                    2008                                                2009                                                   2010

     1       saudi Arabia                        us$566m          united Arab emirates             us$353m           saudi Arabia           us$256m
     2       united Arab emirates                us$110m          saudi Arabia                     us$82m            turkey                 us$61m
     3       kuwait                              us$96m           kuwait                           us$34m            Russian Federation     us$38m
     4       Russian Federation                  us$44m           Russian Federation               us$32m            united Arab emirates   us$38m
     5        thailand                           us$27m           Qatar                            us$13m            China                  us$38m
     6        kazakhstan                         us$10m           india                            us$11m            india                  us$37m
     7        turkey                             us$10m           turkey                            us$5m            Brazil                 us$29m
     8        China                               us$9m           Czech Republic                    us$4m            thailand               us$12m
     9        iraq                                us$8m           Hong kong                         us$4m            mexico                 us$11m
     10       singapore                           us$6m           poland                            us$2m            kuwait                 us$11m


Source: Development Initiatives based on UN OCHA FTS data

16
FiGuRe 10: sHARes oF tHe us$11.7 Billion in HumAnitARiAn Aid pRovided By GoveRnments in 2009


Some 107 governments and EU institutions
participated in the international humanitarian
response to crises in 2009, raising US$11.7
billion. Over half of the funding came from just
three donors – the United States, European
institutions and the United Kingdom.

                                                                                                 United States     US$4.4bn
                                                                                                 EU institutions   US$1.6bn
                                                                                                 United Kingdom    US$1.0bn


                                                                                                      two GoveRnments And tHe
                     Germany          US$727m                                                         eu institutions pRovided
                     Spain            US$632m                                                         oveR us$1bn eACH
                     Sweden           US$573m
                     Netherlands      US$508m
                                                                                          18%


                                        FouR GoveRnments
                                        pRovided Between
                                        us$500m And
                                        us$1bn eACH
 France           US$406m
 Canada           US$396m                                    17%
 Norway           US$375m
 Italy            US$362m
 UAE              US$353m
 Australia        US$324m
                                  six GoveRnments
                                  pRovided Between
                                  us$300m And
                                  us$500m eACH


 Japan            US$298m         six GoveRnments                   9%
                                  pRovided Between
 Denmark          US$242m         us$100m And
 Belgium          US$202m         us$300m eACH
 Switzerland      US$186m                                                            3%    53%
 Finland          US$151m
 Ireland          US$142m
                                        eiGHt GoveRnments
                                        pRovided Between
                                        us$25m And us$100m eACH


                                                                    11 GoveRnments pRovided
                     Saudi Arabia       US$82m                      Between us$1m And
                     Austria            US$77m                      us$25m eACH
                     Luxembourg         US$59m
                     Greece             US$50m
                                                                    Korea             US$19m
                     Kuwait             US$34m
                                                                    Qatar             US$13m
                     Russia             US$32m
                                                                    India             US$11m
                     New Zealand        US$27m
                                                                    Turkey             US$5m
                     Portugal           US$25m
                                                                    Czech Republic     US$4m
                                                                    Hong Kong          US$4m
                                                                    Poland             US$2m
                                                                    Oman               US$2m
                                                                    Brazil             US$2m
                                                                    Estonia            US$1m
                                                                    South Africa       US$1m


A further 70 governments provided up to us$1 million each

Source: Development Initiatives based on OECD DAC and UN OCHA FTS

                                                                                                                                 17
FiGuRe 11: oeCd dAC memBeRs’ HumAnitARiAn Aid As A sHARe oF tHeiR totAl odA, exCludinG deBt RelieF, 2000-2009


                                      140                                                                                       12%
 US$ BILLION (CONSTANT 2009 PRICES)


                                                                                                                         129            Other ODA
                                                                                                                   122
                                      120                                                                                               Humanitarian aid
                                                                                       106     106    109                       10%
                                      100                                       97
                                                    84    87     86      87                                                     8%
                                       80
                                                                                                                                6%
                                       60
                                                                                                                                4%
                                       40

                                       20                                                                                       2%

                                          0                                                                                     0%
                                               2000      2001   2002    2003   2004    2005   2006    2007     2008      2009


    Note: The line on the graph shows clear peaks in the humanitarian share of ODA in 2003 (Afghanistan, Iraq), 2005 (Indian Ocean-earthquake/tsunami
    and South Asia (Kashmir) earthquake and 2008 (food insecurity, China earthquake, cyclones in Myanmar and Bangladesh). Source: Development
    Initiatives based on OECD DAC

    Humanitarian aid from governments is just                                         India, China and South Africa (BRICS),
    one element of financial assistance that                                          these other aid resources from these
    might flow to crisis-affected countries. For                                      governments more than doubled between
    members of the OECD DAC for example,                                              2005 and 2009, from US$4.6 billion to
    humanitarian aid represents just 8.7% of                                          US$10.4 billion.
    their total ODA expenditure since 2000.
                                                                                      China’s foreign assistance is reported to
    This ‘other’ ODA includes aspects of
                                                                                      have reached US$2 billion in 2009 (while
    longer-term development finance, and
                                                                                      the reported humanitarian aid figure is
    governance and security expenditure,
                                                                                      well under US$1million in the same year).
    which are also vital flows of assistance to
                                                                                      Russia’s foreign assistance significantly
    people living through humanitarian crises
                                                                                      increased between 2008 and 2009, from
    (see Chapter 3).
                                                                                      US$200 million to US$800 million but
    Saudi Arabia, Kuwait, UAE and several                                             the amounts of humanitarian aid reported
    other donors also report ODA expenditure                                          to UN OCHA FTS in those two years
    to the DAC. Taken together with foreign                                           were US$44 million and US$32.5 million
    assistance reported by Brazil, Russia,                                            respectively.


    FiGuRe 12: odA And FoReiGn AssistAnCe FRom non-oeCd dAC memBeRs, 2005-2009


                                      12                                                                                                ODA from Saudi Arabia, UAE, Kuwait
                                                                                                            11.2
                                                                                                                                 10.4   Foreign assistance from BRICS
                                                                                                                                        ODA from other non-OECD DAC members
                                      10


                                      8
                                                                                      6.8
US$ BILLION


                                                                  6.5

                                      6
                                              4.6

                                      4


                                      2


                                      0
                                           2005                  2006                 2007               2008                   2009


    Note: Foreign assistance for BRICS is a conservative estimate based on various secondary sources. Source: Various. See ‘Data & Guides’


 18
nAtionAl GoveRnments

 National governments are primarily                    Between 2005 and 2010, the Indian                    As a donor of international assistance,
 responsible for taking care of their citizens in      government contributed US$4.8 billion to             India gave over US$43 million between
 disasters and emergencies. We do not have             its own State Disaster Response Fund                 2005 and 2009, and in 2010 it provided
 a global figure for how much governments              (SDRF, formerly Calamity Relief Fund)                US$36 million in response to the Pakistan
 spend on crises in their own countries                and between 2005 and 2009 it contributed             earthquake alone. In 2011 it announced
 – but we know that the expenditure can                US$1.4 billion to the National Disaster              US$5 billion of aid to Africa.
 be significant. For example Indonesia’s               Response Fund (NDRF, formerly National
                                                                                                            For more information on domestic
 government expenditure on disaster                    Calamity Contingency Fund). When these
                                                                                                            response, see Chapter 3.
 response increased from over US$50 million            sums are combined (US$6.2 billion), they
 in 2001 to more than US$250 million by 2007           far outstrip the international humanitarian
 (GHA Report 2010, p74). A further example             response to disasters in India (US$315
 is India, which operates both state- and              million) and amount to two-thirds of the
 national-level disaster funds.                        total ODA received by the country over
                                                       the period.


 FiGuRe 13: inteRnAtionAl HumAnitARiAn Response, 2006-2010 (us$ Billion)


                                                     16.4                                    16.7
                                                                         15.7                 4.3              Private contributions
                                                     4.1
                                                                          3.9                                  Governments
                                                                                                               International humanitarian response
              12.9             12.8
              2.7               3.5
                                                     12.3                                     12.4
                                                                         11.7
              10.2
                                9.3
US$ BILLION


              2006             2007                 2008                 2009                2010


   Note: All figures for 2010 are preliminary estimates. Private contribution figures for 2006-2008 are based on our own research of a study set of NGOs and
   UN delivery agencies. The figure for 2009 is an estimate. The figure for 2010 is a preliminary estimate. Source: Development Initiatives based on OECD DAC
   and UN OCHA FTS data, annual reports and our own research (see ‘Data & Guides’)


 pRivAte ContRiButions
 In addition to humanitarian assistance from           Movement. We estimate funding from                   between 2008 and 2009 (from US$864
 government donors, funding from private               private sources to have been between                 million to US$798 million) – but reached
 sources contributes to the humanitarian               US$2.7 billion and US$4.3 billion in each            a record US$1.1 billion in 2010.
 response – in some years, substantially               of the past five years – around a quarter
                                                                                                            Private funding for humanitarian
 so. In addition to the national assistance            of the average annual total of US$16 billion
                                                                                                            assistance not only represents an
 provided by families, neighbours,                     in international response.
                                                                                                            important share of the total in any given
 communities, diaspora and local private
                                                       Our own research and estimates indicate              year; it can also be particularly significant
 sector, the main private donors of
                                                       that overall private contributions decreased         in certain contexts where it can equal
 humanitarian aid are individuals, private
                                                       in 2009 due to a decline in the number and           or even exceed the support given by
 foundations, trusts, private companies and
                                                       intensity of sudden onset humanitarian               government donors – for example in Haiti
 corporations. The money is typically raised
                                                       crises, rising again in 2010 prompted by             in 2010 and the Indian Ocean-earthquake/
 by and channelled through humanitarian
                                                       the disasters in Haiti and Pakistan. As an           tsunami in 2005 (see following section,
 organisations, whether non-government
                                                       example, private funding to Médecins Sans            ‘Where does the funding go?’).
 organisations (NGOs), UN agencies or the
                                                       Frontières (MSF) declined by US$66 million
 International Red Cross and Red Crescent


                                                                                                                                                           19
pHilAntHRopiC GivinG
     Philanthropic giving is thought to          be treated as directly comparable
     be a major source of funding – but          with the humanitarian aid reported by
     not much is known about the extent          governments. However, as an indicator
     of this, specifically in humanitarian       of scale, philanthropic giving for one
     contexts. The William and Flora Hewlett     year would be on the same scale as
     Foundation for example, which in April      that of the United States government’s
     2011 became the first philanthropic         US$30 billion over the last ten years,
     signatory to the International Aid          on the basis of these figures.
     Transparency Initiative (IATI) standard,
     disbursed US$345 million in grants in       FiGuRe 14: CountRy-AlloCABle HeAltH
     2009 for projects in the United States      expendituRe RepoRted to tHe oeCd
     as well as for global development           dAC By Bill & melindA GAtes
     and international population                FoundAtion, 2009
     programmes, and US$358 million in
     2010 (organisation’s own estimates).         CountRy             us$m       un CAp
     Currently just over US$472 million in                                       AppeAl
                                                                                 in 2009?
     commitment information since 2006 is
     available for analysis from open data        Bangladesh          17.0           No
     format. As yet, most activities are only
     categorised by region – and the amount       Botswana            29.8           No
     spent in humanitarian crises is difficult    China               46.2           No
     to discern.
                                                  Ethiopia             8.2           No
     In 2009, a further major philanthropic
                                                  Ghana                7.0           No
     organisation, the Bill & Melinda Gates
     Foundation, reported US$1.7 billion in       India               119.4          No
     health expenditure to the OECD DAC.          Indonesia            2.0           No
     Two of the countries in which it spent
                                                  Kenya               24.1           Yes
     this money – Kenya and Pakistan – had
     humanitarian needs as indicated by a         Malawi               2.2           No
     UN consolidated appeal process (CAP)
                                                  Mali                10.5           No
     appeal that year.
                                                  Nigeria             45.9           No
     Meanwhile, two other institutional
     sources of information, The Hudson           Pakistan            34.0           Yes
     Institute’s Index of Global Philanthropy     Senegal             10.0           No
     and Remittances 2011 and The
                                                  South Africa         0.9           No
     Foundation Centre, put philanthropic
     giving from the United States between        Tanzania             5.7           No
     US$37 billion and US$46 billion in           Zambia               8.4           No
     2009/2010. These figures include
     monetised volunteering as well as           Source: Development Initiatives based
     commodities and finance, so cannot          on OECD DAC and UN OCHA FTS


Moreover, the assessment of all                  crises. In the same way, when donors
the different sources of funding for             make a choice on funding allocation (such
humanitarian aid has deeper implications         as supporting one part of the delivery
than the mere tracking of financial flows        system instead of another, or earmarking
within the system. The source of funding         funding for a specific sector, region or
affects the type, duration and scope             even time period), that has implications
of assistance delivered, as well as the          for the dynamics within the system as well
potential outcomes.                              as for the final delivery of aid. It is for that
                                                 reason that counting private contributions,
Private funding is largely regarded as
                                                 unravelling their role and tracing their
being more flexible and adaptable, thus
                                                 passage to delivery on the ground are
allowing humanitarian organisations to
                                                 critical for assessing the volumes of global
cover the types of cost and activity that may
                                                 humanitarian assistance.
not be attractive to donor governments
or to enable them to work in neglected


20
THE STORY
Expenditure on disaster risk reduction (DRR) is rising slowly – but it still      CREDIT

represents only 1% of the US$150 billion spent in the top 20 humanitarian         © IFRC / Rob Few
recipient countries over the past five years. This photo from the International
Federation of Red Cross and Red Crescent Societies (IFRC) shows a disaster
preparedness training session in Natutu, Fiji.


                                                                                                     21
1.2 wHeRe does tHe FundinG Go?

FiGuRe 15: inteRnAtionAl HumAnitARiAn Aid By ReGion oveR ten yeARs, 2000-2009


                   Europe, Americas, Oceania: US$9.3bn, 10%
                   Middle East regional: US$0.9bn, 1%


                    TOP 3 RECIPIENTS:                                                                       TOP 3 RECIPIENTS:
                    Palestine/OPT, US$7.2bn         Middle East                 Africa allocable            Sudan, US$8.9bn
                    Iraq, US$5.1bn                  allocable by                by country:                 Ethiopia, US$4.8bn
                    Lebanon, US$1.9bn               country:                    US$36.4bn, 40%              DRC, US$3.3bn
                                                    US$17.0bn, 19%


                    Asia regional: US$2.3bn, 3%
                                                              Asia allocable
                     TOP 3 RECIPIENTS:                        by country:
                     Afghanistan, US$5.1bn                    US$18.6bn, 21%
                     Pakistan, US$2.4bn
                     Indonesia, US$2.4bn                                                                   Africa regional: US$5.4bn, 6%


Note: The figures include contributions from governments (members of the OECD DAC and others reporting to UN OCHA FTS) and private contributions
reported to UN OCHA FTS. This includes the money spent by these donors through UN agencies, NGOs and financing mechanisms such as the Central
Emergency Response Fund (CERF). In addition to the amounts shown, US$5 billion has been allocated to Europe, US$4.2 billion to the Americas and
US$142 million to Oceania. The totals here will not tally with those expressed in the ‘Where does the funding come from?’ section, where data from
UN OCHA FTS is supplemented by our own research on private contributions. Regional expenditure is that which has more than one destination country.
Source: Development Initiatives based on OECD DAC and UN OCHA FTS


ReGionAl pAtteRns
Since 2000, just under US$90 billion                     In the Middle East, expenditure is               Middle East, the conflict in Iraq drove levels
dollars has been spent on international                  dominated by Palestine/OPT, overall the          of humanitarian funding higher in both
humanitarian response. Africa received                   second largest recipient of humanitarian         2001 and 2003 before levelling off, dipping
the largest share of this (46%). Of the total,           aid over the last ten years, and Iraq.           slightly and now rising again as recovery
40% has been allocated to sub-Saharan                                                                     and reconstruction follow. Expenditure in
                                                         Over the past ten years, humanitarian
Africa, which includes Sudan, Ethiopia and                                                                Europe has declined since the end of the
                                                         aid to Africa has increased sharply, most
Democratic Republic of Congo (DRC) –                                                                      conflict in the Balkans, while the Americas
                                                         particularly to sub-Saharan countries
the largest, fifth largest and sixth largest                                                              maintain low levels of funding.
                                                         where, against a backdrop of conflicts
country recipients over the last ten years.
                                                         and drought that have displaced millions         Our analysis in the remainder of this
Asia received the next largest share                     of people, humanitarian needs are driven         section explores these trends in further
(24%). Conflict has been the main driver                 by lack of access to basic services, the         detail, focusing on the US$80 billion that
of the US$5.1 billion in humanitarian                    threat of communicable disease and               has been provided to 156 countries over
expenditure to the region’s largest                      food insecurity. Funding to Asia, which in       the last ten years (‘total allocable by
recipient, Afghanistan. Just under half that             addition to the Afghanistan conflict has         country’). It does not include the additional
amount (US$2.4 billion) has been spent in                been hit by several large-scale natural          US$10.9 billion that has been spent on
each of the region’s next largest recipients,            disasters and is home to large numbers of        regional or cross-border programmes that
Pakistan and Indonesia.                                  vulnerable people, has also risen. In the        have more than one destination country.

FiGuRe 16: inteRnAtionAl HumAnitARiAn Aid By ReGion sinCe 2000

              7
              6
                                                                                                                                     Europe
              5                                                                                                                      Africa
US$ BILLION


              4                                                                                                                      Americas
                                                                                                                                     Asia
              3
                                                                                                                                     Middle East
              2
              1

                  2000      2001       2002       2003        2004       2005        2006          2007      2008         2009

Note: The graph shows increased levels of funding to both Asia and Africa over the last decade, with spikes in both 2005 and 2008.
Source: Development Initiatives based on OECD DAC and UN OCHA FTS

22
CountRy vARiAtions

Just under US$80 billion in humanitarian aid      (with US$7.2 billion or 9.1% of the total),
has been allocated to some 156 countries          it accounts for just over one-fifth of the
over the last ten years. Over 70% of this         money spent in specific countries over
has been concentrated in 20 countries – all       the past decade.
but two of which are classified as ‘conflict-
                                                  Iraq (which has received US$5 billion,
affected’ (Jordan and Zimbabwe) and all
                                                  6.5% of the total), Afghanistan (similar
but five of which (Indonesia, Pakistan, Sri
                                                  volumes and share) and Ethiopia
Lanka, Uganda and Chad) are classified as
                                                  (US$4.8 billion or 6.1% of the total) are
‘long-term’ recipients of humanitarian aid
                                                  the third, fourth and fifth largest recipients
(see Chapter 3).
                                                  of the last decade. Though they have very
Sudan is the single largest recipient of          different humanitarian profiles these five
international humanitarian aid. It has            countries have been top 10 recipients in
received just under US$9 billion (11.2%) of       each of the last ten years. (See page 30,
the estimated total over the past decade          ‘Seven countries in focus’).
and has been the single largest recipient
in each of the last five years. Together with
the next largest recipient, Palestine/OPT


FiGuRe 17: top 20 ReCipients oF inteRnAtionAl HumAnitARiAn Aid, 2000-2009 (us$ Billion)


                                                             17.             19.
                                                            Jordan          Chad
                                                           US$1.3bn       US$1.1bn
                               20.                                                           16.
                             Liberia                                                        Angola
                            US$0.9bn                                                       US$1.3bn
                                                 11.
                                                Kenya
                                                US$1.7                    6.
                              13.                                        DRC
                                                                                                         8.
                             Serbia                                    US$3.3bn
                                                                                                      Pakistan
                            US$1.5bn                                                                  US$2.4bn

               15.                                                                                                      18.
            Zimbabwe                                                                                                  Burundi
            US$1.5bn                                                                                                 US$1.2bn

                                                   1.                                  4.
                                                 Sudan                            Afghanistan
                                                US$8.9bn                           US$5.1bn
                    12.                                                                                             7.
                Sri Lanka                                                                                         Somalia
                US$1.6bn                                                                                         US$2.6bn


            14.
          Uganda
                                                                          3.
         US$1.5bn                                                                                      5.
                                                                        Iraq
                                                                      US$5.1bn                      Ethiopia
                                     2.                                                            US$4.8bn
                               Palestine/OPT
                                 US$7.2bn


                                                                                           9.
                                                             10.
                                                                                       Indonesia
                                                           Lebanon
                                                                                       US$2.4bn
                                                           US$1.9bn


Source: Development Initiatives based on OECD DAC and UN OCHA FTS
                         TOP 20 RECIPIENTS OF INTERNATIONAL HUMANITARIAN AID 2000-2009 (US$bn)

                                                                                                                                23
FiGuRe 18: key dAtA on tHe 20 lARGest ReCipients oF inteRnAtionAl HumAnitARiAn Aid, 2000-2009


 CountRy               numBeR          inteRnAtionAl     sHARe oF totAl      HumAnitARiAn       ConFliCt-      lonG-teRm        sHARe FRom
 And RAnk              oF yeARs        HumAnitARiAn      AlloCABle By        sHARe oF           AFFeCted?      HumAnitARiAn     oeCd dAC
                       in top 10       Aid (us$bn)       CountRy             totAl odA                         Aid ReCipient?   memBeRs

 1. sudan                   10               8.9               11.2%              60.6%             Yes             Yes           95.4%

 2. palestine/opt           10               7.2               9.1%               37.6%             Yes             Yes           85.6%

 3. iraq                    10               5.1               6.5%               14.9%             Yes             Yes           96.0%

 4. Afghanistan             10               5.1               6.4%               17.1%             Yes             Yes           96.1%

 5. ethiopia                10               4.8               6.1%               21.3%             Yes             Yes           98.2%

 6. dRC                     9                3.3               4.2%               28.1%             Yes             Yes           99.5%

 7. somalia                 4                2.6               3.2%               68.3%             Yes             Yes           95.0%

 8. pakistan                4                2.4               3.1%               12.1%             Yes             No            80.0%

 9. indonesia               2                2.4               3.0%               16.1%             Yes             No            90.4%

 10. lebanon                2                1.9               2.4%               33.2%             Yes             Yes           90.9%

 11. kenya                  1                1.7               2.1%               17.2%             Yes             Yes           98.4%

 12. sri lanka              1                1.6               2.1%               21.3%             Yes             No            87.9%

 13. serbia                 2                1.5               2.0%               12.4%              Yes            Yes           99.6%

 14. uganda                 2                1.5               1.9%               10.6%              Yes            No            99.0%

 15. zimbabwe               3                1.5                1.9%              39.2%              No             Yes           98.8%

 16. Angola                 5                1.3                1.7%              31.8%              Yes            Yes           98.6%

 17. Jordan                 0                1.3                1.6%              16.8%              No             Yes           99.2%

 18. Burundi                2                1.2                1.5%              31.3%              Yes            Yes           99.2%

 19. Chad                   0                1.1                1.4%              30.1%              Yes             No           96.7%

 20. liberia                1                0.9                1.2%              31.8%              Yes            Yes           97.6%


Source: OECD DAC for DAC governments and EU institutions, 1995-2009. All other data from UN OCHA FTS and UN CERF

24
sHiFtinG tRends

Of the 20 countries listed in Figure 17, only
Angola and Serbia have clearly moved               The OECD Development Assistance           by country over the 10-year period
out of their emergency phases over the             Committee (DAC) comprises the             from 2000 to 2009. The remaining 4%
last five years. Now ranked as seventy-            European institutions and the 23          of our data 2000-2009 comes from
fifth and forty-ninth largest recipients           governments of: Australia, Austria,       UN OCHA Financial Tracking Service
of humanitarian aid respectively, both             Belgium, Canada, Denmark, Finland,        (FTS). UN OCHA FTS is the custodian
continue to receive other forms of official        France, Germany, Greece, Ireland,         of data relating to the UN consolidated
development assistance (ODA) but at much           Italy, Japan, Korea, Luxembourg, the      appeals process (CAP), which has
lower levels than during the first half of the     Netherlands, New Zealand, Norway,         accounted on average for 46% of the
decade. Their places as top 20 recipients of       Portugal, Spain, Sweden, Switzerland, the total sums captured by the FTS since
humanitarian aid between 2005 and 2009             United Kingdom and the United States.     2000. The reporting of the remaining
were taken by two countries that were                                                        amounts represents voluntary reporting
                                                   Information on humanitarian and
pushed into crisis by natural disasters –                                                    and can vary between donors and by
                                                   other aid expenditure is reported by
Myanmar (sixteenth largest recipient since                                                   donor by year. Hence, our reporting on
                                                   OECD DAC members along consistent
2005) and Bangladesh (nineteenth largest).                                                   the humanitarian aid expenditure of
                                                   lines each year – which means that
                                                                                             governments that are not members of
Of the other 18 countries, some accounted          we have comparable data for recipient
                                                                                             the OECD DAC and on private voluntary
for large shares of humanitarian aid at            countries going back to 1995 and detailed
                                                                                             contributions, often relates to that
the beginning of the five-year period (e.g.        project level data going back to 2005.
                                                                                             which has been captured through the
Indonesia), while natural disasters and            Overall, this information represents
                                                                                             UN appeals processes and financing
conflict pushed others into crises requiring       96% of our international humanitarian
                                                                                             mechanisms.
large-scale response either periodically or        response figures on the totals allocable
temporarily (e.g. Pakistan).
Within the top five recipients, while
Iraq is now receiving considerably less


FiGuRe 19: top 20 ReCipients oF inteRnAtionAl HumAnitARiAn Aid oveR Five And ten-yeAR peRiods CompARed


RAnk, 10 yeARs                          CHAnGe in lAst        RAnk, 5 yeARs
(2000-2009)                             Five yeARs            (2005-2009)

1.    Sudan                                    -              1.    Sudan
2.    Palestine/OPT                            -              2.    Palestine/OPT
3.    Iraq                                  +2                3.    Ethiopia
4.    Afghanistan                              -              4.    Afghanistan
5.    Ethiopia                               -2               5.    Iraq
6.    DRC                                      -              6.    DRC
7.    Somalia                               +1                7.    Pakistan
8.    Pakistan                              +1                8.    Indonesia
9.    Indonesia                             -2                9.    Somalia
10. Lebanon                                  -                10. Lebanon
11. Kenya                                   +1                11. Sri Lanka
12. Sri Lanka                               -1                12. Kenya
13. Serbia                                  +2                13. Zimbabwe
14. Uganda                                   -                14. Uganda
15. Zimbabwe                                +4                15. Chad
16. Angola                                  +5                16. Myanmar (+5)
17. Jordan                                     -              17. Jordan
18. Burundi                                    -              18. Burundi
19. Chad                                    +4                19. Bangladesh (+4)
20. Liberia                                    -              20. Liberia


Source: Development Initiatives based on OECD DAC and UN OCHA FTS

                                                                                                                                       25
humanitarian aid than it was between                                                            Other changes worthy of note include the
  2003 and 2005 (just over US$3 billion in                                                        case of Chad, which has received 87%
  that period), it is still receiving relatively                                                  (US$996 million) of the US$1.1 billion
  high levels of assistance (between                                                              spent in the country over the last decade
  US$360 million and US$470 million in                                                            during the last five years. In addition to
  each of the last three years) as its                                                            suffering political unrest within its own
  emergency phase passes from relief to                                                           borders, and being subject to frequent
  recovery. However, a spike in funding to                                                        drought, Chad continues to host to
  Ethiopia in 2005, together with drought and                                                     people displaced by conflicts in Darfur
  the food price crisis in 2008, have pushed                                                      and Central African Republic (CAR).
  the country from fifth to third largest                                                         Humanitarian aid to the country has been
  recipient over the past five years.                                                             rising steadily each year since 2005 to
                                                                                                  reach US$322 million in 2009, making
  Just outside the top five but receiving
                                                                                                  it the eleventh largest recipient that year.
  between US$300 million and US$570
  million in each of the last five years is                                                       However, perhaps one of the biggest
  Democratic Republic of Congo (DRC).                                                             stories to emerge from the data, and one
  The situation in DRC was classed as                                                             that is not visible by looking at ranking
  something of a ‘forgotten emergency’                                                            and aggregate volumes alone, is that
  during the early part of the decade, but                                                        humanitarian aid to Palestine/OPT has
  a concerted campaign of advocacy from                                                           more than doubled since 2005 – from
  non-governmental organisations (NGOs)                                                           just under US$500 million to just over
  and the UN, combined with changes in                                                            US$1.3 billion in 2009.
  the UN appeal process and funding
  architecture, has prompted a significant
  upturn in funding: US$2.3 billion of the
  US$3.3 billion (67%) that the country has
  received since 2000 has been provided in
  the past five years.


  FiGuRe 20: top 20 ReCipients oF inteRnAtionAl HumAnitARiAn Aid, 2005-2009


              8
                    7.0
              7

              6
US$ BILLION


              5
                                 4.3
              4
                                                   2.9
              3                                               2.5               2.3       2.3      2.1           2.0            2.0
              2                                                                                                                              1.5           1.4             1.2         1.2            1.0          1.0
              1                                                                                                                                                                                                               0.7           0.7          0.6           0.6              0.6

              0
                  1. Sudan


                             2. Palestine/OPT


                                                3. Ethiopia


                                                              4. Afghanistan


                                                                               5. Iraq


                                                                                         6. DRC


                                                                                                   7. Pakistan


                                                                                                                 8. Indonesia


                                                                                                                                9. Somalia


                                                                                                                                             10. Lebanon


                                                                                                                                                           11. Sri Lanka


                                                                                                                                                                           12. Kenya


                                                                                                                                                                                       13. Zimbabwe


                                                                                                                                                                                                      14. Uganda


                                                                                                                                                                                                                   15. Chad


                                                                                                                                                                                                                              16. Myanmar


                                                                                                                                                                                                                                            17. Jordan


                                                                                                                                                                                                                                                         18. Burundi


                                                                                                                                                                                                                                                                       19. Bangladesh


                                                                                                                                                                                                                                                                                        20. Liberia


                                                                                                                                                                                                              Private contributions
                                                                                                                                                                                                              Other governments
                                                                                                                                                                                                              OECD DAC members


  Source: Development Initiatives based on OECD DAC and UN OCHA FTS

 26
FiGuRe 21: sHARes oF inteRnAtionAl HumAnitARiAn Aid By ReCipient, 2009


                                        136 others: US$3.7bn

                                                               35%
                                                                                           Sudan: US$1.4bn
                                                                                   13%


                                                                                             12%     Palestine/OPT: US$1.3bn


                                                                                             7%
                                                                                                   Ethiopia: US$692m


                                                4%                                      6%
                    Zimbabwe: US$393m                                                         Afghanistan: US$634m
                                                     4%
                                                                                  5%
                              Kenya: US$400m              4%
                                                                 5%       5%           Somalia: US$573m
                                        Iraq: US$468m

                                           Pakistan: US$486m              DRC: US$567m


Source: Development Initiatives based on OECD DAC and UN OCHA FTS


CuRRent dRiveRs
Sudan remained the largest recipient of          Many donors have increased humanitarian                 expenditure there too (from US$5 million
humanitarian aid for the fifth consecutive       aid to Palestine/OPT. The United States                 to US$9.4 million).
year in 2009, accounting for US$1.4 billion      alone increased expenditure from US$22
                                                                                                         Of the next largest recipients (Ethiopia,
(or 13% of the total allocable by country).      million in 2008 to US$305 million in 2009.
                                                                                                         Afghanistan, Somalia and DRC), only
Although its share of the total went up          European institutions also increased their
                                                                                                         DRC actually received higher volumes
fractionally, its volume of humanitarian aid     bilateral expenditure there by some US$35
                                                                                                         of humanitarian aid in 2009 than in the
decreased slightly (by US$67 million). The       million, with contributions to the UN Relief
                                                                                                         previous year. Ethiopia received increased
huge rise in funding to Palestine/OPT (from      and Works Agency for Palestine Refugees
                                                                                                         humanitarian aid in 2008 due to drought
US$863 million in 2008) means that the           in the Near East (UNRWA) for emergency
                                                                                                         and food insecurity, which decreased in
gap between Sudan and the next largest           distress relief and reconstruction, and
                                                                                                         2009. Changes in Afghanistan and Somalia
recipient – historically around US$300           also to NGOs for food aid. The United
                                                                                                         were due mainly to a shift in emphasis from
million-US$600 million – is now down             Kingdom increased its expenditure by a
                                                                                                         humanitarian to development programming,
to US$100 million.                               similar amount and the Central Emergency
                                                                                                         notably by the EU institutions.
                                                 Response Fund (CERF) doubled its


FiGuRe 22: top 10 ReCipients oF inteRnAtionAl HumAnitARiAn AssistAnCe, 2005-2009 (us$)


            2005                         2006                              2007                           2008                       2009

Sudan              1.4bn     Sudan               1.4bn         Sudan               1.3bn      Sudan              1.5bn    Sudan             1.4bn
Indonesia          870m      Palestine/OPT       796m          Palestine/OPT       857m       Ethiopia           886m     Palestine/OPT     1.3bn
Pakistan           721m      Lebanon             536m          DRC                 414m       Palestine/OPT      863m     Ethiopia          692m
Iraq               696m      Indonesia           524m          Lebanon             363m       Afghanistan        860m     Afghanistan       634m
Ethiopia           658m      Pakistan            451m          Iraq                363m       Somalia            604m     Somalia           573m

Sri Lanka          544m      DRC                 435m          Afghanistan         317m       DRC                529m     DRC               567m
Palestine/OPT      498m      Iraq                423m          Ethiopia            300m       Myanmar            466m     Pakistan          486m
Afghanistan        320m      Afghanistan         349m          Bangladesh          285m       Iraq               376m     Iraq              468m
DRC                307m      Ethiopia            345m          Somalia             273m       Zimbabwe           334m     Kenya             400m
Zimbabwe           214m      Somalia             324m          Pakistan            252m       China              310m     Zimbabwe          393m
top 10 total       4.8bn                         4.2bn                             3.4bn                         5.2bn                      4.2bn


Source: Development Initiatives based on OECD DAC and UN OCHA FTS

                                                                                                                                                    27
FiGuRe 23: tHe 10 lARGest CHAnGes in inteRnAtionAl HumAnitARiAn Aid Flows, 2008-2009


     2008-2009        us$m     explAnAtion                             2008-2009   us$m       explAnAtion
                      inCReAse                                                     deCReAse

     palestine/opt 440            US, UK, EU and others increase       myanmar     -315       Had received US$450m in
                                  funding following Israeli                                   response to Cyclone Nargis and
                                  operation ‘Cast Lead’ at the                                floods in 2008. There were no
                                  start of the year which resulted                            UN CAP appeals in 2009.
                                  in large-scale devastation in the
                                  Gaza Strip.

     pakistan         290         Increase in the intensity of         China       -293       Had received US$310m in
                                  conflict in Northern territories                            response to Sichuan earthquake
                                  lead to further mass forced                                 in 2008.
                                  displacement.

     indonesia        132         Large earthquake hits West           Afghanistan -226       There was an upsurge of funding
                                  Sumatra, causes widespread                                  in 2008 to US$871m when
                                  damage to Padang.                                           food shortages and increased
                                                                                              insecurity contributed
                                                                                              to a significant increase in
                                                                                              humanitarian needs.

     kenya            95          Increase in Somali refugees,         ethiopia    -194       Had received increased flows
                                  food and livelihood insecurity                               due to food crisis in 2008
                                  particularly affecting the                                  (which continued into 2009).
                                  vulnerable urban poor.

     iraq             92          More humanitarian aid for the        uganda      -87        Had received funding in 2008 after
                                  recovery and reconstruction                                 instability in Acholi, Lango and
                                  after the war, in order to rebuild                          Teso as well as in response to
                                  infrastructure. Still many                                  drought and floods.
                                  internally displaced persons
                                  in the country.

     syria            83          Syria hosts the largest Iraqi        dpRk        -79        Food crisis in 2008 due to floods
                                  refugee population in the region.                           in 2007. Malnutrition and TB.
                                  The country was hit by a severe
                                  drought.

     Chad             72          Humanitarian aid flows for           Côte        -78        Special disbursements
                                  refugees from Sudan and CAR,         d’ivoire               made in 2008 for post-crisis
                                  but also to IDPs; a consequence                             rehabilitation.
                                  of insecurity in the country and
                                  the region.

     philippines      61          Tropical Storm Ketsana               Haiti       -67        A UN flash appeal was launched
                                  and Typhoon Parma cause                                     in 2008 following four successive
                                  devastation leaving 4.2 million                             hurricanes and tropical storms.
                                  people in need of assistance.

     zimbabwe         59          Increased food insecurity and a      liberia     -62        Increased flows in 2008 for UN
                                  country-wide cholera outbreak.                              ‘Critical Humanitarian Gaps
                                                                                              (CHG), focusing on health,
                                                                                              food security and water and
                                                                                              sanitation. This year was also
                                                                                              characterised by outbreaks of
                                                                                              yellow fever, cholera and acute
                                                                                              watery diarrhoea, floods, violent
                                                                                              land disputes and mob violence.

     dRC              38          Violence in North Kivu and        lebanon        -57        In 2008, assistance for 27,000
                                  causes population displacement.                             Palestinian refugees living in
                                  Assistance required for returnees                           Nahr el-Bared camp displaced
                                  in other parts of the country.                              by fighting in May-August 2007.
                                                                                              Assistance still required for
                                                                                              Lebanese people displaced by
                                                                                              the July-August 2006 conflict.

Source: Development Initiatives based on OECD DAC and UN OCHA FTS


28
FiGuRe 24: top ReCipient By HumAnitARiAn seCtoR, 2005-2009 (us$ million)


 seCtoR                                   2005                  2006                   2007                  2008                   2009

material relief assistance                Sudan                 Sudan                  Sudan                 Sudan                  Sudan
and services                              518                   608                    593                   529                    526

emergency food aid                        Sudan                 Sudan                  Sudan                 Sudan                  Sudan
                                          693                   504                    576                   687                    691

Relief coordination; protection           Indonesia             Sudan                  Palestine             Afghanistan            Pakistan
and support services                      6                     62                     21                    43                     48

Reconstruction relief                     Indonesia             Indonesia              Indonesia             Afghanistan            Afghanistan
and rehabilitation                        187                   289                    161                   355                    253

disaster prevention                       Iraq                  India                  Bangladesh            Bangladesh             Bangladesh
and preparedness                          47                    3                      5                     27                     26


Source: Development Initiatives based on OECD DAC


Although tracking volumes of humanitarian           Overall, around half of the humanitarian
aid tells us where the money is spent it            aid expenditure of OECD DAC members
does not tell us what it is spent on. There         over the last five years has been spent on
are considerable differences in sector              material relief assistance and services
expenditures across crises, even those              (such as water and sanitation and medical
we might consider to be rather similar.             assistance). In addition to aid provided to
                                                    Sudan, the particularly high shares of this
Unsurprisingly perhaps given the scale
                                                    type of humanitarian aid in 2005 reflect
of the humanitarian effort in the country,
                                                    expenditure following the Indian Ocean
Sudan has been the largest recipient
                                                    earthquake-tsunami and the South Asia
of both material relief assistance and
                                                    (Kashmir) earthquake. Emergency food
emergency food aid each year since 2005.
                                                    aid rises in response to crises in certain
Pakistan became the top recipient of                years, such as in 2008, and can represent a
relief coordination, protection and support         particularly high share of humanitarian aid
services, while Afghanistan remained the            for some countries. Ethiopia, for example,
top recipient of reconstruction and relief          has received 80.5% of its humanitarian aid
funding for the second year running.                in this way over the last five years.


FiGuRe 25: sHARes By types oF HumAnitARiAn Aid, 2005-2009


70%

60%
                                                                                                             Material relief assistance
50%                                                                                                          and services
                                                                                                             Emergency food aid
40%                                                                                                          Relief coordination; protection
                                                                                                             and support services
30%                                                                                                          Reconstruction relief and rehabilitation
                                                                                                             Disaster prevention and preparedness
20%

10%

 0%
              2005               2006                2007               2008                  2009


Note: The trends here show that, on average, around half of the humanitarian aid expenditure of OECD DAC members over the last five years has been
spent on ‘material relief assistance and services’, which means shelter and immediate basic needs such as water and sanitation and medical assistance.
Source: Development Initiatives based on OECD DAC

                                                                                                                                                         29
seven CountRies in FoCus

 FiGuRe 26: inteRnAtionAl HumAnitARiAn Response to seven CountRies sinCe 2000


              1,600


              1,400                                                                                                             1st Sudan
                                                                                                                                2nd Palestine /OPT

              1,200


              1,000
US$ MILLION


               800
                                                                                                                                3rd/5th Ethiopia
               600                                                                                                              4th Afghanistan

                                                                                                                                5th/3rd Iraq
               400                                                                                                              7th/8th Pakistan


               200
                                                                                                                                21st/30th Haiti

                 0
                      2000     2001       2002        2003         2004       2005       2006       2007    2008       2009


 Source: OECD DAC and UN OCHA FTS


 In countries where national governments
                                                             2nd pAlestine/opt                             4tH AFGHAnistAn
 are unable to operate, humanitarian aid
 is the tool used to deliver basic services –                Humanitarian aid to Palestine/OPT             Humanitarian aid to Afghanistan peaked
 food, water, shelter and basic health care.                 has doubled since 2005, increasing            in 2002 following the invasion in 2001,
 In some countries, such as Sudan, this is                   particularly sharply between 2008             levelled off between 2003 and 2007 and
 the case year in year out. In others, external              and 2009. The humanitarian crisis             rose steeply again in 2008 following
 support to meet these basic needs comes                     heightened following Israel’s blockade        drought and a sharp rise in food prices.
 in ‘short’ bursts – such as is the case in                  of Gaza in 2007 and the military              Afghanistan has experienced three
 Afghanistan, Iraq and Palestine/OPT, for                    offensive in December 2008. The               decades of war. Despite the insecurity,
 example, where governments are plunged                      population has limited access to basic        five million refugees have returned to
 into crisis and conflict. Other countries,                  provisions and services and is highly aid     the country since 2002, increasing its
 such as Haiti and Pakistan, might pass                      dependent. Since 2000 just under 37%          population by over 20% (UNHCR). The
 in and out of crises triggered by natural                   of total ODA has been in the form of          UN reports continued insecurity, forced
 disaster and/or conflict, sometimes with                    humanitarian aid.                             displacement and violence against
 scarcely long enough in between for the                                                                   civilians. The country is also periodically
 people affected to recover.                                                                               subject to natural disasters including
                                                                                                           flooding, earthquakes and drought. It
         1st sudAn                                           3Rd/5tH etHiopiA                              is the second largest recipient of ODA
                                                                                                           since 2000, receiving US$28.8 billion
         The largest recipient of international              Ethiopia is the third largest recipient of    over the period. Of this, 17.1% has been
         humanitarian aid over ten years                     humanitarian aid of the past five years       in the form of humanitarian aid.
         (US$8.9 billion in total), Sudan                    (US$2.9 billion) and the fifth largest
         faces a mixture of complex security,                (US$4.8 billion) over the past ten. The
         humanitarian, recovery and                          graph shows clear peaks following
         development challenges. Five years on               severe droughts in 2003 and 2008.
         from the signing of the comprehensive               Despite the importance of agriculture
         peace agreement (CPA), thousands of                 to its economy, the country suffers from
         people remain displaced, and in Darfur              food insecurity, which is attributed to
         the crisis continues. More than 268,000             a mixture of natural disasters such
         people were newly displaced in 2010                 as drought and floods, a growing
         alone and access to much of the region              population and damaging land policies.
         remains limited. More than 3.5 million              Internal and external conflicts have
         people are still receiving food aid. Since          exacerbated the problems. Over 21%
         2000, just over 60% of its total ODA has            of Ethiopia’s total ODA has been in
         been in the form of humanitarian aid.               the form of humanitarian aid over
                                                             the past ten years.


30
FiGuRe 27: wHAt HAs tHe money Been spent on? HumAnitARiAn Aid FRom oeCd dAC memBeRs, 2005-2009


                      mAteRiAl RelieF AssistAnCe


                                                                                                                          disAsteR pRevention And
                                                                         pRoteCtion And suppoRt


                                                                                                  ReConstRuCtion RelieF
                                                                         RelieF CooRdinAtion;
                                                    emeRGenCy Food Aid


                                                                                                  And ReHABilitAtion


                                                                                                                          ApRepARedness
                      And seRviCes


                                                                         seRviCes
Afghanistan           29.7%                        24.9%                      4.1%                40.8%                    0.5%

ethiopia              17.5%                        80.5%                      1.2%                   0.2%                  0.6%

Haiti                 39.4%                        24.3%                      3.2%                28.2%                    5.0%

iraq                  68.8%                        2.8%                       2.1%                24.1%                    2.2%

pakistan              66.3%                        11.5%                      3.0%                18.3%                    0.9%

palestine/opt         69.8%                        17.3%                      5.1%                   7.6%                  0.1%

sudan                 43.4%                        49.2%                      2.4%                   4.9%                  0.1%


Source: OECD DAC Creditor Reporting System (CRS)


 5tH/3Rd iRAQ                                                            21st/30tH HAiti                                                            7tH/8tH pAkistAn
 Iraq is the fifth largest recipient of                                  Haiti is the twenty-first largest                                          Pakistan is the seventh largest
 humanitarian aid over the past five years                               recipient of humanitarian aid since                                        recipient of humanitarian aid since
 (US$2.3 billion) and the third largest                                  2005 (US$549 million) and the thirtieth                                    2005 (US$2.1 billion) and the eighth
 over the past ten (US$5.1 billion).                                     largest since 2000 (US$652 million).                                       largest since 2000 (US$2.4 billion). It
 Its humanitarian aid peaked at                                          Political instability, weak economic                                       has a complex humanitarian profile.
 US$1.3 billion in 2003. Between 2003                                    infrastructure, poverty and lack of                                        It is classified as a middle income
 and 2007 needs became more sporadic                                     preparedness have amplified the impact                                     country but has the seventh highest
 and levels of humanitarian aid declined.                                of natural disasters on the population                                     concentration of poor people globally
 In 2007 sectarian violence led to further                               of Haiti and their economic assets over                                    – more than 60% of its 173 million
 population displacement and increased                                   the past decade. The country is highly                                     people live on less than US$2 a day.
 the need for assistance in 2008. Conflict                               aid dependent. Although the graph                                          37.6% of its total ODA over the past
 and sanctions have been the primary                                     since 2000 shows only a few surges in                                      ten years has been in the form of
 reasons for the country’s humanitarian                                  humanitarian aid (in 2004, 2005                                            humanitarian aid. It suffers from
 crises over the last 30 years – war with                                and 2006 following hurricanes in 2004)                                     repeated natural disasters including
 Iran in the 1980s, the first Gulf War                                   and a spike following the devastating                                      frequent flooding, storms, earthquakes
 following the invasion of Kuwait and the                                hurricane season in 2008, there have                                       and droughts. The South Asia (Kashmir)
 latest conflict, which began in March                                   been major fluctuations in the volume                                      earthquake of 2005 killed more than
 2003. While the latter did not result in a                              of humanitarian funding. Around 12.5%                                      70,000 people and followed severe
 country-wide humanitarian crisis, many                                  of its total ODA has been in the form                                      flooding that affected more than seven
 Iraqis and refugees from neighbouring                                   of humanitarian aid over the past                                          million. The 2010 flooding has been
 countries suffered. Minorities and                                      ten years.                                                                 even more overwhelming, affecting
 people caught up in the insurgency                                                                                                                 the lives of an estimated 20 million
 that started several months after the                                                                                                              people. The significant political and
 war were particularly affected. It is the                                                                                                          military events in the country and the
 largest recipient of ODA since 2000,                                                                                                               region have compounded the effects
 14.9% of which has been in the form                                                                                                                of natural disasters, as they have often
 of humanitarian aid. At present the                                                                                                                been played out in exactly the same
 country is in a transition between crisis                                                                                                          geographic areas. The number of
 and recovery. The majority of ODA is                                    More detailed profiles, and                                                refugees in the country, though down
 contributing towards: reconstruction;                                   humanitarian profiles of other                                             from the peak of 2.2 million in 2001,
 governance and security; and social                                     countries, are available at:                                               remains at 700,000, the third largest
 infrastructure and services projects.                                   www.globalhumanitarianassistance.org                                       refugee population in the world.


                                                                                                                                                                                           31
FiGuRe 28: donoR sHARes oF inteRnAtionAl HumAnitARiAn Response to tHe 20 lARGest ReCipients, 2005-2009


100%
90%
80%
70%
60%
50%
40%
30%
20%
10%
 0%
       Sudan


               Palestine/OPT


                               Ethiopia


                                          Afghanistan


                                                        Iraq


                                                               DRC


                                                                     Somalia


                                                                               Indonesia


                                                                                           Pakistan


                                                                                                      Lebanon


                                                                                                                Sri Lanka


                                                                                                                            Kenya


                                                                                                                                    Zimbabwe


                                                                                                                                               Uganda


                                                                                                                                                          Chad


                                                                                                                                                                 Jordan


                                                                                                                                                                          Myanmar


                                                                                                                                                                                    Burundi


                                                                                                                                                                                              Haiti


                                                                                                                                                                                                      Liberia
                                                                                                                                                        Private
                                                                                                                                                        Non-OECD DAC governments
                                                                                                                                                        OECD DAC members


Source: OECD DAC and UN OCHA FTS


sAme ReCipients, sAme donoRs?

Our overall analysis of international                                Each of these has been the subject of a UN
humanitarian aid to specific countries is                            appeal and/or has received funding through
dominated by the large contributions made                            either the UN CERF or other financing
by the OECD DAC members – particularly                               mechanisms.
when viewing the trends over five and ten
                                                                     The 2010 data reveals that three recipient
years (see Figure 6).
                                                                     countries that are not priorities for OECD
But in recent years, engagement in funding                           DAC members appear as the top ten
mechanisms and UN processes (see                                     priorities for non-OECD DAC members and
Section 1.3: ‘How does the funding get                               private contributors: Kyrgyzstan (subject
there?”) has made the contributions from                             of a UN consolidated appeal process (CAP)
other governments and private donors                                 appeal following civil unrest), Guatemala
more visible.                                                        (subject of a CAP appeal following food
                                                                     insecurity) and Chile (which received
Different types of donor have different
                                                                     just over US$10 million in CERF funding
priorities. Countries which have seen
                                                                     following an earthquake).
increased flows from both private
contributions and other governments                                  Outside the large-scale emergencies,
include Indonesia and Sri Lanka (in                                  which attract public attention, other
response to the Indian Ocean-earthquake/                             governmental contributions can also be
tsunami), Pakistan (South Asia                                       significant for some recipients that do not
earthquake), Myanmar (Cyclone Nargis),                               receive large volumes of funds from OECD
Somalia, Palestine/OPT and Lebanon.                                  DAC members.


32
FiGuRe 29: FundinG RepoRted to un oCHA Fts FoR seleCted lARGe-sCAle emeRGenCies


              Pakistan
          floods (2010)

                  Haiti
     earthquake (2010)

          Myanmar -
Cyclone Nargis (2008)

                 China
     earthquake (2008)

            South Asia
     earthquake (2008)

                       0%          10%          20%          30%          40%         50%          60%           70%         80%          90%           100%

                                                                                                              OECD DAC members
                                                                                                              Other governments
                                                                                                              Private funding
                                                                                                              Other


Note: While OECD DAC members have provided the larger share of contributions to some of the larger emergencies of the last two years, their contributions
following the China earthquake in 2008 were outstripped by other government and private contributions. This made China the top recipient of humanitarian
funding from the two latter donor groups in 2008 and also made it the 10th largest recipient in terms of international humanitarian response that year.
Source: UN OCHA FTS


FiGuRe 30: top 10 ReCipients oF HumAnitARiAn Aid FRom memBeRs oF tHe oeCd dAC, otHeR GoveRnment donoRs
And pRivAte ContRiButions As RepoRted to un oCHA Fts, 2010


oeCd dAC                  us$m           otHeR                  us$m          pRivAte                  us$m             estimAted               us$m
memBeRs                                  GoveRnments                          ContRiButions                             inteRnAtionAl
                                                                                                                        HumAnitARiAn
                                                                                                                        Response

1      Pakistan           2,180          1   Pakistan          356            1    Haiti               1,233            1   Haiti                3,384

2      Haiti              1,981          2   Haiti             170            2    Pakistan             338             2   Pakistan             2,874

3      Sudan              1,154          3   Yemen              14            3    Chile                 17             3   Sudan                1,159

4      Ethiopia           583            4   Afghanistan        11            4    Kyrgyzstan            6              4   Ethiopia              588

5      Afghanistan        563            5   Kyrgyzstan          9            5    Chad                  4              5   Afghanistan           574

6      DRC                494            6   Niger               5            6    Kenya                 3              6   DRC                   497

7      Palestine/OPT      319            7   Chile               5            7    Sri Lanka             3              7   Palestine/OPT         322

8      Niger              297            8   Sudan               5            8    Niger                 2              8   Niger                 305

9      Somalia            276            9   Chad                4            9    Guatemala             2              9   Somalia               278

10     Zimbabwe           248            10 DRC                  4            10 Palestine/OPT           2              10 Zimbabwe               253


Note: While OECD DAC members have provided the larger share of contributions to some of the larger emergencies of the last two years, their contributions
following the China earthquake in 2008 were outstripped by other government and private contributions. This made China the top recipient of humanitarian
funding from the two latter donor groups in 2008 and also made it the tenth largest recipient in terms of international humanitarian response that year.
Source: UN OCHA FTS


                                                                                                                                                        33
Figure 31, which ranks the largest                                         This engagement can give additional
recipients of contributions from non-OECD                                  perspective to the overall numbers.
DAC governments over the last five years                                   Although global volumes from other
from left to right, shows the contribution                                 governments are relatively small, within
of other donors to these same crises.                                      individual countries they are significant.
It clearly shows the importance of their                                   In addition to providing a more inclusive
contributions to Bangladesh, China, Yemen,                                 and comprehensive view of volumes of
Syria, Maldives (Indian Ocean-earthquake/                                  humanitarian assistance, the increased
tsunami), Tajikistan and Mauritania relative                               visibility of flows from all contributors
to OECD DAC members and private                                            helps to provide new perspectives on the
contributions. It also shows engagement                                    assistance provided to people living in
(increasingly through UN mechanisms) in                                    crises – its coordination, the structures
Pakistan, Palestine/OPT, Sudan, Ethiopia,                                  used to channel it and the effectiveness
Somalia and Niger.                                                         of its delivery.


FiGuRe 31: top 20 ReCipients oF HumAnitARiAn Aid FRom GoveRnments tHAt ARe not memBeRs
oF tHe oeCd dAC, 2005-2009, And sHARes oF otHeR donoR Response to tHe sAme CountRies


100%
90%
80%
70%
60%
50%
40%
30%
20%
10%
  0%
         Pakistan


                    Palestine/OPT


                                    Sudan


                                            Bangladesh


                                                         Lebanon


                                                                   China


                                                                            Yemen


                                                                                    Syria


                                                                                            Maldives


                                                                                                       Indonesia


                                                                                                                   Sri Lanka


                                                                                                                               Ethiopia


                                                                                                                                          Myanmar


                                                                                                                                                    Somalia


                                                                                                                                                                 Iraq


                                                                                                                                                                        Afghanistan


                                                                                                                                                                                      Tajikistan


                                                                                                                                                                                                   Mauritania


                                                                                                                                                                                                                Niger


                                                                                                                                                                                                                        Liberia


                                                                                                                                                              Private
                                                                                                                                                              OECD DAC members
                                                                                                                                                              Non-OECD DAC governments


Note: Some of these recipients are also donors, providing humanitarian assistance to the other countries, sometimes
in the same year. In 2008 for example, China provided US$9 million in humanitarian aid, US$5.7 million of this to Myanmar.
Source: OECD DAC and UN OCHA FTS

34
THE STORY
Just over 50% of the humanitarian aid expenditure of OECD DAC members over       CREDIT

the past five years has been spent on material relief assistance and services    © Ton Koene
such as water and sanitation and medical assistance. In this photo, taken just
outside Muyenga, Burundi, children fetch water from the local well in small
jerrycans. In 2010 nearly 820 million people around the world still had no
access to decent water supplies.


                                                                                               35
INTERNATIONAL RED CROSS &
                                GOVERNMENTS                                       RED CRESCENT MOVEMENT                                                        NGOs


                                                                     International Committee
                                                                             of the Red Cross


                                                                                                          International Federation of
                                                                                                          Red Cross and Red Crescent
                                          International                                                   Societies                            International
                  INFORMATION


                                                                             National societies


                                                                                                                                                                        FINANCE
                                       National                                                           Local branches                                National


                                                                         Local                                               Local
PRIVATE DONORS


                                  Philanthropic
                                  organisations                 Individuals                                                   Peacekeeping              International


                                                                                                                                                                                  MILITARY
                                             Corporate donors                                                                                National


                                                                                                             WFP                UNHCR
                                                                                         Family
                                                   Local community


                                                                                                                           UNICEF            UNRWA


                                                                  Faith-based and
                                     Diaspora                     civil society organisations
                                                                                                                                        WHO               FAO
COMMUNITY


                                                                                                                                                                                  UN


                                                                                                                                                   OCHA


                                                                                           COORDINATION


                 HUMANITARIAN AID NETWORK
                 This map is illustrative and intends to show the main groups of people involved in humanitarian crises.
                 It is not comprehensive, nor does it intend to suggest linear connections or funding relationships.


36
1.3 How does tHe FundinG Get tHeRe?

FiGuRe 32: How miGHt donoRs CHAnnel FundinG to CRises?


                                                                   donoRs miGHt ...


  ... directly fund the           ... respond to funding        ... choose to directly          ... provide                      ... contribute to pooled
  actors who will                 appeals issued by             fund multilateral               unearmarked funding              humanitarian funds,
  deliver humanitarian            organisations who             organisations, including        directly to multilateral         which are managed
  programmes                      deliver aid                   UN agencies, which              organisations,                   by multilateral
  and aid, often NGOs             to beneficiaries, or          will in many cases pass         which may allocate and           agencies, but which
  and the International           umbrella groups               a proportion of funds           spend them at their              channel funds onwards
  Red Cross and Red               and structures                on to international             discretion, including            to other
  Crescent Movement,              representing these            and national NGOs to            on humanitarian                  multilateral agencies,
  through bilateral               delivery agencies such        deliver humanitarian            programmes ...                   local and international
  funding agreements ...          as the UK Disasters           goods and services                                               NGOs to implement
                                  Emergency Committee           directly to affected                                             activities.
                                  or UN humanitarian            communities, in
                                  appeals...                    another tier of financial
                                                                contracting ...


Source: Development Initiatives


Route And RAtionAle
In 2009, US$12.1 billion of the international        channel their funds to crises, including:
humanitarian financing response could                multilateral agencies (e.g. UN agencies/
be traced through the humanitarian                   programmes/funds, the World Bank),
aid system to first-level recipient                  non-governmental organisations (NGOs)
delivery agencies. OECD DAC member                   and civil society groups, the International
governments provided 93.4% of the total,             Red Cross and Red Crescent Movement,
other governments 4.6% and private                   the public sector (which includes the
donors 1.6%.                                         government agencies of both recipient
                                                     and private sector organisations).
Humanitarian aid donors face a range
of possible options in considering how to


FiGuRe 33: FiRst-level ReCipients oF inteRnAtionAl HumAnitARiAn Response, 2006–2009


100%                                                                                                         Other
 90%                                                                                                         Multilateral organisations
 80%                                                                                                         Red Cross/Crescent
                                                                                                             NGOs and civil society
 70%
                                                                                                             Public sector
 60%
 50%
 40%
 30%
 20%
 10%
  0%
               2006                     2007                    2008                     2009


Note: ‘Other’ includes private sector organisations and data that has not been attributed to any category. Source: Development
Initiatives based on OECD DAC Creditor Reporting System (CRS) for governments that report to the OECD DAC and UN OCHA
Financial Tracking Service (FTS) data for all other governments and private funding sources

                                                                                                                                                            37
The choices that donors make about how                            funds through humanitarian pooled funds
to channel their funds reflect not only                           managed by multilateral agencies. Sudan
policy and administrative considerations at                       and DRC, for example, have large common
the global level; they are also a product of                      humanitarian funds (CHFs), which in 2009
relationships between donors and different                        received US$133 million and US$99 million
delivery channels in each particular crisis.                      respectively.
Channelling funds through multilateral
                                                                  Ethiopia and Somalia in particular each
agencies and NGOs rather than through
                                                                  received a relatively high proportion of
the public sector, for example, may indicate
                                                                  total official humanitarian aid – over 30%
that donors have greater confidence in the
                                                                  – via NGOs and civil society.
capacity and/or neutrality of these actors to
deliver humanitarian assistance.                                  In contrast with the other top ten
                                                                  recipients, which received less than 14%
Sudan, Palestine/OPT, Iraq, Democratic
                                                                  of their humanitarian aid via the public
Republic of Congo (DRC), Somalia and
                                                                  sector, 28.5% of total official humanitarian
Lebanon all received more than 60%
                                                                  aid to Afghanistan was channelled through
of their total official humanitarian aid
                                                                  the public sector in 2009. This category,
through multilateral organisations in
                                                                  however, includes the public sectors of
2009. In Palestine/OPT, 84.6% of total
                                                                  both the donor and the recipient country
official humanitarian aid in that year
                                                                  and therefore includes humanitarian aid
was channelled through multilateral
                                                                  delivered directly by donor governments.
agencies, reflecting the dominant role
                                                                  In 2009, 20.8% of the humanitarian aid
of the UN Relief and Works Agency for
                                                                  attributed to public sector delivery in
Palestinian refugees (UNRWA) in delivering
                                                                  Afghanistan was delivered by the United
humanitarian aid in that crisis. In several
                                                                  States Department of Defense (DOD) and
other crises, the high proportion of funds
                                                                  the Spanish government’s civil-military
channelled through multilateral agencies
                                                                  Provincial Reconstruction Team (PRT).
was in part a product of donors channelling


FiGuRe 34: CHAnnels oF deliveRy FoR tHe top 10 ReCipients oF totAl oFFiCiAl HumAnitARiAn Aid, 2009


100%                                                                                                                      Other
 90%                                                                                                                      Multilateral organisations
 80%                                                                                                                      NGOs and civil society
 70%                                                                                                                      Public sector

 60%
 50%
 40%
 30%
 20%
 10%
     0%
          Sudan


                  Palestine/OPT


                                  Ethiopia


                                             Afghanistan


                                                           Iraq


                                                                      DRC


                                                                               Pakistan


                                                                                          Indonesia


                                                                                                      Somalia


                                                                                                                Lebanon


Source: Development Initiatives based on OECD DAC CRS

38
multilAteRAl oRGAnisAtions

Multilateral organisations regularly receive     The prominence of a number of
the largest share of the international           multilateral agencies as leading channels
humanitarian response funding. Between           of delivery of humanitarian aid can
2008 and 2009, their share increased from        be explained in part by the volumes
57.1% to 61.7%. (Interpreting trends for         of humanitarian funds that are donor
earlier years is problematic as significant      contributions to pooled funds routed
volumes of funds were not accurately             via these agencies. The United Nations
attributed but were reported as ‘other’).        Development Programme (UNDP)
                                                 administers CHFs, the UN Office for
The World Food Programme (WFP), the
                                                 the Coordination of Humanitarian
Office of the UN High Commissioner
                                                 Affairs (OCHA) manages emergency
for Refugees (UNHCR) and UNRWA
                                                 response funds (ERFs) and the Central
are frequently the leading multilateral
                                                 Emergency Response Fund (CERF), and
recipients, receiving multilateral (totally
                                                 the World Bank manages a number of
unearmarked) official development
                                                 reconstruction-focused multi-donor trust
assistance (ODA) for humanitarian activities
                                                 funds (MDTFs).
as well as humanitarian aid through
bilateral agreements with donors.                In 2006, for example, of the US$198 million
                                                 of humanitarian funds channelled through
The volumes of government humanitarian
                                                 the World Bank, US$84 million was
aid channelled through WFP increased
                                                 routed via the Indonesia MDTF and
dramatically between 2007 and 2008
                                                 US$21 million through the South Sudan
(from US$1.6 billion to US$3.3 billion) in
                                                 MDTF for reconstruction relief projects.
response to widespread food insecurity
and the global food price crisis. Significant    A proportion of donor contributions
amounts of emergency food aid were               channelled via pooled funds is allocated to
received in Sudan, Ethiopia, Somalia             multilateral agencies, but some of it is not.
and Afghanistan that year.                       UN agencies receive all funds channelled
                                                 through the UN CERF (though they may
A proportion of the funds channelled
                                                 sub-contract a proportion of this on again
through several multilateral agencies,
                                                 to NGOs), but they receive only a proportion
however, are donor contributions to
                                                 – 54.8% (US$141 million) in 2009 and 54.1%
humanitarian and, in some instances,
                                                 (US$188 million) in 2010 – of the funds
reconstruction pooled funds. Donor
                                                 channelled through the CHFs and ERFs. The
contributions to pooled humanitarian
                                                 balance of humanitarian funds channelled
funds were equivalent to 9.6% of the total
                                                 through humanitarian pooled funds is
international humanitarian response funds
                                                 received by local and international NGOs.
channelled via multilateral agencies in 2009.


FiGuRe 35: top Five multilAteRAl oRGAnisAtion ReCipients oF HumAnitARiAn Aid
FRom GoveRnments, 2006–2009 (us$ Billion)


         2006                                     2007                                   2008                            2009

 WFP                   1.5                WFP            1.7                    WFP              3.3             WFP            3.1

 UNHCR                 0.9                UNHCR          1.0                    UNHCR            1.3             UNHCR          1.5

 UNDP                  0.5                UNRWA          0.4                    UNRWA            0.5             UNRWA          0.7

 UNRWA                 0.3                UNDP           0.3                    UNDP             0.4             UNDP           0.4

 World Bank group      0.2                UN OCHA        0.3                    UNICEF           0.3             UN OCHA        0.4


Source: Development Initiatives based on OECD DAC CRS for OECD DAC donors and OCHA FTS for non-OECD DAC donors

                                                                                                                                      39
non-GoveRnmentAl oRGAnisAtions

NGOs were the second largest first-level         The share received by local NGOs
recipient grouping and received 17.3%            remained static at around 5% of the total
(US$2.1 billion) of the international            volume channelled through country-level
humanitarian response in 2009, an                humanitarian pooled funds in 2009 and
increase from their 2008 share of 15.2%          2010, though the volume they received
(US$1.9 billion). Humanitarian funding           increased from US$14 million in 2009
provided by governments to NGOs                  to US$18 million in 2010.
demonstrates a strong preference for
                                                 NGOs cannot receive funds directly
funding international NGO (INGOs). In
                                                 from the CERF, and less than half of the
2009, INGOs received 67.5% of first-level
                                                 funding channelled through CHFs and
recipient funding channelled via NGOs
                                                 ERFs is received by NGOs. International
compared with just 1.9% received by local
                                                 NGOs received US$65 million through
NGOs (the balance was not attributed to
                                                 CHFs in 2009 and US$85 million in 2010,
any category).
                                                 a 3% increase in their share of the total.
In addition to funds received directly from      International NGOs received US$36 million
donors, the second-level funds that NGOs         through ERFs in 2009 and US$49 million
receive through UN agencies and pooled           in 2010; however, this represented a 10.7%
humanitarian funds also need to be taken         decrease in their share of the total.
into consideration. While we have little
                                                 Local NGOs received US$9 million via CHFs
information on the funds contracted to
                                                 in 2010 compared with US$4 million in
NGOs from UN agencies, we do have data
                                                 2009, which represented a doubling of their
on the funds that NGOs receive via pooled
                                                 share of the total, from 1.8% to 3.8%. The
humanitarian funds.
                                                 type of funding mechanism that channelled
International NGOs received US$134               the most directly through local NGOs was
million in funding via CHFs and ERFs in          the ERF. However, volumes declined from
2010, an increase from US$101 million            US$11 million in 2009 to US$9 million in
in 2009. The share of the total received         2010, an 8.4% reduction in local NGOs’
by INGOS fell slightly, however, from 39%        share of total ERF funds.
of the total in 2009 to 38.7% in 2010.


FiGuRe 36: CompARison oF CHF And eRF FundinG CHAnnelled to un AGenCies,
loCAl And inteRnAtionAl nGos, 2009 And 2010


100%                                                                                           Other
 90%                                                                                           Local NGOs
 80%                                                                                           International NGOs
                                                                                               UN
 70%
 60%
 50%
 40%
 30%
 20%
 10%
     0%
              2009                  2010                     2009                2010
                           ERF                                           CHF


Source: Development Initiatives based on UN OCHA FTS and OCHA Ethiopia


40
inteRnAtionAl Red CRoss And Red CResCent movement

The third largest first-level recipient of          directly from governments and private
international humanitarian financing                sources, it does not typically receive funds
response in 2009 was the Red Cross and              channelled via multilateral agencies or
Red Crescent Movement, which received               pooled humanitarian funds. Some Red
US$1.1 billion, 8.7% of the total. This             Cross and Red Crescent societies have
represented an increase in both its volume          developed distinct mechanisms for income
and share of the total, up from US$1billion         generation independent of the international
(7.8%) in 2008.                                     humanitarian system.
While the International Red Cross and
Red Crescent Movement receives funds


  tHe inteRnAtionAl Red CRoss And Red CResCent movement

  The International Red Cross and Red                186 national societies remain a largely            Private contributions account for the
  Crescent Movement, which is made up                unknown humanitarian player. The                   largest share of the study-set societies’
  of the International Federation of the Red         immense variety of their mandates,                 income, providing at least 41.3% of
  Cross and Red Crescent Societies (IFRC),           activities and structures, together with           the total in 2009 and 2010. But what
  the International Committee of the Red             the large number of existing national              is particularly striking is that income
  Cross (ICRC) and 186 national societies,           societies, poses a considerable challenge          generation activities provide almost
  is the world’s largest emergency                   to any comprehensive and comparable                a quarter of their income, and exceed
  response network.                                  analysis of their humanitarian financing.          contributions from government donor
                                                                                                        sources. The contrast with ICRC funding,
  The ICRC alone raises over US$1 billion            Between April and May 2011, the
                                                                                                        90.7% (average 2006–9) of which comes
  every year from a variety of funding               Global Humanitarian Assistance (GHA)
                                                                                                        from governments, illustrates the very
  sources, including government donors,              programme conducted an exercise
                                                                                                        diverse nature of the Red Cross and Red
  private funding and national societies.            to collect data on the income and
                                                                                                        Crescent Movement.
  However, while the humanitarian                    expenditure of 12 national societies
  activities and financing of the ICRC and           and received information from six
  IFRC have been widely studied, the                 – the Belgian, British, Canadian,
                                                     Danish, French and Swedish.


  FiGuRe 37: souRCes oF HumAnitARiAn FinAnCinG inCome FoR six Red CRoss nAtionAl soCieties, 2009–2010

                                                          16.4%
                                                       US$162m

                                                                                 18.0%
                                                                              US$177m
                                          24.3%                                                              Governments
                                          US$239m 16.4%                                                      Private individuals
                                                US$162m
                                                                                                             Income generating activities
                                                                            18.0%                            Other
                                                                         US$177m
                                     24.3%                                                             Governments
                                     US$239m                                                           Private individuals
                                                                                                       Income generating activities
                                                         41.3%                                         Other
                                                         US$407m


                                                   41.3%
                                                   US$407m


  Source: Development Initiatives based on data provided by the Belgian, British, Canadian, Danish, French
  and Swedish Red Cross Societies


                                                                                                                                                    41
donoR FundinG CHoiCes Beyond tHe oeCd dAC

The funding choices made by OECD DAC             DAC governments – and a relatively low
members, which provide the majority of           proportion via NGOs: just 1.5% in 2009.
international humanitarian aid financing,
                                                 While they have traditionally favoured
dominate overall trends. But the practices
                                                 bilateral channels of delivery, their
and preferences of government donors
                                                 contributions to multilateral institutions
outside of the OECD DAC group (‘other
                                                 and funds have also been growing.
government donors’ or non-OECD DAC
                                                 Contributions to humanitarian pooled
governments’) and private donors diverge
                                                 funds – which are useful mechanisms
from the DAC member governments
                                                 where donors might not have experience
and are worth considering separately.
                                                 or in-country capacity themselves to direct
Moreover, non-OECD DAC governments
                                                 funds bilaterally – have increased. Indeed,
and private donors have a growing stake in
                                                 in 2010, their contributions to humanitarian
humanitarian aid financing as the volumes
                                                 pooled funds grew from 0.5% in 2009 to
they collectively contribute continue to grow.
                                                 11.4% of total donor contributions in 2010.
Non-OECD DAC governments are more                They reported contributions of US$91
likely to channel their funds through the        million to ERFs in 2010 to the FTS, in sharp
public sector (which includes both the           contrast with the only other contributions
government of the recipient country and          reported by other governments of less than
the donor government). In 2009 non-OECD          US$0.5 million in 2007 and 2008. Their
DAC government donors channelled 21.6%           contributions to the CERF, meanwhile,
of their funds through the public sector,        increased from US$3.7 million in 2009
in contrast to only 8.6% of OECD DAC             to US$7.3 million in 2010, including
government funds.                                contributions from ten new government
                                                 donors: Russia, Ukraine, Central African
They also channel a higher proportion
                                                 Republic (CAR), Singapore, Madagascar,
of their funding via the International
                                                 Costa Rica, Panama, Georgia, Tajikistan
Red Cross and Red Crescent Movement
                                                 and St Lucia.
– 24% compared with 8.1% for OECD


FiGuRe 38: pRopoRtion oF HumAnitARiAn FundinG FRom non-oeCd dAC donoR GoveRnments
CHAnnelled to FiRst-level ReCipients, 2006–2009


100%                                                                                            Other
90%                                                                                             Multilateral organisations
80%                                                                                             Red Cross/Crescent
                                                                                                NGOs and civil society
70%
                                                                                                Public sector
60%
50%
40%
30%
20%
10%
  0%
            2006               2007              2008            2009              2010


Source: UN OCHA FTS

42
FiGuRe 39: HumAnitARiAn FinAnCinG FRom pRivAte souRCes, 2000–2010


              5                                                                                    Other
                                                                                                   Multilateral organisations
                                                                                                   Red Cross/Crescent
                                                     4.2                                           NGOs and civil society
                                                                                                   Public sector
              4
                                                                                                   Total


              3
US$ BILLION


              2
                                                                                            1.6


              1


                                                                            0.2     0.2
                                       0.1    0.1           0.1     0.1
                  0.0    0.0    0.1
              0
                  2000   2001   2002   2003   2004   2005   2006   2007    2008    2009     2010


Source: Development Initiatives based on UN OCHA FTS


In most of the years when there was no               particular is proving increasingly popular
large-scale natural disaster, private donors         as a recipient of financing from private
appear to have favoured multilateral                 sources. The number of private donors to
agencies as first-level recipients of funding.       the CERF increased from just two in 2006
With the exception of three years (2004,             to 20 in 2010, not including private donors
2005 and 2010), multilateral agencies                via the UN Foundation, while the volume of
have received between 40% and 95% of                 private contributions increased from less
private funds. In 2004, an emergency                 than US$1 million each year between 2006
funding appeal issued for Darfur and Chad            and 2009 to US$4.4 million in 2010. The
by the UK-based Disasters Emergency                  number of private donors contributing to
Committee (DEC) raised US$58 million in              the CERF increased from just nine in 2009
contributions, 98.6% of the total private            to 20 in 2010, with average contributions
funds channelled through NGOs in that                increasing from around US$50,000 in 2009
year. In 2005 and 2010, when major                   to US$200,000 in 2010.
natural disasters occurred, NGOs were the
                                                     Private contributions of US$0.5 million to
preferred channel of delivery, receiving
                                                     ERFs were reported in 2006 and 2008 and
68% (US$2.8 billion) of private funds in
                                                     of US$0.4 million in 2010. However, private
2005 and 34.3% (US$558 million) in 2010.
                                                     donors remain an unpredictable source
Private donors are also increasingly                 of funding: not one private contributor
channelling funding through pooled                   has given money to the CERF consistently
humanitarian funds, and the CERF in                  between 2006 and 2010.


                                                                                                                                43
FinAnCinG meCHAnisms

     • The UN’s Central Emergency Response Fund (CERF) allows donor governments
       and the private sector to pool their financing on a global level to enable more timely
       and reliable humanitarian assistance to people affected by natural disasters and
       armed conflicts.
     • Common humanitarian funds (CHFs) are in-country pooled mechanisms. Funding
       received is totally unearmarked. This allows money to be allocated on the basis
       of needs (as defined in the emergency’s humanitarian action plan).
     • Emergency response funds (ERFs) are also country-level mechanisms. They
       differ from CHFs in that they have the facility to provide finance to small-scale
       projects, allowing more national NGOs to access resources directly rather than
       via UN agencies.


The total volume of funds channelled              Contributions to the UN CERF fund rose
through pooled humanitarian funds,                by 9.4% in 2010, after a substantial
including country-level CHFs and ERFs and         reduction in contributions in 2009.
the global CERF, grew from US$583 million         Contributions to the CERF were received
in 2006 to US$853 million in 2010, which          from a record 103 donors in 2010.
represented 8.4% of total international
                                                  donoRs
humanitarian aid to recipient countries that
year. The share of total humanitarian aid         OECD DAC member governments
to recipient countries channelled through         provide the majority of funding to pooled
pooled humanitarian funds has not altered         humanitarian funds and the volumes they
significantly, however, since the inception       provide have remained relatively stable
of the first funds in 2006, remaining within      – between US$708 million and US$747
a range between 7.1% and 9.3% of the total        million each year since 2007. Their share
funds channelled to recipient countries           of the total funding decreased, however,
across the five-year period.                      from 99.4% in 2009 to 87.4% in 2010, as
                                                  an increasing number and range of other
The sharp increase in funding to ERFs
                                                  government and private donors contributed
in 2010 reflects the dramatic growth in
                                                  to ERFs and the CERF.
contributions to the Haiti and Pakistan
ERFs, which together received the                 The share of contributions from other
equivalent of 71.7% of the total funds            government donors grew from 0.5%
contributed to ERFs in that year. The             (US$4 million) in 2009 to 11.4% (US$98
growth in funds to CHFs is attributable to        million) in 2010, largely in contributions
the creation of a new country-level fund          to the Haiti and Pakistan ERFs. The share
for Somalia in March 2010.                        of private donors to humanitarian pooled

FiGuRe 40: totAl FundinG to pooled Funds, 2006–2010


                                                                                           429
2010                                                     261
                                       164
                                                                                 392
2009                                                  243
                         85

                                                                                                 453
2008                                                            295
                               120

                                                                                385
2007                                                           284
                  43

                                                                 299                                   CERF
2006                                                     263                                           CHFs
             21                                                                                        ERFs
                                              US$ MILLION


Source: Development Initiatives based on UN OCHA FTS and UN CERF

44
FiGuRe 41: ContRiButions to pooled HumAnitARiAn Funds By donoR type, 2006–2010 (us$ million)


                                                                                747                                                                                                       98
 2010                                                                                                                                                                                              4.8
                                                                                                                                                                                                         5.0
                                                                                                                                                                                                  712
2009                                                                                                                                                                                                     3.9

                                                                                                                                                                       744 3.8
2008                                                                                                                                                                           1.4                      15.0
                                                                                                                                                                                                  708
2007                                                                                                                                                                                                     5.0

                                                                                                                                                                                        577
2006                                                                                                                                                                                                    5.0

               0%                                                                                                                                                                                   100%
                                                                               OECD DAC donors                                                Private organisations and individuals
                                                                               Non-OECD DAC donors                                            Other


 Source: Development Initiatives based on UN OCHA FTS and UN CERF


 funds, while overall relatively small,                                      increased their contributions by more
 also experienced an increase, from                                          than US$10 million: Norway provided
 0.1% (US$0.5 million) in 2009 to 0.6%                                       an additional US$29 million and Spain an
 (US$5 million) in 2010, principally in                                      additional US$13 million to humanitarian
 contributions to the CERF.                                                  pooled funds in 2010. The United States is
                                                                             an irregular contributor to humanitarian
 Among the individual donors contributing
                                                                             pooled funds. It made no contributions
 to pooled humanitarian funds, the United
                                                                             in 2009 but gave US$10 million in 2010.
 Kingdom remained the leading donor in
 both 2009 and 2010. Three of the leading                                    Two other government donors made
 donors reduced their contributions to                                       significant contributions to humanitarian
 humanitarian pooled funds in 2010: the                                      pooled funds in 2010, and entered the ranks
 Netherlands by US$29 million, Ireland                                       of the top 15 donors. Saudi Arabia gave
 by US$20 million and Sweden by US$1                                         US$50 million to the Haiti ERF and India
 million. Two of the donors that were top                                    gave US$20 million to the Pakistan ERF
 ten contributors in both 2009 and 2010                                      and US$0.5 million to the CERF.


 FiGuRe 42: sHARes oF HumAnitARiAn Aid spent tHRouGH pooled HumAnitARiAn Funds
 By tHe leAdinG donoRs in 2010


              200                                                                                                                                                                                        60%
              180
                                                                                                                                                                                                         50%
              160
              140
                                                                                                                                                                                                         40%
              120
US$ MILLION


              100                                                                                                                                                                                        30%
               80
                                                                                                                                                                                                         20%
               60
               40
                                                                                                                                                                                                         10%
               20
                0                                                                                                                                                                                        0%
                                                                                                                                                             Belgium
                                                                     Spain


                                                                                Saudi Arabia


                                                                                               Canada


                                                                                                        Denmark


                                                                                                                            Germany
                                                                                                                  Ireland


                                                                                                                                      India


                                                                                                                                                 Australia


                                                                                                                                                                        Finland


                                                                                                                                                                                  United States
                                              Norway


                                                       Netherlands
                    United Kingdom


                                     Sweden


                                                                                                                                              Total channelled through
                                                                                                                                              financing mechanisms
                                                                                                                                              % of humanitarian aid

 Source: Development Initiatives based on UN OCHA FTS, UN CERF and preliminary and partial OECD DAC data

                                                                                                                                                                                                           45
FiGuRe 43: pooled Funds As A sHARe oF tHe totAl inteRnAtionAl HumAnitARiAn Response
to tHe top 10 ReCipient CountRies


          1600                                                                                                                                60%      Other international humanitarian aid
                                                                                                                                                       Humanitarian aid channelled
          1400
                                                                                                                                              50%      through pooled funds
          1200                                                                                                                                         Pooled funds as % of total international
                                                                                                                                                       humanitarian response
US$ MILLION


                                                                                                                                              40%
          1000

              800                                                                                                                             30%

              600
                                                                                                                                              20%
              400
                                                                                                                                              10%
              200

               0                                                                                                                              0%
                    Sudan


                                   DRC


                                             Somalia


                                                        Ethiopia


                                                                   Zimbabwe


                                                                                Kenya


                                                                                         Sri Lanka


                                                                                                             DPRK


                                                                                                                      Philippines


                                                                                                                                      Niger
Source: Development Initiatives based on OECD DAC, UN OCHA FTS and UN CERF


ReCipients                                                                    emergencies, meaning that the profile of
                                                                              funding recipients shifts year by year to
The largest volumes of funding disbursed
                                                                              include new or rapidly deteriorating crises.
via pooled humanitarian funds were
concentrated in several of the world’s                                        Finally, the CERF policy of targeting part
worst protracted humanitarian crises,                                         of its funds to ‘under-funded emergencies’
which have country-level pooled funds as                                      means that some recipients that do not
well as being recipients of CERF funding                                      feature prominently among the leading
– Sudan, DRC and Somalia.                                                     recipients of bilateral donor funding may
                                                                              appear as significant pooled funding
However, the CERF also has the flexibility to
                                                                              recipients. The Democratic People’s
quickly channel funds to rapid-onset acute
                                                                              Republic of Korea (DPRK), for example,


FiGuRe 44: top 10 ReCipients oF CeRF FundinG, 2006–2010 (us$ million)


                            2006                                     2007                                           2008                                  2009                    2010
      DRC                                38.0          DRC                        52.5               DRC                            41.1       Somalia           60.5    Pakistan         39.8
      Afghanistan                        32.3          Bangladesh                 26.7               Ethiopia                       31.5       DRC               30.4    Haiti            36.6
      Kenya                              27.2          Sudan                      25.5               Myanmar                        28.4       Zimbabwe          26.8    Niger            35.0
      Sudan                              25.5          Somalia                    15.7               Kenya                          26.0       Kenya             26.3    DRC              29.1
      Somalia                            16.6          Uganda                     13.0               Pakistan                       18.7       Sudan             25.8    Sudan            22.2
      Sri Lanka                          10.0          Ethiopia                   12.4               Afghanistan                    18.2       Sri Lanka         23.5    Chad             21.6
      Ethiopia                           10.0          Mozambique                 12.2               Haiti                          16.0       DPRK              19.0    Kenya            20.0
      Chad                                9.4          Zimbabwe                   12.0               Sudan                          16.0       Ethiopia          15.6    Ethiopia         16.7
      Eritrea                             5.9          DPRK                       11.1               Nepal                          12.6       Philippines       11.9    Sri Lanka        15.7
      Côte d’Ivoire                       5.8          Sri Lanka                  10.9               Sri Lanka                      12.5       Niger             11.7    Yemen            14.5
      % of total                         70%                                      55%                                               52%                          63%                      61%
      total top 10                       180.6                                   192.0                                              221.2                        251.7                    251.3
      total                              259.3                                   350.9                                              428.8                        397.4                    415.2
      recipients


Source: Development Initiatives based on UN CERF

46
FiGuRe 45: ReCipients oF FundinG tHRouGH eRFs, 2006–2010


              170 162.6
              160                                                                                                                                                               2010
              150                                                                                                                                                               2009
              140                                                                                                                                                               2008
              130                                                                                                                                                               2007
              120                                                                                                                                                               2006
              110
              100
                              87.4
US$ MILLION


               90
               80
               70
               60                     52.8
               50
               40                               36.6
                                                           28.7
               30
                                                                    19.4
               20                                                                   12.0
               10                                                                          9.3         6.3           5.2        3.5                          2.6
                                                                                                                                            3.0       2.6            0.9      0.1
                0
                   Ethiopia


                              Haiti


                                      Somalia


                                                Pakistan


                                                           Iraq


                                                                    Palestine/OPT


                                                                                    CAR


                                                                                           Zimbabwe


                                                                                                      Afghanistan


                                                                                                                    Indonesia


                                                                                                                                Colombia


                                                                                                                                           Myanmar


                                                                                                                                                     Yemen


                                                                                                                                                             Kenya


                                                                                                                                                                     Uganda


                                                                                                                                                                              Nepal
 Source: Development Initiatives based on UN OCHA FTS


  received US$19 million through the CERF                         There were 16 ERFs in 2010, including
  under-funded emergencies funding window                         two new funds in Pakistan and Yemen.
  in 2009, which represented a 34% share                          Contributions to the ERF in Pakistan were
  of the country’s total humanitarian aid                         the largest ever received by an emergency
  that year and made it the eighth largest                        fund in its inception year and were given
  recipient of pooled humanitarian funding.                       in response to the needs arising from the
                                                                  devastating floods of July/August 2010.
  In 2009 Sudan and DRC, which hosted
  the largest country-level funds, were                           The ERF in Haiti received the most
  the leading overall recipient countries                         money overall in 2010 – US$82 million, in
  of pooled funding. Somalia and Ethiopia,                        response to the earthquake in January. This
  both of which had country-level ERFs                            accounted for 7.3% of total appeal funding.
  (which typically channel smaller volumes
                                                                  The distinctions between ERFs and
  of funds and issue smaller-value grants
                                                                  CHFs are not always clear-cut. ERFs
  to partners), were the third and fourth
                                                                  more typically receive relatively small
  largest recipients. However, each of these
                                                                  volumes of funds and award small grants
  four countries, in addition to having large
                                                                  to meet unforeseen emergency needs
  country-level pooled funds, was also a top
                                                                  and funding gaps. CHFs are mechanisms
  ten recipient of CERF funding.
                                                                  to allow humanitarian coordinators to
  The CERF remains a significant source                           fund strategically within country-level
  of humanitarian financing for protracted                        humanitarian workplans, and handle
  crises. DRC, Sudan, Sri Lanka and Ethiopia                      overall larger volumes of funds and award
  appeared in the top ten recipients of CERF                      larger grants than ERFs. The largest
  funding each year between 2006 and 2010                         recipient of ERF funding between 2006
  and together received 25.1% of total CERF                       and 2010 was Ethiopia, by a wide margin.
  funding over the five-year period. DRC was                      Ethiopia, however, has not participated in
  the top recipient in 2006, 2007 and 2008.                       the UN consolidated appeals process (CAP),
  In 2009 the top recipient was Somalia,                          has not therefore regularly generated
  which received US$60.5 million, the largest                     a multi-sector humanitarian workplan
  amount ever disbursed to a single country.                      (although in 2010 a joint government and
                                                                  partners’ humanitarian requirements plan
  In 2010, the leading recipients of CERF
                                                                  was produced) and does not have a related
  funds corresponded with natural disasters
                                                                  CHF. The Ethiopia ERF has some, but not
  in Pakistan and Haiti and the severe food
                                                                  all, of the characteristics of a CHF. The ERF
  crisis in Niger.
                                                                  in Somalia, meanwhile, graduated to a full
                                                                  CHF in 2010.


                                                                                                                                                                                      47
FiGuRe 46: ReCipients oF FundinG tHRouGH CHFs, 2006–2010


                                                                                                  2006
                                                                                                  2007
Somalia
                                                                                                  2008
                                                                                                  2009
                                                                                                  2010
      CAR


     DRC


     Sudan


            0     20        40       60        80       100      120      140      160      180
                                             US$ MILLION


Source: Development Initiatives based on UN OCHA FTS


Funding channelled to recipient countries        to the country cannot yet be determined
via CHFs increased overall in 2010, but          but contributions to the CHF, of US$21
this was due to the conversion of the            million in 2010, were greater than the
Somalia ERF to a CHF in mid-2010. Overall,       contributions channelled via the earlier
funding for the remaining CHFs showed            ERF, which recorded peak contributions
a downward trend in 2010.                        of US$13.4 million in 2009.
The Sudan CHF is the largest such fund,          There are, moreover, some indications
receiving a total of US$742 million in donor     that the creation of the Somalia CHF has
contributions between 2006 and 2010.             significantly influenced the funding choices
Funding to the Sudan CHF increased in            of some donors. Ireland, Italy and Finland
2010 by 8.9% to US$133 million, but this         contributed to pooled funds in Somalia
followed a four-year downward trend and          for the first time in 2010 (they did not
funding levels in 2010 were US$39 million        contribute to the earlier ERF), and in fact
lower than in the peak year of 2006.             this represented the first time that each of
                                                 these donors had contributed to any CHF.
Funding for the DRC CHF declined
                                                 Finland reported US$2 million contributed
by 10.8% between 2009 and 2010. At
                                                 to UN agencies in 2009 to the FTS, but in
US$99 million, funding was US$44 million
                                                 2010 it did not report any funding to UN
lower than in the peak year of 2008. The
                                                 agencies, instead contributing US$3 million
smallest fund, in CAR, received US$11
                                                 to the CHF. The Netherlands channelled
million in 2009 but experienced a US$2
                                                 money only to the CHF in 2010, whereas
million fall in contributions in 2010,
                                                 in 2009 it supported the ERF, Oxfam Novib
to just US$9 million.
                                                 and four UN agencies.
The Somalia CHF was introduced in June
2010. The influence of the creation of a
CHF on overall humanitarian funding levels


48
militARy

    Governments have a long tradition of                 international development activities’. Only
    using their own militaries as a ‘channel             some of the costs of deploying military
    of delivery’ for their humanitarian aid,             resources for humanitarian activities are
    particularly in response to major                    considered allowable as ODA under the
    natural disasters. In response to the                OECD DAC criteria: these are, broadly, the
    earthquake in Haiti in January 2010,                 additional costs incurred in excess of the
    42 governments deployed military assets              costs of keeping personnel on base. Some
    or troops to support the relief effort. The          governments choose not to report any of
    relative importance of military actors as            the costs of their military humanitarian
    agents for delivering humanitarian aid,              activities as ODA at all. Moreover, even
    however, is not always revealed in existing          when this spending is reported, it is often
    humanitarian aid data, while other parts of          extremely difficult to detect within the
    the contributions channelled via military            data, as its military character may not be
    actors are delivered outside of the financial        explicitly referred to in descriptions of the
    tracking mechanisms of the international             activity reported to the OECD DAC.
    humanitarian aid system.
                                                         By far the largest provider of military
    Charging military involvement in                     humanitarian aid reported as ODA to the
    humanitarian aid to aid budgets is                   OECD DAC is the United States. However,
    somewhat controversial. The UN’s ‘Oslo               humanitarian aid channelled through the
    Guidelines’ on the use of military and civil         US Department of Defense (DOD) includes
    defence assets (MCDA) in disaster relief             not only assistance directly implemented
    state, for example, that, ‘In principle, the         by the US military; the US DOD is also a
    costs involved in using MCDA on disaster             donor in its own right, sub-contracting
    relief missions abroad should be covered             large volumes of funds to third party
    by funds other than those available for              implementing partners.


    FiGuRe 47: HumAnitARiAn Aid CHAnnelled viA donoR deFenCe AGenCies RepoRted to tHe oeCd dAC, 2005–2009


                                     400                                                                 Australia
                                                                                                         Austria
                                                                                                         Belgium
                                           358
                                                                                                         Canada
                                     350
                                                                                                         Denmark
                                                                                                         Finland
                                                                                                         Germany
                                                                                                         Greece
                                     300
                                                                                                         Ireland
                                                                                                         Korea
                                                                                                         Norway
                                                                                                         Portugal
US$ MILLION (CONSTANT 2009 PRICES)


                                     250
                                                                            234                          United States


                                                  200
                                     200


                                                          150
                                     150

                                                                                              122


                                     100


                                     50


                                      0
                                           2005   2006   2007              2008              2009

    Source: Development Initiatives based on OECD DAC CRS data

                                                                                                                         49
FiGuRe 48: HumAnitARiAn ContRiButions FRom militARy ACtoRs RepoRted to un oCHA Fts, 2005–2010


100%                                                                                          700                 United States               Netherlands
                                                                                      607.6                       Suriname                    Germany
90%
                                                                                              600                 Indonesia                   Switzerland
80%                                                                                                               Czech Republic              Italy
                                                                                              500                 United Kingdom              France
70%
                                                                                                                  Spain                       Sweden
60%                                                                                                               Greece                      Ireland


                                                                                                    US$ MILLION
                                                                                              400
                                                                                                                  Belgium                     Denmark
50%
                                                                                                                  Turkey
                                                                                              300
40%                                                                                                               Total funds reported

30%                                                                                           200

20%       183.1
                                                                                              100
10%                                                                    1.2
                            0.8
                                          8.0                 4.8
 0%                                                                                           0
            2005            2006          2007            2008         2009           2010


Source: Development Initiatives based on UN OCHA FTS


Some of the additional financial                         ODA corresponds closely with security
contributions made via military actors are               crises where major donors have military
captured within the UN OCHA FTS, though                  personnel deployed – notably in Afghanistan
the overwhelming majority are reported as                and Iraq.
descriptions of in-kind goods and services.
                                                         Military humanitarian responses to natural
Humanitarian aid channelled via military                 disasters are reflected to a more limited
actors that is reported as ODA to the                    extent in the ODA data. The responses to
OECD DAC appears to be spent in different                the Pakistan earthquake in 2005 and to
situations from aid that is reported to                  Cyclone Nargis in Myanmar in 2008 received
the FTS. The humanitarian aid delivered                  significantly less humanitarian aid via
by military actors that is reported as                   military actors than Afghanistan and Iraq.


FiGuRe 49: ReCipients oF HumAnitARiAn Aid CHAnnelled viA militARy ACtoRs (us$million)


              2005                               2006                          2007                               2008                      2009

 Iraq                73.9          Pakistan             84.6        Afghanistan   48.1            Afghanistan            96.1     Afghanistan      29.3

 Afghanistan         15.1          Afghanistan          24.8        Iraq          42.1            Iraq                   40.3     Iraq             10.9

 Pakistan            9.3           Lebanon              13.3        Lebanon       1.8             Myanmar                12.7     Georgia          9.0

 Guatemala           4.0           Iraq                 6.9         Serbia        1.6             China                  2.1      Kosovo           2.6

 Serbia              1.6           Indonesia            6.5         Pakistan      0.5             Georgia                1.6      Myanmar          2.3


Source: Development Initiatives based on OECD DAC CRS

50
FiGuRe 50: RepoRted ReCipients oF HumAnitARiAn Aid CHAnnelled viA militARy ACtoRs


100%                                                                                     700                 Afghanistan            Lebanon
                                                                              608.1                          Bangladesh             Morocco
90%
                                                                                         600                 Chile                  Myanmar
80%                                                                                                          Georgia                Niger
                                                                                         500                 Guatemala              Pakistan
70%
                                                                                                             Haiti                  Philippines
60%                                                                                                          Indonesia              Portugal


                                                                                               US$ MILLION
                                                                                         400
                                                                                                             Iraq                   South Asia region
50%                                                                                                                                 Sri Lanka
                                                                                                             Jordan
                                                                                         300
40%                                                                                                          Total funds reported

30%       183.1                                                                          200

20%
                                                                 1.2                     100
10%
                         0.8          8.0              4.8
 0%                                                                                      0
          2005          2006         2007          2008          2009         2010


Source: Development Initiatives based on UN OCHA FTS


Humanitarian aid provided via military           US$70 million in response to flooding in
actors that is reported to the UN OCHA           Pakistan and US$11 million in response
FTS corresponds more clearly with major          to the Chile earthquake.
natural disaster events. In 2005, military-
                                                 For those costs that are not reported
channelled humanitarian assistance
                                                 as ODA or included in the FTS, little
amounting to US$57 million was reported in
                                                 information indeed is available and the
response to the Indian Ocean-earthquake/
                                                 relative importance of military actors as
tsunami and US$124 million in response
                                                 a channel of delivery for humanitarian aid
to the South Asia (Kashmir) earthquake.
                                                 remains largely unknown.
In 2010 donors reported US$526 million in
military-supplied humanitarian aid to Haiti,


MEETING THE CHALLENGE
Trends in humanitarian funding underscore        economic infrastructures (Haiti, Pakistan);
some very basic messages about the               where recovery and reconstruction are
ability of people and their governments          required following large-scale conflicts
to absorb shocks. They clearly show that         (Afghanistan and Iraq); and at a time of
humanitarian aid is becoming increasingly        growing civil unrest in the Middle East
stretched to meet a wide range of demands        (Syria, Yemen, Libya). The question is how
– where millions in sub-Saharan Africa are       the aid budgets of donors and announced
still dealing with the legacy of conflict and    policies to focus on certain countries and
large IDP populations (Chad, DRC, Somalia,       certain types of crisis will play out against
Sudan); where natural disasters have the         a backdrop of humanitarian crises that
potential to devastate or paralyse entire        have no clear end.

                                                                                                                                                  51
THE STORY
This photo shows a child collecting water from a UNICEF water point in Agok             CREDIT

– home to over 50,000 internally displaced people (IDPs) for almost a year, following   © Jenn Warren
fighting between the Sudan Armed Forces and the Sudanese People’s Liberation
Army in Abyei, Sudan in May 2008. Globally, the number of IDPs rose by 400,000
to 27.5 million in 2010.


52
FoRCes sHApinG
HumAnitARiAn
AssistAnCe
International humanitarian assistance has grown significantly, from US$6.7 billion in 2000
to US$12.4 billion (partial and preliminary figure) in 2010. The burden of humanitarian
need has also shifted across the decade as causes and patterns of vulnerability change,
new disaster hazards emerge and old ones wane.
Two ‘mega-disasters’ in Haiti and Pakistan cast a long shadow over 2010, rapidly pushing
huge numbers of people into crisis. The latter part of the last decade has also been
underscored by deepening vulnerability in many developing countries associated with the
global financial and food crises. Meanwhile, conflict and climate change-related hazards
have remained a major threat to the lives and livelihoods of many.
However, determining whether increased humanitarian aid financing is meeting these
shifting humanitarian needs is still no simple matter, owing to the prevailing ad hoc
system of measuring, which does not allow comparison of the scale and severity of needs
across crises or for an assessment of the extent to which they have been met.
This chapter considers some of the recent observable trends, drivers and features of the
global demand for humanitarian aid financing, and reflects on the international response
to meeting those financing needs.


                                                                                             53
nAtuRAl disAsteRs, ConFliCt And eConomiC CHAllenGes

  The human impact of natural disasters was                                conflict and volumes of humanitarian
  a major driver of demand for humanitarian                                financing are not always straighforward.             oeCd ClAssiFiCAtion oF oFFiCiAl
  financing in 2010. After a relative lull in                              The number of conflicts in which at least            development AssistAnCe (odA)
  2009, in 2010 natural disasters affected                                 one actor is a state increased after 2003,           ReCipient CountRies By inCome
                                                                                                                                GRoup, 2009–2010
  215.1 million people in developing                                       including notably conflicts between Israel
  countries. In the year’s most prominent                                  and Hezbollah in Southern Lebanon in                 Least developed countries (LDCs)
  humanitarian crises resulting from natural                               2006, between Russia and Georgia in the              are as defined by the United Nations
  disasters, 3.7 million people were affected                              breakaway South Ossetia region of Georgia            based on an assessment of economic
  by the earthquake in Haiti in January,                                   in 2008 and the border dispute between               vulnerability, human resource
  2.7 million by the earthquake in Chile in                                Djibouti and Eritrea, also in 2008. In               weakness (including assessments of
  February and 20.4 million by flooding in                                 addition, there were many new or renewed             nutrition, health, education and adult
  Pakistan starting in July (CRED EM-DAT1).                                domestic challenges to states. Conflicts             literacy) and where GNI per capita,
                                                                           involving non-state actors increased                 based on a three year average, is
  The incidence of natural disasters does
                                                                           markedly in 2008, following a period of              under $750.
  not necessarily correlate with the need for
                                                                           decline after 2003. Notable new or renewed
  international humanitarian aid financing,                                                                                     Low-income countries (LICs)
                                                                           instances of violence occurred in 2008
  however. A large proportion of the world’s                                                                                    are those with a per capita gross
                                                                           between non-state actors in Democratic
  disaster-affected populations each year                                                                                       national income (GNI) of less than
                                                                           Republic of Congo (DRC), Ethiopia, Kenya,
  live in countries that use predominantly                                                                                      US$935 in 2007.
                                                                           Nigeria, Pakistan and Sudan, as well as in
  domestic resources to respond to
                                                                           Mexico, where drug cartels were involved.            Lower middle-income countries
  humanitarian needs. India and China have
                                                                           Since 2004, instances of one-sided violence          (LMICs) are those with a per
  been among the three countries with the
                                                                           (where states or organised armed groups              capita GNI of between US$936
  largest number of disaster-affected people
                                                                           carry out intentional attacks on civilians)          and US$3,705 in 2007.
  each year between 2000 and 2010. In 2010,
                                                                           have declined overall, but there have
  two-thirds of disaster-affected people in                                                                                     Upper middle-income countries
                                                                           been notable new or renewed instances
  developing countries lived in China alone.                                                                                    (UMICs) are those with a per capita
                                                                           of attacks against civilians in Afghanistan,
  Conflict is the other major driver                                       Pakistan, Iraq, Kenya, Somalia                       GNI of between US$3,706 and
  of humanitarian need, though the                                         and Thailand.                                        US$11,455 in 2007.
  relationships between the incidence of


                                                                                                                          1
                                                                                                                              Data downloaded from the Centre for
                                                                                                                              Research on the Epidemiology of Disasters
                                                                                                                              (CRED) International Disaster Database
                                                                                                                              ‘EM-DAT’ on 3rd May 2011


  FiGuRe 1: populAtions in developinG CountRies AFFeCted By nAtuRAl disAsteRs, 2000–2010


                                  700                 657                                                                      Upper middle-income countries
TOTAL AFFECTED PEOPLE (MILLION)


                                                                                                                               Lower middle-income countries
                                  600
                                                                                                                               Low-income countries
                                                                                                                               Least developed countries
                                  500
                                                                                                                               Total
                                  400

                                  300                        253
                                                                                           210     207    196     215
                                  200   172                         156     159
                                               107                                 126
                                  100

                                   0
                                        2000   2001   2002   2003   2004   2005    2006   2007    2008   2009    2010


  Note: Income groups are those determined by the Organisation for Economic Cooperation and Development (OECD) for 2009 and 2010. Natural disasters
  include those classifed by the Centre for Epidemiology of Disasters (CRED) as geophysical, hydrological, meterological and climatalogical. In the peak year,
  2002, 97.9% of the total number of people affected were affected by severe drought, storms and floods in China (285 million) and in India (342 million).
  Source: Development Initiatives based on CRED EM-DAT data, downloaded 3 May 2011

54
FiGuRe 2: tRends in tHe inCidenCe oF ConFliCt, 2000–2008


                                  120                                                                                               One-sided violence
NUMBER OF ARMED CONFLICT EVENTS


                                                                                                                                    Non-state based
                                  100     28                40
                                                                         36    42                                      26           State based
                                                  27                                     31          30
                                   80
                                          39                                                                  26
                                                                                                                       35
                                   60             28        35           36
                                                                               27        27          24
                                                                                                              17
                                   40
                                          37      36                                                 33       35       37
                                                            32           29    32        32
                                   20


                                    0    2000    2001   2002         2003     2004      2005         2006    2007     2008


      Sources: Uppsala Conflict Data Program datasets (UCDP/PRIO Armed Conflict Dataset v.4-2010, 1946–2009;
      UCDP Non-State Conflict Dataset v. 2.3-2010, 1989–2008; One-Sided Violence Dataset v 1.3-2010b, 1989–2008)


      Whether the incidence of conflict described                             Many donors have placed an increased
      here results directly in humanitarian needs                             emphasis in their aid policies on fragile
      cannot be clearly determined. It is clear,                              states (many of which are affected by
      however, that humanitarian financing                                    conflict), which may have influenced
      has become increasingly concentrated in                                 humanitarian funding allocations.
      conflict-affected states, whose share of the                            However, there are also other
      total increased from less than 40% in 2000                              considerations in explaining this
      to 65% in 2009.                                                         concentration of humanitarian aid in
                                                                              conflict-affected states.


      FiGuRe 3: pRopoRtion oF totAl oFFiCiAl HumAnitARiAn Aid ReCeived By ConFliCt-AFFeCted stAtes, 2000–2009


    2009                                                          25.9%                                               39.1%                              35.0%

    2008                                                         24.8%                                                      42.2%                        33.0%

    2007                                                           26.7%                                            35.6%                                37.7%

    2006                                                         24.6%                                                  42.0%                            33.4%

    2005                                                20.9%                                               35.3%                                        43.8%

    2004                                                    22.1%                                28.0%                                                   49.9%

    2003                                                21.6%                                    28.2%                                                   50.1%

    2002                                            17.2%                                    28.7%                                                       54.0%

    2001                                        13.3%                                    30.6%                                                           56.1%

    2000                                        13.7%                                26.4%                                                               59.9%
                                    0%                                                                                                                     100%
                                                                                % of total humanitarian aid to top 3 conflict-affected recipients
                                                                                % of total humanitarian aid to all other conflict-affected recipients
                                                                                % of total humanitarian aid to non conflict-affected recipients


      Note: See Data & Guides section for Development Initiatives’ definition of conflict-affected states.
      Source: Development Initiatives based on OECD DAC data


                                                                                                                                                            55
FRAGILE STATES

     Fragile states are characterised by            (CPIA), which is used to assess the
     widespread extreme poverty, are                quality of country policies. The World
     the most off-track in relation to the          Bank defines a country as a Fragile
     Millennium Development Goals (MDGs),           State if it is a low-income country or
     and are commonly caught in or are              territory, IDA eligible (including those
     emerging from, violence or conflict.           countries which may currently be in
                                                    arrears), with a CPIA score of 3.2 or
     Exact definitions of fragile states vary by
                                                    below.” World Bank, 2011
     donor and institution but often reference
     a lack of government capacity to provide      “The Brookings Index of State Weakness
     basic public goods (including security         in the Developing World... ranks and
     and basic services) and in some cases          assesses 141 developing nations
     a lack of willingness to provide them:         according to their relative performance
                                                    in four critical spheres: economic,
     “Those failing to provide basic services to
                                                    political, security and social welfare.”
      poor people because they are unwilling
                                                    Brookings Institution, 2010
      or unable to do so.” OECD, 2006
                                                   Debates on fragility increasingly
     Other institutions classify degrees of
                                                   recognise the heterogeneity of fragile
     fragility according to assessments of
                                                   states and degrees of fragility, including
     aspects of institutional performance:
                                                   the recognition that conditions of
     “The World Bank’s definition of fragile       fragility do not necessarily map neatly
      states covers low-income countries           onto nation states and may be confined
      scoring 3.2 and below on the Country         to sub-national pockets or may cross
      Policy and Institutional Assessment          national borders.


Our set of ‘conflict-affected’ countries also      trends towards investing in heavily fortified
includes those that are ‘post-conflict’ i.e.       operating bases and in some cases hiring
they have reached a negotiated settlement          private security protection – are also likely
and are hosting multilateral peacekeeping          to have driven up the cost of providing aid
operations. Humanitarian spending                  in such environments. While we know little
often increases in countries where                 about the actual financial cost of these
multilateral peacekeeping operations are           adaptations to increased risk (which are
present, and so this increase in funding to        often hidden within programme budgets),
conflict-affected states may also reflect          they certainly contribute in part to the
increased post-conflict opportunities for          growth in volumes of humanitarian aid in
humanitarian programming afforded by               conflict-affected states.
improved security and political stability.
                                                   Full data on the incidence of conflict in
Increasing incidence of attacks on                 2009 and 2010 is not yet available, but
humanitarian aid workers in a number of            indications from funding data captured
highly insecure operating environments             within the UN consolidated appeals
(notably Afghanistan, Somalia, Darfur,             suggest a slowing in 2010 of the trend
Pakistan and Chad) and associated                  towards the concentration of humanitarian
adaptations – including remote                     funding in ‘complex emergencies’.
management, sub-contracting and the


56
FiGuRe 4: FundinG to Complex emeRGenCies And nAtuRAl disAsteRs RepoRted witHin
 un ConsolidAted AppeAls, 2000–2010


                                                                                             2010: Haiti earthquake and
                                                                                             Pakistan flooding flash appeals
              8
                                                     2005: Indian Ocean                        7.1
                                                                                       6.9
              7                                      Tsunami and South
                                                     Asia (Kashmir)
              6                                      earthquake
                                                     flash appeals            5.1
              5
US$ BILLION


                                       4.0            4.0
              4                                                       3.7
                                                              3.5
                                3.0
              3
                                              2.2
              2          1.4
                  1.1                                                                                       Complex emergency
              1                                                                                             Natural disaster
              0                                                                                             Total
                  2000   2001   2002   2003   2004   2005    2006    2007     2008    2009    2010


 Source: Development Initiatives based on UN OCHA Financial Tracking Service (FTS) data


 The global demand for humanitarian                    The number of undernourished people
 financing is driven not only by disaster              increased from 2006 to a peak of just over
 events, of course: global and local                   one billion in 2009; this was connected to
 economic factors profoundly influence                 rising food prices and the global economic
 both people’s vulnerability to crisis and             crisis. The numbers of undernourished
 the financial cost of meeting humanitarian            people are thought to have declined to
 needs. Fluctuations in food and energy                around 925 million in 2010, as food prices
 prices in particular have had far-reaching            remained below their 2008 peak and many
 effects on levels of humanitarian need and            developing countries experienced resumed
 the ability of the system to respond.                 economic growth (FAO 20102).
                                                       Energy prices, which also rose to a peak
 Food price inflation has been driven
                                                       in 2008, have been driven up sharply again
 by changing dietary habits, growing
                                                       in 2011 as a result of the political crises
 populations, export restrictions and
                                                       in the Middle East. Rises in the price of
 natural disasters in major grain-producing
                                                       oil are likely to drive demand for biofuels,
 countries, including for example drought in
                                                       with knock-on effects on the costs of
 Russia and flooding in Canada in 2010. In
                                                       food production.
 addition to traditional supply and demand
 factors, however, fluctuations in food prices         The costs of key relief commodities
 have been heavily influenced by speculation           – including fats and cereals, key
 in financial markets. Speculative trading             components of humanitarian food aid,
 in commodities – involving increasingly               which more than doubled in price between
 large financial players such as hedge                 2007 and 2008 (FAO annual food price
 funds, pension funds and investment banks             indices) – and the cost of delivering them
 speculating in food markets following                 to affected populations continued to rise in
 market deregulations from 2000 onwards –              2010 and the first quarter of 2011, to near
 drove the spike in food prices in 2008 and is         or above their 2008 peaks.
 contributing to the current peak in 2011.


                                                                                                       2
                                                                                                           Food and Agriculture Organization of the
                                                                                                           United Nations, 2010, The State of Food
                                                                                                           Insecurity in the World: Addressing food
                                                                                                           insecurity in protracted crises, Rome, 2010


                                                                                                                                                         57
FiGuRe 5: CHAnGes in Commodity pRiCes, 1990–2011 (FiRst QuARteR)
INDEX VALUE: 2000 = 100 (CONSTANT 2000 PRICES)


                                                 400
                                                 350
                                                 300
                                                 250
                                                 200
                                                 150
                                                 100
                                                  50
                                                  0
                                                         1990

                                                                  1991

                                                                           1992

                                                                                    1993

                                                                                             1994

                                                                                                      1995

                                                                                                                1996

                                                                                                                          1997

                                                                                                                                    1998

                                                                                                                                              1999

                                                                                                                                                        2000

                                                                                                                                                                  2001

                                                                                                                                                                                2002

                                                                                                                                                                                              2003

                                                                                                                                                                                                            2004

                                                                                                                                                                                                                          2005

                                                                                                                                                                                                                                        2006

                                                                                                                                                                                                                                                      2007

                                                                                                                                                                                                                                                                2008

                                                                                                                                                                                                                                                                          2009

                                                                                                                                                                                                                                                                                    2010

                                                                                                                                                                                                                                                                                           (Q1)2011
                                                                                                                                                                                                                      Food price index
                                                                                                                                                                                                                      Energy price index

   Note: Food and energy prices indices here show variation from the year 2000 when the index value is set at 100 (constant 2000 prices).
   Source: Development Initiatives based on World Bank Global Economic Monitor (GEM)


   Food and energy prices fell sharply from                                                                         While overall aid levels have continued                                                   Greece, Ireland, Italy, Norway, Korea, the
   their peak in the third and fourth quarters                                                                      to grow despite the financial crisis, some                                                Netherlands and Portugal – experienced
   of 2008, in response to the global financial                                                                     government donors have nevertheless                                                       reductions in their bilateral humanitarian
   crisis. Since the 2008/9 nadir, however, food                                                                    reduced their overall aid budgets, and                                                    aid in both 2009 and 2010. The most
   and energy prices have resumed growth.                                                                           many face increased domestic pressures to                                                 significant two-year bilateral humanitarian
                                                                                                                    justify the value and effectiveness of their                                              aid reductions by volume were seen in
   The effects of the global economic crisis
                                                                                                                    aid spending. The outlook for humanitarian                                                the Netherlands, whose aid dropped
   have also placed pressure on the ability of
                                                                                                                    aid is still unclear, but a mixed picture is                                              by US$156.5 million from 2008 levels;
   donors to provide aid. OECD Development
                                                                                                                    emerging from recent data.                                                                Denmark, down US$84.3 million; Ireland,
   Assistance Committee (DAC) member
                                                                                                                                                                                                              down US$72.1 million; and Italy, down
   governments, which provide the majority                                                                          Official humanitarian aid levels rose
                                                                                                                                                                                                              US$71.2 million.
   of development and humanitarian aid,                                                                             sharply, by US$2.4 billion, in 2008, defying
   experienced continued economic growth up                                                                         the financial crisis, before falling slightly,                                            A combination of forces are gathering
   to 2009 when gross national incomes (GNI)                                                                        by US$191.1 million, in 2009. Preliminary                                                 around humanitarian aid financing – donor
   fell, adjusting to the effects of the financial                                                                  data from the OECD DAC on bilateral                                                       budgetary constraints, domestic pressures
   crisis. However, the growth rate of official                                                                     humanitarian aid for 2010 suggests that                                                   to demonstrate aid results, rising demand
   development assistance (ODA), expressed                                                                          humanitarian aid spending by governments                                                  for humanitarian funds and the linked rising
   as a percentage of GNI, has continued to                                                                         rose again in 2010.                                                                       costs of meeting those needs – providing
   increase from 2007, despite the drop in                                                                                                                                                                    an ever more compelling justification for
                                                                                                                    However, despite this overall growth, a
   GNI in 2009.                                                                                                                                                                                               effective coordination and targeting of
                                                                                                                    number of donors – Austria, Denmark,
                                                                                                                                                                                                              international humanitarian funds.


   FiGuRe 6: Gni oF oeCd dAC GoveRnments And GRowtH in odA levels expRessed As A peRCentAGe oF Gni, 1990–2010
                                                                                                                                                                                                                                                                                                 US$ BILLION (CONSTANT 2009 PRICES)


         0.35%                                                                                                                                                                                                                                                                        45000
         0.30%                                                                                                                                                                                                                                                                        40000
                                                                                                                                                                                                                                                                                      35000
         0.25%
                                                                                                                                                                                                                                                                                      30000
         0.20%                                                                                                                                                                                                                                                                        25000
         0.15%                                                                                                                                                                                                                                                                        20000
                                                                                                                                                                                                                                                                                      15000
         0.10%
                                                                                                                                                                                                                                                                                      10000
         0.05%
                                                                                                                                                                                                                                                                                      5000
         0.00%                                                                                                                                                                                                                                                                        0
                                                       1990

                                                                1991

                                                                         1992

                                                                                  1993

                                                                                           1994

                                                                                                    1995

                                                                                                             1996

                                                                                                                       1997

                                                                                                                                 1998

                                                                                                                                           1999

                                                                                                                                                     2000

                                                                                                                                                               2001

                                                                                                                                                                         2002

                                                                                                                                                                                       2003

                                                                                                                                                                                                     2004

                                                                                                                                                                                                                   2005

                                                                                                                                                                                                                                 2006

                                                                                                                                                                                                                                               2007

                                                                                                                                                                                                                                                         2008

                                                                                                                                                                                                                                                                   2009

                                                                                                                                                                                                                                                                             2010


                                                                                                                                                                                                                     GNI
                                                                                                                                                                                                                     ODA as % of GNI

   Source: Development Initiatives based on OECD DAC data

58
HumAnitARiAn needs: FundinG AppeAls

The core humanitarian principles              Humanitarian needs expressed in the UN
which underpin the work of most of the        consolidated appeals more than doubled       tHe un HumAnitARiAn AppeAl
international humanitarian community          between 2007 and 2010, reaching a historic   And tHe ConsolidAted AppeAls
provide unequivocal guidance on the           high of US$11.3 billion. This growth was     pRoCess (CAp)
basis for allocating humanitarian funding:    driven by an increase of US$2.9 billion      Coordinated by the United Nations,
humanitarian aid should be provided in        for consolidated appeals over the period     the consolidated apeals process is
accordance with assessed needs and            and the addition of the largest ever flash   undertaken in a country or region to
capacities and it should be allocated         appeal requirements, which totalled          raise funds for humanitarian action
on a proportionate basis.                     US$3.6 billion in 2010.                      as well as to plan, implement and
In the absence of a comparable evidence       In 2010 consolidated appeals, which          monitor activities. Two different
base of humanitarian needs, major appeals     represent the predictable needs arising      kinds of appeal are generated by
for international humanitarian financing      from complex emergencies, saw a              the CAP: consolidated appeals
are useful barometers to illustrate the       reduction in volume and in their share       and flash appeals.
extent to which donors have collectively      of the total appeal requirements. This       Consolidated appeals include
met the humanitarian needs expressed          followed two years of rapid growth in        projected activities for the following
as humanitarian financing requirements.       requirements driven by rising levels of      year, and often pertain to conflict
                                              need in a number of protracted crises, a     or post-conflict scenarios where
The UN’s consolidated appeal, the
                                              deepening global food crisis and increases   the needs of that year are relatively
largest annual appeal for humanitarian
                                              in the cost of meeting humanitarian food     predictable. These country and
financing, provides a consensus-based
                                              needs. The Sudan appeal, for example,        regional consolidated appeals are
costing and prioritisation of humanitarian
                                              saw a 58.3% increase in requirements         then amalgamated by the UN, with
financing requirements across a range of
                                              between 2007 and 2009; Palestine/OPT         the launch of the humanitarian
humanitarian crises, from a broad base
                                              experienced an 88.7% increase, owing         appeal each November for the
of participating organisations, including
                                              to the response to the Gaza crisis in        following year.
UN agencies and non-governmental
                                              2009; and Somalia experienced a 121.9%
organisations (NGOs). While the UN                                                         Flash appeals are a rapid strategic
                                              increase following drought, flooding and
consolidated appeal is by no means an                                                      and fundraising tool based on
                                              increasing insecurity in 2008.
objective or comprehensive expression                                                      immediately identified needs, and
of global humanitarian needs, it does                                                      may be issued following sudden-
provide a measure of humanitarian funding                                                  onset disasters such as earthquakes
needs against which the collective donor                                                   or cyclones. It is not unusual for
response can be compared.                                                                  there to be both a consolidated
                                                                                           appeal and flash appeal in the
                                                                                           same country in the same year.


  Good HumAnitARiAn donoRsHip
  The Good Humanitarian Donorship (GHD)       GHD members in 2011 include
  initiative is an informal donor forum       (OECD DAC members in bold):
  that aims to promote a set of agreed        Australia, Austria, Belgium, Bulgaria,
  principles and good practices, including:   Brazil, Canada, Cyprus, Czech
                                              Republic, denmark, Estonia, european
  • principle 6: Allocate humanitarian
                                              Commission, Finland, France, Germany,
    funding in proportion to needs and on
                                              Greece, Hungary, ireland, italy, Japan,
    the basis of needs assessments.
                                              Latvia, luxembourg, Lithuania, Malta,
  • principle 14: Contribute responsibly,     the netherlands, new zealand, norway,
    and on the basis of burden-sharing,       Poland, portugal, Republic of korea,
    to United Nations Consolidated            Romania, Slovak Republic, Slovenia,
    Inter-Agency Appeals and to               spain, sweden, switzerland, the united
    International Red Cross and Red           kingdom, the united states of America.
    Crescent Movement appeals, and
    actively support the formulation of
    Common Humanitarian Action Plans
    (CHAPs) as the primary instrument for
    strategic planning, prioritisation and
    coordination in complex emergencies.


                                                                                                                                    59
FiGuRe 7: FundinG ReQuiRements By type oF AppeAl in tHe un ConsolidAted AppeAls pRoCess, 2000–2010


              12                                                                                            Flash appeals
                                                                                            0.3     3.6     Consolidated appeals
              10
                                                                                            9.5                                9.5
US$ BILLION


              8
                                                                                    0.8             7.7                              7.7
              6                                                      0.3     0.4
                                                              2.2                   6.3
              4                               5.2     0.5            4.9     4.8
                                     4.4
                                                              3.8
              2                                       3.0
                             2.6
                   1.9
              0                                                                                                                      2010
                   2000     2001     2002    2003    2004    2005    2006   2007   2008    2009    2010


 Source: UN OCHA FTS


 Flash appeals saw their share grow from                      slowing in the growth of contributions from
 just 2.9% of the total in 2009 to 31.8% of                   OECD DAC donors to just 4.1% in 2010
 the total appeal requirements in 2010,                       and negative growth in other government
 despite a 50% reduction in the number of                     donor contributions and in the category
 flash appeals. The Haiti flash appeal (with                  of ‘other’ donors (which includes pooled
 requirements of US$1.5 billion) and the                      humanitarian funds, contributions from
 Pakistan flash appeal (with requirements                     NGOs and the International Red Cross and
 of US$1.9 billion) dominated requirements,                   Red Crescent Movement).
 with the remaining two flash appeals – for
                                                              The growth in donor contributions
 Guatemala and Kyrgyzstan – making up just
                                                              therefore did not match the 15.4% growth
 1% of the total appeal requirements in 2010.
                                                              in requirements in 2010, resulting in a
 While total donor contributions have                         substantial increase in the proportion of
 increased in volume each year since                          unmet needs to 37% of the total, compared
 2006, the growth in donor contributions                      with an average of 30.2% for the five
 slowed considerably in 2010 to just 2.2%,                    preceding years.
 compared with growth rates of over 35%
 in both 2008 and 2009. This reflects a


 FiGuRe 8: un CAp ReQuiRements, FundinG And unmet needs, 2000–2010


                                                                                                    11.3    Unmet need
                                                                                            9.8             Funding
                                                                                                    4.2     Requirement
                                                                                    7.1     2.8
                                                            6.0
US$ BILLION


                                            5.2                     5.2      5.1    2.0     6.9     7.1
                                   4.4                      2.0
                                            1.3     3.4             1.7      1.4    5.1
                          2.6      1.4      4.0             4.0
                1.9                                 1.2             3.5      3.7
                          1.1      3.0
                0.8                                 2.2
                1.1       1.4
               2000       2001     2002     2003    2004    2005    2006    2007   2008    2009    2010


 Source: UN OCHA FTS

60
2010


FiGuRe 9: un AppeAl needs met And unmet As A peRCentAGe oF Revised ReQuiRements, 2000–2010


                                                       75.8%


                                                                                                                       72.2%


                                                                                                                                       71.7%


                                                                                                                                                       71.2%
                                       67.5%


                                                                                       67.2%


                                                                                                       66.5%
                                                                       64.3%


                                                                                                                                                                       63.0%
   59.2%


                       55.4%
                               44.6%
               40.8%


                                                                                                                                                                               37.0%
                                                                               35.7%


                                                                                                               33.5%
                                               32.5%


                                                                                               32.8%


                                                                                                                                                               28.8%
                                                                                                                               27.8%


                                                                                                                                               28.3%
                                                               24.2%


                                                                                                                                                                                       % needs met
                                                                                                                                                                                       % needs unmet
      2000              2001            2002             2003            2004            2005            2006            2007            2008            2009           2010


Source: UN OCHA FTS


Moreover, the different types of appeal                                                          Donors also fund appeals issued outside of
showed markedly divergent patterns                                                               the UN’s consolidated appeals process, and
in donor response to the funding                                                                 their responses to these other appeals are
requirements issued. Flash appeals saw a                                                         worth considering. The UN typically issues
substantial increase in requirements, from                                                       a handful of humanitarian funding appeals
US$280 million in 2009 to US$3.6 billion in                                                      outside of the CAP each year. The volumes
2010, driven by the large Haiti and Pakistan                                                     requested in these ‘non-CAP’ appeals are
flash appeals. Overall, 70% of funding                                                           highly variable. The amount requested
needs expressed in flash appeals were                                                            in 2010 was, however, relatively high at
met in 2010.                                                                                     US$1.6 billion, with appeals for Burkina
                                                                                                 Faso, Iraq, Nepal, Pakistan (not related to
Consolidated appeals, on the other hand,
                                                                                                 the flood response) and Sri Lanka and the
saw an 18.9% reduction in requirements
                                                                                                 regional response plan for Iraqi refugees.
outstripped by a 32.5% reduction in funding
                                                                                                 Only 43.7% of the funding needs expressed
levels from the preceding year, resulting
                                                                                                 in non-CAP appeals were met in 2010, the
in a widening gap in unmet needs. In 2010,
                                                                                                 lowest level since 2005.
just 59.8% of consolidated appeal funding
needs were met, a significant drop from the
three preceding years, in which more than
70% of funding needs were met.


FiGuRe 10: non-CAp AppeAl ReQuiRements, FundinG And unmet needs, 2001–2010


              2500                                                                                                                                                                     Unmet requirements
                                                       2,117                                                                                                                           Funding for the appeal
              2000
                                                                                                                                                                                       Total revised requirements
                                                                                                                                                                       1,645
US$ MILLION


              1500

              1000                                                                                                                      929
                                                                                                         707
              500                                                                                                        461                            214
                         204            163
                                                                          73              14
                0
                       2001            2002            2003            2004              2005           2006            2007            2008            2009            2010


Source: UN OCHA FTS

                                                                                                                                                                                                                           61
FiGuRe 11: FundinG to iCRC emeRGenCy AppeAls AGAinst ReQuiRements, 2006–2009


               1200
                                                                                          1,036
                                                                    985
               1000                                                                                       Unmet requirements
                         830                                         93                    178
                                           800                                                            Income
                                                                    891
 US$ MILLION


               800                                                                         858
                         200                91                                                            Requirements
               600                         709
                         630
               400

               200

                 0
                        2006               2007                    2008                   2009


   Source: International Committee of the Red Cross annual financial reports


   Following a period of growth in funding             (ICRC) experienced an increase in unmet
   volumes to its emergency appeals, the               needs in 2009 and a reduction in overall
   International Committee of the Red Cross            funding income.


   pRopoRtionAlity in donoR Responses to CRises

   The collective donor response to meeting            the collective response to meeting needs
   needs expressed in the funding appeals              where funding on a proportionate basis
   indicates that, overall, a lower proportion         appears questionable.
   of needs was met in 2010; that within
                                                       2010 saw not only a reduction in the
   the UN consolidated appeals process,
                                                       average proportion of financing needs met,
   flash appeals fared rather better than
                                                       but a reduction in the proportion of funding
   consolidated appeals; and that UN appeals
                                                       received by both the best and worst funded
   outside of the consolidated appeals process
                                                       crises. The overall increased demand for
   on the whole fared rather worse than
                                                       humanitarian financing in 2010 seems to
   those within it (although appeals outside
                                                       have meant that funds were spread more
   of the CAP are by definition considered a
                                                       thinly across crises overall, with some
   lower priority and therefore often have a
                                                       – particularly protracted crises – faring
   lower proportion of their funding needs
                                                       worse than others.
   met). Across particular crises, however,
   there are further discernible variations in


   FiGuRe 12: sHARe oF needs met in tHe Best And woRst Funded un CAp AppeAls, 2000–2010


                                  GREAT LAKES AND CENTRAL AFRICA                       LEBANON CRISIS
                                             121.1%                                       123.2%
                                                                                                                                              HAITI
                                                             96.1%                                                  100.0%                    EARTH
                                                                                                                                              QUAKE
                      89.3%                                                    88.5%                    100.0%                     91.3%
      SUDAN                    94.8%                                                                                                          74.6%
       81.6%
                                             75.8%                                                      72.2%       71.7%          71.2%
                               67.5%                                           67.2%       66.5%
                                                             64.3%                                                                            63.0%
       59.2%          55.4%
                                                                                           36.4%                    35.1%
      CONGO,
                                             21.9%                                                                                 32.2%
      REP.
                                                                               30.4%
       17.2%          21.7%    17.6%                         14.2%                                                                            18.6%
                                                           ZIMBABWE               ZAMBIA FLOODS
                                                                                                        12.4%                          MONGOLIA DZUD
2000                  2001     2002           2003           2004              2005         2006        2007         2008           2009          2010

                                                                                                           Highest level of needs met
                                                                                                           Overall level of needs met (all appeals)
                                                                                                           Lowest level of needs met

   Source: UN OCHA FTS data

  62
FiGuRe 13: numBeR oF disAsteR-AFFeCted people And totAl FundinG to tHe CRisis
    FoR seleCted nAtuRAl disAsteRs

                                                                                                                   No. of people affected (million)
                                                                                                                   Funding to the crisis (US$ million)
                                      7000                                                                                                               40
FUNDING TO THE CRISIS (US$ MILLION)


                                                                                                                           6,254


                                                                                                                                                              NO. OF PEOPLE AFFECTED (MILLION)
                                      6000                                                                                                               35
                                                                                                                                                         30
                                      5000
                                                                                                                                                         25
                                      4000
                                                                                                                                                         20
                                      3000                                                                                                  3,536
                                                                                          2,446
                                                                                                                                                         15
                                      2000
                                                                                                                                                         10
                                      1000                                                                                                               5
                                                           68               48                               130
                                       0                                                                                                                 0
                                                       BAnGlAdesH      mozAmBiQue     pAkistAn           iRAn (BAm)    indiAn oCeAn      HAiti
                                                       Floods 2004     Floods 2007    Floods 2010        eARtHQuAke    eARtHQuAke/       eARtHQuAke
                                                                                                         2003          tsunAmi 2005      2010

                 no. of people affected (million)         36.9              0.3           20.4               0.3             1.7              3.7

                 Funding to the crisis (us$ million)       68               48            2,446             130             6,254           3,536

                 Amount per person (us$)                   2               167             120              487             3752             956


Source: UN OCHA FTS and CRED


    The Haiti earthquake crisis in 2010 received                funding needs, with a number of the
    large volumes of funds outside of the                       major consolidated appeals noticeably
    UN appeal. When these funds are taken                       more underfunded in 2010 than in the
    into account, in common with other very                     preceding year. The consolidated appeals
    high-profile natural disasters, the Haiti                   for Chad, Central African Republic (CAR),
    crisis received a relatively high volume of                 Palestine/OPT and Uganda all experienced
    humanitarian funds per affected person,                     a widening in their funding gap of around
    with US$956 per person recorded through                     30% in 2010.
    the UN OCHA Financial Tracking Service
                                                                The effects of the 2010 ‘mega-disasters’ on
    (FTS), compared with just US$120 per
                                                                overall funding levels in the years to come
    person affected by the flooding in Pakistan
                                                                remain to be seen, but for ongoing crises
    the same year.
                                                                in 2010 humanitarian funding certainly
    Meanwhile, many long-running crises                         appeared to have become considerably
    experienced an increase in unmet                            harder to secure.


    FiGuRe 14: pRopoRtion oF FundinG needs met in un ConsolidAted AppeAls in 2009 And 2010


                                                           2009               2010       ReduCtion in
                                                                                         needs met in 2010

                        Afghanistan                       76.4%              65.0%               -11.4%
                        Chad                              91.3%              60.0%               -31.3%
                        CAR                               73.0%              44.6%               -28.4%
                        dRC                               63.8%              64.1%                0.3%
                        kenya                             84.4%              65.9%               -18.5%
                        palestine/opt                     79.1%              52.0%               -27.1%
                        somalia                           65.6%              67.7%                2.1%
                        sudan                             70.3%              64.4%               -5.9%
                        uganda                            76.3%              48.2%               -28.1%
                        west Africa                       64.3%              49.8%               -14.5%
                        zimbabwe                          63.2%              46.9%               -16.3%

    Source: Development Initiatives based on UN OCHA FTS

                                                                                                                                                              63
FundinG in ACCoRdAnCe witH Assessed needs

In order for donors to make informed                 yet to be effectively linked up with donor
funding decisions to meet their                      decision-making processes. No equivalent
commitments to fund in accordance with               initiatives to improve the evidence base for
assessed needs, they need objective and              humanitarian needs in protracted crises,
comparable evidence that demonstrates the            which receive the majority of humanitarian
scale, severity and nature of humanitarian           funds, have yet been attempted.
needs, and they also need to know what
                                                     In practice, the evidence base remains
decisions others are making to ensure that
                                                     largely ad hoc, not comparable and not
resources are distributed equitably across
                                                     widely shared, making donor commitments
and within different crises. Yet serious
                                                     to fund according to needs untestable.
deficiencies remain in both areas.
                                                     Moreover, the bases on which donors make
While some progress has been achieved in             their decisions are rarely made public. This
improving the technical basis and capacity           lack of transparency as to who is funding
for common assessments in the early                  what, and with what justification, creates a
stages of rapid-onset emergencies, this has          situation where a rational and proportional


     impRovements in tHe evidenCe BAse FoR HumAnitARiAn FinAnCinG deCisions
     Improvements in establishing an objective       UN OCHA has recently employed the                a richer evidence base for prioritising
     evidence base and prioritisation within UN      ‘Humanitarian Dashboard’ in the Pakistan         preventive and mitigating action.
     consolidated appeals have not yet been          flooding crisis in 2010 and in the Libya
                                                                                                      Humanitarian coordinators who expected
     applied consistently across all appeals.        crisis in 2011. The dashboard is a tool to
                                                                                                      to submit humanitarian appeals to the
                                                     build a common understanding of the
     The UN’s Inter-Agency Standing                                                                   UN consolidated appeals process in 2011
                                                     humanitarian situation and aid decision
     Committee Needs Assessment Taskforce                                                             were required to anticipate and plan
                                                     making and crisis monitoring by
     (IASC NATF) has agreed a common Multi-                                                           for the needs assessments that would
                                                     consolidating a summary of essential
     Cluster Initial Rapid Assessment (MIRA)                                                          underpin appeals from mid-2010.
                                                     humanitarian information (including
     tool, including common indicators agreed
                                                     humanitarian needs, coverage, planning           The European Commission (EC) continues
     with the UN global clusters, for the early
                                                     scenarios) and monitoring key                    to test its funding decisions against its
     stages of rapid-onset emergencies.
                                                     humanitarian indicators against                  Global Needs Assessment (GNA) crisis
     The MIRA is designed to feed improved
                                                     benchmarks.                                      severity index and forgotten crises
     information on the scale and severity of
                                                                                                      index. The EC Directorate General for
     humanitarian needs to flash and revised         Within the UN consolidated appeals
                                                                                                      Humanitarian Aid and Civil Protection (DG
     flash appeals.                                  process, the DRC and West Africa
                                                                                                      ECHO) also publishes the rationale for and
                                                     appeals are compiled with reference to
     The IASC NATF has also published                                                                 volume of funding decisions for protracted
                                                     emergency thresholds that are used to
     ‘operational guidance’ spelling out roles                                                        crises to a predictable timetable. Some
                                                     prioritise areas of greatest humanitarian
     and responsibilities and recommended                                                             European donors are now using ECHO’s
                                                     need. The DRC appeal in 2011 also
     principles, procedures and common                                                                GNA tool as a basis to determine crisis
                                                     includes geographical rankings against
     indicators for coordinated assessments                                                           level funding envelopes.
                                                     four humanitarian risk factors, allowing
     in rapid-onset emergencies.


FiGuRe 15: oFFiCiAl HumAnitARiAn Aid ConCentRAtion AmonG tHe top 20 ReCipients And tHe Rest, 2000–2009


2009                                      31.2%                                                                          52.4%             16.4%

2008                                     30.3%                                                                        50.4%                 19.2%

2007                                          33.5%                                                                  46.8%                  19.6%

2006                                         32.1%                                                                       50.4%              17.5%

2005                                        31.3%                                                                    48.9%                  19.8%

2004                                              35.3%                                                          42.7%                      22.1%
2003                                              35.0%                                                          42.5%                      22.5%
2002                                 27.3%                                                          40.8%                                   31.9%
2001                           22.8%                                                         42.3%                                          34.9%
2000                                26.6%                                                           41.6%                                   31.7%
        0%                                                                                                                                      100%
                                                                                                            Top 3 recipients' share
                                                                                                            Rest of top 20 share
                                                                                                            All other recipients' share

Source: Development Initiatives based on OECD DAC

64
coverage of needs can only be achieved by           In order to guard against disproportionate          The volumes and proportions of
chance rather than by the sum of informed           concentration and a corresponding                   humanitarian aid provided by donors
individual donor choices.                           increase in the number of neglected crises,         outside of the OECD DAC group appear
                                                    donors must take measures to ensure that            to have grown in recent years, including
In the past decade, humanitarian funding
                                                    their decisions are made on objective and           notably from private sources, as well as the
has become increasingly concentrated
                                                    transparently declared bases and that they          growing volumes that are channelled via
among the top 20 recipient countries.
                                                    work together to achieve a rational division        pooled humanitarian funds.
Pressure for donors to deliver ‘value for
                                                    of labour.
money’ and ‘effectiveness’ in their aid                                                                 In order to achieve a rational collective
spending, at a time when some donor                 The Good Humanitarian Donorship group is            response to humanitarian needs, it is clear
agencies are also experiencing cuts to              the logical forum through which donors could        that all funding actors, including pooled
their staff budgets and a reduction in              work towards a rational, coordinated division       humanitarian funding mechanisms, need
their ability to manage large numbers of            of labour in meeting humanitarian needs,            to have access to information and evidence
grants, may further drive this trend towards        but a growing number, and a wider type,             regarding the scale and severity of needs
concentration of resources in a smaller             of donors also need to be included in this          and what other actors intend to fund.
number of recipient countries.                      conversation if all humanitarian financing
                                                    resources are to be effectively targeted.


FiGuRe 16: sHARe oF FundinG to All un AppeAls (BotH CAp And non-CAp) FRom oeCd dAC,
non-oeCd dAC, pRivAte And otHeR donoR souRCes


              9                                                                                             OECD DAC donors
              8                                                                                             Other government donors
                                                                                                            Private
              7                                                                                             Other
              6
US$ BILLION


              5

              4

              3

              2

              1

              0
       donoR type                     2006          2007          2008          2009         2010

       oeCd dAC donors                 2.8           3.1          4.0           4.8          5.3

       other government donors         0.1           0.1          0.3           0.2          0.3

       private                         0.0           0.0          0.1           0.1          0.4

       Other                           0.9           0.8          1.2           2.0          1.9


Note: ‘Private’ contributions include those from private sector corporations and foundations; private individuals/organisations; the Disasters Emergency
Committee (DEC); UNICEF national committees; Friends of UNWRA; and UNHCR UK. ‘Other’ includes contributions from Emergency Response Funds
(ERF), the Central Emergency Response Fund (CERF), Common Humanitarian Funds (CHF) and other pooled funds; NGOs; UN multilateral and other
multilateral funds; other combined and undefined funds; and International Red Cross and Red Crescent Movement. Source: Development Initiatives based
on OCHA FTS

                                                                                                                                                       65
THE STORY
Recent years have seen a deepening of vulnerability in many developing countries       CREDIT

due to the increasing incidence of climate change-related disasters, the growth of     © WFP / Challiss McDonough
food insecurity and the financial crisis. In February 2011, the World Food Programme
(WFP) launched a voucher programme in Jalalabad, Afghanistan to help 1,500
families to buy food. This picture shows a recently widowed woman using the
vouchers in a local store.


66
Beyond
tHe divide
HumAnitARiAn AssistAnCe in Context

The context of humanitarian assistance is complex and diverse; it is international and
national, global and local, involving both dedicated crisis response financing and ad hoc
responses from whomever and wherever funds are available, including the massive
and coordinated movements of supplies as well as the often hidden response from
individual families within their own communities.
This section examines some of the financial complexity within which this humanitarian
assistance operates. We look at the flows of overall development and the relationship
of development to humanitarian financing, especially post-crisis. We examine
specific donor responses in peace and security as well as disaster risk reduction
(DRR) i.e. investments to tackle underlying vulnerabilities that drive so much need
for humanitarian response. Finally we place this in the context of a much wider
understanding of domestic national financing. Humanitarian assistance, for all
of its importance in many contexts, is dwarfed in terms of volume by the flows of
resources that arrive from various sources in even the most crisis-ridden development,
development-disrupted and conflict-affected countries in the world.


                                                                                            67
US$           FOREIGN DIRECT
                37.2bn         INVESTMENT
                                                           US$       DEVELOPMENT
                                                          33.6bn     AID


                                                                                         US$ 7.1bn
                                                                                         PEACEKEEPING


                                                                                      US$ 8.1bn
                                                                                      HUMANITARIAN
                                                                                      ASSISTANCE


                         US$            REMITTANCES
                        42.5bn


                                                                                  US$ 241.8bn
                                                                                  DOMESTIC REVENUES


 2009 FUNDING FLOWS
 TO TOP 20 HUMANITARIAN
 RECIPIENTS
 The context of humanitarian assistance is complex and diverse; it is international
 and national, global and local, involving both dedicated crisis response financing
 and ad hoc responses from whomever and wherever funds are available.

 Humanitarian financing does not exist in a vacuum. It is just one element of
 support to a country in crisis. This image demonstrates how the flow of
 humanitarian financing can be dwarfed by others in volume and significance.


68
FiGuRe 1: top 20 ReCipients oF totAl oFFiCiAl HumAnitARiAn AssistAnCe, 2000–2009


                                     9,000                                                                                                                                                                                                                   80%


                                     8,000 68.3%                                                                                                                                                                                                             70%
                                                       60.6%
US$ MILLION (CONSTANT 2009 PRICES)


                                     7,000


                                                                                                                                                                                                                                                                   HUMANITARIAN SHARE OF AID (ODA)
                                                                                                                                                                                                                                                             60%

                                     6,000
                                                                                                                                                                                                                                                             50%

                                     5,000
                                                               39.2% 37.6%                                                                                                                                                                                   40%
                                     4,000                                                 33.2%
                                                                                                           31.8% 31.3%
                                                                                                      31.8%                 28.1%                                                                                                                            30%
                                     3,000                                                                            30.1%
                                                                                                                                                  21.3%
                                                                                                                                                                                                                                                             20%
                                     2,000                                                                                                                    21.3% 17.2%               16.8%
                                                                                                                                                                                                    14.9%
                                                                                                                                                                                   17.1%                  12.4%
                                                                                                                                                                                              16.1%                                                10.6%
                                     1,000                                                                                                                                                                                             12.1%                 10%


                                         0                                                                                                                                                                                                                   0%
                                             somalia

                                                       sudan

                                                                zimbabwe

                                                                           palestine/opt

                                                                                            lebanon

                                                                                                       Angola

                                                                                                                liberia

                                                                                                                          Burundi

                                                                                                                                    Chad

                                                                                                                                           dRC

                                                                                                                                                   ethiopia

                                                                                                                                                               sri lanka

                                                                                                                                                                           kenya

                                                                                                                                                                                    Afghanistan

                                                                                                                                                                                                  Jordan

                                                                                                                                                                                                           indonesia

                                                                                                                                                                                                                       iraq

                                                                                                                                                                                                                              serbia

                                                                                                                                                                                                                                        pakistan

                                                                                                                                                                                                                                                    uganda
                                     2009    528.5 1304.9 389.9 1187.5 192.3                            6.8     43.5      88.4      318.0 560.9 680.7 231.2 394.7 577.9 150.0 257.1 490.9                                     16.5      544.3 152.0

                                     2008    552.3 1371.2 328.0 772.7 248.8                            10.8     88.8      86.9      239.0 528.2 832.4 242.2 299.9 850.2 146.9 133.1 381.5                                     21.3      174.1 234.7

                                     2007    267.3 1314.4 162.7 857.7 337.9                            28.0     108.2 108.5 182.4 415.9 301.6 209.6 194.1 318.3 120.5 237.2 375.8                                             28.6      243.8 224.8

                                     2006    318.8 1363.1 114.1 804.8 418.0                            57.4     147.6 151.2 107.4 435.6 343.3 161.8 243.0 351.6 116.3 506.8 432.6                                             31.5      448.3 228.3

                                     2005    190.4 1375.5 213.3 447.9 111.9 120.2 144.9 169.7 123.0 306.6 656.5 400.0                                                      84.6     319.5 118.7 739.7 668.1                   41.8      533.2 179.7

                                     2004    153.7 844.7        68.9       564.0           91.0       214.8 172.2 163.5             96.8   286.6 439.2         48.0        89.9     428.7 109.4            31.9 1077.1 133.1            55.4        164.5

                                     2003    134.2 357.8        92.6       462.4           81.2       311.1 104.5 150.1             11.0   255.9 803.5         39.0        76.7     485.9 136.0            64.3 1140.3 128.4            66.1        145.3

                                     2002    129.2 261.4        83.4       465.0           90.2       276.5     48.6      104.0     4.0    261.3 231.9         48.4        94.7     855.9 123.5            72.8        147.0 108.8      67.4        79.9

                                     2001    97.7      172.0     7.5       363.3           86.6       144.6     24.1      78.4      10.1   187.0 212.6         41.0        88.4     561.6 125.5            79.6        177.5 308.7      80.4        59.1

                                     2000    79.9      130.4     4.5       273.2           78.4       157.5     40.4      57.0      8.3    95.4   229.0        44.6        75.1     164.0 118.5            73.5        140.3 720.6      33.7        35.6


                                     00-09 68.3% 60.6% 39.2% 37.6% 33.2% 31.8% 31.8% 31.3% 30.1% 28.1% 21.3% 21.3% 17.2% 17.1% 16.8% 16.1% 14.9% 12.4% 12.1% 10.6%

              Note: Recipient countries are ranked by the percentage of ODA that is classified as humanitarian assistance. Source: OECD DAC, all donors


      THE HUMANITARIAN STORY                                                                                                                          THE DATA STORY
      In 2009 total official humanitarian assistance from                                                                                             In this chapter we use the top 20 humanitarian recipients over
      governments was more than US$11.2 billion.                                                                                                      the decade 2000–9 as a set to compare and contrast with other
                                                                                                                                                      flows of money.
      The countries in this graph are the top 20 recipients
      by volume over the decade 2000–9 and represent the                                                                                              All figures relating solely to humanitarian or wider official
      majority of that humanitarian spending.                                                                                                         development assistance (ODA) are expressed in constant 2009
                                                                                                                                                      prices, exclude debt relief, and relate to all donors reporting to the
                                                                                                                                                      OECD DAC. Where aid expenditures are combined with this other
                                                                                                                                                      data, all figures are converted to current prices.


                                                                                                                                                                                                                                                                              69
development Aid in HumAnitARiAn CRises

  tHe RelAtionsHip Between                                                                                          same beneficiaries, there are significant
  HumAnitARiAn And                                                                                                  differences in the ways in which they are
  development Aid                                                                                                   planned and implemented.

  When crisis occurs, it is unsurprisingly                                                                          General development aid is a long-term
  humanitarian assistance – the immediate                                                                           investment, is more likely to be tied
  response to urgent need – that receives                                                                           into recipient government structures
  the attention and the focus of politicians,                                                                       and planning, with ministries taking the
  the media and the general public. Yet in                                                                          lead in implementation, and focused
  all but a few cases humanitarian aid is                                                                           on supporting government structures,
  a junior partner to general development                                                                           sustainable development and poverty
  aid, at least in terms of overall volume,                                                                         reduction. Humanitarian aid is more
  even in countries in grave and continual                                                                          likely to be short-term, dealing more with
  crisis. Equally, even donors that give the                                                                        symptoms than with causes, with saving
  largest priority of their aid to humanitarian                                                                     lives and protecting people rather than with
  financing (such as Ireland, Sweden and                                                                            sustained intervention, and focusing on
  the United States) have never spent more                                                                          rapid response to urgent need rather than
  than 20% of their total aid on humanitarian                                                                       on long-term development. In many cases it
  assistance in a single year. This is                                                                              also brings international actors to the fore,
  especially important if we are focusing our                                                                       such as when government capacity has
  attention on the US$11.2 billion of official                                                                      been severely damaged by a sudden natural
  government humanitarian aid reported to                                                                           disaster or when a government itself is
  the DAC in 2009, and not the remaining                                                                            a party to conflict. Furthermore, despite
  US$124.4 billion accounted for by the rest                                                                        being spent by the same donor government
  of official development assistance (ODA).                                                                         from the same overall aid budget, funds
                                                                                                                    for humanitarian and general development
  While there is evidence that both                                                                                 aid are usually administered by distinctly
  humanitarian and general development                                                                              separate departments or divisions.
  aid in crisis contexts are in some cases
  being used to do very similar things,
  and are often ultimately aimed at the


  FiGuRe 2: top 20 ReCipients oF totAl odA, 2000-2009


                                     40                                                                                                                                                                                                                      70%
                                                                                                                                                                                  60.6%
                                     35                                                                                                                                                                                                                      60%
US$ BILLION (CONSTANT 2009 PRICES)


                                                                                                                                                                                                                                                                   HUMANITARIAN SHARE OF AID (ODA)
                                     30
                                                                                                                                                                                                                                                             50%
                                     25
                                                                                                                               37.6%                                                                                                                         40%
                                     20
                                                                                                                                                                                                                 28.1%                                       30%
                                     15
                                                                          21.3%
                                                 17.1%                                                                                                                                                                                    17.2%              20%
                                     10 14.9%
                                                                                                12.1%
                                                                                                                                                                                          16.1%
                                                                                                                       3.5%                                                                            12.4%                                                 10%
                                      5                        0.5%                  4.2%                                                                   4.6% 10.6%                                                    0.7%
                                                                                                            1.7%                                                                                                                  0.6%
                                                                                                                                               3.3%                                                                                                3.8%
                                      0                                                                                                                                                                                                                      0%
                                          Iraq

                                                 Afghanistan

                                                               Viet Nam

                                                                          Ethiopia

                                                                                     Tanzania

                                                                                                 Pakistan

                                                                                                            China

                                                                                                                       India

                                                                                                                               Palestine/OPT

                                                                                                                                               Mozambique

                                                                                                                                                            Bangladesh

                                                                                                                                                                         Uganda

                                                                                                                                                                                  Sudan

                                                                                                                                                                                           Indonesia

                                                                                                                                                                                                        Serbia

                                                                                                                                                                                                                  DRC

                                                                                                                                                                                                                          Ghana

                                                                                                                                                                                                                                  Egypt

                                                                                                                                                                                                                                          Kenya

                                                                                                                                                                                                                                                    Zambia


                                                                                                                                                                                                                                                             HA%ODA

                                                                                                                                                                                  HA% ODA               2009            2008       2007           2006        2005
                                                                                                                                                                                                        2004            2003       2002           2001        2000


  Note: ODA recipients are ranked left to right by total volume (excluding debt relief). Source: OECD DAC

70
tHe diFFeRinG pRioRities                         lonG-teRm HumAnitARiAn                           FiGuRe 3: top ReCipients oF odA,
oF Aid expendituRe                               spendinG in CRises Continues                     2000 And 2009
The spending of and priorities given to          HumAnitARiAn Aid is spent in tHe
ODA have clearly differed from those of          sAme ConFliCt-AFFeCted plACes
humanitarian assistance. Only 11 of the top
                                                 Although the purpose of development
20 official humanitarian aid recipients are                                                                 2000                      2009
                                                 assistance is to tackle the underlying
also in the top 20 by total ODA over the past
                                                 causes that lead to humanitarian crises,          China             2.3   Afghanistan        6.2
ten years, and only two of those have been
                                                 significant amounts of humanitarian aid
propelled there by significant proportions                                                         Vietnam           2.1   Ethiopia           3.8
                                                 are being spent on the same crises year
of spending on official humanitarian
                                                 on year, which suggests that donors are           Indonesia         2.0   Vietnam            3.7
assistance (60.6% for Sudan and 37.6%
                                                 not getting to grips with the causes but
for Palestine/OPT).
                                                 rather only dealing repeatedly with the           Serbia            1.9   Palestine/OPT 3.0
For some of the top recipients of ODA            same symptoms.
over the decade 2000–9, expenditure on                                                             India             1.8   Tanzania           2.9
                                                 Humanitarian aid is concentrated in a
humanitarian assistance is negligible.                                                             Bangladesh        1.5   Iraq               2.8
                                                 relatively small number of countries.
Vietnam has received close to US$25 billion
                                                 Over the past decade, 136 countries have
in ODA, but only US$108.2 million of this                                                          Egypt             1.5   Pakistan           2.8
                                                 been recipients of official humanitarian
was official humanitarian assistance (less
                                                 assistance and yet the top 20 account for         Mozambique 1.4          India              2.5
than 0.5%). Of Ghana’s US$11.5 billion, only
                                                 a massive US$54.7 billion (72.7%) of the
US$77.1 million was official humanitarian                                                          Tanzania          1.3   Sudan              2.3
                                                 total US$75.2 billion spent. The 20 next
assistance. Even Bangladesh, a country
                                                 largest recipients account for a further
prone to severe annual flooding and                                                                Uganda            1.1   DRC                2.2
                                                 US$12 billion of the remaining US$20.5
mudslides and regular disastrous cyclones,
                                                 billion. Therefore, 88.7% of the decade’s         Ethiopia          1.0   Mozambique         2.0
with millions of people receiving food
                                                 official humanitarian financing has been
assistance every day, has received only
                                                 spent in only 40 countries.
4.6% of ODA for official humanitarian
interventions over this ten-year period.         Countries in conflict or post-conflict
                                                 contexts account for much of this aid. Of
The major ODA recipients have changed
                                                 the top humanitarian recipients by volume        Figures in US$ billion, constant 2009 prices.
significantly over the past ten years. Only
                                                 over the decade, all but two have been           Source: OECD DAC
four countries (Vietnam, India, Tanzania
                                                 conflict-affected and 14 out of 20 have
and Ethiopia) in the top ten in 2009 were
                                                 been affected for more than eight of the
also there in 2000. Some changes have
                                                 past ten years, eight of these in Africa. (For
been remarkable. In the early part of the
                                                 the definition and methodology of conflict
decade, neither Afghanistan nor Iraq were
                                                 affected see the Data and Guides chapter).
close to being among the top ten recipients
of ODA. The year prior to their invasions        The evidence of the impact of conflict on
(2001 and 2003 respectively) Afghanistan         flows of long-term official humanitarian
received only US$220.1 million (placing it       assistance to individual countries is plain.
81st in volume) and Iraq US$168.6 million        For example, more than US$1.3 billion has
(placing it 94th). Yet by the end of the         been spent in Sudan in each of the past
decade they were placed first and second         five years. In the same period more than
by volume of ODA for the period, and have        US$450 million a year has been spent in
accounted for US$62.4 billion, or 9.3%, of       Palestine/OPT and more than US$250
the entire ten years’ development funding        million a year in Democratic Republic of
allocable by country.                            Congo (DRC) since 2002. Humanitarian aid
                                                 to Angola, Liberia and Burundi has been
However, over the past five years there
                                                 steady but gradually falling over the decade,
has been a consistency, and one that
                                                 while to Somalia and Chad it has risen.
is, perhaps surprisingly, shared by
humanitarian assistance. The top 20 ODA          Compared with conflict, the effects
recipients over the decade have also been        of natural disaster on humanitarian
top for each of the past five years in all but   assistance are mixed. Those disasters that
12 instances, when other countries break         receive most attention in the media – the
into the group. For official humanitarian        large-scale, sudden-onset earthquakes,
aid the pattern is similar: over the past five   floods and cyclones – are less significant
years the same countries have been the           in terms of volumes of funds received. Only
top 20 recipients each year in all but 13        three of the top recipients over the past ten
instances. This suggests that humanitarian       years (Pakistan, Indonesia and Sri Lanka)
assistance is a regular, continual flow to       have been propelled into that position due
crisis-affected countries, much more so          to significant funding in response to natural
than aid driven by response to sudden            disasters, with far more variable funding
natural disasters.                               year-on-year than most of the rest. Other
                                                 countries that have suffered similar major
                                                 natural disasters in the past ten years,
                                                 such as India, Iran, Bangladesh, Myanmar
                                                 and Haiti, do not appear in this list.
                                                 Drought however does feature in the
                                                                                                                                                  71
FiGuRe 4: wHAt dRives HumAnitARiAn AssistAnCe?


 CountRy             ConFliCt-              disAsteR-AFFeCted                            CRisis spilloveR
                     AFFeCted


                                                                      AFFeCted oveR 10


                                                                                                                     ReFuGees Housed
                          numBeR oF yeARs


                                              numBeR oF yeARs


                                                                                            numBeR oF yeARs
                                              witH oveR 150,000


                                                                                            witH oveR 100,000
                                              people AFFeCted


                                                                                                                     yeARly, AveRAGe
                                                                                            ReFuGees
                                                                      numBeR

                                                                      yeARs
 AFGHAnistAn              10                        5             5,897,526                        0            24

 AnGolA                     7                       3             928,198                          0            13,053

 BuRundi                  10                        3             3,824,449                        0            28,973

 CHAd                       8                       3             3,589,540                        7            194,363

 dRC                      10                        1             765,064                         10            239,193

 etHiopiA                 10                        6             33,997,746                       7            121,816

 indonesiA                  7                       9             10,200,692                       1            22,704

 iRAQ                     10                        0             76,478                           3            69,455

 JoRdAn                     0                       1             150,000                          4            195,828

 kenyA                      5                       5             33,922,372                      10            262,541
                                                                                                                                       Continually conflict-affected for more
 leBAnon                  10                        0             17,500                           0            18,471                 than 8 of past 10 years
 liBeRiA                  10                        1             38,449                           0            29,217                 Conflict-affected, for up to 7 years
                                                                                                                                       during the past 10 years
 pAlestine/ opt           10                        0             0                                0            0

 pAkistAn                 10                        6             14,569,076                      10            1,238,452
                                                                                                                                       Severely disaster-affected, more
 seRBiA                     7                       0             15,580                           6            233,553                than 150,000 over 7–10 years

 somAliA                  10                        4             5,564,567                        0            779                    Regularly disaster-affected, more
                                                                                                                                       than 150,000 affected for 3–6 years
 sRi lAnkA                  9                       9             5,767,155                        0            112

 sudAn                    10                        6             7,764,256                       10            227,768                Substantial support, more than
 uGAndA                   10                        4             3,558,390                       10            218,274                100,000 refugees for 7–10 years
                                                                                                                                       Regular support, more than 100,000
 zimBABwe                   0                       3             8,479,892                        0            7,068
                                                                                                                                       refugees for 3–6 years


Source: Conflict-affected Development Initiatives own methodology, disaster-affected
based on CRED data, crisis spillover based on UNHCR data


Drought however does feature in the                               HumAnitARiAn Aid is lonG-teRm
humanitarian profile of many recipient
                                                                  Examining the relationship of humanitarian
countries. Drought affects millions of
                                                                  aid to ODA allows us to further distinguish
people each year and yet in most cases
                                                                  countries receiving occasional assistance
is not covered by the media and does not
                                                                  from those where humanitarian aid is
reach public attention. It affects many
                                                                  spent continually.
of the African countries that feature
among the top 20 recipients of official                           The evidence shows that spending is
humanitarian assistance, accounting for                           indeed concentrated year on year in the
92% of people (93.7 million of 102 million)                       same places and that this expenditure
affected by natural disaster. Again, almost                       accounts for the bulk of all humanitarian
all those countries were or are also                              financing. In 2009, US$7 billion of a total
affected by conflict.                                             of US$10.1 billion of official humanitarian


72
FiGuRe 5: lonG-, medium- And sHoRt-teRm ReCipients oF totAl oFFiCiAl HumAnitARiAn AssistAnCe, 2000–2009


                                         12
    US$ BILLION (CONSTANT 2009 PRICES)


                                         10

                                             8

                                             6

                                             4

                                             2


                                             1995          1996      1997          1998     1999          2000      2001          2002      2003        2004   2005      2006     2007      2008      2009

                                                                                                                                                               Short-term recipients
                                                                                                                                                               Medium-term recipients
                                                                                                                                                               Long-term recipients


      Note: This is based on countries that received greater than average humanitarian assistance as a share of ODA between 1995 and 2009, in this case more
      than 10.4%. Long-term assistance countries are those that have received more than 10.4% for more than eight years in this period and medium-term
      assistance countries are those that have received more than 10.4% for between four and eight years. The humanitarian aid values expressed in this graph
      relate to expenditure on individual countries – the figures do not tally with overall expenditure totals, which include cross-border and regional expenditure.
      Source: Development Initiatives based on OECD DAC


      assistance – just under 70% – was given                                                      (Somalia, Palestine/OPT and, to an extent,
      to long-term humanitarian assistance                                                         Sudan) while others are taking many years
      countries, and these have accounted for                                                      to transition out of humanitarian need,
      over 60% spent since 1999.                                                                   such as DRC, Burundi and Uganda.
      Again the presence of conflict is significant.                                               The top 20 recipients of humanitarian aid
      Of the 26 countries we classify as long-                                                     dominate. Of the 26 countries receiving
      term recipients, 18 are conflict-affected                                                    long-term official humanitarian assistance,
      or are in post-conflict transition. Large-                                                   15 are also in the top 20 in terms of volume
      scale natural disasters appear to have                                                       over the decade. By 2009 these 15 account
      a substantial impact on the need for                                                         for 93.8% (US$6.6 billion) of the US$7
      assistance in only a very few instances.                                                     billion spent long-term. Essentially, not
      Humanitarian aid is not driven so much                                                       only are large amounts of money spent
      by sudden response as by long-term                                                           in relatively few countries, those large
      engagement in affected countries, some                                                       amounts are spent in the same countries,
      of which are in seemingly intractable crisis                                                 each and every year.


      FiGuRe 6: lonG-teRm HumAnitARiAn ReCipient CountRies, 1995–2009


                                         7                                                                                                                     Sudan
                                                                                                                                                               Palestine/OPT
                                         8
                                                                                                                                                               Ethiopia
US$ BILLION (CONSTANT 2009 PRICES)


                                         6                                                                                                                     Afghanistan
                                                                                                                                                               DRC
                                         5                                                                                                                     Somalia
                                                                                                                                                               Iraq
                                         4
                                                                                                                                                               Lebanon
                                         3                                                                                                                     Serbia
                                                                                                                                                               States Ex-Yugoslavia
                                         2                                                                                                                     Other top 20 humanitarian recipients
                                                                                                                                                               Remaining long-term recipients
                                         1

                                         0
                                         1995


                                                    1996

                                                             1997

                                                                    1998

                                                                            1999

                                                                                    2000

                                                                                           2001

                                                                                                   2002

                                                                                                           2003

                                                                                                                  2004

                                                                                                                           2005

                                                                                                                                   2006

                                                                                                                                          2007

                                                                                                                                                 2008

                                                                                                                                                        2009


      Source: Development Initiatives based on OECD DAC

                                                                                                                                                                                                      73
tHe BAlAnCe Between                                 continued conflict and lack of governance
HumAnitARiAn And development                        drove an increase in the share of official
AssistAnCe in CRisis-AFFeCted                       humanitarian aid from 38.1% in 2001 to
CountRies                                           a peak of 77.4% in 2008.

Though humanitarian assistance plays                In Sudan persistent humanitarian needs
an important role in many countries, all            remain, mostly in Darfur and the South. At
but a few of the major recipients receive           the same time donor governments have
far more money by way of development                been reluctant to grant ODA funds, in part
aid, even during the years when they are            due to alleged government involvement
most in crisis. Only two countries have             in human rights abuses in Darfur, but
received more than 50% of their total               also due to specific policies which mean
aid as humanitarian aid over the past               they cannot fund development activities.
decade – Somalia (with 65.5% of ODA in the          For example, in the case of the United
form of official humanitarian assistance)           States this refers to sanctions on Sudan
and Sudan (58.7%) – and only five other             and for the EC, to Sudan’s failure to
countries have received more than 50% of            ratify the Cotonou agreement. These
their ODA as humanitarian aid in at least           two elements have kept the proportion
one year during the decade: Liberia, Chad,          of Sudan’s humanitarian aid well above
Afghanistan, Iraq and Zimbabwe.                     the 50% mark ever since 2001, and this
                                                    despite the signing of the Comprehensive
Over the period 2000–9 the average                  Peace Agreement in 2005 and Sudan’s
contribution of humanitarian aid to overall         achievement of middle-income country
ODA seen in the leading recipient countries         status. (According to the UN workplan,
of official humanitarian aid was 22.6%, but         more than US$424.6 million was spent
this masks considerable variation amongst           on programmes for South Sudan alone
recipients and over time.                           in 2008, which would have made it the
Both Somalia and Sudan’s trends over                seventh largest recipient of bilateral
ten years reflect the conditions for aid            humanitarian aid that year).
in those countries. For the former,


FiGuRe 7: totAl oFFiCiAl HumAnitARiAn AssistAnCe As A pRopoRtion oF odA, key AFRiCAn CountRies, 2000–2009


90%
80%

70%                                                                                                             Somalia
                                                                                                                Top 20 recipients
60%
                                                                                                                Liberia
50%                                                                                                             Chad
                                                                                                                DRC
40%
                                                                                                                Sudan
30%                                                                                                             Zimbabwe

20%

10%

0%
        2000      2001      2002      2003      2004        2005      2006     2007      2008    2009   Total


Source: Development Initiatives based on OECD DAC


74
If by making progress through aid we                  remainder of the decade (for Afghanistan
mean achieving diminishing proportions                on average four-fold yearly and for Iraq
of humanitarian assistance in post-crisis             five-fold) humanitarian aid as a percentage
countries, then perhaps Liberia is a clear            of ODA has fallen remarkably low and
example of success. Though it is one of               has stayed low due to the continual
the most aid-dependent countries in the               and significantly larger development
world and is still receiving substantial              investments.
peacekeeping funding, its aid profile
                                                      There are some concerns that the future
has changed significantly since the 2005
                                                      of aid to persistent and protracted crises
elections, with official humanitarian
                                                      is undermined by an increasing focus
assistance dropping sharply in 2006 and
                                                      by donors on fewer countries. Despite
in the following three years (2007–9)
                                                      hardly featuring as ODA recipients at the
averaging only 13% of ODA.
                                                      start of the decade, by 2009 Afghanistan
Aid trends for Afghanistan and Iraq,                  had accounted for US$38.9 billion and
countries that have seen recent                       Iraq for US$33.8 billion of the total ODA
international interventions, have changed             sum of US$310.5 billion going to the top
much more markedly and quickly                        20 humanitarian recipients. Therefore,
than any other post-conflict context.                 20% of all development aid to the top 20
In both countries prior to intervention               crisis-affected countries has been spent
humanitarian assistance dominated,                    in Afghanistan and Iraq alone, whose
largely due to their negative aid                     combined populations account for only
environments, with Iraq under the oil-for-            7% of the group as a whole.
food regime and Afghanistan controlled
by the Taliban. Before intervention, official
humanitarian assistance made up 76.3%
of aid to Afghanistan and 81.8% to Iraq,
but despite increasing greatly over the


FiGuRe 8: sHARe oF totAl odA ReCeived in tHe FoRm oF totAl oFFiCiAl HumAnitARiAn AssistAnCe
AFteR siGniFiCAnt event


90%

80%
                                                                                                                                       Sudan
70%                                                                                                                                    Afghanistan
60%                                                                                                                                    Iraq
                                                                                                                                       DRC
50%

40%

30%

20%

10%

 0%
           -3          -2           -1            0                1       2            3            4            5            6

                                       Year of significant event


Note: Significant events are as follows: Afghanistan 2001 (invasion) Iraq 2003 (invasion) DRC 2003 (withdrawal of all foreign armies
and set up of transitional government) Sudan 2005 (signing of the Comprehensive Peace Agreement)

                                                                                                                                                     75
tACklinG vulneRABility

Beyond simply providing more volumes                             heightened focus on conflict-affected and
of aid, donors can address the specific                          fragile states, and donor countries’ own
underlying vulnerabilities that lead to                          involvement in conflict and subsequent
high levels of humanitarian need by using                        reconstruction. This has come through
a variety of resources and approaches.                           contributions not only to direct peace and
This section looks at funding for peace                          security activities such as peacebuilding,
and security (unsurprisingly, areas that                         reintegration of combatants and landmine
conflict-affected populations put at the top                     clearance, but also to the building of the
of their lists of needs), which crosses not                      necessary systems and infrastructure of
only from humanitarian to development                            governance that are essential to deliver
financing but involves both ODA and non-                         adequate basic services and to ensure the
ODA flows and both budgetary allocations                         security of populations.
assessed through membership of the
                                                                 The growth in these investments has
United Nations and specific intervention
                                                                 outpaced ODA as a whole: spending
tools designed by donors. We also examine
                                                                 on activities targeted towards building
funding for disaster risk reduction (DRR),
                                                                 government capacity and security
an area complicated by the lack of data,
                                                                 combined (based on gross disbursements)
inconsistent reporting and the difficulty
                                                                 grew by 165% between 2002 and 2009,
of tracking interventions that are largely
                                                                 compared with growth rates of 68.1% for
mainstreamed through other activities.
                                                                 total humanitarian aid and 50.3% for ODA
peACe And seCuRity                                               as a whole (excluding debt relief and based
                                                                 on net disbursements). ODA spending
pRioRitisinG stAteBuildinG
And seCuRity                                                     related to governance, civil society,
                                                                 peace and security therefore accounts
Throughout the past decade, donor                                for a growing share of total ODA, almost
governments have made considerable                               doubling from 6.9% of all spending in 2002
and increasing investments in security                           to 12.2% in 2009.
in recipient countries, driven largely by a


FiGuRe 9: GRowtH in Aid spendinG on GoveRnment And Civil soCiety, peACeBuildinG And ConFliCt Resolution


                                     30
                                                                                                                 Humanitarian aid
                                                                                                                 Peacebuilding and conflict resolution
                                     25                                                                          Governance and civil society
US$ BILLION (CONSTANT 2009 PRICES)


                                     20


                                     15


                                     10


                                     5


                                     2002   2003   2004   2005        2006        2007       2008         2009


Sources: OECD DAC CRS and Development Initiatives analysis


76
keepinG tHe peACe                                   By 2009 more than US$7.1 billion of
                                                     peacekeeping funding (77.8%) was going
 The almost continuous rise in the financing
                                                     to just the top 20 recipient countries of
 of governance and security expenditures
                                                     humanitarian assistance, with these
 over the decade has complemented
                                                     countries accounting for 165,070 (85%) of
 considerable increases in donor funding
                                                     the total number of 193,634 peacekeeping
 of international peacekeeping missions,
                                                     troops deployed.
 which range from the monitoring and
 recording of abuses of peace agreements             Some individual country expenditures have
 to military policing of peace, right through        been substantial. Since 2004 more than
 to supporting state-building through                US$9.3 billion has been spent on peace-
 work in rule-of-law and justice systems,            keeping in Sudan and more than US$6.7
 demobilisation and reintegration of                 billion in DRC, which together account for
 combatants or helping to manage free                32.3% of all peacekeeping funding.
 and fair elections.
                                                     Some of these peacekeeping missions have
 Only five of the largest 15 recipients of           been long-term. There is not a great deal of
 peacekeeping funds over the decade                  evidence to show that international donors
 from 2000 to 2009 are countries that                and the countries hosting these missions
 have received relatively small amounts              have managed to move the agenda from
 of humanitarian assistance – Haiti,                 peacekeeping to actual peace and then
 Côte d’Ivoire, Timor-Leste, Bosnia and              to reconstruction. If we use reductions
 Herzegovina, and Sierra Leone. The                  in volumes of peacekeeping flows to
 remaining ten, all major recipients of              individual countries as an indicator of
 humanitarian assistance, account for a              achievement (though admittedly a rather
 huge proportion of this additional donor            crude one), then only three countries
 investment in insecure environments –               where large missions have taken place
 more than US$35 billion (63.6%) of the              – Sierra Leone, Burundi and Bosnia and
 US$55.1 billion spent.                              Herzegovina – would appear to have had
                                                     success so far.


 FiGuRe 10: peACekeepinG Funds CHAnnelled tHRouGH tHe top 20 ReCipients
 oF totAl oFFiCiAl HumAnitARiAn AssistAnCe


         10                                                                                                 Remaining peacekeeping missions
              9                                                                                             Iraq
                                                                                                            Chad/CAR
              8                                                                                             Burundi
                                                                                                            Bosnia and Herzegovina
              7
                                                                                                            Ethiopia/Eritrea
US$ BILLION


              6                                                                                             Afghanistan
                                                                                                            Timor-Leste
              5
                                                                                                            Sierra Leone
              4                                                                                             Lebanon
                                                                                                            Haiti
              3                                                                                             Côte d'Ivoire
                                                                                                            Serbia
              2
                                                                                                            Liberia
              1                                                                                             DRC
                                                                                                            Sudan
              2000   2001   2002   2003       2004       2005      2006       2007      2008       2009


 Note: For the sake of accurate trends, figures for Serbia include those for Kosovo after the 2008 declaration of independence, as the same
 UN peacekeeping mission in the latter accounts for the bulk of peacekeeping financing. Source: Development Initiatives based on Stockholm
 International Peace Research Institute (SIPRI)

                                                                                                                                              77
donoR tools i: stABilisAtion Funds

  Donors continue to use specific funds to                                                                        but one. The former receives 46.9% of
  supplement state-building and stabilisation                                                                     stabilisation funding from the UK alone
  efforts, mechanisms that fund both ODA-                                                                         but also receives sizeable contributions
  eligible and non-eligible interventions,                                                                        from the Netherlands (US$41.2 million),
  including discretionary peacekeeping                                                                            Canada (US$42.8 million) and the EU
  activities and contributions to non-UN-                                                                         (US$46.5 million). Stabilisation funding for
  led peacekeeping missions. Denmark’s                                                                            sub-Saharan Africa comes largely from
  stabilisation fund, set up in 2010 as part                                                                      two donors, the UK again (US$68 million)
  of its ‘whole of government’ strategy, has                                                                      and the UN Peacebuilding Fund (US$77.1
  become the latest.                                                                                              million). However, some donor government
                                                                                                                  funds, including those of the UK, the
  Unsurprisingly, large proportions of
                                                                                                                  Netherlands and the EU, have reduced
  stabilisation financing go to both South and
                                                                                                                  funding volumes from their peaks in 2008.
  Central Asia (which contains Afghanistan
  and Pakistan, amongst others) and sub-
  Saharan Africa; these two regions account
  for 34% and 35.2% respectively of the eight
  funds combined. South and Central Asia
  receives financing from all of the stabilising
  funds, and sub-Saharan Africa from all


  FiGuRe 11: FundinG CHAnnelled tHRouGH pooled donoR Funds FoR peACeBuildinG And stABilisAtion


              350
                                                                                                                                                                                                                        Africa, sub-Sahara
                                                                                                                                                                                                                        Africa, north of Sahara
                                                                                                                                                                                                                        Europe
              300                                                                                                                                                                                                       Oceania
                                                                                                                       288.4
                                                                                                                                                                                                                        Middle East
                                                                                                                                                                                                                        South and Central Asia
                                                                                                                                                                                                                        Far East Asia
              250                                                                                                                                                                                                       South America
                                                                                                                                                                                                                        North and Central America
                                                                                                                                                                                                                        Country not specified
                                                                                                                                                                                                                        Other
              200
US$ MILLION


                                                                                                                                                    174.3


              150
                    122.6
                                                                                          110.4
              100                                                                                                                                                           89.4


              50
                                                26.7
                                                                                                                                                                                               12.2
                                                                         6.7
               0
                    Canada Global Peace and
                        Security Fund, 2010


                                              Denmark Stabilisation
                                                       Fund, 2010


                                                                            Fund, 2010


                                                                                                    Fund, 2010


                                                                                                                        UK Conflict Pool, 2009/10


                                                                                                                                                        Stability, 2009


                                                                                                                                                                          UN Peacebuilding
                                                                                                                                                                                Fund, 2010


                                                                                                                                                                                                World Bank State and
                                                                                                                                                                                             Peacebuilding Fund, 2010
                                                                      Ireland Stability


                                                                                          Netherlands Stability


                                                                                                                                                    EU Instrument for


  Note: The EU Instrument for Stability (IfS) includes only the ‘Crisis response preparedness and conflict prevention’ window. Note also that bilateral donor
  funds may also contribute to multilateral funds listed here, notably the UN Peacebuilding Fund. Sources: Development Initiatives based on information
  provided by the governments of Canada, Denmark, Ireland, Netherlands, United Kingdom; the European Union; UN Peacebuilding Fund; and World Bank

 78
disAsteR Risk ReduCtion (dRR)                              both the short and long terms, but also to
                                                                                                                FiGuRe 12: pRevention And pRepARedness
                                                           protect other investments and development
Natural events affect developing countries                                                                      2005 to 2009
                                                           gains, whether in health care, education or
substantially more than their developed
                                                           poverty reduction.
counterparts, due to their relatively
poor infrastructure, weaker government                     tHe low pRioRity oF disAsteR
                                                           pRevention And pRepARedness                                        volume us$m          % oF HA
capacity for planning and response and
their often large populations living on                                                                         2009                455             4.2%
                                                           Despite problems of adequate data, there
the fringes of habitable space, such as                    are indications that increased rhetoric              2008                333             3.1%
flood plains or on steep gradients. These                  about the importance of reducing risk
populations, many of whom live on the                                                                           2007                99              1.2%
                                                           from disasters by taking action before they
edges of urban areas, often lack the basic                 occur has led to increased expenditures.             2006                41              0.5%
facilities that many others take for granted,              Since 2005 flows to disaster prevention              2005                70              0.7%
such as adequate housing, clean water                      and preparedness have increased from
and sanitation, roads and electricity. This,               US$70 million to US$455 million.
combined with their relatively limited
means of coping with sudden crises, and                    On average, for every US$100 spent on
compounded by weak infrastructure and                      official humanitarian assistance in the             Source: OECD DAC
government capacity, can easily turn a                     top 20 recipients, only 75 cents – or 0.75%
natural event into a natural disaster.                     – goes on disaster preparedness and
                                                           prevention. Even in the country with the
Both donor and recipient nations are                       largest volume of funds going to this area
paying increasing attention to the need to                 (Iraq, with US$47.4 million over the past
reduce the risk of disaster, not only to limit             five years), it accounts for only 2.2% of total
the loss of life and the loss to economies in              humanitarian spend.


FiGuRe 13: oFFiCiAl BilAteRAl HumAnitARiAn AssistAnCe 2005 -2009 to top ReCipients
oF totAl oFFiCiAl HumAnitARiAn AssistAnCe oveR tHe lAst 10 yeARs, RAnked By moRtAlity Risk


    Indonesia (9)                                           30.0
  Afghanistan (8)                                             11.9
      Pakistan (8)                      15.6
          DRC (7)               11.4
        Sudan (6)                       3.6                                                                                                            6080.9
       Uganda (6)          8.8
      Ethiopia (6)        16.5
    Average (5.5)               0.5
       Serbia (5)         0.3
         Chad (5)         0.5
      Lebanon (5)                      0.6
       Liberia (5)        0.7
      Somalia (5)                      3.5
   Zimbabwe (5)           4.2
      Burundi (5)           5.5
        Kenya (5)         11.1
     Sri Lanka (5)                                 11.6
           Iraq (5)                                 47.4
        Angola (4)         0.5
        Jordan (3)        0.2
Palestine/OPT (2)                1.9
                      0                      500           1000          1500             2000               2500            3000           3500               4000
                                                                           US$ MILLION (CONSTANT 2009 PRICES)


                                                                                                                    Reconstruction relief and rehabilitation
                                                                                                                    Disaster prevention and preparedness
                                                                                                                    (exact figures indicated)
                                                                                                                    Total remaining humanitarian assistance
                                                                                                                    (Sudan figure as indicated)


Note: Mortality risk is taken from the UN Global Assessment report on DRR produced by the United Nations International Strategy for Disaster Reduction
(UNISDR), with 10 being the most at risk countries and 1 being the least at risk. Source: Development Initiatives based on OECD DAC


                                                                                                                                                               79
For key countries in Africa it is much                                                                Detailed investigations into codes beyond
   worse. In the past five years only US$33.3                                                            preparedness and prevention eveal                                       tHe CHAllenGe oF CountinG
   million has been spent in total in seven                                                              significant other expenditures on DRR.                                  FundinG FoR disAsteR Risk
   conflict-affected countries combined –                                                                For example, Pakistan has received nearly                               ReduCtion
   Burundi, Chad, DRC, Sudan, Somalia,                                                                   US$800 million over five years for DRR                                  Note that tracking the full range of
   Uganda and Angola – while in those same                                                               and Indonesia close to US$200 million,                                  DRR interventions, rather than a
   years more than 17.5 million people                                                                   perhaps unsurprising given the devastating                              more narrow definition of disaster
   have been affected by natural disaster,                                                               natural disasters that regularly affect these                           prevention and preparedness
   especially drought. Of the US$6.4 billion                                                             countries. Ethiopia’s more than US$100                                  spending marked as humanitarian
   spent in Sudan in the past five years,                                                                million is connected to investments in                                  aid, is complicated. There are issues
   only US$3.5 million has been spent on                                                                 reducing the risk of drought. However,                                  of semantics and differing donor
   preparedness and prevention, while over                                                               these figures, which bring in investments                               administrative systems, reporting
   the same period nearly 5.5 million people                                                             found within total ODA, also reveal how low                             and implementation. There is also
   have been affected.                                                                                   a priority DRR remains.                                                 the wide range of activities involved
   Expenditure on preparedness and                                                                       There is minimal investment in many                                     and the fact that interventions are
   prevention has not been a significant                                                                 countries, including those whose                                        often mainstreamed within other
   priority for any of the top humanitarian                                                              populations are significantly at risk of                                major flows of funds without being
   recipients in the past five years. Up to this                                                         mortality due to natural disaster. Only the                             marked as also being investments in
   point, however, we have been comparing                                                                three countries mentioned above have                                    DRR (see Data & Guides section for
   the rather narrow areas of preparedness                                                               received more than US$100 million in                                    full details).
   and prevention within humanitarian aid and,                                                           total for DRR over the five years. Only five                            In 2009 alone we have tracked an
   while such an analysis shows very clearly                                                             countries have received more than 1% of                                 additional US$380 million of DRR
   that governments do not prioritise these                                                              ODA over five years as DRR funding. Of                                  captured in other official humanitarian
   activities, it does not show full investments                                                         the US$150 billion spent on ODA for all                                 or overall ODA codes. Total DRR for
   in DRR, as investments are often hidden                                                               20 countries over the past five years, only                             the year would therefore have been
   by poor data (see box on the challenge of                                                             US$1.5 billion, or 1%, has been spent on                                US$835 million in 2009, a mere 0.5%
   counting). However, even taking a second                                                              DRR. Investment in disaster risk reduction                              of total ODA for year.
   look at overall ODA flows and pulling in the                                                          has been disastrously low.
   additional funding believed to be going to
   the wider area of DRR, the funding levels left
   remain pitfully low.


   FiGuRe 14: dRR expendituRe FoR 2005-2009 in top 20 HumAnitARiAn ReCipient CountRies, RAnked By moRtAlity Risk


                                     900                                                                                                                                                                                                          8%
                                                                     7.2
                                     800                                                                                                                                                                                                          7%
US$ MILLION (CONSTANT 2009 PRICES)


                                     700
                                                                                                                                                                                                                                                  6%

                                     600
                                                                                                                                                                                                                                                  5%
                                     500
                                                                                                                                                                                                                                                  4%
                                     400
                                           2.9
                                                                                                                                                                                                                                                  3%
                                     300                                                                                    2.3
                                                                                                                                                                                         1.9
                                                                                                                                                                                                                                                  2%
                                     200
                                                                                                                                          1.4
                                                                                      0.9
                                     100                                                                                                                                                                                                          1%
                                                       0.3                                                                         0.2
                                                                                                                  0.4                                                          0.3                   0.2
                                                                                0.2              0.2     0.1                                                          0.1                                       0.1
                                      0                                                                                                                                                                                                           0%
                                           Indonesia

                                                       Afghanistan

                                                                     Pakistan

                                                                                DRC

                                                                                      Ethiopia

                                                                                                 Sudan

                                                                                                         Uganda

                                                                                                                  Burundi

                                                                                                                            Chad

                                                                                                                                   Iraq

                                                                                                                                          Kenya

                                                                                                                                                  Lebanon

                                                                                                                                                            Liberia

                                                                                                                                                                      Serbia

                                                                                                                                                                               Somalia

                                                                                                                                                                                         Sri Lanka

                                                                                                                                                                                                     Zimbabwe

                                                                                                                                                                                                                Angola

                                                                                                                                                                                                                         Jordan

                                                                                                                                                                                                                                  Palestine/OPT


                                                                                                                                                                                Development DRR
                                                                                                                                                                                DRR in humanitarian assistance
                                                                                                                                                                                Preparedness and prevention
                                                                                                                                                                                % of ODA


   Source: Development Initiatives based on OECD DAC


80
donoR tools ii: ReConstRuCtion Funds


 FiGuRe 15: ReConstRuCtion Funds FoR nAtuRAl disAsteRs And ConFliCt


                            Afghanistan                                                                            2,909
NATURAL CONFLICT-AFFECTED


                                 Sudan                                                                                653

                     Palestine/OPT                                                         580

                                   Iraq                                              501

                               Pakistan             67
                                                                                                                                   CERF
DISASTER


                                  Haiti                              235                                                           CHF
                                                                                                                                   ERF
                              Indonesia                                           488
                                                                                                                                   Reconstruction funds
                                          0   100        200   300         400      500     600   700   800     900       1000
                                                                                 US$ MILLION


 Source: Development Initiatives based on UNDP Multi-Donor Trust Fund Office Gateway and World Bank. Partial 2010 for Sudan MDTF


 Pooled reconstruction funds are tools                                      Afghanistan’s fund is the largest of this            The percentage of total development
 designed to assist donors after large-scale                                kind and has received the highest amount             aid in these contexts can be significant.
 crises. They are intended to help them                                     for each of the past five years, with a              Afghanistan and Sudan have received
 by transferring responsibility for decision                                total of more than US$3 billion between              13.1% and 15.3% respectively of all their
 making to key stakeholders at country level,                               2006 and 2010. In 2010 alone it received             ODA funding through pooled mechanisms
 to ensure coordination of aid priorities,                                  US$622.2 million from 18 donors, of                  of one sort of another over the years
 avoid duplication and share risk. They are                                 which the US was the largest, contributing           2006–9 (2006 being the peak year for both).
 also more likely to be tied to government                                  US$264.3 million, a substantial 42.5% of
                                                                                                                                 Contributions to reconstruction funds
 plans and capacity and to have line                                        the total.
                                                                                                                                 are concentrated from just a handful of
 ministries as key implementing actors than
                                                                            Most recipients of reconstruction funds              donors. The top five account for 66.7% of all
 is the case for humanitarian pooled funding.
                                                                            receive far more pooled financing                    funding, ranging from 86.3% of Indonesia’s
 Seven large reconstruction funds have                                      through these funds than through their               reconstruction fund to only 37.2% of
 been set up to date, four to support post-                                 humanitarian counterparts. Only Sudan                Palestine’s. The latter has received major
 conflict recovery (Afghanistan, Sudan,                                     and Pakistan have received significant               contributions from Norway (US$202.4
 Palestine/OPT and Iraq) and two after                                      proportions of pooled humanitarian                   million), Kuwait (US$186.9 million) and
 natural disasters (Haiti and Indonesia).                                   finances, largely due to the fact that they          Australia (US$62.5 million).
 Pakistan’s fund was originally mandated                                    are two of the few countries with large
                                                                                                                                 Afghanistan’s reconstruction fund
 to rehabilitate areas affected by clashes                                  common humanitarian funds. Sudan
                                                                                                                                 is characterised by considerable
 between government and Taliban forces in                                   has received more than US$741 million
                                                                                                                                 donor concentration. Of the top five
 the Swat valley, but after massive floods in                               in this way and US$653 million for its
                                                                                                                                 reconstruction fund donors, only the
 2010, which occurred in many of the areas                                  reconstruction fund, with more than
                                                                                                                                 EU spends less than 25% of its total in
 also previously affected by conflict, it now                               US$424 million of the latter allocated
                                                                                                                                 Afghanistan; the US spends a substantial
 takes funds for flood reconstruction.                                      to South Sudan.
                                                                                                                                 86.7% in that country.


 FiGuRe 16: top Five donoRs to tHe mAJoR ReConstRuCtion Funds, 2006–2010


                   Netherlands                                                                                                                                    US$203.9


                             Canada                                                                                                                          US$375.2


                                  EU                                                                                                                              US$185.5


              United States                                                                                                                         US$711.7


United Kingdom                                                                                                                                                    5US$91.7

                                   0%                                                                                                                                      100%
                                                                                                                                   Indonesia     Iraq    Pakistan       Sudan
                                                                                                                                   Palestine     Afghanistan            Haiti

 Note: Figures on graph are for funding to Afghanistan’s reconstruction fund. Source: Development Initiatives based on UNDP
 Multi-Donor Trust Fund Office Gateway, Haiti Reconstruction Fund website and World Bank. Partial 2010 for Sudan MDTF


                                                                                                                                                                            81
FiGuRe 17: key Flows to top 20 ReCipients oF totAl oFFiCiAl HumAnitARiAn AssistAnCe, 2005-2009


500
                                                                                                 Total official humanitarian assistance
450

400

350

300

250

200

150                                                                                               Total official humanitarian assistance
                                                                                                  Other ODA
100                                                                                               Peacekeeping
                                                                                                  Domestic revenue
 50
                                                                                                  Remittances
     0                                                                                            Foreign Direct Investment
            2005               2006               2007              2008             2009


Source: Development Initiatives based on World Bank, IMF, OECD DAC and SIPRI


domestiC ResouRCes

Though the flows of aid and the various           US$90 billion in 2009. Yet in per capita
tools available to donors are important,          terms it raises significantly less than do
financing from foreign governments                five other countries: Lebanon, Iraq, Jordan,
is often less significant than might be           Angola and Serbia. For Iraq and Angola
expected, even in the most crisis-affected        revenues are driven by oil production,
contexts. Governments, communities                while Lebanon, Jordan and Serbia are
and individuals often have considerable           countries with relatively sophisticated and
resources available (including but not            well-developed economies, whose need for
limited to finance) that can be used to           humanitarian assistance is driven largely
address both humanitarian need and                by issues peripheral to the economy.
underlying vulnerability.                         Over the decade Serbian assistance was
                                                  spent largely in the UN-administered
domestiC Revenues
                                                  Kosovo province, while most of that going
Of the major humanitarian recipients,             to Jordan and Lebanon, even taking into
the domestic revenues of some stand               account the occasional conflict in the
out. Indonesia’s large population in part         latter, is largely accounted for by support
accounts for its large revenue of nearly          to housing refugees.


82
FiGuRe 18: GoveRnment Revenue volumes FoR mAJoR ReCipients oF totAl oFFiCiAl HumAnitARiAn AssistAnCe


                          2005        2006        2007         2008        2009       peR CApitA
                                                                                         2009
Afghanistan                0.4         0.6         0.7         0.8         1.3             46
Angola                    12.4        21.0        27.7         42.8        23.3          1,256
Burundi                    0.2         0.2         0.2         0.2         0.2             30
Chad                       0.4         0.9         1.6         2.2         1.1            102
dRC                        0.8         1.1         1.5         2.1         1.9             28
ethiopia                   1.8         2.2         2.5         3.2         3.9             47
indonesia                 53.4        72.9        82.5        107.6        87.8           382
iraq                      24.9        33.6        45.0         66.4        44.8          1,453
Jordan                     3.6         4.4         5.0         5.6         5.9            930
kenya                      4.0         4.7         6.0         6.6         6.7            168
lebanon                    4.9         5.0         5.7         6.9         8.4           1,986
liberia                    0.1         0.1         0.2         0.2         0.2             59
pakistan                  15.1        18.0        21.5         23.9        23.5           130
serbia                    10.0        12.1        16.3         19.5        16.4          1,650
sri lanka                  3.0         4.2         4.8         5.4         5.4            267
sudan                      6.3         7.5         9.3         12.4        8.3            195
uganda                     1.1         1.2         1.5         1.8         2.0             60                Increase above 20%
                                                                                                             Increase
zimbabwe                   0.9         0.5         0.2         0.1         0.9             74                Decrease in domestic revenue


Note: The countries are ranked top to bottom by volume of humanitarian assistance over the past ten years.
Source: Development Initiatives based on IMF (Regional Economic Outlooks) and UN DESA


Perhaps unsurprisingly, in all but two of           This came to an end for the most part
the countries receiving less government             in 2009, when nine out of 18 countries
revenue than Indonesia in 2009, conflict has        for which we have data suffered a fall
inhibited and often continues to significantly      in government revenue. The decline in
inhibit national development. Even Sudan’s          revenues was massive for some, with oil
oil industry can raise its domestic revenues        producers suffering in particular, due not
only to US$195 per capita.                          only to the falling demand for oil but also
                                                    to the crash in price: oil prices fell from a
Over the past five years the trend has
                                                    ten-year high of US$106.30 a barrel in July
been relatively uniform, with government
                                                    2008 (the monthly average) to US$33.10
revenues in most countries increasing
                                                    in December 2008. Government revenues
steadily from 2004 to 2008 (with only
                                                    in Angola fell by nearly US$20 billion from
Zimbabwe standing out as a consistently
                                                    2008 to 2009 (a 45.7% drop) and other
poor performer). Some countries saw
                                                    countries were similarly affected (Chad
remarkable increases in revenues
                                                    with a 40.3% fall, Iraq with 31.9% and
during this period, with Angola and Chad
                                                    Sudan with 32%).
averaging growth of 51.7% and 63.6%
respectively from 2006 to 2008, and Liberia
growth of 40%.


                                                                                                                                            83
FoReiGn diReCt investment (Fdi)                    of all FDI to the 20 major humanitarian
                                                     recipients in 2009, but saw a drop of 21%                                tHe impoRtAnCe
  The flow of foreign investment to major                                                                                     oF domestiC Revenue
                                                     from its 2008 level of US$16.5 billion.
  humanitarian recipients has risen
                                                     Indonesia and Pakistan saw huge declines                                 Domestic revenue, the money
  significantly over the decade, with values
                                                     of 47.7% and 56.1% respectively, with                                    raised by nation states, includes
  increasing more than ten-fold from 2000
                                                     volumes of US$4.4 billion and US$3.1                                     direct taxation and trade tariffs,
  to 2008, including a significant rise in 2008
                                                     billion. Meanwhile, other countries saw                                  and is essential to the effective
  itself. Although the economic downturn
                                                     an increase, such as 97.5% for Chad and                                  running of the state. It provides the
  has affected global FDI levels considerably,
                                                     89% for Liberia (admittedly rising from low                              necessary funds for the delivery of
  trends for major humanitarian recipients
                                                     overall volumes).                                                        basic services, the improvement of
  have been surprisingly robust; despite a
  decrease in global FDI from 2007 to 2008,          RemittAnCes                                                              infrastructure and the development
  FDI for the major humanitarian recipients                                                                                   of adequate response systems when
                                                     The picture for remittances to major                                     crisis does occur.
  has continued to rise. Furthermore, the
                                                     humanitarian recipients for 2000–9 was
  fall between 2008 and 2009 for this group                                                                                   The OECD suggests that the
                                                     dominated by four countries, in each case
  was less dramatic than the global picture                                                                                   minimum percentage of domestic
                                                     with volumes that far exceeded their levels
  would indicate, with the top humanitarian                                                                                   revenue required for effective state
                                                     of international humanitarian assistance
  recipients experiencing a fall of 26.1%                                                                                     operating is 15% of GDP, while the
                                                     and even total ODA over that period: Serbia
  compared with a 36% decrease in overall                                                                                     UN calculates that in order to achieve
                                                     (US$37 billion), Pakistan (US$45 billion),
  global levels.                                                                                                              the Millennium Development Goals
                                                     Indonesia (US$37 billion) and Lebanon
  Individual countries performed quite               (US$47 billion).                                                         (MDGs) low-income countries may be
  differently within the overall trend. Angola,                                                                               required to raise their revenues as a
                                                     In Lebanon, remittances are a major                                      percentage of GDP by four points.
  which received a massive US$72.8 billion
                                                     contributor to the economy, accounting for
  in inward investment over the decade,                                                                                       The core group of major humanitarian
                                                     a 22% share of GDP over the decade, which
  accounted for US$13.1 billion or 35.2%                                                                                      recipients have performed
                                                     puts the country in the top ten worldwide
                                                                                                                              relatively well, according to the
                                                                                                                              OECD benchmark. Of the countries
                                                                                                                              considered, only six have seen
                                                                                                                              revenues lower than 15%: Pakistan,
                                                                                                                              Uganda, Sri Lanka, Ethiopia,
                                                                                                                              Zimbabwe and Afghanistan. Of these,
                                                                                                                              the latter two have had domestic
                                                                                                                              revenues lower than 10% of GDP in at
                                                                                                                              least three of the past five years.


  FiGuRe19: Fdi tRends in tHe top HumAnitARiAn AssistAnCe ReCipient CountRies


              60                                                                             2100                             Uganda
                                                  WORLD TREND                                                                 Iraq
                                                                                                                              DRC
              50
                                                                                             1600                             Serbia
                                                                                                                              Jordan
                                                                                                    US$ BILLION WORLD TREND


              40                                                                                                              Sudan
US$ BILLION


                                                                                             1100                             Pakistan
                                                                                                                              Lebanon
              30
                                                                                                                              Indonesia
                                                                                             600                              Angola
              20                                                                                                              World trend

                                                                                             100
              10


              0                                                                              -400
               2000   2001   2002   2003   2004    2005     2006     2007    2008     2009


  Note: Data for Indonesia available from 2003. Source: Development Initiatives based on UNCTAD

 84
on this measure. In 2009 the remittance
inflow of US$7.5 billion was equivalent to            soCiAl pRoteCtion                                                   • In an effort to help small-scale
nearly US$1,800 per person and only just                                                                                    farmers, the Kenyan government
                                                      Governments take various measures
below the combined totals of the 12 other                                                                                   subsidizes fertilizer used during the
                                                      to prevent or respond to crises, and
countries for which we have data. However,                                                                                  planting season. The Bangladesh
                                                      although it is not always easy to
for countries such as Burundi, Uganda,                                                                                      government, in response to the rise
                                                      understand the provenance of resources,
Ethiopia and Liberia, remittances are not a                                                                                 in fuel prices, provides a subsidy to
                                                      they represent significant investments in
major inward flow, representing less than                                                                                   farmers in the form of a cash transfer,
                                                      people. These are examples of some of
5% of GDP and in each of these cases less                                                                                   with the aims of having a positive
                                                      the measures governments have taken:
than US$21 per person per year.                                                                                             impact on agricultural output and
                                                      • After the Indian Ocean tsunami, some                                protecting the marginal and small
Nevertheless, remittance trends for 2009                                                                                    farmers.
                                                        national governments implemented
were more positive than those of both
                                                        cash transfer programmes. The Sri
domestic revenue and inward investment,                                                                                   • The Dominican Republic is setting up
                                                        Lankan government provided US$1,515
with overall flows increasing (if only                                                                                      a Natural Disaster Insurance Facility
                                                        in compensation for deaths, US$25 for
slightly, by 4.7%). This compares favorably                                                                                 with support from the Inter-American
                                                        household items, US$50 in emergency
with a decrease in overall global figures,                                                                                  Development Bank (IDB) to help reduce
                                                        resettlement allowances, US$8.50 a
which saw a 6% fall from 2008 to 2009.                                                                                      the country’s fiscal vulnerability related
                                                        month for approximately 12 months
                                                                                                                            to natural disasters. The policy will
                                                        and four unconditional transfers
                                                                                                                            provide coverage of the extraordinary
                                                        of US$198 per household. The
                                                                                                                            public expenditures for up to US$50
                                                        government also provided cash grants
                                                                                                                            million that could be incurred during
                                                        for people with damaged and destroyed
                                                                                                                            emergencies due to seismic activity.
                                                        houses. Similarly, after the earthquake
                                                        in West Sumatra 2009, the Indonesian                              Ref: Harvey, P., 2007. Cash-based
                                                        government provided compensation for                              responses in emergencies.
                                                        people with destroyed houses.                                     Humanitarian Policy Group.


FiGuRe 20: RemittAnCes: tRends in tHe top ReCipient CountRies oF totAl oFFiCiAl HumAnitARiAn AssistAnCe


              50                                                                          450                                 Other top humanitarian recipients
                                                                                                                              Uganda
              45                                                                          400
                                                      WORLD TREND                                                             Palestine/OPT
              40                                                                          350                                 Kenya
                                                                                                US$ BILLION WORLD TREND


              35                                                                                                              Sudan
                                                                                          300
                                                                                                                              Sri Lanka
              30
US$ BILLION


                                                                                          250                                 Jordan
              25                                                                                                              Serbia
                                                                                          200                                 Indonesia
              20
                                                                                                                              Pakistan
                                                                                          150
              15                                                                                                              Lebanon
                                                                                          100                                 World trend
              10

               5                                                                          50

               0                                                                          0
               2000   2001   2002   2003   2004   2005    2006      2007   2008    2009


Source: Development Initiatives based on World Bank

                                                                                                                                                                         85
HumAnitARiAn Aid RemAins impoRtAnt, in Context

The existence of significant volumes of              national resources of affected countries
domestic resources should not detract                came under pressure. However, the
from the importance of humanitarian                  balance of resources in crisis-affected
assistance. There remain specific reasons            states is mixed.
why humanitarian assistance is an
                                                     Throughout all these major crises in which
absolutely appropriate tool for intervening
                                                     these various methods and tools are used,
in crisis situations, especially in cases
                                                     humanitarian assistance remains the
where responsible nation-states are
                                                     ‘junior partner’ to development assistance
either a party to conflict or their ability to
                                                     in terms of volume, but there is equal
govern is severely affected by a sudden and
                                                     consistency in where it is spent. The bulk of
damaging natural disaster. There are also
                                                     humanitarian assistance is spent year after
enduring questions about how developing
                                                     year in the same set of conflict and post-
nations (especially those which are
                                                     conflict countries.
commodity-rich) translate their domestic
revenues into dealing with crises when they          There has been an increasing focus on
occur and, equally importantly, tackling the         tackling insecurity through investments
underlying risks.                                    in governance, security and peacekeeping
                                                     (including the development of many
Donor funding in crisis-affected countries
                                                     new financing tools) and funding levels
has remained robust, despite the economic
                                                     continue to rise annually. However, there
downturn, and investments in development
                                                     is little evidence to date to show that many
aid, as well as in peacekeeping, have
                                                     countries have graduated to peace and
increased throughout the period when
                                                     reconstruction.


FiGuRe 21: mAJoR Flows oF Funds to lARGest HumAnitARiAn ReCipients oveR ten yeARs, 2009 (us$ Billion)


                                                                             US$ BILLION
                 0                      20                    40                  60                 80                  100            120
Palestine/OPT               1.2
        Sudan                                1.3                                                              Total official
                                                                                                              humanitarian assistance
     Sri Lanka               0.2

        Serbia                                 0.0
      Pakistan                                               0.5

       Liberia       0.0
      Lebanon                                  0.2

        Kenya                0.4

       Jordan                     0.1

     Indonesia                                                                                                                 0.3
      Ethiopia              0.7

      Burundi        0.1


                                                                                                     Other ODA
                                                                                                     Domestic revenues
                                                                                                     Remittances
                                                                                                     FDI
                                                                                                     Peacekeeping
                                                                                                     Total official humanitarian aid


Source: Development Initiatives based on World Bank, IMF, OECD DAC and SIPRI

86
Spending on DRR has been negligible in the                                                        characterised by insecurity and continual
       countries where the bulk of humanitarian                                                          vulnerability, it makes no sense to treat
       assistance is spent, despite the fact that                                                        these funding flows separately. For
       those countries are in particular need                                                            the affected individuals, the particular
       of additional external response and                                                               provenance of resources, whether national
       investments in systems and infrastructure.                                                        or international, carries no importance
       Yet many of the same conflict-affected                                                            in itself. Those individuals need change.
       countries that receive huge and continuing                                                        In order to target resources efficiently to
       volumes of humanitarian assistance are                                                            address vulnerability, and in order to make
       prone to substantial natural disasters,                                                           the changes required by beneficiaries,
       especially drought. Humanitarian                                                                  decision makers need to have clear
       assistance represents a vital flow of funds                                                       visibility of all funding flows, with all
       for people trapped in unstable, conflict-                                                         the right tools and mechanisms at their
       affected environments where vulnerability                                                         disposal and a transparent view of all
       to climate-related crises is high and                                                             resources allocated. Are the right choices
       where poverty underpins vulnerability.                                                            being made?
       The need for humanitarian aid to remain
       independent, neutral and based on need
       alone is paramount.
       There is an important and difficult
       challenge here, for in a sense these
       comparisons miss the point. From the
       perspective of people whose lives are


       FiGuRe 22: CompARison oF AveRAGe totAl oFFiCiAl HumAnitARiAn AssistAnCe AlonGside
       GoveRnment Revenues, 2005–2009
US$ TOTAL OFFICIAL HUMANITARIAN AID


                                      70                                                                                                                                                                                   1600

                                      60                                                                                                                                                                                   1400
                                                                                                                                                                                                                           1200

                                                                                                                                                                                                                                  US$-REVENUES
                                      50
                                                                                                                                                                                                                           1000
                                      40
                                                                                                                                                                                                                           800
                                      30
                                                                                                                                                                                                                           600
                                      20
                                                                                                                                                                                                                           400
                                      10                                                                                                                                                                                   200
                                      0                                                                                                                                                                                    0
                                           Lebanon


                                                     Sudan


                                                             Liberia


                                                                       Jordan

                                                                                Zimbabwe


                                                                                           Afghanistan


                                                                                                           Chad


                                                                                                                   Iraq

                                                                                                                          Burundi

                                                                                                                                    Sri Lanka


                                                                                                                                                DRC

                                                                                                                                                      Ethiopia


                                                                                                                                                                 Uganda


                                                                                                                                                                          Kenya


                                                                                                                                                                                  Serbia


                                                                                                                                                                                           Angola


                                                                                                                                                                                                    Pakistan


                                                                                                                                                                                                               Indonesia


                                                                                                                                                                          Total official humanitarian assistance
                                                                                                                                                                          per capita, average 2005-2009
                                                                                                                                                                          Domestic revenues per capita, 2005-2009


       Source: Development Initiatives based on OECD DAC, IMF and UN

                                                                                                                                                                                                                                  87
THE STORY
Humanitarian aid has represented over 60% of the official development assistance       CREDIT

(ODA) flows to Sudan since 2000, but it remains just one element of financing that     © Jenn Warren / WfWi
could assist people living in situations of insecurity and vulnerability. This photo
shows a woman irrigating her crops at the Women for Women International Pacong
Community Farm, Lakes State, South Sudan. The farm supports vegetable farming,
an aviary honey project, livestock and poultry.


88
dAtA
& Guides


           89
90
                                                      GLOBAL HUMANITARIAN ASSISTANCE

                 INTERNATIONAL HUMANITARIAN                                                                                                                OTHER INTERNATIONAL
                                                                                                 DOMESTIC RESPONSE
                          RESPONSE                                                                                                                             RESOURCES


                                                     PRIVATE                  NATIONAL                  NATIONAL                                                                NON-ODA
                   GOVERNMENTS                                                                                                       PEOPLE              OTHER ODA
                                                  CONTRIBUTIONS             GOVERNMENTS               INSTITUTIONS                                                              ELIGIBLE


                                                        Private                  Ministries           National and local             Diaspora           Sector allocable       Military
         OECD DAC                                                                                                                                                           humanitarian aid
                                OTHERS               contributions                                          NGOs                                         ODA, such as
         MEMBERS                                   reported to annual         Disaster funds                                       Communities          governance and
                                                  reports from NGOs,                                   Red Cross and                                                          Peacekeeping
                                                                                                                                                            security           assistance
                                                   UN and Red Cross         Local government            Red Crescent               General public
                                                       2009-2010                                      national societies                                  Source: OECD
       23 OECD DAC          Non-OECD DAC                                     Domestic military                                       Affected                                 Other foreign
                                                                                                                                                            DAC stats
     governments and          members                   Private                                                                    communities                                 assistance
                                                                                                      Community-based
      EU institutions                                contributions            Sources: Ministry of
                                                                                                        organisations
                           Voluntary reporting    reported to the FTS       Finance, DADs and funds
                                                                                                                               Quantitative data                           Sources: SIPRI, UN OCHA
     Obligatory annual                                2009-2010                                                                 very difficult to                              FTS, direct from
     reporting to public   FTS captures what                                                            Faith-based                                                        governments and various
                                                                                                        organisations              capture
         database           donors report as                                                                                                                                  secondary sources
                                                    2009-2010 not
                            humanitarian aid         comparable                                        Private sector         Source: Remittance data
      Account for 70%                               between years                                                                from World Bank
      of international      Not comparable
                                                                                                      Other civil society
       humanitarian         between donors
                                                  Sources: Annual reports
     response figure in         or years            and UN OCHA FTS                                   Sources: Direct from
            2009                                                                                       organisations and
                           87 donors in 2009,                                                           annual reports
     Totals allocable by      127 in 2010
     country and region,
       OECD DAC data       Sources: UN OCHA FTS
      comprises 96% of      and OECD DAC stats                                                                 KEY: HOW ROBUST IS THE SOURCE?
     our data 2000-2009
                                                                                                                     Very Robust           Moderately          Not Very           Not at all
           Source:
        OECD DAC stats
key deFinitions, ConCepts And metHodoloGy

HumAnitARiAn Aid
‘Humanitarian aid’ is aid and action designed to save lives, alleviate suffering and maintain
and protect human dignity during and in the aftermath of emergencies. The characteristics
that mark it out from other forms of foreign assistance and development aid are that:
• it is intended to be governed by the principles of humanity, neutrality,
  impartiality and independence
• it is intended to be short-term in nature and provide for activities in the immediate
  aftermath of a disaster. In practice it is often difficult to say where ‘during and in the
  immediate aftermath of emergencies’ ends and other types of assistance begin,
  especially in situations of prolonged vulnerability.
Traditional responses to humanitarian crises, and the easiest to categorise as such,
are those that fall under the aegis of ‘emergency response’:
• material relief assistance and services (shelter, water, medicines etc.)
• emergency food aid (short-term distribution and supplementary feeding programmes)
• relief coordination, protection and support services (coordination,
  logistics and communications).
Humanitarian aid can also include reconstruction and rehabilitation (repairing pre-existing
infrastructure as opposed to longer-term activities designed to improve the level of
infrastructure) and disaster prevention and preparedness (disaster risk reduction (DRR),
early warning systems, contingency stocks and planning). Under the Organisation for
Economic Cooperation and Development (OECD) Development Assistance Committee
(DAC) reporting criteria, humanitarian aid has very clear cut-off points – for example,
‘disaster preparedness’ excludes longer-term work such as prevention of floods or conflicts.
‘Reconstruction relief and rehabilitation’ includes repairing pre-existing infrastructure but
excludes longer-term activities designed to improve the level of infrastructure.
Humanitarian aid is given by governments, individuals, NGOs, multilateral organisations,
domestic organisations and private companies. Some differentiate their humanitarian
assistance from development or other foreign assistance, but they draw the line in different
places and according to different criteria. We report what others themselves report as
‘humanitarian’ assistance but try to consistently label and source this.
GloBAl HumAnitARiAn AssistAnCe
The term ‘global humanitarian assistance’ is used within the context of the Global
Humanitarian Assistance (GHA) programme to mean:
• international humanitarian response (i.e. humanitarian aid from governments
  and private contributions)
• domestic response (provided by governments in response to crises
  inside their own countries)
• other types of assistance that go to people in humanitarian crises which fall outside
  that captured in the data on ‘international’ or ‘domestic’ humanitarian response
  (e.g. peacekeeping and other official development assistance (ODA) activities such
  as governance and security).
inteRnAtionAl HumAnitARiAn Aid
International humanitarian aid (sometimes referred to in this report as ‘international
humanitarian response’) is used to describe the contributions of:
• international governments
                                                                                                note: For OECD DAC donors, we
• individuals, private foundations, trusts, private companies and corporations.
                                                                                                make an adjustment to the DAC-
HumAnitARiAn Aid FRom GoveRnments                                                               reported humanitarian aid figure
Our definition of government funding for humanitarian crises comprises:                         so that it takes account of each
                                                                                                donor’s multilateral (core and totally
• the humanitarian aid expenditure of the 24 OECD DAC members – Australia, Austria,             unearmarked) ODA contributions
  Belgium, Canada, Denmark, Finland, France, Germany, Greece, Ireland, Italy, Japan,            to the United Nations High
  Korea, Luxembourg, the Netherlands, New Zealand, Norway, Portugal, Spain, Sweden,             Commissioner for Refugees (UNHCR),
  Switzerland, the United Kingdom, the United States and the European institutions – as         the UN Relief and Works Agency
  reported to the OECD DAC as part of an annual obligation to report on ODA flows               for Palestine Refugees in the Near
• expenditure by ‘other governments’ as captured by the United Nations Office                   East (UNRWA) and the World Food
  for the Coordination of Humanitarian Affairs (UN OCHA) Financial Tracking Service (FTS).      Programme (WFP) – see ‘total official
Our labelling of ‘governments’ is driven by the way in which they report their expenditure      humanitarian aid’ below. In this
(see ‘Data Sources’ section). ‘Other governments’ are sometimes referred to as ‘non-OECD        report, figures are in constant 2009
DAC members’, ‘non-DAC donors’, ‘non-traditional donors’, ‘emerging donors’ or                  prices, unless otherwise stated.
‘south–south development partners’. (See Note)
                                                                                                                                         91
pRivAte ContRiButions
Private contributions are those from individuals, private foundations, trusts, private
companies and corporations.
In our ‘Where does the funding come from?’ section (Chapter 1), private contributions are
those raised by humanitarian organisations, including NGOs, the UN and the International
Red Cross and Red Crescent Movement. Data for the period 2006–2008 was collated
directly from the sample of organisations and complemented by figures from annual
reports. The study-set for this period included five UN agencies (UNHCR, UNRWA, WFP,
the Food and Agriculture Organization (FAO) and the United Nations Children’s Fund
(UNICEF)), 48 non-governmental organisations (NGOs), the International Committee of the
Red Cross (ICRC) and the International Federation of Red Cross and Red Crescent Societies
(IFRC). Data for 2009 and 2010 was extrapolated from the 2008 figure, using a coefficient of
increase/decrease based on the analysis of annual reports, as well as private contributions
reported to the FTS.
In the ‘Where does the funding go?’ and ‘How does the funding get there?’ sections
(Chapter 1), the data is taken from UN OCHA’s FTS (a disaggregation of NGO, Foundations
and Red Cross/Crescent reporting in the FTS plus private contributions from individuals
and the private sector).
totAl oFFiCiAl HumAnitARiAn AssistAnCe
Total official humanitarian assistance is a sub-set of ODA. In this report, we use it when
making comparisons with other development assistance. It takes account of humanitarian
expenditure through NGOs, multilateral UN agencies and funds, public-private
partnerships and public sector agencies – and, in order to take account of multilateral
ODA contributions to UN agencies with almost uniquely humanitarian mandates, we
make the following calculations:
• humanitarian aid as reported in DAC1 Official and Private Flows,
  Memo: Humanitarian Aid
                                                                                               notes: (1) All of our humanitarian
• total ODA disbursements to UNHCR, UNRWA and WFP,
                                                                                               aid categories include money spent
  as recipients, reported in DAC2a ODA disbursements:
                                                                                               through humanitarian financing
 • we do not include all ODA to WFP but apply a percentage in order to take                    mechanisms such as the Central
   into account the fact that WFP also has a ‘developmental’ mandate                           Emergency Response Fund (CERF)
 • humanitarian aid reported to UNICEF, the United Nations Population Fund                     and country-level pooled funds.
   (UNFPA), the United Nations Development Programme (UNDP) and ‘Other                         Where necessary, we impute amounts
   UN’ in DAC2a tables is also included in our calculation (see Notes).                        spent through the CERF in specific
                                                                                               countries back to the donor (for
disAsteR Risk ReduCtion (dRR)
                                                                                               example, if Norway contributed
Investments in DRR can be tracked using the OECD DAC’s Creditor Reporting System               10% of CERF funding in 2009 and
(CRS) by extracting data from the humanitarian purpose code ‘disaster prevention and           the CERF allocated US$10 million
preparedness’ (74010). However, accounting for DRR measures that are sub-components            to Afghanistan, US$1 million would
of projects and do not fall within the allocated codes is challenging. We used short and       be added on to Norway’s other
long project descriptions to search for DRR activities within development and humanitarian     humanitarian expenditure on projects
programmes (not coded 74010).                                                                  in Afghanistan).
                                                                                               (2) The European institutions function
The search terms were selected from recent literature on DRR and the websites of key
                                                                                               both as a donor agency and as a
DRR-focused organisations (e.g. United Nations International Strategy for Disaster
                                                                                               multilateral recipient of EU member
Reduction (UNISDR)). After each term search, the project descriptions were scanned and
                                                                                               state funds. They provide direct donor
those not related to DRR were removed, e.g. results for ‘prevention’ brought up projects
                                                                                               support to developing countries as
with a DRR focus such as flood prevention, but also included HIV/AIDS prevention.
                                                                                               well as playing a federating role with
otHeR inteRnAtionAl ResouRCes                                                                  EU member states. We treat the EU
                                                                                               institutions as a single donor within
oFFiCiAl development AssistAnCe (odA)
                                                                                               our DAC donor analyses. However,
ODA is a grant or loan from an ‘official’ source to a developing country (defined by the       totally unearmarked (‘multilateral’)
OECD) or multilateral agency (defined by the OECD) for the promotion of economic               ODA to the EU institutions is a core
development and welfare. It is reported by members of the DAC, along with several other        component of some donors’ overall
government donors and institutions, according to strict criteria each year. It includes        ODA/humanitarian aid contributions –
sustainable and poverty-reducing development assistance (for sectors such as governance        so we calculate the EC’s humanitarian
and security, growth, social services, education, health and water and sanitation.             aid (including its own unearmarked
                                                                                               multilateral ODA to UNHCR, UNRWA
In this report we express our total ODA figures net of debt relief unless expressly
                                                                                               and WFP as a donor) and apportion a
stated otherwise.
                                                                                               share of this to each DAC EU member
                                                                                               state – Austria, Belgium, Denmark,
                                                                                               Finland, France, Germany, Greece,
                                                                                               Ireland, Italy, Luxembourg, the
                                                                                               Netherlands, Portugal, Spain,
                                                                                               Sweden and the United Kingdom.


92
GoveRnAnCe And seCuRity odA
Within the OECD DAC CRS, ‘Government and Civil Society’ includes two groupings
of activities. This is sub-divided into two further discrete groups of activities.
• The first grouping, the government and civil society set of activities, is primarily
  concerned with building the capacity of recipient country governments – in areas
  including public sector policy, finance management, legislatures and judiciaries –
  as well as a range of thematic activities including support to elections, democratic
  participation, media and free flow of information, human rights and women’s equality.
  In 2010 anti-corruption and support to legislatures and political parties were added to
  the list of activities in this grouping.
• The second grouping is concerned with conflict prevention and resolution, peace
  and security and includes activities supporting security system management and
  reform, removal of landmines and other explosive remnants of war, demobilisation of
  child soldiers, reintegration of demobilised military personnel, small arms and light
  weapons (SALW) control, civilian peacebuilding and some elements of bilateral support
  for multilateral peacekeeping operations (excluding direct contributions to the UN
  Department of Peacekeeping Operations (DPKO) budget).
FoReiGn AssistAnCe
Our figures for the foreign assistance of China, India, Brazil, Russia and South Africa
(BRICS) are a conservative estimate based on secondary sources, which include those
in the following list.
• China: Deborah Brautigam’s the dragon’s Gift: the Real story of China in Africa, which
  references data from the China statistical yearbook (National Bureau of Statistics of
  China) and China Eximbank. These aid figures are the sum of official external assistance
  and Eximbank concessional loans. All figures are exclusive of debt relief.
• india: Figures are taken from the Indian Ministry of Economic Affairs’ (MEA) annual
  reports and converted from financial years into calendar years. Foreign assistance
  disbursed by other ministries has not been captured.
• Brazil: Figures are taken from the report ‘Brazilian International Development
  Cooperation 2005–2009’ published in 2010 by the Institute of Applied Economic
  Research (IPEA) and the Brazilian Cooperation Agency (ABC).
• Russia: Time-series data for aid that Russia disburses is not publicly available. In 2007
  the Russian government, in its preparatory concept note on Russian participation in
  international development assistance, estimated that total development assistance was
  US$212 million. A Russian Federation statement at the DAC senior-level meeting in April
  2010 reported 2008 development assistance as totalling US$200 million. Sources include
  OECD DAC and the Ministry of Finance in Russia.
• south Africa: Figures are taken from the Ministry of Foreign Affairs’ (MFA) budget
  report and converted from financial years into calendar years. Figures are not inclusive
  of development assistance disbursed by other ministries, which are reported to be
  between six and seven times the volumes reported by the MFA.

otHeR deFinitions And ClAssiFiCAtions
domestiC Response
This includes the actions taken in response to humanitarian crises, to transfer resources
to those most affected within an affected country, by domestic institutions (both informal
and formal) and individuals either living there or temporarily resident elsewhere.
ConFliCt-AFFeCted CountRies
A set of conflict-affected states was identified for each of the years between 1999 and 2009
using the Uppsala Conflict Data Program (UCDP)’s database to determine the incidence
of active conflict in a given year. This incorporated cases where state actors were involved
as well as those where no state actor was involved, but where more than 25 battle deaths
resulted. Where a multilateral peacekeeping mission has been present (excluding purely
civilian missions), with no recurrence of violence for up to seven consecutive years, a
country is deemed to be ‘post-conflict’.
lonG-teRm HumAnitARiAn AssistAnCe CountRies (ltHACs)
Long-term humanitarian assistance countries are defined as those receiving a greater
than average (10.4%) proportion of ODA, excluding debt relief, in the form of humanitarian
assistance for more than eight years between 1995 and 2009. Twenty-six countries are
classified as receiving long-term humanitarian assistance; in 2009 they received US$7
billion of the US$10.1 billion from all donors reporting to the DAC.


                                                                                               93
dAtA souRCes

oeCd dAC
• OECD DAC data allows us to say how much humanitarian aid donors reporting to the
  OECD Development Co-operation Directorate (DCD) give, where they spend it, who they
  spend it through and how it relates to their other ODA.
• Aggregate information is published in OECD DAC Statistical Tables.
• Detailed, project-level reporting is published in the Creditor Reporting System (CRS).
• The data in this report was downloaded on 6 April 2011. Data for 2010 is preliminary and
  partial – full final data for the year (which will provide us with data on recipient countries
  and a breakdown of activities in 2010, as well as enabling us to publish a non-estimated
  humanitarian aid figure for DAC donors) will not be published until December 2011.
• Some additional governments and donors voluntarily report to the OECD DAC. Together
  with OECD DAC members, the contributions that they report are used within our ‘all
  donors reporting to the OECD DAC’ figures in Chapter 3,’ Beyond the divide: Humanitarian
  assistance in context’.
un oCHA Fts
• We use UN OCHA FTS data to report on humanitarian expenditure of governments that
  do not report to the OECD DAC and to analyse expenditure relating to the UN consolidated         note: UN OCHA FTS and OECD DAC
  appeals process (CAP). We have also used it in the ‘Where does it go?’ and ‘How does it          data are not comparable.
  get there?’ sections of the report (Chapter 1) to analyse private contributions and money
  spent through NGOs, the Red Cross and Red Crescent Movement or a UN agency.
• As well as being the custodian of data relating to UN CAP appeals, UN OCHA FTS
  receives data from donor governments and recipient agencies and also gathers
  information on specific pledges carried in the media or on donor websites,
  or quoted in pledging conferences.
• Data for 2000–2010 was downloaded on 5 April 2011.

un CeRF weBsite
Our data on the CERF is taken from the UN CERF website. Data up to the end of 2010
was downloaded on 1 February 2011.
CRed em-dAt disAsteR dAtABAse
The Centre for Research on the Epidemiology of Disasters (CRED) is a leading repository
of information on the impact of disasters. One of CRED’s core data projects is the EM-DAT
disaster database, which contains data on the impact of 16,000 mass disaster events dating
back to 1900. Data is sourced from UN agencies, NGOs, insurance companies, research
institutes and press agencies. We use this data to generate analysis of the incidence and
impact of natural disasters in developing countries.
stoCkHolm inteRnAtionAl peACe ReseARCH institute (sipRi)
SIPRI is an independent international institute dedicated to research into conflict, armaments,
arms control and disarmament. SIPRI manages publicly accessible databases on:
• multilateral peace operations – UN and non-UN peace operations since 2000,
  including location, dates of deployment and operation, mandates, participating
  countries, number of personnel, costs and fatalities.
• military expenditure of 172 countries since 1988, allowing comparison of countries’
  military spending: in local currency, at current prices; in US dollars, at constant
  prices and exchange rates; and as a share of GDP.
• transfers of major conventional arms since 1950.
• arms embargoes implemented by international organisations
  or groups of nations since 1998.
We use this data to track international expenditure on multilateral peacekeeping operations.
uppsAlA ConFliCt dAtA pRoGRAm (uCdp)
UCDP has been recording data on ongoing violent conflicts since the 1970s. Its definition
of armed conflict – ‘a contested incompatibility that concerns government and/or territory
where the use of armed force between two parties, of which at least one is the government
of a state, results in at least 25 battle-related deaths in one calendar year’ – is becoming a
standard in how conflicts are systematically defined and studied. It has been operating an
online database on armed conflicts and organised violence since 2004.
inteRnAtionAl monetARy Fund (imF)
We downloaded data from the International Monetary Fund’s (IMF) World Economic Outlook
(WEO) database in April 2011 and used its gross domestic product (GDP) for DAC donors and

94
gross national income (GNI) for non-DAC donors to measure economic performance. We also
used IMF Regional Economic Outlook (REO) survey data, which shows additional information                Further details and guides to our
on specific countries and indicators, such as dependence on commodities and oil exports. We             methodology and classifications
use this data mainly to analyse government revenues (excluding grants); when this information           can be found in the Data & Guides
was missing, calculations have been made (subtracting ODA flows from general government                 section of our website:
revenues data downloaded from the IMF WEO, to avoid double-counting grants).
                                                                                                        http://www.globalhumanitarian
woRld BAnk                                                                                              assistance.org
The World Bank data catalogue includes different datasets such as remittance inflows
and outflows. The Global Economic Monitor (GEM) provides prices and indices relating
to food, energy and other commodities, which are fundamental in understanding
fluctuations and trends.
Data from the World Bank’s online reports is also used for the multi-donor trust funds (MDTFs)
that it manages. These include the Afghanistan Reconstruction Trust Fund (ARTF), Iraq’s MDTF,
the Palestinian Recovery and Development Plan MDTF, Pakistan’s MDTF, South Sudan’s MDTF
and the Sudan National MDTF, as well as the State and Peacebuilding Fund (SPF).
un depARtment oF eConomiC And soCiAl AFFAiRs (un desA)
Our per citizen/per capita/per person analyses use UN DESA’s population data.
The data was downloaded in November 2010.
united nAtions development pRoGRAmme (undp) multi-donoR
tRust Fund (mdtF) oFFiCe GAtewAy
The UNDP’s MDTF office database holds information on UN-managed pooled funds.
We use this to collate data on the UN Peacekeeping Fund and the UN-managed Iraq MDTF.
united nAtions ConFeRenCe on tRAde And development (unCtAd)
UNCTAD is the United Nations body focusing on trade. Its online database provides statistics
on trade flows and foreign direct investments (FDI).
ouR own ReseARCH
Our analysis on the sources of income for Red Cross and Red Crescent National Societies
(see box in Section 1.3), was derived from data obtained directly from six national societies in
response to a request from us. The societies were Denmark, the United Kingdom, Belgium,
Canada, Sweden and France.
Data on private contributions in Section 1.1 for the period 2006–2008 was collated directly
from the sample of organisations and complemented by figures from annual reports. The
study-set for this period included five UN agencies (UNHCR, UNRWA, WFP, FAO and UNICEF),
48 NGOs, ICRC and IFRC. Data for 2009 and 2010 was extrapolated from the 2008 figure, using
a coefficient of increase/decrease based on the analysis of annual reports, as well as private
contributions reported to the FTS.


  dAtA And tHe inteRnAtionAl Aid tRAnspARenCy initiAtive (iAti)
  At every stage in humanitarian response, decisions are made             intended to encompass all resource flows and the IATI standard
  about where, how and when to spend money. These decisions               was agreed in a way that ensures it can be used by a variety
  determine the type of organisations that are supported, the             of donors and aid organisations, including those working in
  type of assistance that is delivered, the type of needs that are        humanitarian contexts.
  prioritised and, consequently, whether peoples’ needs are met.
                                                                          With an agreement on what data items to publish, and
  Good information can help people to make informed choices. It
                                                                          a common format for the data, IATI is now working with
  can tell us how money is channelled through the system. And it
                                                                          participating donors, philanthropic foundations and CSOs to
  can help gauge the efficiency and effectiveness of the response.
                                                                          start publishing data that is compliant with the agreed standard.
  Tracking the humanitarian dollar through the system is currently
                                                                          Three organisations (the United Kingdom’s Department for
  hindered by the lack of a central repository of information and
                                                                          International Development (DFID), the Hewlett Foundation
  the absence of a feedback loop that enables the people affected
                                                                          and the World Bank) have started publishing their aid data in
  by crises to say what they have received and when. Without this
                                                                          a more comparable, timely and accessible format. A further
  feedback or aggregated data on what commodities and services
                                                                          six organisations have committed to do so before the Fourth
  have been delivered, the effectiveness and efficiency of the
                                                                          High Level Forum on Aid Effectiveness in November 2011. The
  humanitarian response is hard to measure.
                                                                          first NGOs are expected to publish their data between June
  In February 2011, a multi-stakeholder group of donors, aid              and August 2011. It is hoped that this coverage will provide a
  recipient country governments and civil society organisations           more comprehensive picture of aid and other resource flows to
  (CSOs) agreed on a final International Aid Transparency Initiative      recipient countries. IATI has also held initial conversations with
  (IATI) standard for the publication of information about aid. While     humanitarian organisations to understand how the standard
  initial publishers are mainly focused on development aid, IATI is       could best be utilised in the humanitarian sector.


                                                                                                                                               95
ACRonyms And ABBReviAtions

ABC         Agência Brasileira de Cooperação (Brazilian Cooperation Agency)
ARtF        Afghanistan Reconstruction Trust Fund
BRiCs       Brazil, Russia, India, China and South Africa
CAp         Consolidated appeals process (UN)
CAR         Central African Republic
CeRF        Central Emergency Response Fund
CHAp        Common Humanitarian Action Plan
CHF         Common humanitarian fund – a country-level pooled fund mechanism
CpA         Comprehensive Peace Agreement (Sudan)
CRed        Centre for Epidemiology of Disasters
CRs         Creditor Reporting System (DAC)
Cso         Civil society organisation
dAC         Development Assistance Committee
dCd         Development Co-operation Directorate (OECD)
deC         Disasters Emergency Committee
dFid        Department for International Development (UK)
dod         Department of Defense (US)
dpko        UN Department of Peacekeeping Operations
dpRk        Democratic People’s Republic of Korea
dRC         Democratic Republic of Congo
dRR         Disaster risk reduction
eC          European Commission
eCHo        EC Directorate General for Humanitarian Aid and Civil Protection
em-dAt      Emergency Events Database
eRF         Emergency response fund – a country-level pooled funding mechanism
eu          European Union
FAo         Food and Agriculture Organization of the United Nations
Fdi         Foreign direct investment
Fts         Financial Tracking Service (UN OCHA)
Gdp         Gross domestic product
Gem         Global Economic Monitor (World Bank)
GHA         Global Humanitarian Assistance (the programme)
GHd         Good Humanitarian Donorship
GnA         Global Needs Assessment (EC tool)
Gni         Gross national income
iAsC nAtF   Inter-Agency Standing Committee Needs Assessment Taskforce
iAti        International Aid Transparency Initiative
iCRC        International Committee of the Red Cross
idp         Internally displaced person
iFRC        International Federation of Red Cross and Red Crescent Societies
ifs         Instrument for Stability (EC)
imF         International Monetary Fund
inGo        International non-governmental organisation
ipeA        Institute of Applied Economic Research


96
ldC       Least developed country
liC       Low-income country
lmiC      Lower middle-income country
lnGo      Local non-governmental organisation
ltHAC     Long-term humanitarian assistance country
mCdA      Military and civil defence assets
mdG       Millennium Development Goal
mdtF      Multi-donor trust fund
miRA      Multi-Cluster Initial Rapid Assessment
nGo       Non-governmental organisation
nRdF      National Disaster Response Fund (India)
odA       Official development assistance
oeCd      Organisation for Economic Cooperation and Development
opt       Occupied Palestinian Territories
pRt       Provincial Reconstruction Team (Spain)
Reo       Regional Economic Outlook (IMF)
sAlw      Small arms and light weapons
sdRF      State Disaster Response Fund (India)
sipRi     Stockholm International Peace Research Institute
spF       State and Peacebuilding Fund (World Bank)
uAe       United Arab Emirates
uCdp      Uppsala Conflict Data Program
umiC      Upper middle-income country
un        United Nations
unCtAd    United Nations Conference on Trade and Development
un desA   United Nations Department of Economic and Social Affairs
undp      United Nations Development Programme
unFpA     United Nations Population Fund
unHCR     United Nations High Commissioner for Refugees
uniCeF    United Nations Children’s Fund
unisdR    United Nations International Strategy for Disaster Reduction
un oCHA   United Nations Office for the Coordination of Humanitarian Affairs
unRwA     UN Relief and Works Agency for Palestine Refugees in the Near East
wB        World Bank
weo       World Economic Outlook (IMF)
wFp       World Food Programme


                                                                               97
98
     FiGuRe 1: un ConsolidAted AppeAls pRoCess (CAp) AppeAls, 2000–2010


      Fts AppeAl summARy, 2000-2010
      us$ Billion                                2000         2001        2002    2003    2004    2005    2006    2007    2008    2009    2010

      Revised requirement                        1.9          2.6         4.4     5.2     3.4     6.0     5.2     5.1     7.1     9.8     11.3

      Funding                                    1.1          1.4         3.0     4.0     2.2     4.0     3.5     3.7     5.1     6.9     7.1
                                                                                                                                                  ReFeRenCe tABles


      Unmet need                                 0.8          1.1         1.4     1.3     1.2     2.0     1.7     1.4     2.0     2.8     4.2

      % needs met                                59.2%        55.4%       67.5%   75.8%   64.3%   67.2%   66.5%   72.2%   71.7%   71.2%   63.0%

      Number of appeals in year                  14           18          24      27      31      25      24      30      23      23      19


      ConsolidAted AppeAls
      us$ Billion                                2000         2001        2002    2003    2004    2005    2006    2007    2008    2009    2010

      Revised requirement                        1.9          2.6         4.4     5.2     3.0     3.8     4.9     4.8     6.3     9.5     7.7

      Funding                                    1.1          1.4         3.0     3.9     2.0     2.3     3.2     3.5     4.5     6.8     4.6

      Unmet need                                 0.8          1.1         1.4     1.2     0.9     1.5     1.7     1.3     1.8     2.7     3.1

      % needs met                                59.2%        55.4%       67.5%   76.0%   68.0%   59.3%   65.3%   73.3%   71.9%   71.8%   59.8%

      Number of consolidated appeals in year     14           18          24      25      22      15      17      15      13      15      15


      FlAsH AppeAls
      us$ Billion                                2000         2001        2002    2003    2004    2005    2006    2007    2008    2009    2010

      Revised requirement                        0            0           0       0.03    0.5     2.2     0.3     0.4     0.8     0.3     3.6

      Funding                                    0            0           0       0.02    0.2     1.8     0.3     0.2     0.6     0.1     2.5

      Unmet need                                 0            0           0       0.02    0.3     0.4     0.0     0.2     0.2     0.1     1.1

      % needs met                                                                 50.7%   39.8%   81.0%   85.3%   57.2%   70.8%   51.6%   70.0%

      Number of flash appeals in year            0            0           0       2       9       10      7       15      10      8       4

     Source: OECD DAC, UN OCHA FTS and UN CERF
FiGuRe 2: top 20 ReCipients oF inteRnAtionAl HumAnitARiAn Aid 2000-2009 (us$ million)

                                                                                                                                                                             5 yeARs         10 yeARs
     2000               2001              2002             2003            2004              2005            2006            2007            2008            2009            05-’09          00-’09
     Serbia             Palestine/OPT     Afghanistan      Iraq            Iraq              Sudan           Sudan           Sudan           Sudan           Sudan           sudan           sudan
     721                1,009             967              1,276           1,056             1,391           1,384           1,345           1,458           1,422           6,999           8,873
     States Ex-         Afghanistan       Palestine/OPT    Ethiopia        Sudan             Indonesia       Palestine/OPT   Palestine/OPT   Ethiopia        Palestine/OPT   palestine/opt   palestine/opt
     Yugoslavia 290     561               467              804             941               870             796             857             886             1,303           4,316           7,182
     Palestine/OPT      Serbia            Angola           Afghanistan     Palestine/OPT     Pakistan        Lebanon         DRC             Palestine/OPT   Ethiopia        ethiopia        iraq
     273                309               279              488             654               721             536             414             863             692             2,881           5,121
     Ethiopia           Ethiopia          Sudan            Palestine/OPT   Ethiopia          Iraq            Indonesia       Lebanon         Afghanistan     Afghanistan     Afghanistan     Afghanistan
     230                215               262              464             439               696             524             363             860             634             2,482           5,094
     Mozambique         DRC               DRC              Sudan           Afghanistan       Ethiopia        Pakistan        Iraq            Somalia         Somalia         iraq            ethiopia
     169                187               262              361             431               658             451             363             604             573             2,325           4,801
     Afghanistan        Iraq              Ethiopia         Angola          DRC               Sri Lanka       DRC             Afghanistan     DRC             DRC             dRC             dRC
     166                178               232              317             287               544             435             317             529             567             2,252           3,341
     Angola             Sudan             Sierra Leone     DRC             Angola            Palestine/OPT   Iraq            Ethiopia        Myanmar         Pakistan        pakistan        somalia
     159                175               178              257             218               498             423             300             466             486             2,106           2,569
     Timor-Leste        India             States Ex-       Eritrea         Liberia           Afghanistan     Afghanistan     Bangladesh      Iraq            Iraq            indonesia       pakistan
     142                158               Yugoslavia 153   177             175               320             349             285             376             468             2,036           2,417
     Iraq               Bosnia-           DPRK             Burundi         Uganda            DRC             Ethiopia        Somalia         Zimbabwe        Kenya           somalia         indonesia
     140                Herzegovina 154   149              151             165               307             345             273             334             400             1,969           2,356
     Sudan              Angola            Iraq             Uganda          Burundi           Zimbabwe        Somalia         Pakistan        China           Zimbabwe        lebanon         lebanon
     134                148               146              146             164               214             324             252             310             393             1,453           1,880
     Bosnia-            Sierra Leone      Somalia          Jordan          Somalia           Somalia         Kenya           Indonesia       Kenya           Chad            sri lanka       kenya
     Herzegovina 120    143               130              136             156               195             248             238             305             322             1,400           1,658
     Jordan             States Ex-        Jordan           Somalia         Serbia            Eritrea         Uganda          Uganda          Chad            Indonesia       kenya           sri lanka
     119                Yugoslavia137     123              135             137               188             228             225             250             268             1,232           1,627
     DRC                Jordan            Tanzania         Sierra Leone    Iran              Uganda          Sri Lanka       Sri Lanka       Lebanon         Sri Lanka       zimbabwe        serbia
     96                 125               110              129             137               181             161             211             249             238             1,217           1,544
     Tanzania           Mozambique        Serbia           Serbia          DPRK              Burundi         Burundi         Kenya           Sri Lanka       Syria           uganda          uganda
     89                 125               108              128             133               171             151             193             246             193             1,025           1,510
     India              Tanzania          Burundi          Tanzania        Eritrea           Liberia         Liberia         Chad            Uganda          Lebanon         Chad            zimbabwe
     80                 116               104              124             122               146             148             186             238             192             996             1,478
     Somalia            DPRK              Kenya            DPRK            Jordan            India           Jordan          Zimbabwe        Haiti           Uganda          myanmar         Angola
     80                 100               95               120             109               130             116             163             212             152             740             1,343
     Lebanon            Somalia           Lebanon          Liberia         Chad              Chad            Zimbabwe        Jordan          Pakistan        Myanmar         Jordan          Jordan
     78                 99                90               106             105               128             115             120             196             151             659             1,272
     Kenya              Kenya             Eritrea          Zimbabwe        Bangladesh        Angola          Chad            Colombia        Jordan          Jordan          Burundi         Burundi
     75                 89                86               93              94                120             109             110             154             150             602             1,157
      Indonesia         Lebanon            Zimbabwe        Lebanon         Lebanon           Jordan          Colombia        Burundi         Yemen           Haiti           Bangladesh      Chad
      74                87                 85              81              91                119             102             109             138             145             576             1,135
      Eritrea           El Salvador        Uganda          Kenya           Kenya             Lebanon         Niger           Liberia         Indonesia       Georgia         liberia         liberia
      73                86                 80              77              90                112             76              108             136             143             551             944


99
     Source: OECD DAC, UN OCHA FTS and UN CERF
100
      FiGuRe 3: top 30 donoRs oF inteRnAtionAl HumAnitARiAn Aid, 2000-2009 (us$ million)


                                                                                                                                                                    pReliminARy* 5 yeARs            10 yeARs
      2000            2001            2002            2003           2004           2005            2006            2007            2008            2009            2010            05-’09          00-’09
      united states   united states   united states   united states united states   united states   united states   united states   united states   united states   united          united states   united states
      1,876           1,996           2,030           3,448         2,812           3,718           3,208           3,087           4,421           4,376           states*         18,810          30,971
                                                                                                                                                                    4,806

      eu              eu              eu              eu             eu             eu              eu              eu              eu              eu              eu              eu              eu
      institutions    institutions    institutions    institutions   institutions   institutions    institutions    institutions    institutions    institutions    institutions*   institutions    institutions
      1,149           1,183           1,067           1,109          1,427          1,850           1,848           1,660           1,959           1,613           1,604           8,930           14,864

      united          saudi Arabia    united          united      Japan             Japan           united          united          united          united          united       united             united
      kingdom 688     657             kingdom 719     kingdom 850 914               885             kingdom         kingdom 753     kingdom 895     kingdom         kingdom* 951 kingdom 4,583      kingdom
                                                                                                    1,054                                           1,024                                           8,183

      netherlands     Germany         Germany         Germany        united         united          Germany         Germany         Germany         Germany         Germany*        Germany         Germany
      566             579             582             506            kingdom 772    kingdom 858     832             659             743             727             685             3,783           6,527

      Germany         united          netherlands     norway         Germany        Germany         netherlands     netherlands     spain           spain           Japan*          netherlands     netherlands
      517             kingdom 570     390             364            559            822             649             545             614             632             537             2,963           5,094

      sweden          netherlands     italy           sweden         netherlands    netherlands     sweden          sweden          netherlands     sweden          spain*          sweden          sweden
      403             421             362             362            436            650             502             479             612             573             501             2,559           4,385

      Japan           sweden          Japan           netherlands    France         norway          France          norway          saudi Arabia    netherlands     Canada*         spain           Japan
      387             419             355             318            360            497             464             425             566             508             452             2,332           4,026

      italy           norway          sweden          italy          italy          sweden          norway          spain           sweden          France          sweden*         France          norway
      358             319             335             280            333            466             387             394             539             406             393             2,123           3,681

      norway          italy           norway          France         sweden         France          spain           France          France          Canada          France*         norway          France
      302             311             332             280            307            424             372             391             439             396             374             2,077           3,597

      switzerland     France          France          Japan          norway         italy           italy           italy           italy           norway          norway*         italy           italy
      242             303             294             276            286            387             371             372             416             375             339             1,908           3,552

      France          switzerland     switzerland     Canada         spain          spain           Canada          Canada          norway          italy           netherlands* Japan              spain
      237             224             227             220            219            320             327             317             393             362             297          1,869              3,223

      denmark         Japan           Australia       switzerland    switzerland    denmark         denmark         denmark         Canada          uAe             Australia*      Canada          Canada
      199             224             225             210            215            307             297             266             380             353             266             1,666           2,640

      Canada          Canada          Canada          spain          Canada         switzerland     Japan           ireland         Japan           Australia       saudi Arabia    denmark         denmark
      176             192             187             207            198            260             240             227             302             324             256             1,400           2,278

      Australia       denmark         denmark         Australia      denmark        Australia       switzerland     switzerland     Australia       Japan           Belgium*        Australia       switzerland
      168             191             153             181            160            254             240             223             291             298             235             1,258           2,224

      spain           spain           spain           denmark        Australia      Canada          Australia       saudi Arabia    denmark         denmark         italy*          switzerland     Australia
      162             167             136             175            153            247             227             212             288             242             232             1,105           2,132
FiGuRe 3: top 30 donoRs oF inteRnAtionAl HumAnitARiAn Aid 2000-2009 (us$ million) – Continued

                                                                                                                                                                                     pReliminARy* 5 yeARs                10 yeARs
      2000              2001                2002              2003            2004              2005             2006            2007              2008             2009             2010             05-’09             00-’09
      Belgium           Australia           Belgium           Belgium         Belgium           Belgium          Belgium         Belgium           ireland          Belgium          switzerland*     saudi Arabia       saudi Arabia
      101               146                 95                95              131               158              180             167               221              202              161              1,103              1,894

      Finland           Belgium             Finland           Finland         uAe               Finland          Finland         Australia         Belgium          switzerland      Finland*         Belgium            Belgium
      79                100                 88                87              101               140              147             162               218              186              123              924                1,446

       ireland          Finland             ireland           saudi Arabia    Finland           saudi Arabia     ireland         Finland           switzerland      Finland          denmark*         ireland            Finland
       61               84                  51                58              81                112              131             150               195              151              110              830                1,148

       Greece           ireland             Greece            ireland         ireland           ireland          saudi Arabia Japan                Finland          ireland          ireland*         Finland            ireland
       38               59                  35                57              68                109              131          144                  141              142              109              729                1,127

       Austria          Greece              luxembourg        Austria         Austria           uAe              Austria         Austria           uAe              saudi Arabia     Austria*         uAe                uAe
       38               34                  30                34              43                100              68              57                110              82               62               651                755

       luxembourg       luxembourg          saudi Arabia      Greece          portugal          turkey           Greece          luxembourg        kuwait           Austria          turkey           Austria            Austria
       25               33                  29                33              41                79               57              49                96               77               61               374                548

       portugal         Austria             Austria           luxembourg      Greece            Austria          luxembourg Greece                 Austria          luxembourg       luxembourg* Greece                  Greece
       22               33                  26                30              40                78               53         48                     94               59               52          265                     445

       saudi Arabia     portugal            south Africa      kuwait          luxembourg        China            uAe             uAe               Greece           Greece           Russia            luxembourg        luxembourg
       12               23                  20                28              38                66               44              45                54               50               38                250               405

       new zealand      korea               portugal          Russia          saudi Arabia      Greece           portugal        new zealand       luxembourg       kuwait           Greece*           kuwait            portugal
       7                15                  19                17              35                57               33              36                52               34               38                178               272

       China            new zealand         Russia            portugal        new zealand       new zealand      new zealand portugal              Russia           Russia           uAe               new zealand       new zealand
       6                7                   18                17              20                55               27          23                    44               32               38                174               234

       turkey           taiwan (province new zealand          Qatar           Russia            Qatar            kuwait          korea, Rep        new zealand      new zealand      China             portugal          kuwait
       3                of China) 1      11                   15              17                46               24              15                29               27               38                150               221

       korea, Rep       Qatar               india             new zealand korea, Rep            portugal         korea, Rep      turkey            thailand         portugal         india             Russia            Russian
       2                1                   7                 15          14                    42               21              11                27               25               37                120               Federation
                                                                                                                                                                                                                         175

       Romania          China               korea, Rep        india           kuwait            luxembourg       Russia          kuwait            portugal         korea, Rep       Brazil            turkey            korea, Rep
       2                1                   5                 13              11                37               20              11                27               19               29                116               146

       Russia           Russia              Algeria           south Africa    turkey            kyrgyzstan       south Africa    China             korea, Rep       Qatar            portugal*         korea, Rep        turkey
       2                1                   5                 9               10                27               16              7                 24               13               22                104               134

       south Africa     south Africa        turkey            korea, Rep      south Africa      india            turkey          Czech             kazakhstan       india            new zealand* China                  China
       2                0                   4                 5               5                 25               11              Republic 4        10               11               19           83                     94

      Note: Data for members of the OECD DAC, 2000-2009, includes their core ODA to UNHCR, UNRWA and WFP (as well as core ODA to EU institutions for EU15 members). It is expressed in constant 2009 prices. *Data for 2010 is partial and
      preliminary. It does not include the core ODA elements. Data for other donors is taken from UN OCHA FTS and is in current prices. All figures include contributions through the UN’s Central Emergency Response Fund (CERF) and pooled
      funding mechanisms. Source: Development Initiatives based on OECD DAC and UN OCHA FTS


101
FiGuRe 4: top 20 ReCipients oF totAl oFFiCiAl HumAnitARiAn AssistAnCe (us$ million, ConstAnt 2009 pRiCes)


102
                                                                                                                                                                               5 yeARs         10 yeARs
       2000               2001                2002             2003            2004            2005            2006            2007            2008            2009            05-’09          00-’09
       Serbia             Afghanistan         Afghanistan      Iraq            Iraq            Sudan           Sudan           Sudan           Sudan           Sudan           sudan           sudan
       721                562                 856              1,140           1,077           1,376           1,363           1,314           1,371           1,305           6,729           8,495
       States Ex-         Palestine/OPT       Palestine/OPT    Ethiopia        Sudan           Indonesia       Palestine/OPT   Palestine/OPT   Afghanistan     Palestine/OPT   palestine/opt   palestine/opt
       Yugoslavia 290     363                 465              804             845             740             805             858             850             1,188           4,101           6,229
       Palestine/OPT      Serbia              Angola           Afghanistan     Palestine/OPT   Iraq            Indonesia       DRC             Ethiopia        Ethiopia        ethiopia        iraq
       273                309                 276              486             564             668             507             416             832             681             2,814           5,031
       Ethiopia           Ethiopia            Sudan            Palestine/OPT   Ethiopia        Ethiopia        Pakistan        Iraq            Palestine/OPT   Afghanistan     Afghanistan     Afghanistan
       229                213                 261              462             439             656             448             376             773             578             2,418           4,914
       Afghanistan        DRC                 DRC              Sudan           Afghanistan     Pakistan        DRC             Lebanon         Somalia         DRC             iraq            ethiopia
       164                187                 261              358             429             533             436             338             552             561             2,349           4,731
       Mozambique         Iraq                Ethiopia         Angola          DRC             Palestine/OPT   Iraq            Afghanistan     DRC             Pakistan        dRC             dRC
       160                178                 232              311             287             478             433             318             528             544             2,247           3,333
       Angola             Sudan               Sierra Leone     DRC             Angola          Sri Lanka       Lebanon         Ethiopia        Iraq            Somalia         pakistan        somalia
       158                172                 177              256             215             400             418             302             382             528             1,944           2,452
       Timor-Leste        India               States Ex-       Eritrea         Liberia         Afghanistan     Afghanistan     Somalia         Myanmar         Iraq            indonesia       pakistan
       142                154                 Yugoslavia 154   175             172             320             352             267             350             491             1,874           2,247
       Iraq               Bosnia-             DPRK             Burundi         Uganda          DRC             Ethiopia        Pakistan        Zimbabwe        Kenya           somalia         indonesia
       140                Herzegovina 154     148              150             165             307             343             244             328             395             1,857           2,196
       Sudan              Angola              Iraq             Uganda          Burundi         Zimbabwe        Somalia         Indonesia       Kenya           Zimbabwe        lebanon         lebanon
       130                145                 147              145             163             213             319             237             300             390             1,309           1,736
       Bosnia-            Sierra Leone        Somalia          Jordan          Somalia         Somalia         Kenya           Uganda          Lebanon         Chad            sri lanka       kenya
       Herzegovina 120    141                 129              136             154             190             243             225             249             318             1,245           1,641
       Jordan             States Ex-          Jordan           Somalia         Serbia          Eritrea         Uganda          Sri Lanka       Sri Lanka       Indonesia       kenya           serbia
       119                Yugoslavia 137      123              134             133             188             228             210             242             257             1,216           1,539
       DRC                Jordan              Tanzania         Serbia          DPRK            Uganda          Sri Lanka       Kenya           Chad            Sri Lanka       zimbabwe        uganda
       95                 126                 110              128             124             180             162             194             239             231             1,208           1,504
       Tanzania           Mozambique          Serbia           Sierra Leone    Iran            Burundi         Burundi         Chad            Uganda          Lebanon         uganda          sri lanka
       89                 125                 109              128             124             170             151             182             235             192             1,019           1,466
       India              Tanzania            Burundi          Tanzania        Eritrea         Liberia         Liberia         Zimbabwe        Haiti           Uganda          Chad            zimbabwe
       80                 115                 104              124             121             145             148             163             201             152             970             1,465
       Somalia            Somalia             Kenya            Liberia         Jordan          Chad            Jordan          Jordan          Pakistan        Jordan          Jordan          Angola
       80                 98                  95               104             109             123             116             121             174             150             652             1,328
       Lebanon            Kenya               Lebanon          Zimbabwe        Chad            Angola          Zimbabwe        Bangladesh      Jordan          Haiti           myanmar         Jordan
       78                 88                  90               93              97              120             114             115             147             147             620             1,265
       Kenya              Lebanon             Eritrea          DPRK            Bangladesh      Jordan          Chad            Colombia        Bangladesh      Myanmar         Burundi         Burundi
       75                 87                  86               90              94              119             107             110             138             146             605             1,158
       Indonesia          El Salvador         Zimbabwe         Lebanon         Lebanon         Lebanon         Colombia        Burundi         Indonesia       Georgia         Haiti           Chad
       74                 85                  83               81              91              112             102             108             133             143             538             1,100
       Eritrea            Guinea              Uganda           Kenya           Kenya           Colombia        India           Liberia         Syria           Syria           liberia         liberia
       73                 83                  80               77              90              95              75              108             105             111             533             923

      Source: Development Initiatives based on OECD DAC
FiGuRe 5: top 20 ReCipients oF totAl odA, exCludinG deBt RelieF (us$ million, ConstAnt 2009 pRiCes)

                                                                                                                                                                            5 yeARs         10 yeARs
       2000                 2001                    2002               2003           2004          2005          2006          2007            2008          2009          05-’09          00-’09
       China                India                   Pakistan           Iraq           Iraq          Iraq          Iraq          Iraq            Afghanistan   Afghanistan   iraq            iraq
       2,271                2,493                   2,661              2,730          5,141         8,892         5,872         4,469           4,753         6,234         25,272          33,681
       Vietnam              Pakistan                India              Vietnam        Afghanistan   Afghanistan   Afghanistan   Afghanistan     Iraq          Ethiopia      Afghanistan     Afghanistan
       2,108                2,481                   2,388              2,243          2,649         3,149         3,199         3,960           3,247         3,814         21,295          28,736
       Indonesia            Serbia                  China              Tanzania       Vietnam       Indonesia     Pakistan      Vietnam         Ethiopia      Vietnam       ethiopia        vietnam
       1,960                2,215                   2,055              2,097          2,125         2,309         2,337         2,681           3,216         3,737         13,737          23,641
       Serbia               China                   Afghanistan        Afghanistan    Ethiopia      Vietnam       Sudan         Ethiopia        Vietnam       Palestine     vietnam         ethiopia
       1,938                2,199                   1,864              2,011          1,951         2,181         2,222         2,572           2,528         /OPT 3,026    13,220          22,209

       India                Vietnam                 Vietnam            Ethiopia       China         Ethiopia      Vietnam       Pakistan        Palestine     Tanzania      sudan           tanzania
       1,837                2,101                   1,844              1,989          1,951         2,119         2,093         2,259           /OPT 2,485    2,920         11,010          19,046
       Bangladesh           Indonesia               Ethiopia           China          Tanzania      China         Ethiopia      Tanzania        Sudan         Iraq          tanzania        pakistan
       1,491                1,909                   1,833              1,672          1,906         2,078         2,017         2,190           2,320         2,791         10,952          18,609
       Egypt                Ethiopia                Mozambique         Bangladesh     Pakistan      Sudan         Tanzania      Sudan           Tanzania      Pakistan      pakistan        China
       1,474                1,662                   1,765              1,632          1,591         2,047         1,934         2,134           2,231         2,774         10,667          17,793
       Mozambique           Egypt                   Indonesia          Jordan         Bangladesh    India         Uganda        Palestine/OPT   India         India         palestine/opt   india
       1,372                1,417                   1,581              1,464          1,578         2,032         1,627         1,933           2,069         2,502         10,358          17,752
       Tanzania             Bangladesh              DRC                Serbia         Egypt         Pakistan      Mozambique    Mozambique      Bangladesh    Sudan         india           palestine
       1,286                1,392                   1,546              1,461          1,521         1,825         1,626         1,800           1,972         2,287         9,422           /opt 16,558
       Uganda               Palestine/OPT           Tanzania           Indonesia      Mozambique    Tanzania      Palestine     Uganda          Mozambique    DRC           mozambique      mozambique
       1,117                1,364                   1,458              1,410          1,460         1,677         /OPT 1,625    1,745           1,907         2,207         8,829           16,083
       Ethiopia             Tanzania                Egypt              Mozambique     Uganda        Mozambique    India         China           Uganda        Mozambique    uganda          Bangladesh
       1,036                1,347                   1,387              1,346          1,406         1,482         1,479         1,585           1,591         2,013         8,097           14,624
       Bosnia-Herzegovina Mozambique                Palestine/OPT      Uganda         Serbia        Bangladesh    China         Bangladesh      DRC           Uganda        dRC             uganda
       1,005              1,311                     1,301              1,261          1,363         1,460         1,454         1,483           1,578         1,785         7,681           14,154
       Palestine/OPT        Uganda                  States Ex-         Palestine      Palestine     DRC           DRC           India           Pakistan      Kenya         China           sudan
       961                  1,255                   Yugoslavia 1,165   /OPT 1,257     /OPT 1,317    1,443         1,321         1,340           1,473         1,776         7,645           14,015
       Zambia               Bosnia                  Zambia             Bolivia        DRC           Uganda        Indonesia     Kenya           China         Nigeria       Bangladesh      indonesia
       909                  -Herzegovina 1,024      1,108              1,160          1,221         1,349         1,299         1,314           1,396         1,659         7,439           13,624
       Ghana                Ghana                   Bangladesh         Ghana          Ghana         Sri Lanka     Bangladesh    Nigeria         Kenya         Ghana         indonesia       serbia
       843                  979                     1,091              1,157          1,217         1,305         1,299         1,170           1,322         1,573         6,598           12,414
       Nicaragua            Bolivia                 Uganda             Egypt          Sudan         Palestine     Ghana         Ghana           Ghana         Turkey        Ghana           dRC
       817                  971                     1,018              992            1,148         /OPT 1,289    1,238         1,165           1,251         1,362         6,436           11,864
       Thailand             Honduras                Serbia             Colombia       Bolivia       Ghana         Morocco       DRC             Nigeria       Zambia        kenya           Ghana
       761                  930                     1,000              959            914           1,209         1,215         1,131           1,186         1,258         6,203           11,513
       South Africa         Nicaragua               Bolivia            Philippines    Morocco       Serbia        Colombia      Morocco         Egypt         Bangladesh    nigeria         egypt
       759                  837                     890                883            914           1,011         1,092         1,130           1,151         1,226         5,424           11,390
       Philippines          Zambia                  Ghana              Sri Lanka      Zambia        Zambia        Serbia        Burkina Faso    Indonesia     China         morocco         kenya
       738                  797                     882                844            904           938           1,004         986             1,133         1,132         5,134           9,515
       Jordan               Philippines             Bosnia             South Africa   Madagascar    Egypt         Kenya         Lebanon         Turkey        Haiti         zambia          zambia
       724                  783                     -Herzegovina 847   833            882           923           965           971             1,119         1,098         5,098           9,470


103
      Source: Development Initiatives based on OECD DAC
104
      FiGuRe 6:top 20 donoRs oF totAl oFFiCiAl development AssistAnCe (odA), exCludinG deBt RelieF (us$ million, ConstAnt 2009 pRiCes)
                                                                                                                                                                                          5 yeARs           10 yeARs          pReliminARy
       2000             2001              2002              2003              2004              2005              2006              2007              2008              2009              05-’09            00-’09            2010
      Japan             United States     United States     United States     United States     United States     United States     United States     United States     United States     United States     united states     united states
      13,662            13,700            15,224            17,298            22,124            26,127            23,191            22,360            26,459            28,654            126,792           207,294           29,852
      United States     Japan             Japan             EU institutions   EU institutions   EU institutions   EU institutions   EU institutions   EU institutions   EU institutions   EU institutions   eu institutions   eu institutions
      12,154            11,192            10,948            9,867             10,688            11,308            11,985            12,191            12,739            13,285            61,509            110,984           13,546
      EU institutions   EU institutions   EU institutions   Japan             Japan             Japan             Japan             Germany           Germany           Germany           Germany           Japan             France
      8,897             10,842            9,180             9,438             9,567             9,835             9,626             9,817             11,148            11,982            49,591            99,872            13,523
      Germany           Germany           Germany           Germany           France            France            Germany           France            France            United            Japan             united            united
      8,046             8,222             7,345             7,234             8,247             7,944             8,902             8,756             9,595             Kingdom           45,063            kingdom           kingdom
                                                                                                                                                                        11,240                              88,668            13,475
      France            France            France            United            Germany           Germany        United               United            United            France            France            Germany           Germany
      6,510             6,800             6,975             Kingdom           8,230             7,742          Kingdom              Kingdom           Kingdom           9,702             44,150            78,680            13,272
                                                            6,880                                              8,174                7,968             9,586
      United            Netherlands       United            France            United            United Kingdom France               Japan             Japan             Japan             United            France            Japan
      Kingdom           5,628             Kingdom           5,996             Kingdom           6,914          8,153                7,557             8,630             9,415             Kingdom           74,324            10,574
      5,695                               5,380                               6,868                                                                                                       43,882
      Netherlands    United               Netherlands       Netherlands       Netherlands       Netherlands       Netherlands       Netherlands       Netherlands       Spain             Netherlands       netherlands       netherlands
      5,587          Kingdom              5,022             5,005             4,849             5,661             5,935             6,062             6,621             6,488             30,662            56,754            6,570
                     5,616
      Denmark        Italy                Arab Countries    Arab Countries    Canada            Italy             Spain             Spain             Spain             Netherlands       Spain             spain             spain
      3,049          3,066                3,633             3,218             3,210             4,190             3,896             5,132             6,338             6,382             25,001            38,900            6,197
      Canada         Denmark              Norway            Norway            Norway            Canada            Sweden            Sweden            Arab Countries    Sweden            Sweden            sweden            Canada
      2,751          2,980                2,980             3,092             3,006             3,783             3,827             3,979             5,118             4,528              20,115           33,706            4,509
      Sweden         Spain                Spain             Spain             Spain             Sweden            Canada            Canada            Canada            Norway            Canada            Canada            norway
      2,548          2,7373               2,962             2,791             2,978             3,562             3,576             3,898             4,291             4,070             19,500            33,515            4,233
      Norway         Norway               Italy             Canada            Italy             Norway            Norway            Italy             Sweden            Canada            Norway            norway            sweden
      2,443          2,615                2,940             2,731             2,940             3,361             3,227             3,631             4,219             3,952             17,732            31,870            4,225
      Spain          Sweden               Sweden            Sweden            Sweden            Spain             Denmark           Norway            Italy             Arab Countries    Italy             italy             italy
      2,430          2,604                2,912             2,646             2,879             3,147             2,503             3,617             3,916             3,355             17,294            31,044            3,248
      Italy          Canada               Canada            Italy             Denmark           Denmark           Italy             Denmark           Norway            Italy             Arab Countries    Arab Countries    Belgium
      2,206          2,479                2,844             2,597             2,518             2,526             2,433             2,584             3,458             3,123             13,997            26,769            3,109
      Australia      Australia            Denmark           Denmark           Arab Countries    Australia         Arab Countries    Australia         Denmark           Denmark           Denmark           denmark           Australia
      1,839          1,757                2,726             2,448             2,205             1,991             2,415             2,370             2,628             2,806             13,047            24,112            3,096
      Switzerland    Switzerland          Australia         Australia         Switzerland       Switzerland       Australia         Belgium           Australia         Australia         Australia         Australia         denmark
      1,535          1,551                1,842             1,856             1,897             1,912             2,127             1,852             2,565             2,759             11,813            20,988            2,931
      Belgium        Belgium              Belgium           Switzerland       Australia         Belgium           Switzerland       Switzerland       Belgium           Belgium           Belgium           Belgium           switzerland
      1,427          1,493                1,545             1,705             1,879             1,804             1,886             1,844             2,231             2,505             10,240            17,919            2,205
      Austria        Austria              Switzerland       Belgium           Belgium           Arab Countries    Belgium           Arab Countries    Switzerland       Switzerland       Switzerland       switzerland       Finland
      670            685                  1,474             1,532             1,557             1,411             1,848             1,699             1,967             2,147             9,756             17,795            1,380
      Arab Countries Finland              Finland           Finland           Finland           Finland           Ireland           Ireland           Ireland           Finland           Finland           Finland           Austria
      636            654                  732               742               788               900               1,084             1,147             1,230             1,290             5,331             8,875             1,242
      Finland        Ireland              Ireland           Ireland           Austria           Austria           Finland           Finland           Finland           Austria           Ireland           ireland           korea, Rep
      627            496                  626               644               713               802               979               1,026             1,135             1,083              5,267            8,142             1,026
      Portugal       Portugal             Austria           Austria           Ireland           Ireland           Austria           Austria           Austria           Ireland           Austria           Austria           ireland
      477            469                  583               634               692               799               861               922               956               1,006             4,624             7,910             957

      Source: Development Initiatives based on OECD DAC
ACknowledGements

THANK YOU
The Global Humanitarian Assistance team would like to thank the many people that have
been involved in helping us put GHA Report 2011 together.
• Our colleagues at Development Initiatives (DI), including the consulting staff and interns.
• Diane Broadley of Broadley Design and David Robinson of Hype & Slippers for their
  substantial input into the design of this report. Their creativity and commitment to the
  project is very much appreciated. Also David Wilson for proofreading the report, and
  Jenn Warren, Ton Koene, IFRC and WFP for providing the photographs.
• The OECD DAC and UN OCHA FTS for extensive use of their data. In addition, we would
  like to extend our thanks to the teams within these organisations for their ongoing
  support in assisting us with its interpretation and use.
• Red Cross societies for their contributions: Croix-Rouge de Belgique, Canadian Red
  Cross, Swedish Red Cross, Croix-Rouge française, Danish Red Cross, British Red Cross.
We would like to thank the programme’s funders for their support: the International
Humanitarian Assistance Directorate (IHA) of the Canadian International Development
Agency (CIDA); the Department for Humanitarian Assistance and NGO Cooperation,
Ministry of Foreign Affairs, Denmark; the Humanitarian Aid Division of the Ministry of
Foreign Affairs, the Netherlands; the Swedish International Development Cooperation
Agency (Sida), Sweden; and the Department for International Development (DFID), the
United Kingdom.
The report was authored by GHA team members Jan Kellett (Programme Leader), Lisa
Walmsley (Data & Communications Advisor) and Lydia Poole (Policy Advisor) with extensive
assistance from the rest of the team: Kerry Smith, Jane Keylock, Hannah Sweeney, Velina
Stoianova, Daniele Malerba, Dan Sparks and Georgina Brereton coordinating production.
Additional editorial guidance was given by DI Co-Director, Judith Randel.


                                                                                                105
106
Development Initiatives is an independent organisation that sees
improving aid effectiveness as part of its commitment to the
elimination of absolute poverty by 2025. Global Humanitarian
Assistance (GHA) is a data access and transparency programme
of Development Initiatives which analyses aid flows to people living
in humanitarian crises, and researches and publishes annual GHA
reports. The programme is funded by the governments of Canada,
Denmark, Netherlands, Sweden and the United Kingdom. The report
is produced entirely independently. The data analysis, content and
presentation are solely the work of Development Initiatives and are
a representation of its opinions alone.

For further details on the content of this report including
communication with its authors, or to ask questions or provide
comments, please contact us by email (gha@devinit.org) or visit
our website at www.globalhumanitarianassistance.org
GHA Report 2011 presents the very latest
data on financial flows to humanitarian
crises. Chapters on the provenance,
destination and journey of humanitarian
funding, the forces which shape
humanitarian assistance, and looking
beyond humanitarian assistance to put it in
the context of other resource flows, reveal
the complexity of humanitarian response.
In a world where humanitarian aid is
being called upon to respond to multiple
coexisting challenges, it is essential that
decision makers have a transparent view of
all funding flows and resources allocated.
It is only in this way that we can determine
whether the right choices are being made.


Development Initiatives, Keward Court
Jocelyn Drive, Wells,Somerset, BA5 1DB, UK
T: +44 (0) 1749 671343 F: +44 (0) 1749 676721

Global Humanitarian Assistance Report 2011

  • 3.
  • 5.
    Contents FoRewoRd 2 exeCutive summARy 3 CHApteR 1: HumAnitARiAn FundinG 9 wHeRe does tHe FundinG Come FRom? 11 International governments 11 National governments 19 Private contributions 19 wHeRe does tHe FundinG Go? 22 Regional patterns 22 Country variations 23 Shifting trends 25 Current drivers 27 Same recipients, same donors? 32 How does tHe FundinG Get tHeRe? 37 Route and rationale 37 Multilateral organisations 39 Non-governmental organisations 40 International Red Cross and Red Crescent Movement 41 Donor funding choices beyond the OECD DAC 42 Financing mechanisms 44 Military 49 Meeting the challenge 51 CHApteR 2: FoRCes sHApinG HumAnitARiAn AssistAnCe 53 Natural disasters, conflict and economic challenges 54 Humanitarian needs: funding appeals 59 Proportionality in donor responses to crises 62 Funding in accordance with assessed needs 64 CHApteR 3: Beyond tHe divide: HumAnitARiAn AssistAnCe in Context 67 Development aid in humanitarian crises 70 Tackling vulnerability 76 Domestic resources 82 Humanitarian aid remains important, in context 86 dAtA & Guides 89 Key definitions, concepts and methodology 91 Data sources 94 Acronyms and abbreviations 96 Reference tables 98 ACknowledGements 105 1
  • 6.
    FoRewoRd We believe thatthere is a real value in having objective data on resource flows. It can be used as a shared evidence base for those who are working to achieve the best possible use of resources for people vulnerable to crises and insecurity. The Global Humanitarian Assistance (GHA) programme tries to present clear, unbiased, independent data in forms that can be easily understood. In our 2011 evaluation, it was suggested that we should offer more editorial comment about the numbers – but that we should ensure that this was entirely transparent so that the impartiality of the data would not be compromised. Below are some brief editorial comments about the implications of the analysis. In addition to this report, readers can also access the original data from our website, enabling them to examine the methodology and use it themselves, in order to draw their own conclusions. As we said in last year’s report, finance is about more than money. It affects the organisations that are strengthened or neglected, the level of attention that is paid to people, sectors or countries, the information to which funders have access and on which they base future decisions, and the economic impact felt in locations where the money is spent, as it travels through the layers of the humanitarian system. Financing is also one of the few things over which donors have control. Our view, therefore, is that policies on financing merit serious attention. It is extremely encouraging to see that some of the financing aspects of the humanitarian reform agenda have borne fruit. For instance, the pooled humanitarian funds of various kinds (emergency response funds (ERFs), the Central Emergency Response Fund (CERF), common humanitarian funds (CHFs)) are facilitating an increase in the number of donors contributing, without creating impossible coordination challenges. It is also good to see financing mechanisms being developed, in order to try to improve the quality of data that is informing decisions so that funding can become more responsive to need. International governments have spent US$90 billion on humanitarian response over the past ten years, much of it in the same countries and going to the same people. What outcomes should we expect? We, at Development Initiatives, believe that a reasonable conclusion to be drawn from the data is that more attention should be given to the range of results to which humanitarian assistance can, and should, contribute; these results include long-term and systemic issues, contributions to increased resilience and poverty reduction, reduced risks and protection of development gains. In focusing on results, we also believe that humanitarian contributions must be considered in the context of the whole funding mix so that different sources of finance and different instruments can be viewed together during planning processes. More attention to this funding mix and to results could, in turn, lead to progress on some very intractable problems such as the lack of investment in disaster risk reduction, the need for stronger linkages between development and humanitarian interventions and the lack of attention to coherence with domestic government actions in respect to humanitarian assistance and reducing vulnerability. A precondition for a more effective application of the funding mix is transparency. Unless people are aware of the resources available they cannot take the first steps towards using them more coherently. The environment for transparency is very positive both amongst individual donors and collectively through the International Aid Transparency Initiative (IATI), and there is more real-time data available on humanitarian assistance than on development spending. We hope that the information we can provide in the GHA reports and online will contribute to an ever improving use of all resources to address vulnerability, insecurity, crisis and poverty. Don’t forget that we have a helpdesk and we are always pleased to help provide data or information if we can. Judith Randel Co-Director, Development Initiatives 2
  • 7.
  • 8.
    THE HUMANITARIAN PICTURE IN NUMBERS 4
  • 9.
  • 10.
    exeCutive summARy Humanitarian aidis being stretched. Millions of people in sub-Saharan Africa are living with conflict and its legacy; natural disasters such as the earthquake in Haiti and the floods in Pakistan have the power to disrupt and sometimes even paralyse economic and social infrastructure; recovery and reconstruction remain uneven following large-scale conflict in Iraq and Afghanistan; and political turmoil is escalating in parts of the Middle East and North Africa. In many instances the people already affected by crises face additional threats, their livelihoods made more insecure by the effects of climate change and the vagaries of the global economy. The international humanitarian response to these needs reached US$16.7 billion in 2010. If this preliminary, partial estimate proves to be accurate when full final data is available, it will have been the largest annual humanitarian response on record – higher even than in 2005, the year of the Indian Ocean earthquake/tsunami and the South Asia (Kashmir) earthquake. However, while the contributions of governments outside of the Organisation for Economic Co-operation and Development (OECD) Development Assistance Committee (DAC) and those of the private sector increased dramatically in 2010, it is not clear whether these actors will become regular donors in years when there are no major natural disasters. The overall humanitarian expenditure of OECD DAC member governments – the major contributors to ongoing crises – is also estimated to have increased in 2010 (from US$11.2 billion in 2009 to US$11.8 billion). But the substantial increases made by just three donors (the United States, Japan and Canada) mask reductions by some of their peers. Eight OECD DAC members look set to reduce their levels of expenditure for the third consecutive year in 2010. While the overall international response to humanitarian crises shows an upward trend, many governments are coming under pressure to justify existing levels of aid spending. In a global context of rising demand, escalating costs and budgetary constraints, the need to target humanitarian financing effectively and equitably is ever more compelling. In 2010, the level of needs that were unmet in the UN’s consolidated appeals process (CAP) increased and humanitarian funding seems to have been more unevenly distributed across crises, with complex emergencies in many cases receiving a lower proportion of their funding requirements. The effective targeting of humanitarian financing must include the effective coordination of all resources to address vulnerability to crises – while it remains important for humanitarian aid to be independent, neutral and based on need alone, it does not exist in a vacuum. Does it make sense for humanitarian assistance, which in many cases is being spent year on year in the same places, to be looked at in isolation from other types of potential funding? wHeRe does HumAnitARiAn FundinG Come FRom? wHeRe does it Go? How does it Get tHeRe? • In reality global humanitarian assistance exceeds our US$16.7 billion estimate of the international humanitarian response from governments and private voluntary contributions in 2010. Not captured are the efforts of individuals, organisations and governments within crisis-affected countries themselves. We do not have a figure for the response of national governments but, by way of example, the Indian government has spent more than US$6.2 billion on emergencies in its own country over the past five years, far outweighing the US$315 million of humanitarian assistance it has received from international donors. Also not captured is the response of the military in delivering humanitarian assistance. In addition, it is difficult to draw a line around other types of aid flows that might go to people living in humanitarian crises. • Governments contributed US$12.4 billion (preliminary estimate) in response to international humanitarian crises in 2010 – the highest volume on record. In 2009 expenditure contracted to US$11.7 billion following the 2008 spike (US$12.3 billion) in response to a number of natural disasters and the food price crisis, and as some donors shifted the emphasis of parts of their humanitarian programming to development. • In 2009, the three largest government/institutional donors of humanitarian aid were the United States (US$4.4 billion), the European institutions (US$1.6 billion) and the United Kingdom (US$1 billion). In terms of generosity, however, Luxembourg, Sweden and Norway contributed the highest shares of gross national income (GNI) and Luxembourg, Norway and United Arab Emirates (UAE) contributed the most per person. • In 2009, 61.7% of international government funding was directed through multilateral delivery agencies or funding mechanisms, 17.3% through NGOs and less than 10% through the public sector. • We estimate private voluntary contributions to have been in the region of US$4 billion in each of the past three years. 6
  • 11.
    • In 2010,Médecins Sans Frontières (MSF) received US$1.1 billion for humanitarian activities from private contributions; this more or less equates to the humanitarian expenditure of the of the third largest donor, the United Kingdom. • In 2009, Sudan remained the largest single recipient of the international humanitarian response for the fifth consecutive year, with US$1.4 billion (figures for 2010 are not yet available). Sudan has received just under 11.2% (US$9 billion) of the total allocable by country over the past decade (US$89 billion) and historically has received US$300–US$600 million more each year than the next largest recipient. However, humanitarian aid to Palestine/ OPT increased dramatically from US$863 million in 2008 to US$1.3 billion in 2009, reducing Sudan’s ‘margin’ to US$100 million. • The total volume of funds channelled through pooled humanitarian funds, including common humanitarian funds (CHFs), emergency response funds (ERFs) and the Central Emergency Response Fund (CERF) increased from US$583 million in 2006 to US$853 million in 2010. • Contributions from non-OECD DAC member governments to humanitarian pooled funds increased from US$4 million in 2009 to US$98 million in 2010, largely due to contributions to the ERFs in Haiti and Pakistan. FoRCes sHApinG HumAnitARiAn AssistAnCe • In 2009 more than 65% of all humanitarian assistance went to conflict-affected and post-conflict states. • Humanitarian assistance is now more expensive. The costs of key components of humanitarian food aid are rising as well as those of delivering it. The cost of food increased by more than 40% between 2007 and 2011. During the same period, oil prices increased by 36% in real terms. • The funding required to meet humanitarian needs expressed in the UN appeals more than doubled between 2007 and 2010, reaching a historic high of US$11.3 billion. This growth was driven by an increase of US$2.9 billion in the requirements for complex emergencies over the period and the addition of the largest ever flash appeal requirements for sudden-onset crises, which totalled US$3.6 billion in 2010. • The 2.2% growth in donor contributions to the UN appeals in 2010 did not match the 15.4% increase in requirements that year, resulting in a substantially higher proportion of unmet needs, at 37%, compared with an average of 30.2% for the five preceding years. Funding for complex emergency appeals decreased considerably: while requirements fell 18.9% year-on-year, funding was down by 32.5%. Conversely, funding for flash appeals skyrocketed by 1,635% compared with the previous year, driven by the large-scale disasters in Haiti and Pakistan. HumAnitARiAn Aid in Context: Beyond tHe divide • Humanitarian aid is largely long-term in nature, with just under 70% of all funding in 2009 going to long-term affected countries. Most of these are in conflict-affected sub-Saharan Africa and are also vulnerable to drought – two sorts of insecurity, two factors that put development gains at risk. • Humanitarian aid may be smaller in terms of volume than other official development assistance (ODA), but it is spent in almost as consistent a fashion. The top 20 recipient countries of both over the past decade have been largely the same, which once more highlights the fact that humanitarian assistance from governments is not dominated by response to sudden massive natural disasters. • ODA expenditure on governance and security is increasing, reaching US$16.6 billion in 2009. Peacekeeping expenditure reached more than US$9 billion in the same year. New data shows how the bulk of peacekeeping funds are spent in the same countries receiving long-term humanitarian assistance. Special funds to tackle these contexts (both donor and recipient) are growing in number. • To date, few countries show any clear transition from a post-conflict and peacekeeping context to actual peace and reconstruction; only two of the top 20 recipients of international humanitarian aid have clearly moved out of the emergency phase in the past five years. • Domestic revenues are important and significant, even in the most crisis- and conflict- affected countries, and have shown a less extreme response to the financial crisis than developing countries as a whole. Aid, both development and humanitarian, has a particular value as a consistent flow of funds when foreign investment, remittances and domestic revenues are under pressure. • New data on disaster risk reduction (DRR) shows slowly increasing expenditure, but still to only extremely low levels. Total expenditure on DRR reached just US$835 million in 2009, a mere 0.5% of total ODA. Of the US$150 billion spent on the biggest humanitarian recipients over the past five years, only 1% of that has been reported as DRR. 7
  • 12.
    THE STORY Traditional responsesto humanitarian crises are those that fall under the aegis CREDIT of ‘emergency response’: material relief assistance and services (shelter, water, © IFRC / Olivier Matthys medicines etc.); emergency food aid (short-term distribution and supplementary feeding programmes); relief coordination, protection and support services (coordination, logistics and communications). Humanitarian aid can also include reconstruction and rehabilitation, as well as disaster prevention and preparedness. This International Federation of Red Cross and Red Crescent Societies (IFRC) photo was taken at a camp in Charsadda, Pakistan, following the floods in July 2010. The camp housed 150 families left homeless and offered shelter, food and health care. 8
  • 13.
    HumAnitARiAn FundinG In 2010, boththe earthquake in Haiti and the floods in Pakistan were met with a global humanitarian response. Local communities and organisations rallied to provide the most immediate, life-saving assistance. UN flash appeals were launched for each, with appealing agencies mobilising over US$1 billion in each case from governments, the private sector and individuals. Saudi Arabia and Brazil were the leading contributors to Haiti’s emergency response fund (ERF) and India was the largest government donor to support the Pakistan ERF, adding to the assistance provided by traditional government donors and EU institutions. But assistance in response to these types of emergency is not indicative of the bulk of humanitarian aid expenditure. While big disasters attract the attention and new sources of funding that help to create the spikes in global humanitarian expenditure in some years, most humanitarian aid is spent by the same donors in the same places each year. Together with Ethiopia, Afghanistan and Palestine/ OPT, Sudan has dominated humanitarian aid for much of the last decade. In each of the last five years, it has received over US$1.3 billion from government donors alone – roughly equivalent to the global sums raised through the UN appeals for each of Pakistan and Haiti in 2010. At the same time, the humanitarian budgets of these donors are responding to natural disasters, conflict and the legacies that continue to undermine the stability and security of thousands of families and communities from the long-running crises in Democratic Republic of Congo (DRC) and Somalia to earthquake-affected Chile and China; from conflict recovery in Iraq to tsunami recovery in Indonesia; and from Kenya to Zimbabwe. These very different situations highlight the very different needs that humanitarian aid is expected to address – and how humanitarian funding is being stretched way beyond that which is short-term and life-saving. Wrapped up in the global response are not only decisions about how much to spend and where to spend it, but also choices about who the funding will be entrusted to in order to ensure that humanitarian work is delivered most effectively. This section attempts to answer some basic questions about humanitarian aid. Where does the money come from? Where does it go? How does it get there? 9
  • 14.
    GLOBAL HUMANITARIAN ASSISTANCE HER INTE RNATIONAL RE SO UR CE OT S Other types of aid Other types of foreign assistance ITARIAN RE Humanitarian aid UMAN SPO LH delivered by the military NA NS E: IO AT U N S$ ER Governments 16 INT .7b US$12.4bn n (2010, preliminary estimate) Other international resources are discussed in Chapter 3, Beyond the divide: humanitarian aid in context. There is also a short section on the military’s delivery of humanitarian aid in Chapter 1, Section 1.3. Private voluntary contributions US$4.3bn ESTIC RESPON DOM SE (2010, preliminary estimate) National institutions National governments The international humanitarian response is the main focus of the analysis in Chapter 1, Humanitarian funding, although the role of national governments is also referenced in Section 1.1 People of that chapter. Domestic response is difficult to quantify. The role of national governments in humanitarian response is covered in Chapter 1, Section 1.1. Their role in social protection is referenced in Chapter 3, Beyond the divide: humanitarian aid in context. The work of Red Cross/Crescent societies (‘national institutions’) is QUANTIFIED discussed in Chapter 1, Section 1.3. PARTIALLY QUANTIFIED UNQUANTIFIED UNQUANTIFIABLE 10
  • 15.
    1.1 wHeRe doestHe FundinG Come FRom? inteRnAtionAl GoveRnments Over the past ten years, governments government response in terms of volumes have spent over US$90 billion of of humanitarian aid given – notably the humanitarian aid in response to United States, the European institutions, international humanitarian crises the United Kingdom, Germany and the – over US$30 billion of which has Netherlands – the additional funding been provided by the United States. mechanisms and ways of channelling assistance created within the international While members of the Organisation for community over the past decade have Economic Cooperation and Development’s also helped increase the visibility of (OECD) Development Assistance humanitarian assistance from other Committee (DAC) continue to dominate governments. FiGuRe 1: top 20 GoveRnment ContRiButoRs to inteRnAtionAl HumAnitARiAn Response, 2000–2009 (us$ Billion) 10. Italy 5. Netherlands US$3.6bn US$5.1bn 1. United States US$31.0bn 16. Saudi Arabia US$1.9bn 6. Sweden US$4.4bn 17. Belgium US$1.4bn 4. Germany US$6.5bn 8. Norway 20. UAE US$3.7bn US$0.8bn 3. United Kingdom 13. Denmark US$8.2bn US$2.3bn 2. EU institutions US$14.9bn 18. Finland US$1.1bn 9. France US$3.6bn 12. Canada US$2.6bn 7. Japan US$4.0bn 15. Australia US$2.1bn 14. Switzerland 11. Spain US$2.2bn US$3.2bn 19. Ireland US$1.1bn Note: The picture is dominated by 18 governments that are members of the Organisation for Economic Cooperation and Development (OECD)’s Development Assistance Committee (DAC). They are joined by Saudi Arabia (16th largest government donor over 10 years) and United Arab Emirates (UAE, 20th largest). The five OECD DAC members not included in the ‘top 20’ are: Austria (21st largest), Greece (22nd), Luxembourg (23rd), Portugal (24th) and Korea (28th). Source: Development Initiatives based on OECD DAC and United Nations Office for the Coordination of Humanitarian Affairs (UN OCHA) Financial Tracking Service (FTS) data 11
  • 16.
    FiGuRe 2: FivelARGest GoveRnment donoRs oF HumAnitARiAn Aid, 2000–2009 14 Netherlands Germany 12 United Kingdom EU institutions US$ BILLION (CONSTANT 2009 PRICES) 10 United States Total from OECD DAC members 8 Total from non-OECD DAC governments Total from all governments 6 4 2 0 2000 2001 2002 2003 2004 2005 2006 2007 2008 2009 Note: This figure shows the five largest government donors in relation to the total from their OECD DAC peers, other governments (as captured by UN OCHA FTS) and the total provided by all governments. Source: Development Initiatives based on OECD DAC and UN OCHA FTS data Overall, the international government and the earthquake in China); and 6% response to humanitarian crises is higher than in 2009. Full final data is not yet estimated to have reached US$12.4 billion in available for OECD DAC members in 2010, 2010 – the highest total on record. This was but it is likely (and is certainly the case for US$1 billion higher than in 2005, a year that other governments), that the increase will was previously described as ‘exceptional’ in have been in response to the emergencies response to the Indian Ocean-earthquake/ in Haiti and Pakistan (see Section 1.2, tsunami and the South Asia (Kashmir) ‘Where does the funding go?’). earthquake; slightly higher than in 2008 Looking back at the trends since 2000, (when the main response was to food every couple of years there has been a insecurity, notably in Ethiopia, Cyclones step change in response from OECD DAC Nargis (Myanmar) and Sidr (Bangladesh) members. They provided between FiGuRe 3: HumAnitARiAn Aid FRom GoveRnment donoRs, 2000–2010 14 Total from non-OECD DAC governments 12.3 12.4 Total from OECD DAC members 12 11.4 11.7 10.2 10 9.3 8.4 US$ BILLION 8.2 8 7.1 6.7 6.8 6 4 2 0 2000 2001 2002 2003 2004 2005 2006 2007 2008 2009 2010e Note: Data for members of the OECD DAC includes core official development assistance (ODA) contributions to the United Nations High Commissioner for Refugees (UNHCR), UN Relief and Works Agency for Palestine Refugees in the Near East (UNRWA) and the World Food Programme (WFP) to 2009. Data for 2010 is an estimate based on partial preliminary data releases (constant 2009 prices). Data for non-OECD DAC members includes all other government humanitarian aid, as captured by UN OCHA FTS (current prices). Our distinction between these two groups of government donors is entirely driven by the data. Source: Development Initiatives based on OECD DAC and UN OCHA FTS data 12
  • 17.
    FiGuRe 4: HumAnitARiAnAid FRom oeCd dAC GoveRnments, 2000–2009 25 11.8 11.4 11.2 10.8 US$ BILLION (CONSTANT 2009 PRICES) 9.9 20 9.0 8.1 8.2 15 6.7 6.7 6.5 10 5 0 2000 2001 2002 2003 2004 2005 2006 2007 2008 2009 2010e Note: Data for 2010 is estimated, based on partial preliminary data release (constant 2009 prices). We do not yet have details of core multilateral ODA contributions to UNHCR, UNRWA and WFP that year. Source: Development Initiatives based on OECD DAC data US$6 billion and US$7 billion over the The volume of humanitarian aid reported Saudi Arabia. It made up 98% of total period 2000-2002; between US$8 billion from other governments has fluctuated contributions in 2001, 36% in 2008 and and US$10 billion over the period 2003- between US$34.7 million in 2000 and 32% in 2010. On the basis of this data, 2005; between US$9 billion and US$11 US$622.5 million in 2010, and totals (which is not directly comparable with that billion over the period 2005-2007; and US$4.4 billion over the 11-year period. reported to the OECD DAC Secretariat by around US$12 billion since 2008. But while an upward trend is apparent, its members), Saudi Arabia has contributed there are fluctuations in reporting as more than Belgium, Finland and Ireland; In the past, we have referred to this as well as in giving. and UAE more than Austria, Greece, ‘the ratchet effect’ – where every major Luxembourg, Portugal, New Zealand headline crisis drives funding to new The spike in aid in 2005 was in part due and Korea. levels, which do tend to recede but are still to the Indian Ocean-earthquake/tsunami. considerably higher than the year prior Spikes in 2001 and 2008 however are to the crisis. largely due to single contributions from FiGuRe 5: HumAnitARiAn Aid FRom non-oeCd dAC GoveRnments, 2000–2010 1000 939 900 800 700 665 625 623 600 555 US$ MILLION 500 400 287 311 300 192 200 155 98 100 35 0 2000 2001 2002 2003 2004 2005 2006 2007 2008 2009 2010 Note: The number of donors reporting varies from 52 in 2000 to 99 in 2005 and from 87 in 2009 to 127 in 2010. Source: Development Initiatives based on UN OCHA FTS data 13
  • 18.
    FiGuRe 6: tHe30 lARGest GoveRnment ContRiButoRs oF HumAnitARiAn Aid oveR 10 yeARs, 2000-2009 RAnk donoR us$m numBeR oF sHARe sHARe oF peR Citizen, RAnk By RAnk By times A top oF totAl donoR’s 2009 (us$) Amount sHARe oF 10 donoR pRovided By totAl odA Given peR Gni, 2009 GoveRnments Citizen, 2009 1 united states 30,971 10 33.6% 14.9% 14 15 13 2 eu institutions 14,864 10 16.1% 13.4% - - - 3 united kingdom 8,183 10 8.9% 11.0% 17 12 8 4 Germany 6,527 10 7.1% 7.4% 9 21 16 5 netherlands 5,094 10 5.5% 9.0% 31 7 6 6 sweden 4,385 10 4.8% 13.0% 62 4 2 7 Japan 4,026 5 4.4% 4.0% 2 28 26 8 norway 3,681 9 4.0% 11.5% 79 2 3 9 France 3,597 9 3.9% 4.6% 7 22 21 10 italy 3,552 9 3.9% 11.4% 6 24 19 11 spain 3,223 4 3.5% 8.3% 14 14 9 12 Canada 2,640 1 2.9% 7.9% 12 16 14 13 denmark 2,278 0 2.5% 8.5% 44 5 5 14 switzerland 2,224 1 2.4% 12.4% 25 9 11 15 Australia 2,132 0 2.3% 10.2% 15 13 12 16 saudi Arabia 1,894 2 2.1% – 3 23 18 17 Belgium 1,446 0 1.6% 8.1% 19 11 10 18 Finland 1,148 0 1.2% 12.9% 29 8 7 19 ireland 1,127 0 1.2% 13.8% 32 6 4 20 uAe 755 0 0.8% – 77 3 93 21 Austria 548 0 0.6% 6.9% 9 20 17 22 Greece 445 0 0.5% 8.7% 4 26 20 23 luxembourg 405 0 0.4% 12.2% 121 1 1 24 portugal 272 0 0.3% 5.6% 2 29 23 25 new zealand 234 0 0.3% 9.3% 6 23 15 26 kuwait 221 0 0.2% – 11 17 93 27 Russia 175 0 0.2% – 0 41 30 28 korea 146 0 0.2% 3.1% 0 39 32 29 turkey 134 0 0.1% – 0 47 40 30 China 94 0 0.1% – 0 93 86 Note: Data for members of the OECD DAC (23 governments plus EU institutions) includes core ODA to UNHCR, UNRWA and WFP as reported to the OECD DAC (and core ODA to EU institutions for EU15 members). Data for China, Kuwait, Russia, Saudi Arabia, Turkey and UAE is from UN OCHA FTS. The amounts include contributions through the UN’s Central Emergency Response Fund (CERF) and pooled funding mechanisms. The rankings are based on a list of 164 countries. Gross national income (GNI) data is also taken from the OECD DAC. Per citizen rankings are based on population data from UN Department of Economic and Social Affairs 14
  • 19.
    FiGuRe 7: 20lARGest donoRs oveR Five yeARs, 2005-2009 20 18.8 18 16 14 US$ BILLION 12 10 8.9 8 6 4.6 3.8 4 3.0 2.6 2.3 2.1 2.1 1.9 1.9 1.7 2 1.4 1.3 1.1 1.1 0.9 0.8 0.7 0.7 0 1. United States 2. EU institutions 3. United Kingdom 4. Germany 5. Netherlands 6. Sweden 7. Spain 8. France 9. Norway 10. Italy 11. Japan 12. Canada 13. Denmark 14. Australia 15. Switzerland 16. Saudi Arabia 17. Belgium 18. Ireland 19. Finland 20. UAE Source: Development Initiatives based on OECD DAC and UN OCHA FTS data There have been no major changes to Preliminary partial data (which does not the list of the top 20 donors when viewed include donors’ totally unearmarked funds How GeneRous ARe over the past five years, compared with – i.e. core contributions to UN agencies GoveRnments? the ten-year period. There have been a or EU institutions), suggests that Spain’s Calculating contributions that few minor shifts within the list (France expenditure may have dipped in 2010, along governments make takes on a and Norway have switched places, as with that of 12 other OECD DAC members. different perspective when looked have Switzerland/Australia and Finland/ The Netherlands’ humanitarian expenditure at alongside their national wealth. Ireland), and one significant one – Spain contracted for the second year in a row, While the United States is by far and Japan change places as seventh and as did that of Austria, Denmark, Greece, the largest humanitarian donor eleventh largest donors. Korea and Portugal. Ireland’s humanitarian overall, 12 countries contribute aid declined for the third consecutive year. higher shares of their gross national In fact, Spain has doubled its humanitarian However, overall, the dip in volumes from income (GNI). Luxembourg, Sweden, aid contributions since 2000, rising from these donors is offset by large increases Norway, Ireland and Denmark fifteenth largest donor that year to become in expenditure by the United States (up by are the ‘top five’ donors when the fifth largest in 2009 (the latest year for some US$400 million), Canada (by US$129 contributions are measured on this which we have full final data for OECD DAC million) and Japan (by US$275 million). This basis. Another way of considering members). Its share of total government is likely to be attributable to expenditure in generosity is to look at contributions contributions has risen from 2.8% to 5.4%. Haiti and Pakistan. on a per citizen basis. Citizens of Luxembourg, Norway, UAE, Sweden and Denmark are the biggest humanitarian donors on this basis, providing US$44-US$121 per person compared with US$14 per US citizen or US$17 per UK citizen for example. 15
  • 20.
    FiGuRe 8: inCReAsesAnd deCReAses in HumAnitARiAn Aid expendituRe oF oeCd dAC memBeRs, 2008-2010 us$m 2008 2009 2010 Australia 135 23 -42 Austria 28 -7 -13 Belgium 27 -6 52 Canada 67 -9 129 denmark 16 -34 -51 Finland -23 16 -4 France -14 16 16 Germany 6 73 -33 Greece 3 -2 -10 ireland -18 -67 -5 italy 28 -3 -68 Japan 164 -20 275 korea 8 -5 -3 luxembourg 0 6 10 netherlands 36 -84 -73 new zealand -2 -9 3 norway -35 -44 68 portugal 0 -0 -1 spain 182 26 -64 sweden 38 36 -11 switzerland -29 -9 2 united kingdom 160 145 -9 united states 1334 -45 430 eu institutions 296 -346 84 Note: The figures are based on partial data in each year. ‘Partial data’ refers to directly administered projects and activities (sometimes also called ‘earmarked’ or ‘bilateral’ humanitarian aid) and does not include totally unearmarked (core) ODA contributions to UN agencies or EU institutions. Source: Development Initiatives based on OECD DAC data Saudi Arabia’s humanitarian aid increased US$50 million, to make it the second by US$174 million between 2009 and largest non-OECD DAC donor. Other 2010, US$50 million of which was due to increases in contributions of humanitarian its contribution to the Haiti emergency aid and appearances in the top 10 list of response fund (ERF), while UAE’s aid non-OECD DAC government donors in 2010 levels appear to have declined. Turkey’s were similarly driven by response to these reported contributions increased by two crises. FiGuRe 9: top 10 non-oeCd dAC GoveRnments’ HumAnitARiAn Aid expendituRe, 2008-2010 RAnk 2008 2009 2010 1 saudi Arabia us$566m united Arab emirates us$353m saudi Arabia us$256m 2 united Arab emirates us$110m saudi Arabia us$82m turkey us$61m 3 kuwait us$96m kuwait us$34m Russian Federation us$38m 4 Russian Federation us$44m Russian Federation us$32m united Arab emirates us$38m 5 thailand us$27m Qatar us$13m China us$38m 6 kazakhstan us$10m india us$11m india us$37m 7 turkey us$10m turkey us$5m Brazil us$29m 8 China us$9m Czech Republic us$4m thailand us$12m 9 iraq us$8m Hong kong us$4m mexico us$11m 10 singapore us$6m poland us$2m kuwait us$11m Source: Development Initiatives based on UN OCHA FTS data 16
  • 21.
    FiGuRe 10: sHAResoF tHe us$11.7 Billion in HumAnitARiAn Aid pRovided By GoveRnments in 2009 Some 107 governments and EU institutions participated in the international humanitarian response to crises in 2009, raising US$11.7 billion. Over half of the funding came from just three donors – the United States, European institutions and the United Kingdom. United States US$4.4bn EU institutions US$1.6bn United Kingdom US$1.0bn two GoveRnments And tHe Germany US$727m eu institutions pRovided Spain US$632m oveR us$1bn eACH Sweden US$573m Netherlands US$508m 18% FouR GoveRnments pRovided Between us$500m And us$1bn eACH France US$406m Canada US$396m 17% Norway US$375m Italy US$362m UAE US$353m Australia US$324m six GoveRnments pRovided Between us$300m And us$500m eACH Japan US$298m six GoveRnments 9% pRovided Between Denmark US$242m us$100m And Belgium US$202m us$300m eACH Switzerland US$186m 3% 53% Finland US$151m Ireland US$142m eiGHt GoveRnments pRovided Between us$25m And us$100m eACH 11 GoveRnments pRovided Saudi Arabia US$82m Between us$1m And Austria US$77m us$25m eACH Luxembourg US$59m Greece US$50m Korea US$19m Kuwait US$34m Qatar US$13m Russia US$32m India US$11m New Zealand US$27m Turkey US$5m Portugal US$25m Czech Republic US$4m Hong Kong US$4m Poland US$2m Oman US$2m Brazil US$2m Estonia US$1m South Africa US$1m A further 70 governments provided up to us$1 million each Source: Development Initiatives based on OECD DAC and UN OCHA FTS 17
  • 22.
    FiGuRe 11: oeCddAC memBeRs’ HumAnitARiAn Aid As A sHARe oF tHeiR totAl odA, exCludinG deBt RelieF, 2000-2009 140 12% US$ BILLION (CONSTANT 2009 PRICES) 129 Other ODA 122 120 Humanitarian aid 106 106 109 10% 100 97 84 87 86 87 8% 80 6% 60 4% 40 20 2% 0 0% 2000 2001 2002 2003 2004 2005 2006 2007 2008 2009 Note: The line on the graph shows clear peaks in the humanitarian share of ODA in 2003 (Afghanistan, Iraq), 2005 (Indian Ocean-earthquake/tsunami and South Asia (Kashmir) earthquake and 2008 (food insecurity, China earthquake, cyclones in Myanmar and Bangladesh). Source: Development Initiatives based on OECD DAC Humanitarian aid from governments is just India, China and South Africa (BRICS), one element of financial assistance that these other aid resources from these might flow to crisis-affected countries. For governments more than doubled between members of the OECD DAC for example, 2005 and 2009, from US$4.6 billion to humanitarian aid represents just 8.7% of US$10.4 billion. their total ODA expenditure since 2000. China’s foreign assistance is reported to This ‘other’ ODA includes aspects of have reached US$2 billion in 2009 (while longer-term development finance, and the reported humanitarian aid figure is governance and security expenditure, well under US$1million in the same year). which are also vital flows of assistance to Russia’s foreign assistance significantly people living through humanitarian crises increased between 2008 and 2009, from (see Chapter 3). US$200 million to US$800 million but Saudi Arabia, Kuwait, UAE and several the amounts of humanitarian aid reported other donors also report ODA expenditure to UN OCHA FTS in those two years to the DAC. Taken together with foreign were US$44 million and US$32.5 million assistance reported by Brazil, Russia, respectively. FiGuRe 12: odA And FoReiGn AssistAnCe FRom non-oeCd dAC memBeRs, 2005-2009 12 ODA from Saudi Arabia, UAE, Kuwait 11.2 10.4 Foreign assistance from BRICS ODA from other non-OECD DAC members 10 8 6.8 US$ BILLION 6.5 6 4.6 4 2 0 2005 2006 2007 2008 2009 Note: Foreign assistance for BRICS is a conservative estimate based on various secondary sources. Source: Various. See ‘Data & Guides’ 18
  • 23.
    nAtionAl GoveRnments Nationalgovernments are primarily Between 2005 and 2010, the Indian As a donor of international assistance, responsible for taking care of their citizens in government contributed US$4.8 billion to India gave over US$43 million between disasters and emergencies. We do not have its own State Disaster Response Fund 2005 and 2009, and in 2010 it provided a global figure for how much governments (SDRF, formerly Calamity Relief Fund) US$36 million in response to the Pakistan spend on crises in their own countries and between 2005 and 2009 it contributed earthquake alone. In 2011 it announced – but we know that the expenditure can US$1.4 billion to the National Disaster US$5 billion of aid to Africa. be significant. For example Indonesia’s Response Fund (NDRF, formerly National For more information on domestic government expenditure on disaster Calamity Contingency Fund). When these response, see Chapter 3. response increased from over US$50 million sums are combined (US$6.2 billion), they in 2001 to more than US$250 million by 2007 far outstrip the international humanitarian (GHA Report 2010, p74). A further example response to disasters in India (US$315 is India, which operates both state- and million) and amount to two-thirds of the national-level disaster funds. total ODA received by the country over the period. FiGuRe 13: inteRnAtionAl HumAnitARiAn Response, 2006-2010 (us$ Billion) 16.4 16.7 15.7 4.3 Private contributions 4.1 3.9 Governments International humanitarian response 12.9 12.8 2.7 3.5 12.3 12.4 11.7 10.2 9.3 US$ BILLION 2006 2007 2008 2009 2010 Note: All figures for 2010 are preliminary estimates. Private contribution figures for 2006-2008 are based on our own research of a study set of NGOs and UN delivery agencies. The figure for 2009 is an estimate. The figure for 2010 is a preliminary estimate. Source: Development Initiatives based on OECD DAC and UN OCHA FTS data, annual reports and our own research (see ‘Data & Guides’) pRivAte ContRiButions In addition to humanitarian assistance from Movement. We estimate funding from between 2008 and 2009 (from US$864 government donors, funding from private private sources to have been between million to US$798 million) – but reached sources contributes to the humanitarian US$2.7 billion and US$4.3 billion in each a record US$1.1 billion in 2010. response – in some years, substantially of the past five years – around a quarter Private funding for humanitarian so. In addition to the national assistance of the average annual total of US$16 billion assistance not only represents an provided by families, neighbours, in international response. important share of the total in any given communities, diaspora and local private Our own research and estimates indicate year; it can also be particularly significant sector, the main private donors of that overall private contributions decreased in certain contexts where it can equal humanitarian aid are individuals, private in 2009 due to a decline in the number and or even exceed the support given by foundations, trusts, private companies and intensity of sudden onset humanitarian government donors – for example in Haiti corporations. The money is typically raised crises, rising again in 2010 prompted by in 2010 and the Indian Ocean-earthquake/ by and channelled through humanitarian the disasters in Haiti and Pakistan. As an tsunami in 2005 (see following section, organisations, whether non-government example, private funding to Médecins Sans ‘Where does the funding go?’). organisations (NGOs), UN agencies or the Frontières (MSF) declined by US$66 million International Red Cross and Red Crescent 19
  • 24.
    pHilAntHRopiC GivinG Philanthropic giving is thought to be treated as directly comparable be a major source of funding – but with the humanitarian aid reported by not much is known about the extent governments. However, as an indicator of this, specifically in humanitarian of scale, philanthropic giving for one contexts. The William and Flora Hewlett year would be on the same scale as Foundation for example, which in April that of the United States government’s 2011 became the first philanthropic US$30 billion over the last ten years, signatory to the International Aid on the basis of these figures. Transparency Initiative (IATI) standard, disbursed US$345 million in grants in FiGuRe 14: CountRy-AlloCABle HeAltH 2009 for projects in the United States expendituRe RepoRted to tHe oeCd as well as for global development dAC By Bill & melindA GAtes and international population FoundAtion, 2009 programmes, and US$358 million in 2010 (organisation’s own estimates). CountRy us$m un CAp Currently just over US$472 million in AppeAl in 2009? commitment information since 2006 is available for analysis from open data Bangladesh 17.0 No format. As yet, most activities are only categorised by region – and the amount Botswana 29.8 No spent in humanitarian crises is difficult China 46.2 No to discern. Ethiopia 8.2 No In 2009, a further major philanthropic Ghana 7.0 No organisation, the Bill & Melinda Gates Foundation, reported US$1.7 billion in India 119.4 No health expenditure to the OECD DAC. Indonesia 2.0 No Two of the countries in which it spent Kenya 24.1 Yes this money – Kenya and Pakistan – had humanitarian needs as indicated by a Malawi 2.2 No UN consolidated appeal process (CAP) Mali 10.5 No appeal that year. Nigeria 45.9 No Meanwhile, two other institutional sources of information, The Hudson Pakistan 34.0 Yes Institute’s Index of Global Philanthropy Senegal 10.0 No and Remittances 2011 and The South Africa 0.9 No Foundation Centre, put philanthropic giving from the United States between Tanzania 5.7 No US$37 billion and US$46 billion in Zambia 8.4 No 2009/2010. These figures include monetised volunteering as well as Source: Development Initiatives based commodities and finance, so cannot on OECD DAC and UN OCHA FTS Moreover, the assessment of all crises. In the same way, when donors the different sources of funding for make a choice on funding allocation (such humanitarian aid has deeper implications as supporting one part of the delivery than the mere tracking of financial flows system instead of another, or earmarking within the system. The source of funding funding for a specific sector, region or affects the type, duration and scope even time period), that has implications of assistance delivered, as well as the for the dynamics within the system as well potential outcomes. as for the final delivery of aid. It is for that reason that counting private contributions, Private funding is largely regarded as unravelling their role and tracing their being more flexible and adaptable, thus passage to delivery on the ground are allowing humanitarian organisations to critical for assessing the volumes of global cover the types of cost and activity that may humanitarian assistance. not be attractive to donor governments or to enable them to work in neglected 20
  • 25.
    THE STORY Expenditure ondisaster risk reduction (DRR) is rising slowly – but it still CREDIT represents only 1% of the US$150 billion spent in the top 20 humanitarian © IFRC / Rob Few recipient countries over the past five years. This photo from the International Federation of Red Cross and Red Crescent Societies (IFRC) shows a disaster preparedness training session in Natutu, Fiji. 21
  • 26.
    1.2 wHeRe doestHe FundinG Go? FiGuRe 15: inteRnAtionAl HumAnitARiAn Aid By ReGion oveR ten yeARs, 2000-2009 Europe, Americas, Oceania: US$9.3bn, 10% Middle East regional: US$0.9bn, 1% TOP 3 RECIPIENTS: TOP 3 RECIPIENTS: Palestine/OPT, US$7.2bn Middle East Africa allocable Sudan, US$8.9bn Iraq, US$5.1bn allocable by by country: Ethiopia, US$4.8bn Lebanon, US$1.9bn country: US$36.4bn, 40% DRC, US$3.3bn US$17.0bn, 19% Asia regional: US$2.3bn, 3% Asia allocable TOP 3 RECIPIENTS: by country: Afghanistan, US$5.1bn US$18.6bn, 21% Pakistan, US$2.4bn Indonesia, US$2.4bn Africa regional: US$5.4bn, 6% Note: The figures include contributions from governments (members of the OECD DAC and others reporting to UN OCHA FTS) and private contributions reported to UN OCHA FTS. This includes the money spent by these donors through UN agencies, NGOs and financing mechanisms such as the Central Emergency Response Fund (CERF). In addition to the amounts shown, US$5 billion has been allocated to Europe, US$4.2 billion to the Americas and US$142 million to Oceania. The totals here will not tally with those expressed in the ‘Where does the funding come from?’ section, where data from UN OCHA FTS is supplemented by our own research on private contributions. Regional expenditure is that which has more than one destination country. Source: Development Initiatives based on OECD DAC and UN OCHA FTS ReGionAl pAtteRns Since 2000, just under US$90 billion In the Middle East, expenditure is Middle East, the conflict in Iraq drove levels dollars has been spent on international dominated by Palestine/OPT, overall the of humanitarian funding higher in both humanitarian response. Africa received second largest recipient of humanitarian 2001 and 2003 before levelling off, dipping the largest share of this (46%). Of the total, aid over the last ten years, and Iraq. slightly and now rising again as recovery 40% has been allocated to sub-Saharan and reconstruction follow. Expenditure in Over the past ten years, humanitarian Africa, which includes Sudan, Ethiopia and Europe has declined since the end of the aid to Africa has increased sharply, most Democratic Republic of Congo (DRC) – conflict in the Balkans, while the Americas particularly to sub-Saharan countries the largest, fifth largest and sixth largest maintain low levels of funding. where, against a backdrop of conflicts country recipients over the last ten years. and drought that have displaced millions Our analysis in the remainder of this Asia received the next largest share of people, humanitarian needs are driven section explores these trends in further (24%). Conflict has been the main driver by lack of access to basic services, the detail, focusing on the US$80 billion that of the US$5.1 billion in humanitarian threat of communicable disease and has been provided to 156 countries over expenditure to the region’s largest food insecurity. Funding to Asia, which in the last ten years (‘total allocable by recipient, Afghanistan. Just under half that addition to the Afghanistan conflict has country’). It does not include the additional amount (US$2.4 billion) has been spent in been hit by several large-scale natural US$10.9 billion that has been spent on each of the region’s next largest recipients, disasters and is home to large numbers of regional or cross-border programmes that Pakistan and Indonesia. vulnerable people, has also risen. In the have more than one destination country. FiGuRe 16: inteRnAtionAl HumAnitARiAn Aid By ReGion sinCe 2000 7 6 Europe 5 Africa US$ BILLION 4 Americas Asia 3 Middle East 2 1 2000 2001 2002 2003 2004 2005 2006 2007 2008 2009 Note: The graph shows increased levels of funding to both Asia and Africa over the last decade, with spikes in both 2005 and 2008. Source: Development Initiatives based on OECD DAC and UN OCHA FTS 22
  • 27.
    CountRy vARiAtions Just underUS$80 billion in humanitarian aid (with US$7.2 billion or 9.1% of the total), has been allocated to some 156 countries it accounts for just over one-fifth of the over the last ten years. Over 70% of this money spent in specific countries over has been concentrated in 20 countries – all the past decade. but two of which are classified as ‘conflict- Iraq (which has received US$5 billion, affected’ (Jordan and Zimbabwe) and all 6.5% of the total), Afghanistan (similar but five of which (Indonesia, Pakistan, Sri volumes and share) and Ethiopia Lanka, Uganda and Chad) are classified as (US$4.8 billion or 6.1% of the total) are ‘long-term’ recipients of humanitarian aid the third, fourth and fifth largest recipients (see Chapter 3). of the last decade. Though they have very Sudan is the single largest recipient of different humanitarian profiles these five international humanitarian aid. It has countries have been top 10 recipients in received just under US$9 billion (11.2%) of each of the last ten years. (See page 30, the estimated total over the past decade ‘Seven countries in focus’). and has been the single largest recipient in each of the last five years. Together with the next largest recipient, Palestine/OPT FiGuRe 17: top 20 ReCipients oF inteRnAtionAl HumAnitARiAn Aid, 2000-2009 (us$ Billion) 17. 19. Jordan Chad US$1.3bn US$1.1bn 20. 16. Liberia Angola US$0.9bn US$1.3bn 11. Kenya US$1.7 6. 13. DRC 8. Serbia US$3.3bn Pakistan US$1.5bn US$2.4bn 15. 18. Zimbabwe Burundi US$1.5bn US$1.2bn 1. 4. Sudan Afghanistan US$8.9bn US$5.1bn 12. 7. Sri Lanka Somalia US$1.6bn US$2.6bn 14. Uganda 3. US$1.5bn 5. Iraq US$5.1bn Ethiopia 2. US$4.8bn Palestine/OPT US$7.2bn 9. 10. Indonesia Lebanon US$2.4bn US$1.9bn Source: Development Initiatives based on OECD DAC and UN OCHA FTS TOP 20 RECIPIENTS OF INTERNATIONAL HUMANITARIAN AID 2000-2009 (US$bn) 23
  • 28.
    FiGuRe 18: keydAtA on tHe 20 lARGest ReCipients oF inteRnAtionAl HumAnitARiAn Aid, 2000-2009 CountRy numBeR inteRnAtionAl sHARe oF totAl HumAnitARiAn ConFliCt- lonG-teRm sHARe FRom And RAnk oF yeARs HumAnitARiAn AlloCABle By sHARe oF AFFeCted? HumAnitARiAn oeCd dAC in top 10 Aid (us$bn) CountRy totAl odA Aid ReCipient? memBeRs 1. sudan 10 8.9 11.2% 60.6% Yes Yes 95.4% 2. palestine/opt 10 7.2 9.1% 37.6% Yes Yes 85.6% 3. iraq 10 5.1 6.5% 14.9% Yes Yes 96.0% 4. Afghanistan 10 5.1 6.4% 17.1% Yes Yes 96.1% 5. ethiopia 10 4.8 6.1% 21.3% Yes Yes 98.2% 6. dRC 9 3.3 4.2% 28.1% Yes Yes 99.5% 7. somalia 4 2.6 3.2% 68.3% Yes Yes 95.0% 8. pakistan 4 2.4 3.1% 12.1% Yes No 80.0% 9. indonesia 2 2.4 3.0% 16.1% Yes No 90.4% 10. lebanon 2 1.9 2.4% 33.2% Yes Yes 90.9% 11. kenya 1 1.7 2.1% 17.2% Yes Yes 98.4% 12. sri lanka 1 1.6 2.1% 21.3% Yes No 87.9% 13. serbia 2 1.5 2.0% 12.4% Yes Yes 99.6% 14. uganda 2 1.5 1.9% 10.6% Yes No 99.0% 15. zimbabwe 3 1.5 1.9% 39.2% No Yes 98.8% 16. Angola 5 1.3 1.7% 31.8% Yes Yes 98.6% 17. Jordan 0 1.3 1.6% 16.8% No Yes 99.2% 18. Burundi 2 1.2 1.5% 31.3% Yes Yes 99.2% 19. Chad 0 1.1 1.4% 30.1% Yes No 96.7% 20. liberia 1 0.9 1.2% 31.8% Yes Yes 97.6% Source: OECD DAC for DAC governments and EU institutions, 1995-2009. All other data from UN OCHA FTS and UN CERF 24
  • 29.
    sHiFtinG tRends Of the20 countries listed in Figure 17, only Angola and Serbia have clearly moved The OECD Development Assistance by country over the 10-year period out of their emergency phases over the Committee (DAC) comprises the from 2000 to 2009. The remaining 4% last five years. Now ranked as seventy- European institutions and the 23 of our data 2000-2009 comes from fifth and forty-ninth largest recipients governments of: Australia, Austria, UN OCHA Financial Tracking Service of humanitarian aid respectively, both Belgium, Canada, Denmark, Finland, (FTS). UN OCHA FTS is the custodian continue to receive other forms of official France, Germany, Greece, Ireland, of data relating to the UN consolidated development assistance (ODA) but at much Italy, Japan, Korea, Luxembourg, the appeals process (CAP), which has lower levels than during the first half of the Netherlands, New Zealand, Norway, accounted on average for 46% of the decade. Their places as top 20 recipients of Portugal, Spain, Sweden, Switzerland, the total sums captured by the FTS since humanitarian aid between 2005 and 2009 United Kingdom and the United States. 2000. The reporting of the remaining were taken by two countries that were amounts represents voluntary reporting Information on humanitarian and pushed into crisis by natural disasters – and can vary between donors and by other aid expenditure is reported by Myanmar (sixteenth largest recipient since donor by year. Hence, our reporting on OECD DAC members along consistent 2005) and Bangladesh (nineteenth largest). the humanitarian aid expenditure of lines each year – which means that governments that are not members of Of the other 18 countries, some accounted we have comparable data for recipient the OECD DAC and on private voluntary for large shares of humanitarian aid at countries going back to 1995 and detailed contributions, often relates to that the beginning of the five-year period (e.g. project level data going back to 2005. which has been captured through the Indonesia), while natural disasters and Overall, this information represents UN appeals processes and financing conflict pushed others into crises requiring 96% of our international humanitarian mechanisms. large-scale response either periodically or response figures on the totals allocable temporarily (e.g. Pakistan). Within the top five recipients, while Iraq is now receiving considerably less FiGuRe 19: top 20 ReCipients oF inteRnAtionAl HumAnitARiAn Aid oveR Five And ten-yeAR peRiods CompARed RAnk, 10 yeARs CHAnGe in lAst RAnk, 5 yeARs (2000-2009) Five yeARs (2005-2009) 1. Sudan - 1. Sudan 2. Palestine/OPT - 2. Palestine/OPT 3. Iraq +2 3. Ethiopia 4. Afghanistan - 4. Afghanistan 5. Ethiopia -2 5. Iraq 6. DRC - 6. DRC 7. Somalia +1 7. Pakistan 8. Pakistan +1 8. Indonesia 9. Indonesia -2 9. Somalia 10. Lebanon - 10. Lebanon 11. Kenya +1 11. Sri Lanka 12. Sri Lanka -1 12. Kenya 13. Serbia +2 13. Zimbabwe 14. Uganda - 14. Uganda 15. Zimbabwe +4 15. Chad 16. Angola +5 16. Myanmar (+5) 17. Jordan - 17. Jordan 18. Burundi - 18. Burundi 19. Chad +4 19. Bangladesh (+4) 20. Liberia - 20. Liberia Source: Development Initiatives based on OECD DAC and UN OCHA FTS 25
  • 30.
    humanitarian aid thanit was between Other changes worthy of note include the 2003 and 2005 (just over US$3 billion in case of Chad, which has received 87% that period), it is still receiving relatively (US$996 million) of the US$1.1 billion high levels of assistance (between spent in the country over the last decade US$360 million and US$470 million in during the last five years. In addition to each of the last three years) as its suffering political unrest within its own emergency phase passes from relief to borders, and being subject to frequent recovery. However, a spike in funding to drought, Chad continues to host to Ethiopia in 2005, together with drought and people displaced by conflicts in Darfur the food price crisis in 2008, have pushed and Central African Republic (CAR). the country from fifth to third largest Humanitarian aid to the country has been recipient over the past five years. rising steadily each year since 2005 to reach US$322 million in 2009, making Just outside the top five but receiving it the eleventh largest recipient that year. between US$300 million and US$570 million in each of the last five years is However, perhaps one of the biggest Democratic Republic of Congo (DRC). stories to emerge from the data, and one The situation in DRC was classed as that is not visible by looking at ranking something of a ‘forgotten emergency’ and aggregate volumes alone, is that during the early part of the decade, but humanitarian aid to Palestine/OPT has a concerted campaign of advocacy from more than doubled since 2005 – from non-governmental organisations (NGOs) just under US$500 million to just over and the UN, combined with changes in US$1.3 billion in 2009. the UN appeal process and funding architecture, has prompted a significant upturn in funding: US$2.3 billion of the US$3.3 billion (67%) that the country has received since 2000 has been provided in the past five years. FiGuRe 20: top 20 ReCipients oF inteRnAtionAl HumAnitARiAn Aid, 2005-2009 8 7.0 7 6 US$ BILLION 5 4.3 4 2.9 3 2.5 2.3 2.3 2.1 2.0 2.0 2 1.5 1.4 1.2 1.2 1.0 1.0 1 0.7 0.7 0.6 0.6 0.6 0 1. Sudan 2. Palestine/OPT 3. Ethiopia 4. Afghanistan 5. Iraq 6. DRC 7. Pakistan 8. Indonesia 9. Somalia 10. Lebanon 11. Sri Lanka 12. Kenya 13. Zimbabwe 14. Uganda 15. Chad 16. Myanmar 17. Jordan 18. Burundi 19. Bangladesh 20. Liberia Private contributions Other governments OECD DAC members Source: Development Initiatives based on OECD DAC and UN OCHA FTS 26
  • 31.
    FiGuRe 21: sHAResoF inteRnAtionAl HumAnitARiAn Aid By ReCipient, 2009 136 others: US$3.7bn 35% Sudan: US$1.4bn 13% 12% Palestine/OPT: US$1.3bn 7% Ethiopia: US$692m 4% 6% Zimbabwe: US$393m Afghanistan: US$634m 4% 5% Kenya: US$400m 4% 5% 5% Somalia: US$573m Iraq: US$468m Pakistan: US$486m DRC: US$567m Source: Development Initiatives based on OECD DAC and UN OCHA FTS CuRRent dRiveRs Sudan remained the largest recipient of Many donors have increased humanitarian expenditure there too (from US$5 million humanitarian aid for the fifth consecutive aid to Palestine/OPT. The United States to US$9.4 million). year in 2009, accounting for US$1.4 billion alone increased expenditure from US$22 Of the next largest recipients (Ethiopia, (or 13% of the total allocable by country). million in 2008 to US$305 million in 2009. Afghanistan, Somalia and DRC), only Although its share of the total went up European institutions also increased their DRC actually received higher volumes fractionally, its volume of humanitarian aid bilateral expenditure there by some US$35 of humanitarian aid in 2009 than in the decreased slightly (by US$67 million). The million, with contributions to the UN Relief previous year. Ethiopia received increased huge rise in funding to Palestine/OPT (from and Works Agency for Palestine Refugees humanitarian aid in 2008 due to drought US$863 million in 2008) means that the in the Near East (UNRWA) for emergency and food insecurity, which decreased in gap between Sudan and the next largest distress relief and reconstruction, and 2009. Changes in Afghanistan and Somalia recipient – historically around US$300 also to NGOs for food aid. The United were due mainly to a shift in emphasis from million-US$600 million – is now down Kingdom increased its expenditure by a humanitarian to development programming, to US$100 million. similar amount and the Central Emergency notably by the EU institutions. Response Fund (CERF) doubled its FiGuRe 22: top 10 ReCipients oF inteRnAtionAl HumAnitARiAn AssistAnCe, 2005-2009 (us$) 2005 2006 2007 2008 2009 Sudan 1.4bn Sudan 1.4bn Sudan 1.3bn Sudan 1.5bn Sudan 1.4bn Indonesia 870m Palestine/OPT 796m Palestine/OPT 857m Ethiopia 886m Palestine/OPT 1.3bn Pakistan 721m Lebanon 536m DRC 414m Palestine/OPT 863m Ethiopia 692m Iraq 696m Indonesia 524m Lebanon 363m Afghanistan 860m Afghanistan 634m Ethiopia 658m Pakistan 451m Iraq 363m Somalia 604m Somalia 573m Sri Lanka 544m DRC 435m Afghanistan 317m DRC 529m DRC 567m Palestine/OPT 498m Iraq 423m Ethiopia 300m Myanmar 466m Pakistan 486m Afghanistan 320m Afghanistan 349m Bangladesh 285m Iraq 376m Iraq 468m DRC 307m Ethiopia 345m Somalia 273m Zimbabwe 334m Kenya 400m Zimbabwe 214m Somalia 324m Pakistan 252m China 310m Zimbabwe 393m top 10 total 4.8bn 4.2bn 3.4bn 5.2bn 4.2bn Source: Development Initiatives based on OECD DAC and UN OCHA FTS 27
  • 32.
    FiGuRe 23: tHe10 lARGest CHAnGes in inteRnAtionAl HumAnitARiAn Aid Flows, 2008-2009 2008-2009 us$m explAnAtion 2008-2009 us$m explAnAtion inCReAse deCReAse palestine/opt 440 US, UK, EU and others increase myanmar -315 Had received US$450m in funding following Israeli response to Cyclone Nargis and operation ‘Cast Lead’ at the floods in 2008. There were no start of the year which resulted UN CAP appeals in 2009. in large-scale devastation in the Gaza Strip. pakistan 290 Increase in the intensity of China -293 Had received US$310m in conflict in Northern territories response to Sichuan earthquake lead to further mass forced in 2008. displacement. indonesia 132 Large earthquake hits West Afghanistan -226 There was an upsurge of funding Sumatra, causes widespread in 2008 to US$871m when damage to Padang. food shortages and increased insecurity contributed to a significant increase in humanitarian needs. kenya 95 Increase in Somali refugees, ethiopia -194 Had received increased flows food and livelihood insecurity due to food crisis in 2008 particularly affecting the (which continued into 2009). vulnerable urban poor. iraq 92 More humanitarian aid for the uganda -87 Had received funding in 2008 after recovery and reconstruction instability in Acholi, Lango and after the war, in order to rebuild Teso as well as in response to infrastructure. Still many drought and floods. internally displaced persons in the country. syria 83 Syria hosts the largest Iraqi dpRk -79 Food crisis in 2008 due to floods refugee population in the region. in 2007. Malnutrition and TB. The country was hit by a severe drought. Chad 72 Humanitarian aid flows for Côte -78 Special disbursements refugees from Sudan and CAR, d’ivoire made in 2008 for post-crisis but also to IDPs; a consequence rehabilitation. of insecurity in the country and the region. philippines 61 Tropical Storm Ketsana Haiti -67 A UN flash appeal was launched and Typhoon Parma cause in 2008 following four successive devastation leaving 4.2 million hurricanes and tropical storms. people in need of assistance. zimbabwe 59 Increased food insecurity and a liberia -62 Increased flows in 2008 for UN country-wide cholera outbreak. ‘Critical Humanitarian Gaps (CHG), focusing on health, food security and water and sanitation. This year was also characterised by outbreaks of yellow fever, cholera and acute watery diarrhoea, floods, violent land disputes and mob violence. dRC 38 Violence in North Kivu and lebanon -57 In 2008, assistance for 27,000 causes population displacement. Palestinian refugees living in Assistance required for returnees Nahr el-Bared camp displaced in other parts of the country. by fighting in May-August 2007. Assistance still required for Lebanese people displaced by the July-August 2006 conflict. Source: Development Initiatives based on OECD DAC and UN OCHA FTS 28
  • 33.
    FiGuRe 24: topReCipient By HumAnitARiAn seCtoR, 2005-2009 (us$ million) seCtoR 2005 2006 2007 2008 2009 material relief assistance Sudan Sudan Sudan Sudan Sudan and services 518 608 593 529 526 emergency food aid Sudan Sudan Sudan Sudan Sudan 693 504 576 687 691 Relief coordination; protection Indonesia Sudan Palestine Afghanistan Pakistan and support services 6 62 21 43 48 Reconstruction relief Indonesia Indonesia Indonesia Afghanistan Afghanistan and rehabilitation 187 289 161 355 253 disaster prevention Iraq India Bangladesh Bangladesh Bangladesh and preparedness 47 3 5 27 26 Source: Development Initiatives based on OECD DAC Although tracking volumes of humanitarian Overall, around half of the humanitarian aid tells us where the money is spent it aid expenditure of OECD DAC members does not tell us what it is spent on. There over the last five years has been spent on are considerable differences in sector material relief assistance and services expenditures across crises, even those (such as water and sanitation and medical we might consider to be rather similar. assistance). In addition to aid provided to Sudan, the particularly high shares of this Unsurprisingly perhaps given the scale type of humanitarian aid in 2005 reflect of the humanitarian effort in the country, expenditure following the Indian Ocean Sudan has been the largest recipient earthquake-tsunami and the South Asia of both material relief assistance and (Kashmir) earthquake. Emergency food emergency food aid each year since 2005. aid rises in response to crises in certain Pakistan became the top recipient of years, such as in 2008, and can represent a relief coordination, protection and support particularly high share of humanitarian aid services, while Afghanistan remained the for some countries. Ethiopia, for example, top recipient of reconstruction and relief has received 80.5% of its humanitarian aid funding for the second year running. in this way over the last five years. FiGuRe 25: sHARes By types oF HumAnitARiAn Aid, 2005-2009 70% 60% Material relief assistance 50% and services Emergency food aid 40% Relief coordination; protection and support services 30% Reconstruction relief and rehabilitation Disaster prevention and preparedness 20% 10% 0% 2005 2006 2007 2008 2009 Note: The trends here show that, on average, around half of the humanitarian aid expenditure of OECD DAC members over the last five years has been spent on ‘material relief assistance and services’, which means shelter and immediate basic needs such as water and sanitation and medical assistance. Source: Development Initiatives based on OECD DAC 29
  • 34.
    seven CountRies inFoCus FiGuRe 26: inteRnAtionAl HumAnitARiAn Response to seven CountRies sinCe 2000 1,600 1,400 1st Sudan 2nd Palestine /OPT 1,200 1,000 US$ MILLION 800 3rd/5th Ethiopia 600 4th Afghanistan 5th/3rd Iraq 400 7th/8th Pakistan 200 21st/30th Haiti 0 2000 2001 2002 2003 2004 2005 2006 2007 2008 2009 Source: OECD DAC and UN OCHA FTS In countries where national governments 2nd pAlestine/opt 4tH AFGHAnistAn are unable to operate, humanitarian aid is the tool used to deliver basic services – Humanitarian aid to Palestine/OPT Humanitarian aid to Afghanistan peaked food, water, shelter and basic health care. has doubled since 2005, increasing in 2002 following the invasion in 2001, In some countries, such as Sudan, this is particularly sharply between 2008 levelled off between 2003 and 2007 and the case year in year out. In others, external and 2009. The humanitarian crisis rose steeply again in 2008 following support to meet these basic needs comes heightened following Israel’s blockade drought and a sharp rise in food prices. in ‘short’ bursts – such as is the case in of Gaza in 2007 and the military Afghanistan has experienced three Afghanistan, Iraq and Palestine/OPT, for offensive in December 2008. The decades of war. Despite the insecurity, example, where governments are plunged population has limited access to basic five million refugees have returned to into crisis and conflict. Other countries, provisions and services and is highly aid the country since 2002, increasing its such as Haiti and Pakistan, might pass dependent. Since 2000 just under 37% population by over 20% (UNHCR). The in and out of crises triggered by natural of total ODA has been in the form of UN reports continued insecurity, forced disaster and/or conflict, sometimes with humanitarian aid. displacement and violence against scarcely long enough in between for the civilians. The country is also periodically people affected to recover. subject to natural disasters including flooding, earthquakes and drought. It 1st sudAn 3Rd/5tH etHiopiA is the second largest recipient of ODA since 2000, receiving US$28.8 billion The largest recipient of international Ethiopia is the third largest recipient of over the period. Of this, 17.1% has been humanitarian aid over ten years humanitarian aid of the past five years in the form of humanitarian aid. (US$8.9 billion in total), Sudan (US$2.9 billion) and the fifth largest faces a mixture of complex security, (US$4.8 billion) over the past ten. The humanitarian, recovery and graph shows clear peaks following development challenges. Five years on severe droughts in 2003 and 2008. from the signing of the comprehensive Despite the importance of agriculture peace agreement (CPA), thousands of to its economy, the country suffers from people remain displaced, and in Darfur food insecurity, which is attributed to the crisis continues. More than 268,000 a mixture of natural disasters such people were newly displaced in 2010 as drought and floods, a growing alone and access to much of the region population and damaging land policies. remains limited. More than 3.5 million Internal and external conflicts have people are still receiving food aid. Since exacerbated the problems. Over 21% 2000, just over 60% of its total ODA has of Ethiopia’s total ODA has been in been in the form of humanitarian aid. the form of humanitarian aid over the past ten years. 30
  • 35.
    FiGuRe 27: wHAtHAs tHe money Been spent on? HumAnitARiAn Aid FRom oeCd dAC memBeRs, 2005-2009 mAteRiAl RelieF AssistAnCe disAsteR pRevention And pRoteCtion And suppoRt ReConstRuCtion RelieF RelieF CooRdinAtion; emeRGenCy Food Aid And ReHABilitAtion ApRepARedness And seRviCes seRviCes Afghanistan 29.7% 24.9% 4.1% 40.8% 0.5% ethiopia 17.5% 80.5% 1.2% 0.2% 0.6% Haiti 39.4% 24.3% 3.2% 28.2% 5.0% iraq 68.8% 2.8% 2.1% 24.1% 2.2% pakistan 66.3% 11.5% 3.0% 18.3% 0.9% palestine/opt 69.8% 17.3% 5.1% 7.6% 0.1% sudan 43.4% 49.2% 2.4% 4.9% 0.1% Source: OECD DAC Creditor Reporting System (CRS) 5tH/3Rd iRAQ 21st/30tH HAiti 7tH/8tH pAkistAn Iraq is the fifth largest recipient of Haiti is the twenty-first largest Pakistan is the seventh largest humanitarian aid over the past five years recipient of humanitarian aid since recipient of humanitarian aid since (US$2.3 billion) and the third largest 2005 (US$549 million) and the thirtieth 2005 (US$2.1 billion) and the eighth over the past ten (US$5.1 billion). largest since 2000 (US$652 million). largest since 2000 (US$2.4 billion). It Its humanitarian aid peaked at Political instability, weak economic has a complex humanitarian profile. US$1.3 billion in 2003. Between 2003 infrastructure, poverty and lack of It is classified as a middle income and 2007 needs became more sporadic preparedness have amplified the impact country but has the seventh highest and levels of humanitarian aid declined. of natural disasters on the population concentration of poor people globally In 2007 sectarian violence led to further of Haiti and their economic assets over – more than 60% of its 173 million population displacement and increased the past decade. The country is highly people live on less than US$2 a day. the need for assistance in 2008. Conflict aid dependent. Although the graph 37.6% of its total ODA over the past and sanctions have been the primary since 2000 shows only a few surges in ten years has been in the form of reasons for the country’s humanitarian humanitarian aid (in 2004, 2005 humanitarian aid. It suffers from crises over the last 30 years – war with and 2006 following hurricanes in 2004) repeated natural disasters including Iran in the 1980s, the first Gulf War and a spike following the devastating frequent flooding, storms, earthquakes following the invasion of Kuwait and the hurricane season in 2008, there have and droughts. The South Asia (Kashmir) latest conflict, which began in March been major fluctuations in the volume earthquake of 2005 killed more than 2003. While the latter did not result in a of humanitarian funding. Around 12.5% 70,000 people and followed severe country-wide humanitarian crisis, many of its total ODA has been in the form flooding that affected more than seven Iraqis and refugees from neighbouring of humanitarian aid over the past million. The 2010 flooding has been countries suffered. Minorities and ten years. even more overwhelming, affecting people caught up in the insurgency the lives of an estimated 20 million that started several months after the people. The significant political and war were particularly affected. It is the military events in the country and the largest recipient of ODA since 2000, region have compounded the effects 14.9% of which has been in the form of natural disasters, as they have often of humanitarian aid. At present the been played out in exactly the same country is in a transition between crisis geographic areas. The number of and recovery. The majority of ODA is More detailed profiles, and refugees in the country, though down contributing towards: reconstruction; humanitarian profiles of other from the peak of 2.2 million in 2001, governance and security; and social countries, are available at: remains at 700,000, the third largest infrastructure and services projects. www.globalhumanitarianassistance.org refugee population in the world. 31
  • 36.
    FiGuRe 28: donoRsHARes oF inteRnAtionAl HumAnitARiAn Response to tHe 20 lARGest ReCipients, 2005-2009 100% 90% 80% 70% 60% 50% 40% 30% 20% 10% 0% Sudan Palestine/OPT Ethiopia Afghanistan Iraq DRC Somalia Indonesia Pakistan Lebanon Sri Lanka Kenya Zimbabwe Uganda Chad Jordan Myanmar Burundi Haiti Liberia Private Non-OECD DAC governments OECD DAC members Source: OECD DAC and UN OCHA FTS sAme ReCipients, sAme donoRs? Our overall analysis of international Each of these has been the subject of a UN humanitarian aid to specific countries is appeal and/or has received funding through dominated by the large contributions made either the UN CERF or other financing by the OECD DAC members – particularly mechanisms. when viewing the trends over five and ten The 2010 data reveals that three recipient years (see Figure 6). countries that are not priorities for OECD But in recent years, engagement in funding DAC members appear as the top ten mechanisms and UN processes (see priorities for non-OECD DAC members and Section 1.3: ‘How does the funding get private contributors: Kyrgyzstan (subject there?”) has made the contributions from of a UN consolidated appeal process (CAP) other governments and private donors appeal following civil unrest), Guatemala more visible. (subject of a CAP appeal following food insecurity) and Chile (which received Different types of donor have different just over US$10 million in CERF funding priorities. Countries which have seen following an earthquake). increased flows from both private contributions and other governments Outside the large-scale emergencies, include Indonesia and Sri Lanka (in which attract public attention, other response to the Indian Ocean-earthquake/ governmental contributions can also be tsunami), Pakistan (South Asia significant for some recipients that do not earthquake), Myanmar (Cyclone Nargis), receive large volumes of funds from OECD Somalia, Palestine/OPT and Lebanon. DAC members. 32
  • 37.
    FiGuRe 29: FundinGRepoRted to un oCHA Fts FoR seleCted lARGe-sCAle emeRGenCies Pakistan floods (2010) Haiti earthquake (2010) Myanmar - Cyclone Nargis (2008) China earthquake (2008) South Asia earthquake (2008) 0% 10% 20% 30% 40% 50% 60% 70% 80% 90% 100% OECD DAC members Other governments Private funding Other Note: While OECD DAC members have provided the larger share of contributions to some of the larger emergencies of the last two years, their contributions following the China earthquake in 2008 were outstripped by other government and private contributions. This made China the top recipient of humanitarian funding from the two latter donor groups in 2008 and also made it the 10th largest recipient in terms of international humanitarian response that year. Source: UN OCHA FTS FiGuRe 30: top 10 ReCipients oF HumAnitARiAn Aid FRom memBeRs oF tHe oeCd dAC, otHeR GoveRnment donoRs And pRivAte ContRiButions As RepoRted to un oCHA Fts, 2010 oeCd dAC us$m otHeR us$m pRivAte us$m estimAted us$m memBeRs GoveRnments ContRiButions inteRnAtionAl HumAnitARiAn Response 1 Pakistan 2,180 1 Pakistan 356 1 Haiti 1,233 1 Haiti 3,384 2 Haiti 1,981 2 Haiti 170 2 Pakistan 338 2 Pakistan 2,874 3 Sudan 1,154 3 Yemen 14 3 Chile 17 3 Sudan 1,159 4 Ethiopia 583 4 Afghanistan 11 4 Kyrgyzstan 6 4 Ethiopia 588 5 Afghanistan 563 5 Kyrgyzstan 9 5 Chad 4 5 Afghanistan 574 6 DRC 494 6 Niger 5 6 Kenya 3 6 DRC 497 7 Palestine/OPT 319 7 Chile 5 7 Sri Lanka 3 7 Palestine/OPT 322 8 Niger 297 8 Sudan 5 8 Niger 2 8 Niger 305 9 Somalia 276 9 Chad 4 9 Guatemala 2 9 Somalia 278 10 Zimbabwe 248 10 DRC 4 10 Palestine/OPT 2 10 Zimbabwe 253 Note: While OECD DAC members have provided the larger share of contributions to some of the larger emergencies of the last two years, their contributions following the China earthquake in 2008 were outstripped by other government and private contributions. This made China the top recipient of humanitarian funding from the two latter donor groups in 2008 and also made it the tenth largest recipient in terms of international humanitarian response that year. Source: UN OCHA FTS 33
  • 38.
    Figure 31, whichranks the largest This engagement can give additional recipients of contributions from non-OECD perspective to the overall numbers. DAC governments over the last five years Although global volumes from other from left to right, shows the contribution governments are relatively small, within of other donors to these same crises. individual countries they are significant. It clearly shows the importance of their In addition to providing a more inclusive contributions to Bangladesh, China, Yemen, and comprehensive view of volumes of Syria, Maldives (Indian Ocean-earthquake/ humanitarian assistance, the increased tsunami), Tajikistan and Mauritania relative visibility of flows from all contributors to OECD DAC members and private helps to provide new perspectives on the contributions. It also shows engagement assistance provided to people living in (increasingly through UN mechanisms) in crises – its coordination, the structures Pakistan, Palestine/OPT, Sudan, Ethiopia, used to channel it and the effectiveness Somalia and Niger. of its delivery. FiGuRe 31: top 20 ReCipients oF HumAnitARiAn Aid FRom GoveRnments tHAt ARe not memBeRs oF tHe oeCd dAC, 2005-2009, And sHARes oF otHeR donoR Response to tHe sAme CountRies 100% 90% 80% 70% 60% 50% 40% 30% 20% 10% 0% Pakistan Palestine/OPT Sudan Bangladesh Lebanon China Yemen Syria Maldives Indonesia Sri Lanka Ethiopia Myanmar Somalia Iraq Afghanistan Tajikistan Mauritania Niger Liberia Private OECD DAC members Non-OECD DAC governments Note: Some of these recipients are also donors, providing humanitarian assistance to the other countries, sometimes in the same year. In 2008 for example, China provided US$9 million in humanitarian aid, US$5.7 million of this to Myanmar. Source: OECD DAC and UN OCHA FTS 34
  • 39.
    THE STORY Just over50% of the humanitarian aid expenditure of OECD DAC members over CREDIT the past five years has been spent on material relief assistance and services © Ton Koene such as water and sanitation and medical assistance. In this photo, taken just outside Muyenga, Burundi, children fetch water from the local well in small jerrycans. In 2010 nearly 820 million people around the world still had no access to decent water supplies. 35
  • 40.
    INTERNATIONAL RED CROSS& GOVERNMENTS RED CRESCENT MOVEMENT NGOs International Committee of the Red Cross International Federation of Red Cross and Red Crescent International Societies International INFORMATION National societies FINANCE National Local branches National Local Local PRIVATE DONORS Philanthropic organisations Individuals Peacekeeping International MILITARY Corporate donors National WFP UNHCR Family Local community UNICEF UNRWA Faith-based and Diaspora civil society organisations WHO FAO COMMUNITY UN OCHA COORDINATION HUMANITARIAN AID NETWORK This map is illustrative and intends to show the main groups of people involved in humanitarian crises. It is not comprehensive, nor does it intend to suggest linear connections or funding relationships. 36
  • 41.
    1.3 How doestHe FundinG Get tHeRe? FiGuRe 32: How miGHt donoRs CHAnnel FundinG to CRises? donoRs miGHt ... ... directly fund the ... respond to funding ... choose to directly ... provide ... contribute to pooled actors who will appeals issued by fund multilateral unearmarked funding humanitarian funds, deliver humanitarian organisations who organisations, including directly to multilateral which are managed programmes deliver aid UN agencies, which organisations, by multilateral and aid, often NGOs to beneficiaries, or will in many cases pass which may allocate and agencies, but which and the International umbrella groups a proportion of funds spend them at their channel funds onwards Red Cross and Red and structures on to international discretion, including to other Crescent Movement, representing these and national NGOs to on humanitarian multilateral agencies, through bilateral delivery agencies such deliver humanitarian programmes ... local and international funding agreements ... as the UK Disasters goods and services NGOs to implement Emergency Committee directly to affected activities. or UN humanitarian communities, in appeals... another tier of financial contracting ... Source: Development Initiatives Route And RAtionAle In 2009, US$12.1 billion of the international channel their funds to crises, including: humanitarian financing response could multilateral agencies (e.g. UN agencies/ be traced through the humanitarian programmes/funds, the World Bank), aid system to first-level recipient non-governmental organisations (NGOs) delivery agencies. OECD DAC member and civil society groups, the International governments provided 93.4% of the total, Red Cross and Red Crescent Movement, other governments 4.6% and private the public sector (which includes the donors 1.6%. government agencies of both recipient and private sector organisations). Humanitarian aid donors face a range of possible options in considering how to FiGuRe 33: FiRst-level ReCipients oF inteRnAtionAl HumAnitARiAn Response, 2006–2009 100% Other 90% Multilateral organisations 80% Red Cross/Crescent NGOs and civil society 70% Public sector 60% 50% 40% 30% 20% 10% 0% 2006 2007 2008 2009 Note: ‘Other’ includes private sector organisations and data that has not been attributed to any category. Source: Development Initiatives based on OECD DAC Creditor Reporting System (CRS) for governments that report to the OECD DAC and UN OCHA Financial Tracking Service (FTS) data for all other governments and private funding sources 37
  • 42.
    The choices thatdonors make about how funds through humanitarian pooled funds to channel their funds reflect not only managed by multilateral agencies. Sudan policy and administrative considerations at and DRC, for example, have large common the global level; they are also a product of humanitarian funds (CHFs), which in 2009 relationships between donors and different received US$133 million and US$99 million delivery channels in each particular crisis. respectively. Channelling funds through multilateral Ethiopia and Somalia in particular each agencies and NGOs rather than through received a relatively high proportion of the public sector, for example, may indicate total official humanitarian aid – over 30% that donors have greater confidence in the – via NGOs and civil society. capacity and/or neutrality of these actors to deliver humanitarian assistance. In contrast with the other top ten recipients, which received less than 14% Sudan, Palestine/OPT, Iraq, Democratic of their humanitarian aid via the public Republic of Congo (DRC), Somalia and sector, 28.5% of total official humanitarian Lebanon all received more than 60% aid to Afghanistan was channelled through of their total official humanitarian aid the public sector in 2009. This category, through multilateral organisations in however, includes the public sectors of 2009. In Palestine/OPT, 84.6% of total both the donor and the recipient country official humanitarian aid in that year and therefore includes humanitarian aid was channelled through multilateral delivered directly by donor governments. agencies, reflecting the dominant role In 2009, 20.8% of the humanitarian aid of the UN Relief and Works Agency for attributed to public sector delivery in Palestinian refugees (UNRWA) in delivering Afghanistan was delivered by the United humanitarian aid in that crisis. In several States Department of Defense (DOD) and other crises, the high proportion of funds the Spanish government’s civil-military channelled through multilateral agencies Provincial Reconstruction Team (PRT). was in part a product of donors channelling FiGuRe 34: CHAnnels oF deliveRy FoR tHe top 10 ReCipients oF totAl oFFiCiAl HumAnitARiAn Aid, 2009 100% Other 90% Multilateral organisations 80% NGOs and civil society 70% Public sector 60% 50% 40% 30% 20% 10% 0% Sudan Palestine/OPT Ethiopia Afghanistan Iraq DRC Pakistan Indonesia Somalia Lebanon Source: Development Initiatives based on OECD DAC CRS 38
  • 43.
    multilAteRAl oRGAnisAtions Multilateral organisationsregularly receive The prominence of a number of the largest share of the international multilateral agencies as leading channels humanitarian response funding. Between of delivery of humanitarian aid can 2008 and 2009, their share increased from be explained in part by the volumes 57.1% to 61.7%. (Interpreting trends for of humanitarian funds that are donor earlier years is problematic as significant contributions to pooled funds routed volumes of funds were not accurately via these agencies. The United Nations attributed but were reported as ‘other’). Development Programme (UNDP) administers CHFs, the UN Office for The World Food Programme (WFP), the the Coordination of Humanitarian Office of the UN High Commissioner Affairs (OCHA) manages emergency for Refugees (UNHCR) and UNRWA response funds (ERFs) and the Central are frequently the leading multilateral Emergency Response Fund (CERF), and recipients, receiving multilateral (totally the World Bank manages a number of unearmarked) official development reconstruction-focused multi-donor trust assistance (ODA) for humanitarian activities funds (MDTFs). as well as humanitarian aid through bilateral agreements with donors. In 2006, for example, of the US$198 million of humanitarian funds channelled through The volumes of government humanitarian the World Bank, US$84 million was aid channelled through WFP increased routed via the Indonesia MDTF and dramatically between 2007 and 2008 US$21 million through the South Sudan (from US$1.6 billion to US$3.3 billion) in MDTF for reconstruction relief projects. response to widespread food insecurity and the global food price crisis. Significant A proportion of donor contributions amounts of emergency food aid were channelled via pooled funds is allocated to received in Sudan, Ethiopia, Somalia multilateral agencies, but some of it is not. and Afghanistan that year. UN agencies receive all funds channelled through the UN CERF (though they may A proportion of the funds channelled sub-contract a proportion of this on again through several multilateral agencies, to NGOs), but they receive only a proportion however, are donor contributions to – 54.8% (US$141 million) in 2009 and 54.1% humanitarian and, in some instances, (US$188 million) in 2010 – of the funds reconstruction pooled funds. Donor channelled through the CHFs and ERFs. The contributions to pooled humanitarian balance of humanitarian funds channelled funds were equivalent to 9.6% of the total through humanitarian pooled funds is international humanitarian response funds received by local and international NGOs. channelled via multilateral agencies in 2009. FiGuRe 35: top Five multilAteRAl oRGAnisAtion ReCipients oF HumAnitARiAn Aid FRom GoveRnments, 2006–2009 (us$ Billion) 2006 2007 2008 2009 WFP 1.5 WFP 1.7 WFP 3.3 WFP 3.1 UNHCR 0.9 UNHCR 1.0 UNHCR 1.3 UNHCR 1.5 UNDP 0.5 UNRWA 0.4 UNRWA 0.5 UNRWA 0.7 UNRWA 0.3 UNDP 0.3 UNDP 0.4 UNDP 0.4 World Bank group 0.2 UN OCHA 0.3 UNICEF 0.3 UN OCHA 0.4 Source: Development Initiatives based on OECD DAC CRS for OECD DAC donors and OCHA FTS for non-OECD DAC donors 39
  • 44.
    non-GoveRnmentAl oRGAnisAtions NGOs werethe second largest first-level The share received by local NGOs recipient grouping and received 17.3% remained static at around 5% of the total (US$2.1 billion) of the international volume channelled through country-level humanitarian response in 2009, an humanitarian pooled funds in 2009 and increase from their 2008 share of 15.2% 2010, though the volume they received (US$1.9 billion). Humanitarian funding increased from US$14 million in 2009 provided by governments to NGOs to US$18 million in 2010. demonstrates a strong preference for NGOs cannot receive funds directly funding international NGO (INGOs). In from the CERF, and less than half of the 2009, INGOs received 67.5% of first-level funding channelled through CHFs and recipient funding channelled via NGOs ERFs is received by NGOs. International compared with just 1.9% received by local NGOs received US$65 million through NGOs (the balance was not attributed to CHFs in 2009 and US$85 million in 2010, any category). a 3% increase in their share of the total. In addition to funds received directly from International NGOs received US$36 million donors, the second-level funds that NGOs through ERFs in 2009 and US$49 million receive through UN agencies and pooled in 2010; however, this represented a 10.7% humanitarian funds also need to be taken decrease in their share of the total. into consideration. While we have little Local NGOs received US$9 million via CHFs information on the funds contracted to in 2010 compared with US$4 million in NGOs from UN agencies, we do have data 2009, which represented a doubling of their on the funds that NGOs receive via pooled share of the total, from 1.8% to 3.8%. The humanitarian funds. type of funding mechanism that channelled International NGOs received US$134 the most directly through local NGOs was million in funding via CHFs and ERFs in the ERF. However, volumes declined from 2010, an increase from US$101 million US$11 million in 2009 to US$9 million in in 2009. The share of the total received 2010, an 8.4% reduction in local NGOs’ by INGOS fell slightly, however, from 39% share of total ERF funds. of the total in 2009 to 38.7% in 2010. FiGuRe 36: CompARison oF CHF And eRF FundinG CHAnnelled to un AGenCies, loCAl And inteRnAtionAl nGos, 2009 And 2010 100% Other 90% Local NGOs 80% International NGOs UN 70% 60% 50% 40% 30% 20% 10% 0% 2009 2010 2009 2010 ERF CHF Source: Development Initiatives based on UN OCHA FTS and OCHA Ethiopia 40
  • 45.
    inteRnAtionAl Red CRossAnd Red CResCent movement The third largest first-level recipient of directly from governments and private international humanitarian financing sources, it does not typically receive funds response in 2009 was the Red Cross and channelled via multilateral agencies or Red Crescent Movement, which received pooled humanitarian funds. Some Red US$1.1 billion, 8.7% of the total. This Cross and Red Crescent societies have represented an increase in both its volume developed distinct mechanisms for income and share of the total, up from US$1billion generation independent of the international (7.8%) in 2008. humanitarian system. While the International Red Cross and Red Crescent Movement receives funds tHe inteRnAtionAl Red CRoss And Red CResCent movement The International Red Cross and Red 186 national societies remain a largely Private contributions account for the Crescent Movement, which is made up unknown humanitarian player. The largest share of the study-set societies’ of the International Federation of the Red immense variety of their mandates, income, providing at least 41.3% of Cross and Red Crescent Societies (IFRC), activities and structures, together with the total in 2009 and 2010. But what the International Committee of the Red the large number of existing national is particularly striking is that income Cross (ICRC) and 186 national societies, societies, poses a considerable challenge generation activities provide almost is the world’s largest emergency to any comprehensive and comparable a quarter of their income, and exceed response network. analysis of their humanitarian financing. contributions from government donor sources. The contrast with ICRC funding, The ICRC alone raises over US$1 billion Between April and May 2011, the 90.7% (average 2006–9) of which comes every year from a variety of funding Global Humanitarian Assistance (GHA) from governments, illustrates the very sources, including government donors, programme conducted an exercise diverse nature of the Red Cross and Red private funding and national societies. to collect data on the income and Crescent Movement. However, while the humanitarian expenditure of 12 national societies activities and financing of the ICRC and and received information from six IFRC have been widely studied, the – the Belgian, British, Canadian, Danish, French and Swedish. FiGuRe 37: souRCes oF HumAnitARiAn FinAnCinG inCome FoR six Red CRoss nAtionAl soCieties, 2009–2010 16.4% US$162m 18.0% US$177m 24.3% Governments US$239m 16.4% Private individuals US$162m Income generating activities 18.0% Other US$177m 24.3% Governments US$239m Private individuals Income generating activities 41.3% Other US$407m 41.3% US$407m Source: Development Initiatives based on data provided by the Belgian, British, Canadian, Danish, French and Swedish Red Cross Societies 41
  • 46.
    donoR FundinG CHoiCesBeyond tHe oeCd dAC The funding choices made by OECD DAC DAC governments – and a relatively low members, which provide the majority of proportion via NGOs: just 1.5% in 2009. international humanitarian aid financing, While they have traditionally favoured dominate overall trends. But the practices bilateral channels of delivery, their and preferences of government donors contributions to multilateral institutions outside of the OECD DAC group (‘other and funds have also been growing. government donors’ or non-OECD DAC Contributions to humanitarian pooled governments’) and private donors diverge funds – which are useful mechanisms from the DAC member governments where donors might not have experience and are worth considering separately. or in-country capacity themselves to direct Moreover, non-OECD DAC governments funds bilaterally – have increased. Indeed, and private donors have a growing stake in in 2010, their contributions to humanitarian humanitarian aid financing as the volumes pooled funds grew from 0.5% in 2009 to they collectively contribute continue to grow. 11.4% of total donor contributions in 2010. Non-OECD DAC governments are more They reported contributions of US$91 likely to channel their funds through the million to ERFs in 2010 to the FTS, in sharp public sector (which includes both the contrast with the only other contributions government of the recipient country and reported by other governments of less than the donor government). In 2009 non-OECD US$0.5 million in 2007 and 2008. Their DAC government donors channelled 21.6% contributions to the CERF, meanwhile, of their funds through the public sector, increased from US$3.7 million in 2009 in contrast to only 8.6% of OECD DAC to US$7.3 million in 2010, including government funds. contributions from ten new government donors: Russia, Ukraine, Central African They also channel a higher proportion Republic (CAR), Singapore, Madagascar, of their funding via the International Costa Rica, Panama, Georgia, Tajikistan Red Cross and Red Crescent Movement and St Lucia. – 24% compared with 8.1% for OECD FiGuRe 38: pRopoRtion oF HumAnitARiAn FundinG FRom non-oeCd dAC donoR GoveRnments CHAnnelled to FiRst-level ReCipients, 2006–2009 100% Other 90% Multilateral organisations 80% Red Cross/Crescent NGOs and civil society 70% Public sector 60% 50% 40% 30% 20% 10% 0% 2006 2007 2008 2009 2010 Source: UN OCHA FTS 42
  • 47.
    FiGuRe 39: HumAnitARiAnFinAnCinG FRom pRivAte souRCes, 2000–2010 5 Other Multilateral organisations Red Cross/Crescent 4.2 NGOs and civil society Public sector 4 Total 3 US$ BILLION 2 1.6 1 0.2 0.2 0.1 0.1 0.1 0.1 0.0 0.0 0.1 0 2000 2001 2002 2003 2004 2005 2006 2007 2008 2009 2010 Source: Development Initiatives based on UN OCHA FTS In most of the years when there was no particular is proving increasingly popular large-scale natural disaster, private donors as a recipient of financing from private appear to have favoured multilateral sources. The number of private donors to agencies as first-level recipients of funding. the CERF increased from just two in 2006 With the exception of three years (2004, to 20 in 2010, not including private donors 2005 and 2010), multilateral agencies via the UN Foundation, while the volume of have received between 40% and 95% of private contributions increased from less private funds. In 2004, an emergency than US$1 million each year between 2006 funding appeal issued for Darfur and Chad and 2009 to US$4.4 million in 2010. The by the UK-based Disasters Emergency number of private donors contributing to Committee (DEC) raised US$58 million in the CERF increased from just nine in 2009 contributions, 98.6% of the total private to 20 in 2010, with average contributions funds channelled through NGOs in that increasing from around US$50,000 in 2009 year. In 2005 and 2010, when major to US$200,000 in 2010. natural disasters occurred, NGOs were the Private contributions of US$0.5 million to preferred channel of delivery, receiving ERFs were reported in 2006 and 2008 and 68% (US$2.8 billion) of private funds in of US$0.4 million in 2010. However, private 2005 and 34.3% (US$558 million) in 2010. donors remain an unpredictable source Private donors are also increasingly of funding: not one private contributor channelling funding through pooled has given money to the CERF consistently humanitarian funds, and the CERF in between 2006 and 2010. 43
  • 48.
    FinAnCinG meCHAnisms • The UN’s Central Emergency Response Fund (CERF) allows donor governments and the private sector to pool their financing on a global level to enable more timely and reliable humanitarian assistance to people affected by natural disasters and armed conflicts. • Common humanitarian funds (CHFs) are in-country pooled mechanisms. Funding received is totally unearmarked. This allows money to be allocated on the basis of needs (as defined in the emergency’s humanitarian action plan). • Emergency response funds (ERFs) are also country-level mechanisms. They differ from CHFs in that they have the facility to provide finance to small-scale projects, allowing more national NGOs to access resources directly rather than via UN agencies. The total volume of funds channelled Contributions to the UN CERF fund rose through pooled humanitarian funds, by 9.4% in 2010, after a substantial including country-level CHFs and ERFs and reduction in contributions in 2009. the global CERF, grew from US$583 million Contributions to the CERF were received in 2006 to US$853 million in 2010, which from a record 103 donors in 2010. represented 8.4% of total international donoRs humanitarian aid to recipient countries that year. The share of total humanitarian aid OECD DAC member governments to recipient countries channelled through provide the majority of funding to pooled pooled humanitarian funds has not altered humanitarian funds and the volumes they significantly, however, since the inception provide have remained relatively stable of the first funds in 2006, remaining within – between US$708 million and US$747 a range between 7.1% and 9.3% of the total million each year since 2007. Their share funds channelled to recipient countries of the total funding decreased, however, across the five-year period. from 99.4% in 2009 to 87.4% in 2010, as an increasing number and range of other The sharp increase in funding to ERFs government and private donors contributed in 2010 reflects the dramatic growth in to ERFs and the CERF. contributions to the Haiti and Pakistan ERFs, which together received the The share of contributions from other equivalent of 71.7% of the total funds government donors grew from 0.5% contributed to ERFs in that year. The (US$4 million) in 2009 to 11.4% (US$98 growth in funds to CHFs is attributable to million) in 2010, largely in contributions the creation of a new country-level fund to the Haiti and Pakistan ERFs. The share for Somalia in March 2010. of private donors to humanitarian pooled FiGuRe 40: totAl FundinG to pooled Funds, 2006–2010 429 2010 261 164 392 2009 243 85 453 2008 295 120 385 2007 284 43 299 CERF 2006 263 CHFs 21 ERFs US$ MILLION Source: Development Initiatives based on UN OCHA FTS and UN CERF 44
  • 49.
    FiGuRe 41: ContRiButionsto pooled HumAnitARiAn Funds By donoR type, 2006–2010 (us$ million) 747 98 2010 4.8 5.0 712 2009 3.9 744 3.8 2008 1.4 15.0 708 2007 5.0 577 2006 5.0 0% 100% OECD DAC donors Private organisations and individuals Non-OECD DAC donors Other Source: Development Initiatives based on UN OCHA FTS and UN CERF funds, while overall relatively small, increased their contributions by more also experienced an increase, from than US$10 million: Norway provided 0.1% (US$0.5 million) in 2009 to 0.6% an additional US$29 million and Spain an (US$5 million) in 2010, principally in additional US$13 million to humanitarian contributions to the CERF. pooled funds in 2010. The United States is an irregular contributor to humanitarian Among the individual donors contributing pooled funds. It made no contributions to pooled humanitarian funds, the United in 2009 but gave US$10 million in 2010. Kingdom remained the leading donor in both 2009 and 2010. Three of the leading Two other government donors made donors reduced their contributions to significant contributions to humanitarian humanitarian pooled funds in 2010: the pooled funds in 2010, and entered the ranks Netherlands by US$29 million, Ireland of the top 15 donors. Saudi Arabia gave by US$20 million and Sweden by US$1 US$50 million to the Haiti ERF and India million. Two of the donors that were top gave US$20 million to the Pakistan ERF ten contributors in both 2009 and 2010 and US$0.5 million to the CERF. FiGuRe 42: sHARes oF HumAnitARiAn Aid spent tHRouGH pooled HumAnitARiAn Funds By tHe leAdinG donoRs in 2010 200 60% 180 50% 160 140 40% 120 US$ MILLION 100 30% 80 20% 60 40 10% 20 0 0% Belgium Spain Saudi Arabia Canada Denmark Germany Ireland India Australia Finland United States Norway Netherlands United Kingdom Sweden Total channelled through financing mechanisms % of humanitarian aid Source: Development Initiatives based on UN OCHA FTS, UN CERF and preliminary and partial OECD DAC data 45
  • 50.
    FiGuRe 43: pooledFunds As A sHARe oF tHe totAl inteRnAtionAl HumAnitARiAn Response to tHe top 10 ReCipient CountRies 1600 60% Other international humanitarian aid Humanitarian aid channelled 1400 50% through pooled funds 1200 Pooled funds as % of total international humanitarian response US$ MILLION 40% 1000 800 30% 600 20% 400 10% 200 0 0% Sudan DRC Somalia Ethiopia Zimbabwe Kenya Sri Lanka DPRK Philippines Niger Source: Development Initiatives based on OECD DAC, UN OCHA FTS and UN CERF ReCipients emergencies, meaning that the profile of funding recipients shifts year by year to The largest volumes of funding disbursed include new or rapidly deteriorating crises. via pooled humanitarian funds were concentrated in several of the world’s Finally, the CERF policy of targeting part worst protracted humanitarian crises, of its funds to ‘under-funded emergencies’ which have country-level pooled funds as means that some recipients that do not well as being recipients of CERF funding feature prominently among the leading – Sudan, DRC and Somalia. recipients of bilateral donor funding may appear as significant pooled funding However, the CERF also has the flexibility to recipients. The Democratic People’s quickly channel funds to rapid-onset acute Republic of Korea (DPRK), for example, FiGuRe 44: top 10 ReCipients oF CeRF FundinG, 2006–2010 (us$ million) 2006 2007 2008 2009 2010 DRC 38.0 DRC 52.5 DRC 41.1 Somalia 60.5 Pakistan 39.8 Afghanistan 32.3 Bangladesh 26.7 Ethiopia 31.5 DRC 30.4 Haiti 36.6 Kenya 27.2 Sudan 25.5 Myanmar 28.4 Zimbabwe 26.8 Niger 35.0 Sudan 25.5 Somalia 15.7 Kenya 26.0 Kenya 26.3 DRC 29.1 Somalia 16.6 Uganda 13.0 Pakistan 18.7 Sudan 25.8 Sudan 22.2 Sri Lanka 10.0 Ethiopia 12.4 Afghanistan 18.2 Sri Lanka 23.5 Chad 21.6 Ethiopia 10.0 Mozambique 12.2 Haiti 16.0 DPRK 19.0 Kenya 20.0 Chad 9.4 Zimbabwe 12.0 Sudan 16.0 Ethiopia 15.6 Ethiopia 16.7 Eritrea 5.9 DPRK 11.1 Nepal 12.6 Philippines 11.9 Sri Lanka 15.7 Côte d’Ivoire 5.8 Sri Lanka 10.9 Sri Lanka 12.5 Niger 11.7 Yemen 14.5 % of total 70% 55% 52% 63% 61% total top 10 180.6 192.0 221.2 251.7 251.3 total 259.3 350.9 428.8 397.4 415.2 recipients Source: Development Initiatives based on UN CERF 46
  • 51.
    FiGuRe 45: ReCipientsoF FundinG tHRouGH eRFs, 2006–2010 170 162.6 160 2010 150 2009 140 2008 130 2007 120 2006 110 100 87.4 US$ MILLION 90 80 70 60 52.8 50 40 36.6 28.7 30 19.4 20 12.0 10 9.3 6.3 5.2 3.5 2.6 3.0 2.6 0.9 0.1 0 Ethiopia Haiti Somalia Pakistan Iraq Palestine/OPT CAR Zimbabwe Afghanistan Indonesia Colombia Myanmar Yemen Kenya Uganda Nepal Source: Development Initiatives based on UN OCHA FTS received US$19 million through the CERF There were 16 ERFs in 2010, including under-funded emergencies funding window two new funds in Pakistan and Yemen. in 2009, which represented a 34% share Contributions to the ERF in Pakistan were of the country’s total humanitarian aid the largest ever received by an emergency that year and made it the eighth largest fund in its inception year and were given recipient of pooled humanitarian funding. in response to the needs arising from the devastating floods of July/August 2010. In 2009 Sudan and DRC, which hosted the largest country-level funds, were The ERF in Haiti received the most the leading overall recipient countries money overall in 2010 – US$82 million, in of pooled funding. Somalia and Ethiopia, response to the earthquake in January. This both of which had country-level ERFs accounted for 7.3% of total appeal funding. (which typically channel smaller volumes The distinctions between ERFs and of funds and issue smaller-value grants CHFs are not always clear-cut. ERFs to partners), were the third and fourth more typically receive relatively small largest recipients. However, each of these volumes of funds and award small grants four countries, in addition to having large to meet unforeseen emergency needs country-level pooled funds, was also a top and funding gaps. CHFs are mechanisms ten recipient of CERF funding. to allow humanitarian coordinators to The CERF remains a significant source fund strategically within country-level of humanitarian financing for protracted humanitarian workplans, and handle crises. DRC, Sudan, Sri Lanka and Ethiopia overall larger volumes of funds and award appeared in the top ten recipients of CERF larger grants than ERFs. The largest funding each year between 2006 and 2010 recipient of ERF funding between 2006 and together received 25.1% of total CERF and 2010 was Ethiopia, by a wide margin. funding over the five-year period. DRC was Ethiopia, however, has not participated in the top recipient in 2006, 2007 and 2008. the UN consolidated appeals process (CAP), In 2009 the top recipient was Somalia, has not therefore regularly generated which received US$60.5 million, the largest a multi-sector humanitarian workplan amount ever disbursed to a single country. (although in 2010 a joint government and partners’ humanitarian requirements plan In 2010, the leading recipients of CERF was produced) and does not have a related funds corresponded with natural disasters CHF. The Ethiopia ERF has some, but not in Pakistan and Haiti and the severe food all, of the characteristics of a CHF. The ERF crisis in Niger. in Somalia, meanwhile, graduated to a full CHF in 2010. 47
  • 52.
    FiGuRe 46: ReCipientsoF FundinG tHRouGH CHFs, 2006–2010 2006 2007 Somalia 2008 2009 2010 CAR DRC Sudan 0 20 40 60 80 100 120 140 160 180 US$ MILLION Source: Development Initiatives based on UN OCHA FTS Funding channelled to recipient countries to the country cannot yet be determined via CHFs increased overall in 2010, but but contributions to the CHF, of US$21 this was due to the conversion of the million in 2010, were greater than the Somalia ERF to a CHF in mid-2010. Overall, contributions channelled via the earlier funding for the remaining CHFs showed ERF, which recorded peak contributions a downward trend in 2010. of US$13.4 million in 2009. The Sudan CHF is the largest such fund, There are, moreover, some indications receiving a total of US$742 million in donor that the creation of the Somalia CHF has contributions between 2006 and 2010. significantly influenced the funding choices Funding to the Sudan CHF increased in of some donors. Ireland, Italy and Finland 2010 by 8.9% to US$133 million, but this contributed to pooled funds in Somalia followed a four-year downward trend and for the first time in 2010 (they did not funding levels in 2010 were US$39 million contribute to the earlier ERF), and in fact lower than in the peak year of 2006. this represented the first time that each of these donors had contributed to any CHF. Funding for the DRC CHF declined Finland reported US$2 million contributed by 10.8% between 2009 and 2010. At to UN agencies in 2009 to the FTS, but in US$99 million, funding was US$44 million 2010 it did not report any funding to UN lower than in the peak year of 2008. The agencies, instead contributing US$3 million smallest fund, in CAR, received US$11 to the CHF. The Netherlands channelled million in 2009 but experienced a US$2 money only to the CHF in 2010, whereas million fall in contributions in 2010, in 2009 it supported the ERF, Oxfam Novib to just US$9 million. and four UN agencies. The Somalia CHF was introduced in June 2010. The influence of the creation of a CHF on overall humanitarian funding levels 48
  • 53.
    militARy Governments have a long tradition of international development activities’. Only using their own militaries as a ‘channel some of the costs of deploying military of delivery’ for their humanitarian aid, resources for humanitarian activities are particularly in response to major considered allowable as ODA under the natural disasters. In response to the OECD DAC criteria: these are, broadly, the earthquake in Haiti in January 2010, additional costs incurred in excess of the 42 governments deployed military assets costs of keeping personnel on base. Some or troops to support the relief effort. The governments choose not to report any of relative importance of military actors as the costs of their military humanitarian agents for delivering humanitarian aid, activities as ODA at all. Moreover, even however, is not always revealed in existing when this spending is reported, it is often humanitarian aid data, while other parts of extremely difficult to detect within the the contributions channelled via military data, as its military character may not be actors are delivered outside of the financial explicitly referred to in descriptions of the tracking mechanisms of the international activity reported to the OECD DAC. humanitarian aid system. By far the largest provider of military Charging military involvement in humanitarian aid reported as ODA to the humanitarian aid to aid budgets is OECD DAC is the United States. However, somewhat controversial. The UN’s ‘Oslo humanitarian aid channelled through the Guidelines’ on the use of military and civil US Department of Defense (DOD) includes defence assets (MCDA) in disaster relief not only assistance directly implemented state, for example, that, ‘In principle, the by the US military; the US DOD is also a costs involved in using MCDA on disaster donor in its own right, sub-contracting relief missions abroad should be covered large volumes of funds to third party by funds other than those available for implementing partners. FiGuRe 47: HumAnitARiAn Aid CHAnnelled viA donoR deFenCe AGenCies RepoRted to tHe oeCd dAC, 2005–2009 400 Australia Austria Belgium 358 Canada 350 Denmark Finland Germany Greece 300 Ireland Korea Norway Portugal US$ MILLION (CONSTANT 2009 PRICES) 250 234 United States 200 200 150 150 122 100 50 0 2005 2006 2007 2008 2009 Source: Development Initiatives based on OECD DAC CRS data 49
  • 54.
    FiGuRe 48: HumAnitARiAnContRiButions FRom militARy ACtoRs RepoRted to un oCHA Fts, 2005–2010 100% 700 United States Netherlands 607.6 Suriname Germany 90% 600 Indonesia Switzerland 80% Czech Republic Italy 500 United Kingdom France 70% Spain Sweden 60% Greece Ireland US$ MILLION 400 Belgium Denmark 50% Turkey 300 40% Total funds reported 30% 200 20% 183.1 100 10% 1.2 0.8 8.0 4.8 0% 0 2005 2006 2007 2008 2009 2010 Source: Development Initiatives based on UN OCHA FTS Some of the additional financial ODA corresponds closely with security contributions made via military actors are crises where major donors have military captured within the UN OCHA FTS, though personnel deployed – notably in Afghanistan the overwhelming majority are reported as and Iraq. descriptions of in-kind goods and services. Military humanitarian responses to natural Humanitarian aid channelled via military disasters are reflected to a more limited actors that is reported as ODA to the extent in the ODA data. The responses to OECD DAC appears to be spent in different the Pakistan earthquake in 2005 and to situations from aid that is reported to Cyclone Nargis in Myanmar in 2008 received the FTS. The humanitarian aid delivered significantly less humanitarian aid via by military actors that is reported as military actors than Afghanistan and Iraq. FiGuRe 49: ReCipients oF HumAnitARiAn Aid CHAnnelled viA militARy ACtoRs (us$million) 2005 2006 2007 2008 2009 Iraq 73.9 Pakistan 84.6 Afghanistan 48.1 Afghanistan 96.1 Afghanistan 29.3 Afghanistan 15.1 Afghanistan 24.8 Iraq 42.1 Iraq 40.3 Iraq 10.9 Pakistan 9.3 Lebanon 13.3 Lebanon 1.8 Myanmar 12.7 Georgia 9.0 Guatemala 4.0 Iraq 6.9 Serbia 1.6 China 2.1 Kosovo 2.6 Serbia 1.6 Indonesia 6.5 Pakistan 0.5 Georgia 1.6 Myanmar 2.3 Source: Development Initiatives based on OECD DAC CRS 50
  • 55.
    FiGuRe 50: RepoRtedReCipients oF HumAnitARiAn Aid CHAnnelled viA militARy ACtoRs 100% 700 Afghanistan Lebanon 608.1 Bangladesh Morocco 90% 600 Chile Myanmar 80% Georgia Niger 500 Guatemala Pakistan 70% Haiti Philippines 60% Indonesia Portugal US$ MILLION 400 Iraq South Asia region 50% Sri Lanka Jordan 300 40% Total funds reported 30% 183.1 200 20% 1.2 100 10% 0.8 8.0 4.8 0% 0 2005 2006 2007 2008 2009 2010 Source: Development Initiatives based on UN OCHA FTS Humanitarian aid provided via military US$70 million in response to flooding in actors that is reported to the UN OCHA Pakistan and US$11 million in response FTS corresponds more clearly with major to the Chile earthquake. natural disaster events. In 2005, military- For those costs that are not reported channelled humanitarian assistance as ODA or included in the FTS, little amounting to US$57 million was reported in information indeed is available and the response to the Indian Ocean-earthquake/ relative importance of military actors as tsunami and US$124 million in response a channel of delivery for humanitarian aid to the South Asia (Kashmir) earthquake. remains largely unknown. In 2010 donors reported US$526 million in military-supplied humanitarian aid to Haiti, MEETING THE CHALLENGE Trends in humanitarian funding underscore economic infrastructures (Haiti, Pakistan); some very basic messages about the where recovery and reconstruction are ability of people and their governments required following large-scale conflicts to absorb shocks. They clearly show that (Afghanistan and Iraq); and at a time of humanitarian aid is becoming increasingly growing civil unrest in the Middle East stretched to meet a wide range of demands (Syria, Yemen, Libya). The question is how – where millions in sub-Saharan Africa are the aid budgets of donors and announced still dealing with the legacy of conflict and policies to focus on certain countries and large IDP populations (Chad, DRC, Somalia, certain types of crisis will play out against Sudan); where natural disasters have the a backdrop of humanitarian crises that potential to devastate or paralyse entire have no clear end. 51
  • 56.
    THE STORY This photoshows a child collecting water from a UNICEF water point in Agok CREDIT – home to over 50,000 internally displaced people (IDPs) for almost a year, following © Jenn Warren fighting between the Sudan Armed Forces and the Sudanese People’s Liberation Army in Abyei, Sudan in May 2008. Globally, the number of IDPs rose by 400,000 to 27.5 million in 2010. 52
  • 57.
    FoRCes sHApinG HumAnitARiAn AssistAnCe International humanitarianassistance has grown significantly, from US$6.7 billion in 2000 to US$12.4 billion (partial and preliminary figure) in 2010. The burden of humanitarian need has also shifted across the decade as causes and patterns of vulnerability change, new disaster hazards emerge and old ones wane. Two ‘mega-disasters’ in Haiti and Pakistan cast a long shadow over 2010, rapidly pushing huge numbers of people into crisis. The latter part of the last decade has also been underscored by deepening vulnerability in many developing countries associated with the global financial and food crises. Meanwhile, conflict and climate change-related hazards have remained a major threat to the lives and livelihoods of many. However, determining whether increased humanitarian aid financing is meeting these shifting humanitarian needs is still no simple matter, owing to the prevailing ad hoc system of measuring, which does not allow comparison of the scale and severity of needs across crises or for an assessment of the extent to which they have been met. This chapter considers some of the recent observable trends, drivers and features of the global demand for humanitarian aid financing, and reflects on the international response to meeting those financing needs. 53
  • 58.
    nAtuRAl disAsteRs, ConFliCtAnd eConomiC CHAllenGes The human impact of natural disasters was conflict and volumes of humanitarian a major driver of demand for humanitarian financing are not always straighforward. oeCd ClAssiFiCAtion oF oFFiCiAl financing in 2010. After a relative lull in The number of conflicts in which at least development AssistAnCe (odA) 2009, in 2010 natural disasters affected one actor is a state increased after 2003, ReCipient CountRies By inCome GRoup, 2009–2010 215.1 million people in developing including notably conflicts between Israel countries. In the year’s most prominent and Hezbollah in Southern Lebanon in Least developed countries (LDCs) humanitarian crises resulting from natural 2006, between Russia and Georgia in the are as defined by the United Nations disasters, 3.7 million people were affected breakaway South Ossetia region of Georgia based on an assessment of economic by the earthquake in Haiti in January, in 2008 and the border dispute between vulnerability, human resource 2.7 million by the earthquake in Chile in Djibouti and Eritrea, also in 2008. In weakness (including assessments of February and 20.4 million by flooding in addition, there were many new or renewed nutrition, health, education and adult Pakistan starting in July (CRED EM-DAT1). domestic challenges to states. Conflicts literacy) and where GNI per capita, involving non-state actors increased based on a three year average, is The incidence of natural disasters does markedly in 2008, following a period of under $750. not necessarily correlate with the need for decline after 2003. Notable new or renewed international humanitarian aid financing, Low-income countries (LICs) instances of violence occurred in 2008 however. A large proportion of the world’s are those with a per capita gross between non-state actors in Democratic disaster-affected populations each year national income (GNI) of less than Republic of Congo (DRC), Ethiopia, Kenya, live in countries that use predominantly US$935 in 2007. Nigeria, Pakistan and Sudan, as well as in domestic resources to respond to Mexico, where drug cartels were involved. Lower middle-income countries humanitarian needs. India and China have Since 2004, instances of one-sided violence (LMICs) are those with a per been among the three countries with the (where states or organised armed groups capita GNI of between US$936 largest number of disaster-affected people carry out intentional attacks on civilians) and US$3,705 in 2007. each year between 2000 and 2010. In 2010, have declined overall, but there have two-thirds of disaster-affected people in Upper middle-income countries been notable new or renewed instances developing countries lived in China alone. (UMICs) are those with a per capita of attacks against civilians in Afghanistan, Conflict is the other major driver Pakistan, Iraq, Kenya, Somalia GNI of between US$3,706 and of humanitarian need, though the and Thailand. US$11,455 in 2007. relationships between the incidence of 1 Data downloaded from the Centre for Research on the Epidemiology of Disasters (CRED) International Disaster Database ‘EM-DAT’ on 3rd May 2011 FiGuRe 1: populAtions in developinG CountRies AFFeCted By nAtuRAl disAsteRs, 2000–2010 700 657 Upper middle-income countries TOTAL AFFECTED PEOPLE (MILLION) Lower middle-income countries 600 Low-income countries Least developed countries 500 Total 400 300 253 210 207 196 215 200 172 156 159 107 126 100 0 2000 2001 2002 2003 2004 2005 2006 2007 2008 2009 2010 Note: Income groups are those determined by the Organisation for Economic Cooperation and Development (OECD) for 2009 and 2010. Natural disasters include those classifed by the Centre for Epidemiology of Disasters (CRED) as geophysical, hydrological, meterological and climatalogical. In the peak year, 2002, 97.9% of the total number of people affected were affected by severe drought, storms and floods in China (285 million) and in India (342 million). Source: Development Initiatives based on CRED EM-DAT data, downloaded 3 May 2011 54
  • 59.
    FiGuRe 2: tRendsin tHe inCidenCe oF ConFliCt, 2000–2008 120 One-sided violence NUMBER OF ARMED CONFLICT EVENTS Non-state based 100 28 40 36 42 26 State based 27 31 30 80 39 26 35 60 28 35 36 27 27 24 17 40 37 36 33 35 37 32 29 32 32 20 0 2000 2001 2002 2003 2004 2005 2006 2007 2008 Sources: Uppsala Conflict Data Program datasets (UCDP/PRIO Armed Conflict Dataset v.4-2010, 1946–2009; UCDP Non-State Conflict Dataset v. 2.3-2010, 1989–2008; One-Sided Violence Dataset v 1.3-2010b, 1989–2008) Whether the incidence of conflict described Many donors have placed an increased here results directly in humanitarian needs emphasis in their aid policies on fragile cannot be clearly determined. It is clear, states (many of which are affected by however, that humanitarian financing conflict), which may have influenced has become increasingly concentrated in humanitarian funding allocations. conflict-affected states, whose share of the However, there are also other total increased from less than 40% in 2000 considerations in explaining this to 65% in 2009. concentration of humanitarian aid in conflict-affected states. FiGuRe 3: pRopoRtion oF totAl oFFiCiAl HumAnitARiAn Aid ReCeived By ConFliCt-AFFeCted stAtes, 2000–2009 2009 25.9% 39.1% 35.0% 2008 24.8% 42.2% 33.0% 2007 26.7% 35.6% 37.7% 2006 24.6% 42.0% 33.4% 2005 20.9% 35.3% 43.8% 2004 22.1% 28.0% 49.9% 2003 21.6% 28.2% 50.1% 2002 17.2% 28.7% 54.0% 2001 13.3% 30.6% 56.1% 2000 13.7% 26.4% 59.9% 0% 100% % of total humanitarian aid to top 3 conflict-affected recipients % of total humanitarian aid to all other conflict-affected recipients % of total humanitarian aid to non conflict-affected recipients Note: See Data & Guides section for Development Initiatives’ definition of conflict-affected states. Source: Development Initiatives based on OECD DAC data 55
  • 60.
    FRAGILE STATES Fragile states are characterised by (CPIA), which is used to assess the widespread extreme poverty, are quality of country policies. The World the most off-track in relation to the Bank defines a country as a Fragile Millennium Development Goals (MDGs), State if it is a low-income country or and are commonly caught in or are territory, IDA eligible (including those emerging from, violence or conflict. countries which may currently be in arrears), with a CPIA score of 3.2 or Exact definitions of fragile states vary by below.” World Bank, 2011 donor and institution but often reference a lack of government capacity to provide “The Brookings Index of State Weakness basic public goods (including security in the Developing World... ranks and and basic services) and in some cases assesses 141 developing nations a lack of willingness to provide them: according to their relative performance in four critical spheres: economic, “Those failing to provide basic services to political, security and social welfare.” poor people because they are unwilling Brookings Institution, 2010 or unable to do so.” OECD, 2006 Debates on fragility increasingly Other institutions classify degrees of recognise the heterogeneity of fragile fragility according to assessments of states and degrees of fragility, including aspects of institutional performance: the recognition that conditions of “The World Bank’s definition of fragile fragility do not necessarily map neatly states covers low-income countries onto nation states and may be confined scoring 3.2 and below on the Country to sub-national pockets or may cross Policy and Institutional Assessment national borders. Our set of ‘conflict-affected’ countries also trends towards investing in heavily fortified includes those that are ‘post-conflict’ i.e. operating bases and in some cases hiring they have reached a negotiated settlement private security protection – are also likely and are hosting multilateral peacekeeping to have driven up the cost of providing aid operations. Humanitarian spending in such environments. While we know little often increases in countries where about the actual financial cost of these multilateral peacekeeping operations are adaptations to increased risk (which are present, and so this increase in funding to often hidden within programme budgets), conflict-affected states may also reflect they certainly contribute in part to the increased post-conflict opportunities for growth in volumes of humanitarian aid in humanitarian programming afforded by conflict-affected states. improved security and political stability. Full data on the incidence of conflict in Increasing incidence of attacks on 2009 and 2010 is not yet available, but humanitarian aid workers in a number of indications from funding data captured highly insecure operating environments within the UN consolidated appeals (notably Afghanistan, Somalia, Darfur, suggest a slowing in 2010 of the trend Pakistan and Chad) and associated towards the concentration of humanitarian adaptations – including remote funding in ‘complex emergencies’. management, sub-contracting and the 56
  • 61.
    FiGuRe 4: FundinGto Complex emeRGenCies And nAtuRAl disAsteRs RepoRted witHin un ConsolidAted AppeAls, 2000–2010 2010: Haiti earthquake and Pakistan flooding flash appeals 8 2005: Indian Ocean 7.1 6.9 7 Tsunami and South Asia (Kashmir) 6 earthquake flash appeals 5.1 5 US$ BILLION 4.0 4.0 4 3.7 3.5 3.0 3 2.2 2 1.4 1.1 Complex emergency 1 Natural disaster 0 Total 2000 2001 2002 2003 2004 2005 2006 2007 2008 2009 2010 Source: Development Initiatives based on UN OCHA Financial Tracking Service (FTS) data The global demand for humanitarian The number of undernourished people financing is driven not only by disaster increased from 2006 to a peak of just over events, of course: global and local one billion in 2009; this was connected to economic factors profoundly influence rising food prices and the global economic both people’s vulnerability to crisis and crisis. The numbers of undernourished the financial cost of meeting humanitarian people are thought to have declined to needs. Fluctuations in food and energy around 925 million in 2010, as food prices prices in particular have had far-reaching remained below their 2008 peak and many effects on levels of humanitarian need and developing countries experienced resumed the ability of the system to respond. economic growth (FAO 20102). Energy prices, which also rose to a peak Food price inflation has been driven in 2008, have been driven up sharply again by changing dietary habits, growing in 2011 as a result of the political crises populations, export restrictions and in the Middle East. Rises in the price of natural disasters in major grain-producing oil are likely to drive demand for biofuels, countries, including for example drought in with knock-on effects on the costs of Russia and flooding in Canada in 2010. In food production. addition to traditional supply and demand factors, however, fluctuations in food prices The costs of key relief commodities have been heavily influenced by speculation – including fats and cereals, key in financial markets. Speculative trading components of humanitarian food aid, in commodities – involving increasingly which more than doubled in price between large financial players such as hedge 2007 and 2008 (FAO annual food price funds, pension funds and investment banks indices) – and the cost of delivering them speculating in food markets following to affected populations continued to rise in market deregulations from 2000 onwards – 2010 and the first quarter of 2011, to near drove the spike in food prices in 2008 and is or above their 2008 peaks. contributing to the current peak in 2011. 2 Food and Agriculture Organization of the United Nations, 2010, The State of Food Insecurity in the World: Addressing food insecurity in protracted crises, Rome, 2010 57
  • 62.
    FiGuRe 5: CHAnGesin Commodity pRiCes, 1990–2011 (FiRst QuARteR) INDEX VALUE: 2000 = 100 (CONSTANT 2000 PRICES) 400 350 300 250 200 150 100 50 0 1990 1991 1992 1993 1994 1995 1996 1997 1998 1999 2000 2001 2002 2003 2004 2005 2006 2007 2008 2009 2010 (Q1)2011 Food price index Energy price index Note: Food and energy prices indices here show variation from the year 2000 when the index value is set at 100 (constant 2000 prices). Source: Development Initiatives based on World Bank Global Economic Monitor (GEM) Food and energy prices fell sharply from While overall aid levels have continued Greece, Ireland, Italy, Norway, Korea, the their peak in the third and fourth quarters to grow despite the financial crisis, some Netherlands and Portugal – experienced of 2008, in response to the global financial government donors have nevertheless reductions in their bilateral humanitarian crisis. Since the 2008/9 nadir, however, food reduced their overall aid budgets, and aid in both 2009 and 2010. The most and energy prices have resumed growth. many face increased domestic pressures to significant two-year bilateral humanitarian justify the value and effectiveness of their aid reductions by volume were seen in The effects of the global economic crisis aid spending. The outlook for humanitarian the Netherlands, whose aid dropped have also placed pressure on the ability of aid is still unclear, but a mixed picture is by US$156.5 million from 2008 levels; donors to provide aid. OECD Development emerging from recent data. Denmark, down US$84.3 million; Ireland, Assistance Committee (DAC) member down US$72.1 million; and Italy, down governments, which provide the majority Official humanitarian aid levels rose US$71.2 million. of development and humanitarian aid, sharply, by US$2.4 billion, in 2008, defying experienced continued economic growth up the financial crisis, before falling slightly, A combination of forces are gathering to 2009 when gross national incomes (GNI) by US$191.1 million, in 2009. Preliminary around humanitarian aid financing – donor fell, adjusting to the effects of the financial data from the OECD DAC on bilateral budgetary constraints, domestic pressures crisis. However, the growth rate of official humanitarian aid for 2010 suggests that to demonstrate aid results, rising demand development assistance (ODA), expressed humanitarian aid spending by governments for humanitarian funds and the linked rising as a percentage of GNI, has continued to rose again in 2010. costs of meeting those needs – providing increase from 2007, despite the drop in an ever more compelling justification for However, despite this overall growth, a GNI in 2009. effective coordination and targeting of number of donors – Austria, Denmark, international humanitarian funds. FiGuRe 6: Gni oF oeCd dAC GoveRnments And GRowtH in odA levels expRessed As A peRCentAGe oF Gni, 1990–2010 US$ BILLION (CONSTANT 2009 PRICES) 0.35% 45000 0.30% 40000 35000 0.25% 30000 0.20% 25000 0.15% 20000 15000 0.10% 10000 0.05% 5000 0.00% 0 1990 1991 1992 1993 1994 1995 1996 1997 1998 1999 2000 2001 2002 2003 2004 2005 2006 2007 2008 2009 2010 GNI ODA as % of GNI Source: Development Initiatives based on OECD DAC data 58
  • 63.
    HumAnitARiAn needs: FundinGAppeAls The core humanitarian principles Humanitarian needs expressed in the UN which underpin the work of most of the consolidated appeals more than doubled tHe un HumAnitARiAn AppeAl international humanitarian community between 2007 and 2010, reaching a historic And tHe ConsolidAted AppeAls provide unequivocal guidance on the high of US$11.3 billion. This growth was pRoCess (CAp) basis for allocating humanitarian funding: driven by an increase of US$2.9 billion Coordinated by the United Nations, humanitarian aid should be provided in for consolidated appeals over the period the consolidated apeals process is accordance with assessed needs and and the addition of the largest ever flash undertaken in a country or region to capacities and it should be allocated appeal requirements, which totalled raise funds for humanitarian action on a proportionate basis. US$3.6 billion in 2010. as well as to plan, implement and In the absence of a comparable evidence In 2010 consolidated appeals, which monitor activities. Two different base of humanitarian needs, major appeals represent the predictable needs arising kinds of appeal are generated by for international humanitarian financing from complex emergencies, saw a the CAP: consolidated appeals are useful barometers to illustrate the reduction in volume and in their share and flash appeals. extent to which donors have collectively of the total appeal requirements. This Consolidated appeals include met the humanitarian needs expressed followed two years of rapid growth in projected activities for the following as humanitarian financing requirements. requirements driven by rising levels of year, and often pertain to conflict need in a number of protracted crises, a or post-conflict scenarios where The UN’s consolidated appeal, the deepening global food crisis and increases the needs of that year are relatively largest annual appeal for humanitarian in the cost of meeting humanitarian food predictable. These country and financing, provides a consensus-based needs. The Sudan appeal, for example, regional consolidated appeals are costing and prioritisation of humanitarian saw a 58.3% increase in requirements then amalgamated by the UN, with financing requirements across a range of between 2007 and 2009; Palestine/OPT the launch of the humanitarian humanitarian crises, from a broad base experienced an 88.7% increase, owing appeal each November for the of participating organisations, including to the response to the Gaza crisis in following year. UN agencies and non-governmental 2009; and Somalia experienced a 121.9% organisations (NGOs). While the UN Flash appeals are a rapid strategic increase following drought, flooding and consolidated appeal is by no means an and fundraising tool based on increasing insecurity in 2008. objective or comprehensive expression immediately identified needs, and of global humanitarian needs, it does may be issued following sudden- provide a measure of humanitarian funding onset disasters such as earthquakes needs against which the collective donor or cyclones. It is not unusual for response can be compared. there to be both a consolidated appeal and flash appeal in the same country in the same year. Good HumAnitARiAn donoRsHip The Good Humanitarian Donorship (GHD) GHD members in 2011 include initiative is an informal donor forum (OECD DAC members in bold): that aims to promote a set of agreed Australia, Austria, Belgium, Bulgaria, principles and good practices, including: Brazil, Canada, Cyprus, Czech Republic, denmark, Estonia, european • principle 6: Allocate humanitarian Commission, Finland, France, Germany, funding in proportion to needs and on Greece, Hungary, ireland, italy, Japan, the basis of needs assessments. Latvia, luxembourg, Lithuania, Malta, • principle 14: Contribute responsibly, the netherlands, new zealand, norway, and on the basis of burden-sharing, Poland, portugal, Republic of korea, to United Nations Consolidated Romania, Slovak Republic, Slovenia, Inter-Agency Appeals and to spain, sweden, switzerland, the united International Red Cross and Red kingdom, the united states of America. Crescent Movement appeals, and actively support the formulation of Common Humanitarian Action Plans (CHAPs) as the primary instrument for strategic planning, prioritisation and coordination in complex emergencies. 59
  • 64.
    FiGuRe 7: FundinGReQuiRements By type oF AppeAl in tHe un ConsolidAted AppeAls pRoCess, 2000–2010 12 Flash appeals 0.3 3.6 Consolidated appeals 10 9.5 9.5 US$ BILLION 8 0.8 7.7 7.7 6 0.3 0.4 2.2 6.3 4 5.2 0.5 4.9 4.8 4.4 3.8 2 3.0 2.6 1.9 0 2010 2000 2001 2002 2003 2004 2005 2006 2007 2008 2009 2010 Source: UN OCHA FTS Flash appeals saw their share grow from slowing in the growth of contributions from just 2.9% of the total in 2009 to 31.8% of OECD DAC donors to just 4.1% in 2010 the total appeal requirements in 2010, and negative growth in other government despite a 50% reduction in the number of donor contributions and in the category flash appeals. The Haiti flash appeal (with of ‘other’ donors (which includes pooled requirements of US$1.5 billion) and the humanitarian funds, contributions from Pakistan flash appeal (with requirements NGOs and the International Red Cross and of US$1.9 billion) dominated requirements, Red Crescent Movement). with the remaining two flash appeals – for The growth in donor contributions Guatemala and Kyrgyzstan – making up just therefore did not match the 15.4% growth 1% of the total appeal requirements in 2010. in requirements in 2010, resulting in a While total donor contributions have substantial increase in the proportion of increased in volume each year since unmet needs to 37% of the total, compared 2006, the growth in donor contributions with an average of 30.2% for the five slowed considerably in 2010 to just 2.2%, preceding years. compared with growth rates of over 35% in both 2008 and 2009. This reflects a FiGuRe 8: un CAp ReQuiRements, FundinG And unmet needs, 2000–2010 11.3 Unmet need 9.8 Funding 4.2 Requirement 7.1 2.8 6.0 US$ BILLION 5.2 5.2 5.1 2.0 6.9 7.1 4.4 2.0 1.3 3.4 1.7 1.4 5.1 2.6 1.4 4.0 4.0 1.9 1.2 3.5 3.7 1.1 3.0 0.8 2.2 1.1 1.4 2000 2001 2002 2003 2004 2005 2006 2007 2008 2009 2010 Source: UN OCHA FTS 60
  • 65.
    2010 FiGuRe 9: unAppeAl needs met And unmet As A peRCentAGe oF Revised ReQuiRements, 2000–2010 75.8% 72.2% 71.7% 71.2% 67.5% 67.2% 66.5% 64.3% 63.0% 59.2% 55.4% 44.6% 40.8% 37.0% 35.7% 33.5% 32.5% 32.8% 28.8% 27.8% 28.3% 24.2% % needs met % needs unmet 2000 2001 2002 2003 2004 2005 2006 2007 2008 2009 2010 Source: UN OCHA FTS Moreover, the different types of appeal Donors also fund appeals issued outside of showed markedly divergent patterns the UN’s consolidated appeals process, and in donor response to the funding their responses to these other appeals are requirements issued. Flash appeals saw a worth considering. The UN typically issues substantial increase in requirements, from a handful of humanitarian funding appeals US$280 million in 2009 to US$3.6 billion in outside of the CAP each year. The volumes 2010, driven by the large Haiti and Pakistan requested in these ‘non-CAP’ appeals are flash appeals. Overall, 70% of funding highly variable. The amount requested needs expressed in flash appeals were in 2010 was, however, relatively high at met in 2010. US$1.6 billion, with appeals for Burkina Faso, Iraq, Nepal, Pakistan (not related to Consolidated appeals, on the other hand, the flood response) and Sri Lanka and the saw an 18.9% reduction in requirements regional response plan for Iraqi refugees. outstripped by a 32.5% reduction in funding Only 43.7% of the funding needs expressed levels from the preceding year, resulting in non-CAP appeals were met in 2010, the in a widening gap in unmet needs. In 2010, lowest level since 2005. just 59.8% of consolidated appeal funding needs were met, a significant drop from the three preceding years, in which more than 70% of funding needs were met. FiGuRe 10: non-CAp AppeAl ReQuiRements, FundinG And unmet needs, 2001–2010 2500 Unmet requirements 2,117 Funding for the appeal 2000 Total revised requirements 1,645 US$ MILLION 1500 1000 929 707 500 461 214 204 163 73 14 0 2001 2002 2003 2004 2005 2006 2007 2008 2009 2010 Source: UN OCHA FTS 61
  • 66.
    FiGuRe 11: FundinGto iCRC emeRGenCy AppeAls AGAinst ReQuiRements, 2006–2009 1200 1,036 985 1000 Unmet requirements 830 93 178 800 Income 891 US$ MILLION 800 858 200 91 Requirements 600 709 630 400 200 0 2006 2007 2008 2009 Source: International Committee of the Red Cross annual financial reports Following a period of growth in funding (ICRC) experienced an increase in unmet volumes to its emergency appeals, the needs in 2009 and a reduction in overall International Committee of the Red Cross funding income. pRopoRtionAlity in donoR Responses to CRises The collective donor response to meeting the collective response to meeting needs needs expressed in the funding appeals where funding on a proportionate basis indicates that, overall, a lower proportion appears questionable. of needs was met in 2010; that within 2010 saw not only a reduction in the the UN consolidated appeals process, average proportion of financing needs met, flash appeals fared rather better than but a reduction in the proportion of funding consolidated appeals; and that UN appeals received by both the best and worst funded outside of the consolidated appeals process crises. The overall increased demand for on the whole fared rather worse than humanitarian financing in 2010 seems to those within it (although appeals outside have meant that funds were spread more of the CAP are by definition considered a thinly across crises overall, with some lower priority and therefore often have a – particularly protracted crises – faring lower proportion of their funding needs worse than others. met). Across particular crises, however, there are further discernible variations in FiGuRe 12: sHARe oF needs met in tHe Best And woRst Funded un CAp AppeAls, 2000–2010 GREAT LAKES AND CENTRAL AFRICA LEBANON CRISIS 121.1% 123.2% HAITI 96.1% 100.0% EARTH QUAKE 89.3% 88.5% 100.0% 91.3% SUDAN 94.8% 74.6% 81.6% 75.8% 72.2% 71.7% 71.2% 67.5% 67.2% 66.5% 64.3% 63.0% 59.2% 55.4% 36.4% 35.1% CONGO, 21.9% 32.2% REP. 30.4% 17.2% 21.7% 17.6% 14.2% 18.6% ZIMBABWE ZAMBIA FLOODS 12.4% MONGOLIA DZUD 2000 2001 2002 2003 2004 2005 2006 2007 2008 2009 2010 Highest level of needs met Overall level of needs met (all appeals) Lowest level of needs met Source: UN OCHA FTS data 62
  • 67.
    FiGuRe 13: numBeRoF disAsteR-AFFeCted people And totAl FundinG to tHe CRisis FoR seleCted nAtuRAl disAsteRs No. of people affected (million) Funding to the crisis (US$ million) 7000 40 FUNDING TO THE CRISIS (US$ MILLION) 6,254 NO. OF PEOPLE AFFECTED (MILLION) 6000 35 30 5000 25 4000 20 3000 3,536 2,446 15 2000 10 1000 5 68 48 130 0 0 BAnGlAdesH mozAmBiQue pAkistAn iRAn (BAm) indiAn oCeAn HAiti Floods 2004 Floods 2007 Floods 2010 eARtHQuAke eARtHQuAke/ eARtHQuAke 2003 tsunAmi 2005 2010 no. of people affected (million) 36.9 0.3 20.4 0.3 1.7 3.7 Funding to the crisis (us$ million) 68 48 2,446 130 6,254 3,536 Amount per person (us$) 2 167 120 487 3752 956 Source: UN OCHA FTS and CRED The Haiti earthquake crisis in 2010 received funding needs, with a number of the large volumes of funds outside of the major consolidated appeals noticeably UN appeal. When these funds are taken more underfunded in 2010 than in the into account, in common with other very preceding year. The consolidated appeals high-profile natural disasters, the Haiti for Chad, Central African Republic (CAR), crisis received a relatively high volume of Palestine/OPT and Uganda all experienced humanitarian funds per affected person, a widening in their funding gap of around with US$956 per person recorded through 30% in 2010. the UN OCHA Financial Tracking Service The effects of the 2010 ‘mega-disasters’ on (FTS), compared with just US$120 per overall funding levels in the years to come person affected by the flooding in Pakistan remain to be seen, but for ongoing crises the same year. in 2010 humanitarian funding certainly Meanwhile, many long-running crises appeared to have become considerably experienced an increase in unmet harder to secure. FiGuRe 14: pRopoRtion oF FundinG needs met in un ConsolidAted AppeAls in 2009 And 2010 2009 2010 ReduCtion in needs met in 2010 Afghanistan 76.4% 65.0% -11.4% Chad 91.3% 60.0% -31.3% CAR 73.0% 44.6% -28.4% dRC 63.8% 64.1% 0.3% kenya 84.4% 65.9% -18.5% palestine/opt 79.1% 52.0% -27.1% somalia 65.6% 67.7% 2.1% sudan 70.3% 64.4% -5.9% uganda 76.3% 48.2% -28.1% west Africa 64.3% 49.8% -14.5% zimbabwe 63.2% 46.9% -16.3% Source: Development Initiatives based on UN OCHA FTS 63
  • 68.
    FundinG in ACCoRdAnCewitH Assessed needs In order for donors to make informed yet to be effectively linked up with donor funding decisions to meet their decision-making processes. No equivalent commitments to fund in accordance with initiatives to improve the evidence base for assessed needs, they need objective and humanitarian needs in protracted crises, comparable evidence that demonstrates the which receive the majority of humanitarian scale, severity and nature of humanitarian funds, have yet been attempted. needs, and they also need to know what In practice, the evidence base remains decisions others are making to ensure that largely ad hoc, not comparable and not resources are distributed equitably across widely shared, making donor commitments and within different crises. Yet serious to fund according to needs untestable. deficiencies remain in both areas. Moreover, the bases on which donors make While some progress has been achieved in their decisions are rarely made public. This improving the technical basis and capacity lack of transparency as to who is funding for common assessments in the early what, and with what justification, creates a stages of rapid-onset emergencies, this has situation where a rational and proportional impRovements in tHe evidenCe BAse FoR HumAnitARiAn FinAnCinG deCisions Improvements in establishing an objective UN OCHA has recently employed the a richer evidence base for prioritising evidence base and prioritisation within UN ‘Humanitarian Dashboard’ in the Pakistan preventive and mitigating action. consolidated appeals have not yet been flooding crisis in 2010 and in the Libya Humanitarian coordinators who expected applied consistently across all appeals. crisis in 2011. The dashboard is a tool to to submit humanitarian appeals to the build a common understanding of the The UN’s Inter-Agency Standing UN consolidated appeals process in 2011 humanitarian situation and aid decision Committee Needs Assessment Taskforce were required to anticipate and plan making and crisis monitoring by (IASC NATF) has agreed a common Multi- for the needs assessments that would consolidating a summary of essential Cluster Initial Rapid Assessment (MIRA) underpin appeals from mid-2010. humanitarian information (including tool, including common indicators agreed humanitarian needs, coverage, planning The European Commission (EC) continues with the UN global clusters, for the early scenarios) and monitoring key to test its funding decisions against its stages of rapid-onset emergencies. humanitarian indicators against Global Needs Assessment (GNA) crisis The MIRA is designed to feed improved benchmarks. severity index and forgotten crises information on the scale and severity of index. The EC Directorate General for humanitarian needs to flash and revised Within the UN consolidated appeals Humanitarian Aid and Civil Protection (DG flash appeals. process, the DRC and West Africa ECHO) also publishes the rationale for and appeals are compiled with reference to The IASC NATF has also published volume of funding decisions for protracted emergency thresholds that are used to ‘operational guidance’ spelling out roles crises to a predictable timetable. Some prioritise areas of greatest humanitarian and responsibilities and recommended European donors are now using ECHO’s need. The DRC appeal in 2011 also principles, procedures and common GNA tool as a basis to determine crisis includes geographical rankings against indicators for coordinated assessments level funding envelopes. four humanitarian risk factors, allowing in rapid-onset emergencies. FiGuRe 15: oFFiCiAl HumAnitARiAn Aid ConCentRAtion AmonG tHe top 20 ReCipients And tHe Rest, 2000–2009 2009 31.2% 52.4% 16.4% 2008 30.3% 50.4% 19.2% 2007 33.5% 46.8% 19.6% 2006 32.1% 50.4% 17.5% 2005 31.3% 48.9% 19.8% 2004 35.3% 42.7% 22.1% 2003 35.0% 42.5% 22.5% 2002 27.3% 40.8% 31.9% 2001 22.8% 42.3% 34.9% 2000 26.6% 41.6% 31.7% 0% 100% Top 3 recipients' share Rest of top 20 share All other recipients' share Source: Development Initiatives based on OECD DAC 64
  • 69.
    coverage of needscan only be achieved by In order to guard against disproportionate The volumes and proportions of chance rather than by the sum of informed concentration and a corresponding humanitarian aid provided by donors individual donor choices. increase in the number of neglected crises, outside of the OECD DAC group appear donors must take measures to ensure that to have grown in recent years, including In the past decade, humanitarian funding their decisions are made on objective and notably from private sources, as well as the has become increasingly concentrated transparently declared bases and that they growing volumes that are channelled via among the top 20 recipient countries. work together to achieve a rational division pooled humanitarian funds. Pressure for donors to deliver ‘value for of labour. money’ and ‘effectiveness’ in their aid In order to achieve a rational collective spending, at a time when some donor The Good Humanitarian Donorship group is response to humanitarian needs, it is clear agencies are also experiencing cuts to the logical forum through which donors could that all funding actors, including pooled their staff budgets and a reduction in work towards a rational, coordinated division humanitarian funding mechanisms, need their ability to manage large numbers of of labour in meeting humanitarian needs, to have access to information and evidence grants, may further drive this trend towards but a growing number, and a wider type, regarding the scale and severity of needs concentration of resources in a smaller of donors also need to be included in this and what other actors intend to fund. number of recipient countries. conversation if all humanitarian financing resources are to be effectively targeted. FiGuRe 16: sHARe oF FundinG to All un AppeAls (BotH CAp And non-CAp) FRom oeCd dAC, non-oeCd dAC, pRivAte And otHeR donoR souRCes 9 OECD DAC donors 8 Other government donors Private 7 Other 6 US$ BILLION 5 4 3 2 1 0 donoR type 2006 2007 2008 2009 2010 oeCd dAC donors 2.8 3.1 4.0 4.8 5.3 other government donors 0.1 0.1 0.3 0.2 0.3 private 0.0 0.0 0.1 0.1 0.4 Other 0.9 0.8 1.2 2.0 1.9 Note: ‘Private’ contributions include those from private sector corporations and foundations; private individuals/organisations; the Disasters Emergency Committee (DEC); UNICEF national committees; Friends of UNWRA; and UNHCR UK. ‘Other’ includes contributions from Emergency Response Funds (ERF), the Central Emergency Response Fund (CERF), Common Humanitarian Funds (CHF) and other pooled funds; NGOs; UN multilateral and other multilateral funds; other combined and undefined funds; and International Red Cross and Red Crescent Movement. Source: Development Initiatives based on OCHA FTS 65
  • 70.
    THE STORY Recent yearshave seen a deepening of vulnerability in many developing countries CREDIT due to the increasing incidence of climate change-related disasters, the growth of © WFP / Challiss McDonough food insecurity and the financial crisis. In February 2011, the World Food Programme (WFP) launched a voucher programme in Jalalabad, Afghanistan to help 1,500 families to buy food. This picture shows a recently widowed woman using the vouchers in a local store. 66
  • 71.
    Beyond tHe divide HumAnitARiAn AssistAnCein Context The context of humanitarian assistance is complex and diverse; it is international and national, global and local, involving both dedicated crisis response financing and ad hoc responses from whomever and wherever funds are available, including the massive and coordinated movements of supplies as well as the often hidden response from individual families within their own communities. This section examines some of the financial complexity within which this humanitarian assistance operates. We look at the flows of overall development and the relationship of development to humanitarian financing, especially post-crisis. We examine specific donor responses in peace and security as well as disaster risk reduction (DRR) i.e. investments to tackle underlying vulnerabilities that drive so much need for humanitarian response. Finally we place this in the context of a much wider understanding of domestic national financing. Humanitarian assistance, for all of its importance in many contexts, is dwarfed in terms of volume by the flows of resources that arrive from various sources in even the most crisis-ridden development, development-disrupted and conflict-affected countries in the world. 67
  • 72.
    US$ FOREIGN DIRECT 37.2bn INVESTMENT US$ DEVELOPMENT 33.6bn AID US$ 7.1bn PEACEKEEPING US$ 8.1bn HUMANITARIAN ASSISTANCE US$ REMITTANCES 42.5bn US$ 241.8bn DOMESTIC REVENUES 2009 FUNDING FLOWS TO TOP 20 HUMANITARIAN RECIPIENTS The context of humanitarian assistance is complex and diverse; it is international and national, global and local, involving both dedicated crisis response financing and ad hoc responses from whomever and wherever funds are available. Humanitarian financing does not exist in a vacuum. It is just one element of support to a country in crisis. This image demonstrates how the flow of humanitarian financing can be dwarfed by others in volume and significance. 68
  • 73.
    FiGuRe 1: top20 ReCipients oF totAl oFFiCiAl HumAnitARiAn AssistAnCe, 2000–2009 9,000 80% 8,000 68.3% 70% 60.6% US$ MILLION (CONSTANT 2009 PRICES) 7,000 HUMANITARIAN SHARE OF AID (ODA) 60% 6,000 50% 5,000 39.2% 37.6% 40% 4,000 33.2% 31.8% 31.3% 31.8% 28.1% 30% 3,000 30.1% 21.3% 20% 2,000 21.3% 17.2% 16.8% 14.9% 17.1% 12.4% 16.1% 10.6% 1,000 12.1% 10% 0 0% somalia sudan zimbabwe palestine/opt lebanon Angola liberia Burundi Chad dRC ethiopia sri lanka kenya Afghanistan Jordan indonesia iraq serbia pakistan uganda 2009 528.5 1304.9 389.9 1187.5 192.3 6.8 43.5 88.4 318.0 560.9 680.7 231.2 394.7 577.9 150.0 257.1 490.9 16.5 544.3 152.0 2008 552.3 1371.2 328.0 772.7 248.8 10.8 88.8 86.9 239.0 528.2 832.4 242.2 299.9 850.2 146.9 133.1 381.5 21.3 174.1 234.7 2007 267.3 1314.4 162.7 857.7 337.9 28.0 108.2 108.5 182.4 415.9 301.6 209.6 194.1 318.3 120.5 237.2 375.8 28.6 243.8 224.8 2006 318.8 1363.1 114.1 804.8 418.0 57.4 147.6 151.2 107.4 435.6 343.3 161.8 243.0 351.6 116.3 506.8 432.6 31.5 448.3 228.3 2005 190.4 1375.5 213.3 447.9 111.9 120.2 144.9 169.7 123.0 306.6 656.5 400.0 84.6 319.5 118.7 739.7 668.1 41.8 533.2 179.7 2004 153.7 844.7 68.9 564.0 91.0 214.8 172.2 163.5 96.8 286.6 439.2 48.0 89.9 428.7 109.4 31.9 1077.1 133.1 55.4 164.5 2003 134.2 357.8 92.6 462.4 81.2 311.1 104.5 150.1 11.0 255.9 803.5 39.0 76.7 485.9 136.0 64.3 1140.3 128.4 66.1 145.3 2002 129.2 261.4 83.4 465.0 90.2 276.5 48.6 104.0 4.0 261.3 231.9 48.4 94.7 855.9 123.5 72.8 147.0 108.8 67.4 79.9 2001 97.7 172.0 7.5 363.3 86.6 144.6 24.1 78.4 10.1 187.0 212.6 41.0 88.4 561.6 125.5 79.6 177.5 308.7 80.4 59.1 2000 79.9 130.4 4.5 273.2 78.4 157.5 40.4 57.0 8.3 95.4 229.0 44.6 75.1 164.0 118.5 73.5 140.3 720.6 33.7 35.6 00-09 68.3% 60.6% 39.2% 37.6% 33.2% 31.8% 31.8% 31.3% 30.1% 28.1% 21.3% 21.3% 17.2% 17.1% 16.8% 16.1% 14.9% 12.4% 12.1% 10.6% Note: Recipient countries are ranked by the percentage of ODA that is classified as humanitarian assistance. Source: OECD DAC, all donors THE HUMANITARIAN STORY THE DATA STORY In 2009 total official humanitarian assistance from In this chapter we use the top 20 humanitarian recipients over governments was more than US$11.2 billion. the decade 2000–9 as a set to compare and contrast with other flows of money. The countries in this graph are the top 20 recipients by volume over the decade 2000–9 and represent the All figures relating solely to humanitarian or wider official majority of that humanitarian spending. development assistance (ODA) are expressed in constant 2009 prices, exclude debt relief, and relate to all donors reporting to the OECD DAC. Where aid expenditures are combined with this other data, all figures are converted to current prices. 69
  • 74.
    development Aid inHumAnitARiAn CRises tHe RelAtionsHip Between same beneficiaries, there are significant HumAnitARiAn And differences in the ways in which they are development Aid planned and implemented. When crisis occurs, it is unsurprisingly General development aid is a long-term humanitarian assistance – the immediate investment, is more likely to be tied response to urgent need – that receives into recipient government structures the attention and the focus of politicians, and planning, with ministries taking the the media and the general public. Yet in lead in implementation, and focused all but a few cases humanitarian aid is on supporting government structures, a junior partner to general development sustainable development and poverty aid, at least in terms of overall volume, reduction. Humanitarian aid is more even in countries in grave and continual likely to be short-term, dealing more with crisis. Equally, even donors that give the symptoms than with causes, with saving largest priority of their aid to humanitarian lives and protecting people rather than with financing (such as Ireland, Sweden and sustained intervention, and focusing on the United States) have never spent more rapid response to urgent need rather than than 20% of their total aid on humanitarian on long-term development. In many cases it assistance in a single year. This is also brings international actors to the fore, especially important if we are focusing our such as when government capacity has attention on the US$11.2 billion of official been severely damaged by a sudden natural government humanitarian aid reported to disaster or when a government itself is the DAC in 2009, and not the remaining a party to conflict. Furthermore, despite US$124.4 billion accounted for by the rest being spent by the same donor government of official development assistance (ODA). from the same overall aid budget, funds for humanitarian and general development While there is evidence that both aid are usually administered by distinctly humanitarian and general development separate departments or divisions. aid in crisis contexts are in some cases being used to do very similar things, and are often ultimately aimed at the FiGuRe 2: top 20 ReCipients oF totAl odA, 2000-2009 40 70% 60.6% 35 60% US$ BILLION (CONSTANT 2009 PRICES) HUMANITARIAN SHARE OF AID (ODA) 30 50% 25 37.6% 40% 20 28.1% 30% 15 21.3% 17.1% 17.2% 20% 10 14.9% 12.1% 16.1% 3.5% 12.4% 10% 5 0.5% 4.2% 4.6% 10.6% 0.7% 1.7% 0.6% 3.3% 3.8% 0 0% Iraq Afghanistan Viet Nam Ethiopia Tanzania Pakistan China India Palestine/OPT Mozambique Bangladesh Uganda Sudan Indonesia Serbia DRC Ghana Egypt Kenya Zambia HA%ODA HA% ODA 2009 2008 2007 2006 2005 2004 2003 2002 2001 2000 Note: ODA recipients are ranked left to right by total volume (excluding debt relief). Source: OECD DAC 70
  • 75.
    tHe diFFeRinG pRioRities lonG-teRm HumAnitARiAn FiGuRe 3: top ReCipients oF odA, oF Aid expendituRe spendinG in CRises Continues 2000 And 2009 The spending of and priorities given to HumAnitARiAn Aid is spent in tHe ODA have clearly differed from those of sAme ConFliCt-AFFeCted plACes humanitarian assistance. Only 11 of the top Although the purpose of development 20 official humanitarian aid recipients are 2000 2009 assistance is to tackle the underlying also in the top 20 by total ODA over the past causes that lead to humanitarian crises, China 2.3 Afghanistan 6.2 ten years, and only two of those have been significant amounts of humanitarian aid propelled there by significant proportions Vietnam 2.1 Ethiopia 3.8 are being spent on the same crises year of spending on official humanitarian on year, which suggests that donors are Indonesia 2.0 Vietnam 3.7 assistance (60.6% for Sudan and 37.6% not getting to grips with the causes but for Palestine/OPT). rather only dealing repeatedly with the Serbia 1.9 Palestine/OPT 3.0 For some of the top recipients of ODA same symptoms. over the decade 2000–9, expenditure on India 1.8 Tanzania 2.9 Humanitarian aid is concentrated in a humanitarian assistance is negligible. Bangladesh 1.5 Iraq 2.8 relatively small number of countries. Vietnam has received close to US$25 billion Over the past decade, 136 countries have in ODA, but only US$108.2 million of this Egypt 1.5 Pakistan 2.8 been recipients of official humanitarian was official humanitarian assistance (less assistance and yet the top 20 account for Mozambique 1.4 India 2.5 than 0.5%). Of Ghana’s US$11.5 billion, only a massive US$54.7 billion (72.7%) of the US$77.1 million was official humanitarian Tanzania 1.3 Sudan 2.3 total US$75.2 billion spent. The 20 next assistance. Even Bangladesh, a country largest recipients account for a further prone to severe annual flooding and Uganda 1.1 DRC 2.2 US$12 billion of the remaining US$20.5 mudslides and regular disastrous cyclones, billion. Therefore, 88.7% of the decade’s Ethiopia 1.0 Mozambique 2.0 with millions of people receiving food official humanitarian financing has been assistance every day, has received only spent in only 40 countries. 4.6% of ODA for official humanitarian interventions over this ten-year period. Countries in conflict or post-conflict contexts account for much of this aid. Of The major ODA recipients have changed the top humanitarian recipients by volume Figures in US$ billion, constant 2009 prices. significantly over the past ten years. Only over the decade, all but two have been Source: OECD DAC four countries (Vietnam, India, Tanzania conflict-affected and 14 out of 20 have and Ethiopia) in the top ten in 2009 were been affected for more than eight of the also there in 2000. Some changes have past ten years, eight of these in Africa. (For been remarkable. In the early part of the the definition and methodology of conflict decade, neither Afghanistan nor Iraq were affected see the Data and Guides chapter). close to being among the top ten recipients of ODA. The year prior to their invasions The evidence of the impact of conflict on (2001 and 2003 respectively) Afghanistan flows of long-term official humanitarian received only US$220.1 million (placing it assistance to individual countries is plain. 81st in volume) and Iraq US$168.6 million For example, more than US$1.3 billion has (placing it 94th). Yet by the end of the been spent in Sudan in each of the past decade they were placed first and second five years. In the same period more than by volume of ODA for the period, and have US$450 million a year has been spent in accounted for US$62.4 billion, or 9.3%, of Palestine/OPT and more than US$250 the entire ten years’ development funding million a year in Democratic Republic of allocable by country. Congo (DRC) since 2002. Humanitarian aid to Angola, Liberia and Burundi has been However, over the past five years there steady but gradually falling over the decade, has been a consistency, and one that while to Somalia and Chad it has risen. is, perhaps surprisingly, shared by humanitarian assistance. The top 20 ODA Compared with conflict, the effects recipients over the decade have also been of natural disaster on humanitarian top for each of the past five years in all but assistance are mixed. Those disasters that 12 instances, when other countries break receive most attention in the media – the into the group. For official humanitarian large-scale, sudden-onset earthquakes, aid the pattern is similar: over the past five floods and cyclones – are less significant years the same countries have been the in terms of volumes of funds received. Only top 20 recipients each year in all but 13 three of the top recipients over the past ten instances. This suggests that humanitarian years (Pakistan, Indonesia and Sri Lanka) assistance is a regular, continual flow to have been propelled into that position due crisis-affected countries, much more so to significant funding in response to natural than aid driven by response to sudden disasters, with far more variable funding natural disasters. year-on-year than most of the rest. Other countries that have suffered similar major natural disasters in the past ten years, such as India, Iran, Bangladesh, Myanmar and Haiti, do not appear in this list. Drought however does feature in the 71
  • 76.
    FiGuRe 4: wHAtdRives HumAnitARiAn AssistAnCe? CountRy ConFliCt- disAsteR-AFFeCted CRisis spilloveR AFFeCted AFFeCted oveR 10 ReFuGees Housed numBeR oF yeARs numBeR oF yeARs numBeR oF yeARs witH oveR 150,000 witH oveR 100,000 people AFFeCted yeARly, AveRAGe ReFuGees numBeR yeARs AFGHAnistAn 10 5 5,897,526 0 24 AnGolA 7 3 928,198 0 13,053 BuRundi 10 3 3,824,449 0 28,973 CHAd 8 3 3,589,540 7 194,363 dRC 10 1 765,064 10 239,193 etHiopiA 10 6 33,997,746 7 121,816 indonesiA 7 9 10,200,692 1 22,704 iRAQ 10 0 76,478 3 69,455 JoRdAn 0 1 150,000 4 195,828 kenyA 5 5 33,922,372 10 262,541 Continually conflict-affected for more leBAnon 10 0 17,500 0 18,471 than 8 of past 10 years liBeRiA 10 1 38,449 0 29,217 Conflict-affected, for up to 7 years during the past 10 years pAlestine/ opt 10 0 0 0 0 pAkistAn 10 6 14,569,076 10 1,238,452 Severely disaster-affected, more seRBiA 7 0 15,580 6 233,553 than 150,000 over 7–10 years somAliA 10 4 5,564,567 0 779 Regularly disaster-affected, more than 150,000 affected for 3–6 years sRi lAnkA 9 9 5,767,155 0 112 sudAn 10 6 7,764,256 10 227,768 Substantial support, more than uGAndA 10 4 3,558,390 10 218,274 100,000 refugees for 7–10 years Regular support, more than 100,000 zimBABwe 0 3 8,479,892 0 7,068 refugees for 3–6 years Source: Conflict-affected Development Initiatives own methodology, disaster-affected based on CRED data, crisis spillover based on UNHCR data Drought however does feature in the HumAnitARiAn Aid is lonG-teRm humanitarian profile of many recipient Examining the relationship of humanitarian countries. Drought affects millions of aid to ODA allows us to further distinguish people each year and yet in most cases countries receiving occasional assistance is not covered by the media and does not from those where humanitarian aid is reach public attention. It affects many spent continually. of the African countries that feature among the top 20 recipients of official The evidence shows that spending is humanitarian assistance, accounting for indeed concentrated year on year in the 92% of people (93.7 million of 102 million) same places and that this expenditure affected by natural disaster. Again, almost accounts for the bulk of all humanitarian all those countries were or are also financing. In 2009, US$7 billion of a total affected by conflict. of US$10.1 billion of official humanitarian 72
  • 77.
    FiGuRe 5: lonG-,medium- And sHoRt-teRm ReCipients oF totAl oFFiCiAl HumAnitARiAn AssistAnCe, 2000–2009 12 US$ BILLION (CONSTANT 2009 PRICES) 10 8 6 4 2 1995 1996 1997 1998 1999 2000 2001 2002 2003 2004 2005 2006 2007 2008 2009 Short-term recipients Medium-term recipients Long-term recipients Note: This is based on countries that received greater than average humanitarian assistance as a share of ODA between 1995 and 2009, in this case more than 10.4%. Long-term assistance countries are those that have received more than 10.4% for more than eight years in this period and medium-term assistance countries are those that have received more than 10.4% for between four and eight years. The humanitarian aid values expressed in this graph relate to expenditure on individual countries – the figures do not tally with overall expenditure totals, which include cross-border and regional expenditure. Source: Development Initiatives based on OECD DAC assistance – just under 70% – was given (Somalia, Palestine/OPT and, to an extent, to long-term humanitarian assistance Sudan) while others are taking many years countries, and these have accounted for to transition out of humanitarian need, over 60% spent since 1999. such as DRC, Burundi and Uganda. Again the presence of conflict is significant. The top 20 recipients of humanitarian aid Of the 26 countries we classify as long- dominate. Of the 26 countries receiving term recipients, 18 are conflict-affected long-term official humanitarian assistance, or are in post-conflict transition. Large- 15 are also in the top 20 in terms of volume scale natural disasters appear to have over the decade. By 2009 these 15 account a substantial impact on the need for for 93.8% (US$6.6 billion) of the US$7 assistance in only a very few instances. billion spent long-term. Essentially, not Humanitarian aid is not driven so much only are large amounts of money spent by sudden response as by long-term in relatively few countries, those large engagement in affected countries, some amounts are spent in the same countries, of which are in seemingly intractable crisis each and every year. FiGuRe 6: lonG-teRm HumAnitARiAn ReCipient CountRies, 1995–2009 7 Sudan Palestine/OPT 8 Ethiopia US$ BILLION (CONSTANT 2009 PRICES) 6 Afghanistan DRC 5 Somalia Iraq 4 Lebanon 3 Serbia States Ex-Yugoslavia 2 Other top 20 humanitarian recipients Remaining long-term recipients 1 0 1995 1996 1997 1998 1999 2000 2001 2002 2003 2004 2005 2006 2007 2008 2009 Source: Development Initiatives based on OECD DAC 73
  • 78.
    tHe BAlAnCe Between continued conflict and lack of governance HumAnitARiAn And development drove an increase in the share of official AssistAnCe in CRisis-AFFeCted humanitarian aid from 38.1% in 2001 to CountRies a peak of 77.4% in 2008. Though humanitarian assistance plays In Sudan persistent humanitarian needs an important role in many countries, all remain, mostly in Darfur and the South. At but a few of the major recipients receive the same time donor governments have far more money by way of development been reluctant to grant ODA funds, in part aid, even during the years when they are due to alleged government involvement most in crisis. Only two countries have in human rights abuses in Darfur, but received more than 50% of their total also due to specific policies which mean aid as humanitarian aid over the past they cannot fund development activities. decade – Somalia (with 65.5% of ODA in the For example, in the case of the United form of official humanitarian assistance) States this refers to sanctions on Sudan and Sudan (58.7%) – and only five other and for the EC, to Sudan’s failure to countries have received more than 50% of ratify the Cotonou agreement. These their ODA as humanitarian aid in at least two elements have kept the proportion one year during the decade: Liberia, Chad, of Sudan’s humanitarian aid well above Afghanistan, Iraq and Zimbabwe. the 50% mark ever since 2001, and this despite the signing of the Comprehensive Over the period 2000–9 the average Peace Agreement in 2005 and Sudan’s contribution of humanitarian aid to overall achievement of middle-income country ODA seen in the leading recipient countries status. (According to the UN workplan, of official humanitarian aid was 22.6%, but more than US$424.6 million was spent this masks considerable variation amongst on programmes for South Sudan alone recipients and over time. in 2008, which would have made it the Both Somalia and Sudan’s trends over seventh largest recipient of bilateral ten years reflect the conditions for aid humanitarian aid that year). in those countries. For the former, FiGuRe 7: totAl oFFiCiAl HumAnitARiAn AssistAnCe As A pRopoRtion oF odA, key AFRiCAn CountRies, 2000–2009 90% 80% 70% Somalia Top 20 recipients 60% Liberia 50% Chad DRC 40% Sudan 30% Zimbabwe 20% 10% 0% 2000 2001 2002 2003 2004 2005 2006 2007 2008 2009 Total Source: Development Initiatives based on OECD DAC 74
  • 79.
    If by makingprogress through aid we remainder of the decade (for Afghanistan mean achieving diminishing proportions on average four-fold yearly and for Iraq of humanitarian assistance in post-crisis five-fold) humanitarian aid as a percentage countries, then perhaps Liberia is a clear of ODA has fallen remarkably low and example of success. Though it is one of has stayed low due to the continual the most aid-dependent countries in the and significantly larger development world and is still receiving substantial investments. peacekeeping funding, its aid profile There are some concerns that the future has changed significantly since the 2005 of aid to persistent and protracted crises elections, with official humanitarian is undermined by an increasing focus assistance dropping sharply in 2006 and by donors on fewer countries. Despite in the following three years (2007–9) hardly featuring as ODA recipients at the averaging only 13% of ODA. start of the decade, by 2009 Afghanistan Aid trends for Afghanistan and Iraq, had accounted for US$38.9 billion and countries that have seen recent Iraq for US$33.8 billion of the total ODA international interventions, have changed sum of US$310.5 billion going to the top much more markedly and quickly 20 humanitarian recipients. Therefore, than any other post-conflict context. 20% of all development aid to the top 20 In both countries prior to intervention crisis-affected countries has been spent humanitarian assistance dominated, in Afghanistan and Iraq alone, whose largely due to their negative aid combined populations account for only environments, with Iraq under the oil-for- 7% of the group as a whole. food regime and Afghanistan controlled by the Taliban. Before intervention, official humanitarian assistance made up 76.3% of aid to Afghanistan and 81.8% to Iraq, but despite increasing greatly over the FiGuRe 8: sHARe oF totAl odA ReCeived in tHe FoRm oF totAl oFFiCiAl HumAnitARiAn AssistAnCe AFteR siGniFiCAnt event 90% 80% Sudan 70% Afghanistan 60% Iraq DRC 50% 40% 30% 20% 10% 0% -3 -2 -1 0 1 2 3 4 5 6 Year of significant event Note: Significant events are as follows: Afghanistan 2001 (invasion) Iraq 2003 (invasion) DRC 2003 (withdrawal of all foreign armies and set up of transitional government) Sudan 2005 (signing of the Comprehensive Peace Agreement) 75
  • 80.
    tACklinG vulneRABility Beyond simplyproviding more volumes heightened focus on conflict-affected and of aid, donors can address the specific fragile states, and donor countries’ own underlying vulnerabilities that lead to involvement in conflict and subsequent high levels of humanitarian need by using reconstruction. This has come through a variety of resources and approaches. contributions not only to direct peace and This section looks at funding for peace security activities such as peacebuilding, and security (unsurprisingly, areas that reintegration of combatants and landmine conflict-affected populations put at the top clearance, but also to the building of the of their lists of needs), which crosses not necessary systems and infrastructure of only from humanitarian to development governance that are essential to deliver financing but involves both ODA and non- adequate basic services and to ensure the ODA flows and both budgetary allocations security of populations. assessed through membership of the The growth in these investments has United Nations and specific intervention outpaced ODA as a whole: spending tools designed by donors. We also examine on activities targeted towards building funding for disaster risk reduction (DRR), government capacity and security an area complicated by the lack of data, combined (based on gross disbursements) inconsistent reporting and the difficulty grew by 165% between 2002 and 2009, of tracking interventions that are largely compared with growth rates of 68.1% for mainstreamed through other activities. total humanitarian aid and 50.3% for ODA peACe And seCuRity as a whole (excluding debt relief and based on net disbursements). ODA spending pRioRitisinG stAteBuildinG And seCuRity related to governance, civil society, peace and security therefore accounts Throughout the past decade, donor for a growing share of total ODA, almost governments have made considerable doubling from 6.9% of all spending in 2002 and increasing investments in security to 12.2% in 2009. in recipient countries, driven largely by a FiGuRe 9: GRowtH in Aid spendinG on GoveRnment And Civil soCiety, peACeBuildinG And ConFliCt Resolution 30 Humanitarian aid Peacebuilding and conflict resolution 25 Governance and civil society US$ BILLION (CONSTANT 2009 PRICES) 20 15 10 5 2002 2003 2004 2005 2006 2007 2008 2009 Sources: OECD DAC CRS and Development Initiatives analysis 76
  • 81.
    keepinG tHe peACe By 2009 more than US$7.1 billion of peacekeeping funding (77.8%) was going The almost continuous rise in the financing to just the top 20 recipient countries of of governance and security expenditures humanitarian assistance, with these over the decade has complemented countries accounting for 165,070 (85%) of considerable increases in donor funding the total number of 193,634 peacekeeping of international peacekeeping missions, troops deployed. which range from the monitoring and recording of abuses of peace agreements Some individual country expenditures have to military policing of peace, right through been substantial. Since 2004 more than to supporting state-building through US$9.3 billion has been spent on peace- work in rule-of-law and justice systems, keeping in Sudan and more than US$6.7 demobilisation and reintegration of billion in DRC, which together account for combatants or helping to manage free 32.3% of all peacekeeping funding. and fair elections. Some of these peacekeeping missions have Only five of the largest 15 recipients of been long-term. There is not a great deal of peacekeeping funds over the decade evidence to show that international donors from 2000 to 2009 are countries that and the countries hosting these missions have received relatively small amounts have managed to move the agenda from of humanitarian assistance – Haiti, peacekeeping to actual peace and then Côte d’Ivoire, Timor-Leste, Bosnia and to reconstruction. If we use reductions Herzegovina, and Sierra Leone. The in volumes of peacekeeping flows to remaining ten, all major recipients of individual countries as an indicator of humanitarian assistance, account for a achievement (though admittedly a rather huge proportion of this additional donor crude one), then only three countries investment in insecure environments – where large missions have taken place more than US$35 billion (63.6%) of the – Sierra Leone, Burundi and Bosnia and US$55.1 billion spent. Herzegovina – would appear to have had success so far. FiGuRe 10: peACekeepinG Funds CHAnnelled tHRouGH tHe top 20 ReCipients oF totAl oFFiCiAl HumAnitARiAn AssistAnCe 10 Remaining peacekeeping missions 9 Iraq Chad/CAR 8 Burundi Bosnia and Herzegovina 7 Ethiopia/Eritrea US$ BILLION 6 Afghanistan Timor-Leste 5 Sierra Leone 4 Lebanon Haiti 3 Côte d'Ivoire Serbia 2 Liberia 1 DRC Sudan 2000 2001 2002 2003 2004 2005 2006 2007 2008 2009 Note: For the sake of accurate trends, figures for Serbia include those for Kosovo after the 2008 declaration of independence, as the same UN peacekeeping mission in the latter accounts for the bulk of peacekeeping financing. Source: Development Initiatives based on Stockholm International Peace Research Institute (SIPRI) 77
  • 82.
    donoR tools i:stABilisAtion Funds Donors continue to use specific funds to but one. The former receives 46.9% of supplement state-building and stabilisation stabilisation funding from the UK alone efforts, mechanisms that fund both ODA- but also receives sizeable contributions eligible and non-eligible interventions, from the Netherlands (US$41.2 million), including discretionary peacekeeping Canada (US$42.8 million) and the EU activities and contributions to non-UN- (US$46.5 million). Stabilisation funding for led peacekeeping missions. Denmark’s sub-Saharan Africa comes largely from stabilisation fund, set up in 2010 as part two donors, the UK again (US$68 million) of its ‘whole of government’ strategy, has and the UN Peacebuilding Fund (US$77.1 become the latest. million). However, some donor government funds, including those of the UK, the Unsurprisingly, large proportions of Netherlands and the EU, have reduced stabilisation financing go to both South and funding volumes from their peaks in 2008. Central Asia (which contains Afghanistan and Pakistan, amongst others) and sub- Saharan Africa; these two regions account for 34% and 35.2% respectively of the eight funds combined. South and Central Asia receives financing from all of the stabilising funds, and sub-Saharan Africa from all FiGuRe 11: FundinG CHAnnelled tHRouGH pooled donoR Funds FoR peACeBuildinG And stABilisAtion 350 Africa, sub-Sahara Africa, north of Sahara Europe 300 Oceania 288.4 Middle East South and Central Asia Far East Asia 250 South America North and Central America Country not specified Other 200 US$ MILLION 174.3 150 122.6 110.4 100 89.4 50 26.7 12.2 6.7 0 Canada Global Peace and Security Fund, 2010 Denmark Stabilisation Fund, 2010 Fund, 2010 Fund, 2010 UK Conflict Pool, 2009/10 Stability, 2009 UN Peacebuilding Fund, 2010 World Bank State and Peacebuilding Fund, 2010 Ireland Stability Netherlands Stability EU Instrument for Note: The EU Instrument for Stability (IfS) includes only the ‘Crisis response preparedness and conflict prevention’ window. Note also that bilateral donor funds may also contribute to multilateral funds listed here, notably the UN Peacebuilding Fund. Sources: Development Initiatives based on information provided by the governments of Canada, Denmark, Ireland, Netherlands, United Kingdom; the European Union; UN Peacebuilding Fund; and World Bank 78
  • 83.
    disAsteR Risk ReduCtion(dRR) both the short and long terms, but also to FiGuRe 12: pRevention And pRepARedness protect other investments and development Natural events affect developing countries 2005 to 2009 gains, whether in health care, education or substantially more than their developed poverty reduction. counterparts, due to their relatively poor infrastructure, weaker government tHe low pRioRity oF disAsteR pRevention And pRepARedness volume us$m % oF HA capacity for planning and response and their often large populations living on 2009 455 4.2% Despite problems of adequate data, there the fringes of habitable space, such as are indications that increased rhetoric 2008 333 3.1% flood plains or on steep gradients. These about the importance of reducing risk populations, many of whom live on the 2007 99 1.2% from disasters by taking action before they edges of urban areas, often lack the basic occur has led to increased expenditures. 2006 41 0.5% facilities that many others take for granted, Since 2005 flows to disaster prevention 2005 70 0.7% such as adequate housing, clean water and preparedness have increased from and sanitation, roads and electricity. This, US$70 million to US$455 million. combined with their relatively limited means of coping with sudden crises, and On average, for every US$100 spent on compounded by weak infrastructure and official humanitarian assistance in the Source: OECD DAC government capacity, can easily turn a top 20 recipients, only 75 cents – or 0.75% natural event into a natural disaster. – goes on disaster preparedness and prevention. Even in the country with the Both donor and recipient nations are largest volume of funds going to this area paying increasing attention to the need to (Iraq, with US$47.4 million over the past reduce the risk of disaster, not only to limit five years), it accounts for only 2.2% of total the loss of life and the loss to economies in humanitarian spend. FiGuRe 13: oFFiCiAl BilAteRAl HumAnitARiAn AssistAnCe 2005 -2009 to top ReCipients oF totAl oFFiCiAl HumAnitARiAn AssistAnCe oveR tHe lAst 10 yeARs, RAnked By moRtAlity Risk Indonesia (9) 30.0 Afghanistan (8) 11.9 Pakistan (8) 15.6 DRC (7) 11.4 Sudan (6) 3.6 6080.9 Uganda (6) 8.8 Ethiopia (6) 16.5 Average (5.5) 0.5 Serbia (5) 0.3 Chad (5) 0.5 Lebanon (5) 0.6 Liberia (5) 0.7 Somalia (5) 3.5 Zimbabwe (5) 4.2 Burundi (5) 5.5 Kenya (5) 11.1 Sri Lanka (5) 11.6 Iraq (5) 47.4 Angola (4) 0.5 Jordan (3) 0.2 Palestine/OPT (2) 1.9 0 500 1000 1500 2000 2500 3000 3500 4000 US$ MILLION (CONSTANT 2009 PRICES) Reconstruction relief and rehabilitation Disaster prevention and preparedness (exact figures indicated) Total remaining humanitarian assistance (Sudan figure as indicated) Note: Mortality risk is taken from the UN Global Assessment report on DRR produced by the United Nations International Strategy for Disaster Reduction (UNISDR), with 10 being the most at risk countries and 1 being the least at risk. Source: Development Initiatives based on OECD DAC 79
  • 84.
    For key countriesin Africa it is much Detailed investigations into codes beyond worse. In the past five years only US$33.3 preparedness and prevention eveal tHe CHAllenGe oF CountinG million has been spent in total in seven significant other expenditures on DRR. FundinG FoR disAsteR Risk conflict-affected countries combined – For example, Pakistan has received nearly ReduCtion Burundi, Chad, DRC, Sudan, Somalia, US$800 million over five years for DRR Note that tracking the full range of Uganda and Angola – while in those same and Indonesia close to US$200 million, DRR interventions, rather than a years more than 17.5 million people perhaps unsurprising given the devastating more narrow definition of disaster have been affected by natural disaster, natural disasters that regularly affect these prevention and preparedness especially drought. Of the US$6.4 billion countries. Ethiopia’s more than US$100 spending marked as humanitarian spent in Sudan in the past five years, million is connected to investments in aid, is complicated. There are issues only US$3.5 million has been spent on reducing the risk of drought. However, of semantics and differing donor preparedness and prevention, while over these figures, which bring in investments administrative systems, reporting the same period nearly 5.5 million people found within total ODA, also reveal how low and implementation. There is also have been affected. a priority DRR remains. the wide range of activities involved Expenditure on preparedness and There is minimal investment in many and the fact that interventions are prevention has not been a significant countries, including those whose often mainstreamed within other priority for any of the top humanitarian populations are significantly at risk of major flows of funds without being recipients in the past five years. Up to this mortality due to natural disaster. Only the marked as also being investments in point, however, we have been comparing three countries mentioned above have DRR (see Data & Guides section for the rather narrow areas of preparedness received more than US$100 million in full details). and prevention within humanitarian aid and, total for DRR over the five years. Only five In 2009 alone we have tracked an while such an analysis shows very clearly countries have received more than 1% of additional US$380 million of DRR that governments do not prioritise these ODA over five years as DRR funding. Of captured in other official humanitarian activities, it does not show full investments the US$150 billion spent on ODA for all or overall ODA codes. Total DRR for in DRR, as investments are often hidden 20 countries over the past five years, only the year would therefore have been by poor data (see box on the challenge of US$1.5 billion, or 1%, has been spent on US$835 million in 2009, a mere 0.5% counting). However, even taking a second DRR. Investment in disaster risk reduction of total ODA for year. look at overall ODA flows and pulling in the has been disastrously low. additional funding believed to be going to the wider area of DRR, the funding levels left remain pitfully low. FiGuRe 14: dRR expendituRe FoR 2005-2009 in top 20 HumAnitARiAn ReCipient CountRies, RAnked By moRtAlity Risk 900 8% 7.2 800 7% US$ MILLION (CONSTANT 2009 PRICES) 700 6% 600 5% 500 4% 400 2.9 3% 300 2.3 1.9 2% 200 1.4 0.9 100 1% 0.3 0.2 0.4 0.3 0.2 0.2 0.2 0.1 0.1 0.1 0 0% Indonesia Afghanistan Pakistan DRC Ethiopia Sudan Uganda Burundi Chad Iraq Kenya Lebanon Liberia Serbia Somalia Sri Lanka Zimbabwe Angola Jordan Palestine/OPT Development DRR DRR in humanitarian assistance Preparedness and prevention % of ODA Source: Development Initiatives based on OECD DAC 80
  • 85.
    donoR tools ii:ReConstRuCtion Funds FiGuRe 15: ReConstRuCtion Funds FoR nAtuRAl disAsteRs And ConFliCt Afghanistan 2,909 NATURAL CONFLICT-AFFECTED Sudan 653 Palestine/OPT 580 Iraq 501 Pakistan 67 CERF DISASTER Haiti 235 CHF ERF Indonesia 488 Reconstruction funds 0 100 200 300 400 500 600 700 800 900 1000 US$ MILLION Source: Development Initiatives based on UNDP Multi-Donor Trust Fund Office Gateway and World Bank. Partial 2010 for Sudan MDTF Pooled reconstruction funds are tools Afghanistan’s fund is the largest of this The percentage of total development designed to assist donors after large-scale kind and has received the highest amount aid in these contexts can be significant. crises. They are intended to help them for each of the past five years, with a Afghanistan and Sudan have received by transferring responsibility for decision total of more than US$3 billion between 13.1% and 15.3% respectively of all their making to key stakeholders at country level, 2006 and 2010. In 2010 alone it received ODA funding through pooled mechanisms to ensure coordination of aid priorities, US$622.2 million from 18 donors, of of one sort of another over the years avoid duplication and share risk. They are which the US was the largest, contributing 2006–9 (2006 being the peak year for both). also more likely to be tied to government US$264.3 million, a substantial 42.5% of Contributions to reconstruction funds plans and capacity and to have line the total. are concentrated from just a handful of ministries as key implementing actors than Most recipients of reconstruction funds donors. The top five account for 66.7% of all is the case for humanitarian pooled funding. receive far more pooled financing funding, ranging from 86.3% of Indonesia’s Seven large reconstruction funds have through these funds than through their reconstruction fund to only 37.2% of been set up to date, four to support post- humanitarian counterparts. Only Sudan Palestine’s. The latter has received major conflict recovery (Afghanistan, Sudan, and Pakistan have received significant contributions from Norway (US$202.4 Palestine/OPT and Iraq) and two after proportions of pooled humanitarian million), Kuwait (US$186.9 million) and natural disasters (Haiti and Indonesia). finances, largely due to the fact that they Australia (US$62.5 million). Pakistan’s fund was originally mandated are two of the few countries with large Afghanistan’s reconstruction fund to rehabilitate areas affected by clashes common humanitarian funds. Sudan is characterised by considerable between government and Taliban forces in has received more than US$741 million donor concentration. Of the top five the Swat valley, but after massive floods in in this way and US$653 million for its reconstruction fund donors, only the 2010, which occurred in many of the areas reconstruction fund, with more than EU spends less than 25% of its total in also previously affected by conflict, it now US$424 million of the latter allocated Afghanistan; the US spends a substantial takes funds for flood reconstruction. to South Sudan. 86.7% in that country. FiGuRe 16: top Five donoRs to tHe mAJoR ReConstRuCtion Funds, 2006–2010 Netherlands US$203.9 Canada US$375.2 EU US$185.5 United States US$711.7 United Kingdom 5US$91.7 0% 100% Indonesia Iraq Pakistan Sudan Palestine Afghanistan Haiti Note: Figures on graph are for funding to Afghanistan’s reconstruction fund. Source: Development Initiatives based on UNDP Multi-Donor Trust Fund Office Gateway, Haiti Reconstruction Fund website and World Bank. Partial 2010 for Sudan MDTF 81
  • 86.
    FiGuRe 17: keyFlows to top 20 ReCipients oF totAl oFFiCiAl HumAnitARiAn AssistAnCe, 2005-2009 500 Total official humanitarian assistance 450 400 350 300 250 200 150 Total official humanitarian assistance Other ODA 100 Peacekeeping Domestic revenue 50 Remittances 0 Foreign Direct Investment 2005 2006 2007 2008 2009 Source: Development Initiatives based on World Bank, IMF, OECD DAC and SIPRI domestiC ResouRCes Though the flows of aid and the various US$90 billion in 2009. Yet in per capita tools available to donors are important, terms it raises significantly less than do financing from foreign governments five other countries: Lebanon, Iraq, Jordan, is often less significant than might be Angola and Serbia. For Iraq and Angola expected, even in the most crisis-affected revenues are driven by oil production, contexts. Governments, communities while Lebanon, Jordan and Serbia are and individuals often have considerable countries with relatively sophisticated and resources available (including but not well-developed economies, whose need for limited to finance) that can be used to humanitarian assistance is driven largely address both humanitarian need and by issues peripheral to the economy. underlying vulnerability. Over the decade Serbian assistance was spent largely in the UN-administered domestiC Revenues Kosovo province, while most of that going Of the major humanitarian recipients, to Jordan and Lebanon, even taking into the domestic revenues of some stand account the occasional conflict in the out. Indonesia’s large population in part latter, is largely accounted for by support accounts for its large revenue of nearly to housing refugees. 82
  • 87.
    FiGuRe 18: GoveRnmentRevenue volumes FoR mAJoR ReCipients oF totAl oFFiCiAl HumAnitARiAn AssistAnCe 2005 2006 2007 2008 2009 peR CApitA 2009 Afghanistan 0.4 0.6 0.7 0.8 1.3 46 Angola 12.4 21.0 27.7 42.8 23.3 1,256 Burundi 0.2 0.2 0.2 0.2 0.2 30 Chad 0.4 0.9 1.6 2.2 1.1 102 dRC 0.8 1.1 1.5 2.1 1.9 28 ethiopia 1.8 2.2 2.5 3.2 3.9 47 indonesia 53.4 72.9 82.5 107.6 87.8 382 iraq 24.9 33.6 45.0 66.4 44.8 1,453 Jordan 3.6 4.4 5.0 5.6 5.9 930 kenya 4.0 4.7 6.0 6.6 6.7 168 lebanon 4.9 5.0 5.7 6.9 8.4 1,986 liberia 0.1 0.1 0.2 0.2 0.2 59 pakistan 15.1 18.0 21.5 23.9 23.5 130 serbia 10.0 12.1 16.3 19.5 16.4 1,650 sri lanka 3.0 4.2 4.8 5.4 5.4 267 sudan 6.3 7.5 9.3 12.4 8.3 195 uganda 1.1 1.2 1.5 1.8 2.0 60 Increase above 20% Increase zimbabwe 0.9 0.5 0.2 0.1 0.9 74 Decrease in domestic revenue Note: The countries are ranked top to bottom by volume of humanitarian assistance over the past ten years. Source: Development Initiatives based on IMF (Regional Economic Outlooks) and UN DESA Perhaps unsurprisingly, in all but two of This came to an end for the most part the countries receiving less government in 2009, when nine out of 18 countries revenue than Indonesia in 2009, conflict has for which we have data suffered a fall inhibited and often continues to significantly in government revenue. The decline in inhibit national development. Even Sudan’s revenues was massive for some, with oil oil industry can raise its domestic revenues producers suffering in particular, due not only to US$195 per capita. only to the falling demand for oil but also to the crash in price: oil prices fell from a Over the past five years the trend has ten-year high of US$106.30 a barrel in July been relatively uniform, with government 2008 (the monthly average) to US$33.10 revenues in most countries increasing in December 2008. Government revenues steadily from 2004 to 2008 (with only in Angola fell by nearly US$20 billion from Zimbabwe standing out as a consistently 2008 to 2009 (a 45.7% drop) and other poor performer). Some countries saw countries were similarly affected (Chad remarkable increases in revenues with a 40.3% fall, Iraq with 31.9% and during this period, with Angola and Chad Sudan with 32%). averaging growth of 51.7% and 63.6% respectively from 2006 to 2008, and Liberia growth of 40%. 83
  • 88.
    FoReiGn diReCt investment(Fdi) of all FDI to the 20 major humanitarian recipients in 2009, but saw a drop of 21% tHe impoRtAnCe The flow of foreign investment to major oF domestiC Revenue from its 2008 level of US$16.5 billion. humanitarian recipients has risen Indonesia and Pakistan saw huge declines Domestic revenue, the money significantly over the decade, with values of 47.7% and 56.1% respectively, with raised by nation states, includes increasing more than ten-fold from 2000 volumes of US$4.4 billion and US$3.1 direct taxation and trade tariffs, to 2008, including a significant rise in 2008 billion. Meanwhile, other countries saw and is essential to the effective itself. Although the economic downturn an increase, such as 97.5% for Chad and running of the state. It provides the has affected global FDI levels considerably, 89% for Liberia (admittedly rising from low necessary funds for the delivery of trends for major humanitarian recipients overall volumes). basic services, the improvement of have been surprisingly robust; despite a decrease in global FDI from 2007 to 2008, RemittAnCes infrastructure and the development FDI for the major humanitarian recipients of adequate response systems when The picture for remittances to major crisis does occur. has continued to rise. Furthermore, the humanitarian recipients for 2000–9 was fall between 2008 and 2009 for this group The OECD suggests that the dominated by four countries, in each case was less dramatic than the global picture minimum percentage of domestic with volumes that far exceeded their levels would indicate, with the top humanitarian revenue required for effective state of international humanitarian assistance recipients experiencing a fall of 26.1% operating is 15% of GDP, while the and even total ODA over that period: Serbia compared with a 36% decrease in overall UN calculates that in order to achieve (US$37 billion), Pakistan (US$45 billion), global levels. the Millennium Development Goals Indonesia (US$37 billion) and Lebanon Individual countries performed quite (US$47 billion). (MDGs) low-income countries may be differently within the overall trend. Angola, required to raise their revenues as a In Lebanon, remittances are a major percentage of GDP by four points. which received a massive US$72.8 billion contributor to the economy, accounting for in inward investment over the decade, The core group of major humanitarian a 22% share of GDP over the decade, which accounted for US$13.1 billion or 35.2% recipients have performed puts the country in the top ten worldwide relatively well, according to the OECD benchmark. Of the countries considered, only six have seen revenues lower than 15%: Pakistan, Uganda, Sri Lanka, Ethiopia, Zimbabwe and Afghanistan. Of these, the latter two have had domestic revenues lower than 10% of GDP in at least three of the past five years. FiGuRe19: Fdi tRends in tHe top HumAnitARiAn AssistAnCe ReCipient CountRies 60 2100 Uganda WORLD TREND Iraq DRC 50 1600 Serbia Jordan US$ BILLION WORLD TREND 40 Sudan US$ BILLION 1100 Pakistan Lebanon 30 Indonesia 600 Angola 20 World trend 100 10 0 -400 2000 2001 2002 2003 2004 2005 2006 2007 2008 2009 Note: Data for Indonesia available from 2003. Source: Development Initiatives based on UNCTAD 84
  • 89.
    on this measure.In 2009 the remittance inflow of US$7.5 billion was equivalent to soCiAl pRoteCtion • In an effort to help small-scale nearly US$1,800 per person and only just farmers, the Kenyan government Governments take various measures below the combined totals of the 12 other subsidizes fertilizer used during the to prevent or respond to crises, and countries for which we have data. However, planting season. The Bangladesh although it is not always easy to for countries such as Burundi, Uganda, government, in response to the rise understand the provenance of resources, Ethiopia and Liberia, remittances are not a in fuel prices, provides a subsidy to they represent significant investments in major inward flow, representing less than farmers in the form of a cash transfer, people. These are examples of some of 5% of GDP and in each of these cases less with the aims of having a positive the measures governments have taken: than US$21 per person per year. impact on agricultural output and • After the Indian Ocean tsunami, some protecting the marginal and small Nevertheless, remittance trends for 2009 farmers. national governments implemented were more positive than those of both cash transfer programmes. The Sri domestic revenue and inward investment, • The Dominican Republic is setting up Lankan government provided US$1,515 with overall flows increasing (if only a Natural Disaster Insurance Facility in compensation for deaths, US$25 for slightly, by 4.7%). This compares favorably with support from the Inter-American household items, US$50 in emergency with a decrease in overall global figures, Development Bank (IDB) to help reduce resettlement allowances, US$8.50 a which saw a 6% fall from 2008 to 2009. the country’s fiscal vulnerability related month for approximately 12 months to natural disasters. The policy will and four unconditional transfers provide coverage of the extraordinary of US$198 per household. The public expenditures for up to US$50 government also provided cash grants million that could be incurred during for people with damaged and destroyed emergencies due to seismic activity. houses. Similarly, after the earthquake in West Sumatra 2009, the Indonesian Ref: Harvey, P., 2007. Cash-based government provided compensation for responses in emergencies. people with destroyed houses. Humanitarian Policy Group. FiGuRe 20: RemittAnCes: tRends in tHe top ReCipient CountRies oF totAl oFFiCiAl HumAnitARiAn AssistAnCe 50 450 Other top humanitarian recipients Uganda 45 400 WORLD TREND Palestine/OPT 40 350 Kenya US$ BILLION WORLD TREND 35 Sudan 300 Sri Lanka 30 US$ BILLION 250 Jordan 25 Serbia 200 Indonesia 20 Pakistan 150 15 Lebanon 100 World trend 10 5 50 0 0 2000 2001 2002 2003 2004 2005 2006 2007 2008 2009 Source: Development Initiatives based on World Bank 85
  • 90.
    HumAnitARiAn Aid RemAinsimpoRtAnt, in Context The existence of significant volumes of national resources of affected countries domestic resources should not detract came under pressure. However, the from the importance of humanitarian balance of resources in crisis-affected assistance. There remain specific reasons states is mixed. why humanitarian assistance is an Throughout all these major crises in which absolutely appropriate tool for intervening these various methods and tools are used, in crisis situations, especially in cases humanitarian assistance remains the where responsible nation-states are ‘junior partner’ to development assistance either a party to conflict or their ability to in terms of volume, but there is equal govern is severely affected by a sudden and consistency in where it is spent. The bulk of damaging natural disaster. There are also humanitarian assistance is spent year after enduring questions about how developing year in the same set of conflict and post- nations (especially those which are conflict countries. commodity-rich) translate their domestic revenues into dealing with crises when they There has been an increasing focus on occur and, equally importantly, tackling the tackling insecurity through investments underlying risks. in governance, security and peacekeeping (including the development of many Donor funding in crisis-affected countries new financing tools) and funding levels has remained robust, despite the economic continue to rise annually. However, there downturn, and investments in development is little evidence to date to show that many aid, as well as in peacekeeping, have countries have graduated to peace and increased throughout the period when reconstruction. FiGuRe 21: mAJoR Flows oF Funds to lARGest HumAnitARiAn ReCipients oveR ten yeARs, 2009 (us$ Billion) US$ BILLION 0 20 40 60 80 100 120 Palestine/OPT 1.2 Sudan 1.3 Total official humanitarian assistance Sri Lanka 0.2 Serbia 0.0 Pakistan 0.5 Liberia 0.0 Lebanon 0.2 Kenya 0.4 Jordan 0.1 Indonesia 0.3 Ethiopia 0.7 Burundi 0.1 Other ODA Domestic revenues Remittances FDI Peacekeeping Total official humanitarian aid Source: Development Initiatives based on World Bank, IMF, OECD DAC and SIPRI 86
  • 91.
    Spending on DRRhas been negligible in the characterised by insecurity and continual countries where the bulk of humanitarian vulnerability, it makes no sense to treat assistance is spent, despite the fact that these funding flows separately. For those countries are in particular need the affected individuals, the particular of additional external response and provenance of resources, whether national investments in systems and infrastructure. or international, carries no importance Yet many of the same conflict-affected in itself. Those individuals need change. countries that receive huge and continuing In order to target resources efficiently to volumes of humanitarian assistance are address vulnerability, and in order to make prone to substantial natural disasters, the changes required by beneficiaries, especially drought. Humanitarian decision makers need to have clear assistance represents a vital flow of funds visibility of all funding flows, with all for people trapped in unstable, conflict- the right tools and mechanisms at their affected environments where vulnerability disposal and a transparent view of all to climate-related crises is high and resources allocated. Are the right choices where poverty underpins vulnerability. being made? The need for humanitarian aid to remain independent, neutral and based on need alone is paramount. There is an important and difficult challenge here, for in a sense these comparisons miss the point. From the perspective of people whose lives are FiGuRe 22: CompARison oF AveRAGe totAl oFFiCiAl HumAnitARiAn AssistAnCe AlonGside GoveRnment Revenues, 2005–2009 US$ TOTAL OFFICIAL HUMANITARIAN AID 70 1600 60 1400 1200 US$-REVENUES 50 1000 40 800 30 600 20 400 10 200 0 0 Lebanon Sudan Liberia Jordan Zimbabwe Afghanistan Chad Iraq Burundi Sri Lanka DRC Ethiopia Uganda Kenya Serbia Angola Pakistan Indonesia Total official humanitarian assistance per capita, average 2005-2009 Domestic revenues per capita, 2005-2009 Source: Development Initiatives based on OECD DAC, IMF and UN 87
  • 92.
    THE STORY Humanitarian aidhas represented over 60% of the official development assistance CREDIT (ODA) flows to Sudan since 2000, but it remains just one element of financing that © Jenn Warren / WfWi could assist people living in situations of insecurity and vulnerability. This photo shows a woman irrigating her crops at the Women for Women International Pacong Community Farm, Lakes State, South Sudan. The farm supports vegetable farming, an aviary honey project, livestock and poultry. 88
  • 93.
  • 94.
    90 GLOBAL HUMANITARIAN ASSISTANCE INTERNATIONAL HUMANITARIAN OTHER INTERNATIONAL DOMESTIC RESPONSE RESPONSE RESOURCES PRIVATE NATIONAL NATIONAL NON-ODA GOVERNMENTS PEOPLE OTHER ODA CONTRIBUTIONS GOVERNMENTS INSTITUTIONS ELIGIBLE Private Ministries National and local Diaspora Sector allocable Military OECD DAC humanitarian aid OTHERS contributions NGOs ODA, such as MEMBERS reported to annual Disaster funds Communities governance and reports from NGOs, Red Cross and Peacekeeping security assistance UN and Red Cross Local government Red Crescent General public 2009-2010 national societies Source: OECD 23 OECD DAC Non-OECD DAC Domestic military Affected Other foreign DAC stats governments and members Private communities assistance Community-based EU institutions contributions Sources: Ministry of organisations Voluntary reporting reported to the FTS Finance, DADs and funds Quantitative data Sources: SIPRI, UN OCHA Obligatory annual 2009-2010 very difficult to FTS, direct from reporting to public FTS captures what Faith-based governments and various organisations capture database donors report as secondary sources 2009-2010 not humanitarian aid comparable Private sector Source: Remittance data Account for 70% between years from World Bank of international Not comparable Other civil society humanitarian between donors Sources: Annual reports response figure in or years and UN OCHA FTS Sources: Direct from 2009 organisations and 87 donors in 2009, annual reports Totals allocable by 127 in 2010 country and region, OECD DAC data Sources: UN OCHA FTS comprises 96% of and OECD DAC stats KEY: HOW ROBUST IS THE SOURCE? our data 2000-2009 Very Robust Moderately Not Very Not at all Source: OECD DAC stats
  • 95.
    key deFinitions, ConCeptsAnd metHodoloGy HumAnitARiAn Aid ‘Humanitarian aid’ is aid and action designed to save lives, alleviate suffering and maintain and protect human dignity during and in the aftermath of emergencies. The characteristics that mark it out from other forms of foreign assistance and development aid are that: • it is intended to be governed by the principles of humanity, neutrality, impartiality and independence • it is intended to be short-term in nature and provide for activities in the immediate aftermath of a disaster. In practice it is often difficult to say where ‘during and in the immediate aftermath of emergencies’ ends and other types of assistance begin, especially in situations of prolonged vulnerability. Traditional responses to humanitarian crises, and the easiest to categorise as such, are those that fall under the aegis of ‘emergency response’: • material relief assistance and services (shelter, water, medicines etc.) • emergency food aid (short-term distribution and supplementary feeding programmes) • relief coordination, protection and support services (coordination, logistics and communications). Humanitarian aid can also include reconstruction and rehabilitation (repairing pre-existing infrastructure as opposed to longer-term activities designed to improve the level of infrastructure) and disaster prevention and preparedness (disaster risk reduction (DRR), early warning systems, contingency stocks and planning). Under the Organisation for Economic Cooperation and Development (OECD) Development Assistance Committee (DAC) reporting criteria, humanitarian aid has very clear cut-off points – for example, ‘disaster preparedness’ excludes longer-term work such as prevention of floods or conflicts. ‘Reconstruction relief and rehabilitation’ includes repairing pre-existing infrastructure but excludes longer-term activities designed to improve the level of infrastructure. Humanitarian aid is given by governments, individuals, NGOs, multilateral organisations, domestic organisations and private companies. Some differentiate their humanitarian assistance from development or other foreign assistance, but they draw the line in different places and according to different criteria. We report what others themselves report as ‘humanitarian’ assistance but try to consistently label and source this. GloBAl HumAnitARiAn AssistAnCe The term ‘global humanitarian assistance’ is used within the context of the Global Humanitarian Assistance (GHA) programme to mean: • international humanitarian response (i.e. humanitarian aid from governments and private contributions) • domestic response (provided by governments in response to crises inside their own countries) • other types of assistance that go to people in humanitarian crises which fall outside that captured in the data on ‘international’ or ‘domestic’ humanitarian response (e.g. peacekeeping and other official development assistance (ODA) activities such as governance and security). inteRnAtionAl HumAnitARiAn Aid International humanitarian aid (sometimes referred to in this report as ‘international humanitarian response’) is used to describe the contributions of: • international governments note: For OECD DAC donors, we • individuals, private foundations, trusts, private companies and corporations. make an adjustment to the DAC- HumAnitARiAn Aid FRom GoveRnments reported humanitarian aid figure Our definition of government funding for humanitarian crises comprises: so that it takes account of each donor’s multilateral (core and totally • the humanitarian aid expenditure of the 24 OECD DAC members – Australia, Austria, unearmarked) ODA contributions Belgium, Canada, Denmark, Finland, France, Germany, Greece, Ireland, Italy, Japan, to the United Nations High Korea, Luxembourg, the Netherlands, New Zealand, Norway, Portugal, Spain, Sweden, Commissioner for Refugees (UNHCR), Switzerland, the United Kingdom, the United States and the European institutions – as the UN Relief and Works Agency reported to the OECD DAC as part of an annual obligation to report on ODA flows for Palestine Refugees in the Near • expenditure by ‘other governments’ as captured by the United Nations Office East (UNRWA) and the World Food for the Coordination of Humanitarian Affairs (UN OCHA) Financial Tracking Service (FTS). Programme (WFP) – see ‘total official Our labelling of ‘governments’ is driven by the way in which they report their expenditure humanitarian aid’ below. In this (see ‘Data Sources’ section). ‘Other governments’ are sometimes referred to as ‘non-OECD report, figures are in constant 2009 DAC members’, ‘non-DAC donors’, ‘non-traditional donors’, ‘emerging donors’ or prices, unless otherwise stated. ‘south–south development partners’. (See Note) 91
  • 96.
    pRivAte ContRiButions Private contributionsare those from individuals, private foundations, trusts, private companies and corporations. In our ‘Where does the funding come from?’ section (Chapter 1), private contributions are those raised by humanitarian organisations, including NGOs, the UN and the International Red Cross and Red Crescent Movement. Data for the period 2006–2008 was collated directly from the sample of organisations and complemented by figures from annual reports. The study-set for this period included five UN agencies (UNHCR, UNRWA, WFP, the Food and Agriculture Organization (FAO) and the United Nations Children’s Fund (UNICEF)), 48 non-governmental organisations (NGOs), the International Committee of the Red Cross (ICRC) and the International Federation of Red Cross and Red Crescent Societies (IFRC). Data for 2009 and 2010 was extrapolated from the 2008 figure, using a coefficient of increase/decrease based on the analysis of annual reports, as well as private contributions reported to the FTS. In the ‘Where does the funding go?’ and ‘How does the funding get there?’ sections (Chapter 1), the data is taken from UN OCHA’s FTS (a disaggregation of NGO, Foundations and Red Cross/Crescent reporting in the FTS plus private contributions from individuals and the private sector). totAl oFFiCiAl HumAnitARiAn AssistAnCe Total official humanitarian assistance is a sub-set of ODA. In this report, we use it when making comparisons with other development assistance. It takes account of humanitarian expenditure through NGOs, multilateral UN agencies and funds, public-private partnerships and public sector agencies – and, in order to take account of multilateral ODA contributions to UN agencies with almost uniquely humanitarian mandates, we make the following calculations: • humanitarian aid as reported in DAC1 Official and Private Flows, Memo: Humanitarian Aid notes: (1) All of our humanitarian • total ODA disbursements to UNHCR, UNRWA and WFP, aid categories include money spent as recipients, reported in DAC2a ODA disbursements: through humanitarian financing • we do not include all ODA to WFP but apply a percentage in order to take mechanisms such as the Central into account the fact that WFP also has a ‘developmental’ mandate Emergency Response Fund (CERF) • humanitarian aid reported to UNICEF, the United Nations Population Fund and country-level pooled funds. (UNFPA), the United Nations Development Programme (UNDP) and ‘Other Where necessary, we impute amounts UN’ in DAC2a tables is also included in our calculation (see Notes). spent through the CERF in specific countries back to the donor (for disAsteR Risk ReduCtion (dRR) example, if Norway contributed Investments in DRR can be tracked using the OECD DAC’s Creditor Reporting System 10% of CERF funding in 2009 and (CRS) by extracting data from the humanitarian purpose code ‘disaster prevention and the CERF allocated US$10 million preparedness’ (74010). However, accounting for DRR measures that are sub-components to Afghanistan, US$1 million would of projects and do not fall within the allocated codes is challenging. We used short and be added on to Norway’s other long project descriptions to search for DRR activities within development and humanitarian humanitarian expenditure on projects programmes (not coded 74010). in Afghanistan). (2) The European institutions function The search terms were selected from recent literature on DRR and the websites of key both as a donor agency and as a DRR-focused organisations (e.g. United Nations International Strategy for Disaster multilateral recipient of EU member Reduction (UNISDR)). After each term search, the project descriptions were scanned and state funds. They provide direct donor those not related to DRR were removed, e.g. results for ‘prevention’ brought up projects support to developing countries as with a DRR focus such as flood prevention, but also included HIV/AIDS prevention. well as playing a federating role with otHeR inteRnAtionAl ResouRCes EU member states. We treat the EU institutions as a single donor within oFFiCiAl development AssistAnCe (odA) our DAC donor analyses. However, ODA is a grant or loan from an ‘official’ source to a developing country (defined by the totally unearmarked (‘multilateral’) OECD) or multilateral agency (defined by the OECD) for the promotion of economic ODA to the EU institutions is a core development and welfare. It is reported by members of the DAC, along with several other component of some donors’ overall government donors and institutions, according to strict criteria each year. It includes ODA/humanitarian aid contributions – sustainable and poverty-reducing development assistance (for sectors such as governance so we calculate the EC’s humanitarian and security, growth, social services, education, health and water and sanitation. aid (including its own unearmarked multilateral ODA to UNHCR, UNRWA In this report we express our total ODA figures net of debt relief unless expressly and WFP as a donor) and apportion a stated otherwise. share of this to each DAC EU member state – Austria, Belgium, Denmark, Finland, France, Germany, Greece, Ireland, Italy, Luxembourg, the Netherlands, Portugal, Spain, Sweden and the United Kingdom. 92
  • 97.
    GoveRnAnCe And seCuRityodA Within the OECD DAC CRS, ‘Government and Civil Society’ includes two groupings of activities. This is sub-divided into two further discrete groups of activities. • The first grouping, the government and civil society set of activities, is primarily concerned with building the capacity of recipient country governments – in areas including public sector policy, finance management, legislatures and judiciaries – as well as a range of thematic activities including support to elections, democratic participation, media and free flow of information, human rights and women’s equality. In 2010 anti-corruption and support to legislatures and political parties were added to the list of activities in this grouping. • The second grouping is concerned with conflict prevention and resolution, peace and security and includes activities supporting security system management and reform, removal of landmines and other explosive remnants of war, demobilisation of child soldiers, reintegration of demobilised military personnel, small arms and light weapons (SALW) control, civilian peacebuilding and some elements of bilateral support for multilateral peacekeeping operations (excluding direct contributions to the UN Department of Peacekeeping Operations (DPKO) budget). FoReiGn AssistAnCe Our figures for the foreign assistance of China, India, Brazil, Russia and South Africa (BRICS) are a conservative estimate based on secondary sources, which include those in the following list. • China: Deborah Brautigam’s the dragon’s Gift: the Real story of China in Africa, which references data from the China statistical yearbook (National Bureau of Statistics of China) and China Eximbank. These aid figures are the sum of official external assistance and Eximbank concessional loans. All figures are exclusive of debt relief. • india: Figures are taken from the Indian Ministry of Economic Affairs’ (MEA) annual reports and converted from financial years into calendar years. Foreign assistance disbursed by other ministries has not been captured. • Brazil: Figures are taken from the report ‘Brazilian International Development Cooperation 2005–2009’ published in 2010 by the Institute of Applied Economic Research (IPEA) and the Brazilian Cooperation Agency (ABC). • Russia: Time-series data for aid that Russia disburses is not publicly available. In 2007 the Russian government, in its preparatory concept note on Russian participation in international development assistance, estimated that total development assistance was US$212 million. A Russian Federation statement at the DAC senior-level meeting in April 2010 reported 2008 development assistance as totalling US$200 million. Sources include OECD DAC and the Ministry of Finance in Russia. • south Africa: Figures are taken from the Ministry of Foreign Affairs’ (MFA) budget report and converted from financial years into calendar years. Figures are not inclusive of development assistance disbursed by other ministries, which are reported to be between six and seven times the volumes reported by the MFA. otHeR deFinitions And ClAssiFiCAtions domestiC Response This includes the actions taken in response to humanitarian crises, to transfer resources to those most affected within an affected country, by domestic institutions (both informal and formal) and individuals either living there or temporarily resident elsewhere. ConFliCt-AFFeCted CountRies A set of conflict-affected states was identified for each of the years between 1999 and 2009 using the Uppsala Conflict Data Program (UCDP)’s database to determine the incidence of active conflict in a given year. This incorporated cases where state actors were involved as well as those where no state actor was involved, but where more than 25 battle deaths resulted. Where a multilateral peacekeeping mission has been present (excluding purely civilian missions), with no recurrence of violence for up to seven consecutive years, a country is deemed to be ‘post-conflict’. lonG-teRm HumAnitARiAn AssistAnCe CountRies (ltHACs) Long-term humanitarian assistance countries are defined as those receiving a greater than average (10.4%) proportion of ODA, excluding debt relief, in the form of humanitarian assistance for more than eight years between 1995 and 2009. Twenty-six countries are classified as receiving long-term humanitarian assistance; in 2009 they received US$7 billion of the US$10.1 billion from all donors reporting to the DAC. 93
  • 98.
    dAtA souRCes oeCd dAC •OECD DAC data allows us to say how much humanitarian aid donors reporting to the OECD Development Co-operation Directorate (DCD) give, where they spend it, who they spend it through and how it relates to their other ODA. • Aggregate information is published in OECD DAC Statistical Tables. • Detailed, project-level reporting is published in the Creditor Reporting System (CRS). • The data in this report was downloaded on 6 April 2011. Data for 2010 is preliminary and partial – full final data for the year (which will provide us with data on recipient countries and a breakdown of activities in 2010, as well as enabling us to publish a non-estimated humanitarian aid figure for DAC donors) will not be published until December 2011. • Some additional governments and donors voluntarily report to the OECD DAC. Together with OECD DAC members, the contributions that they report are used within our ‘all donors reporting to the OECD DAC’ figures in Chapter 3,’ Beyond the divide: Humanitarian assistance in context’. un oCHA Fts • We use UN OCHA FTS data to report on humanitarian expenditure of governments that do not report to the OECD DAC and to analyse expenditure relating to the UN consolidated note: UN OCHA FTS and OECD DAC appeals process (CAP). We have also used it in the ‘Where does it go?’ and ‘How does it data are not comparable. get there?’ sections of the report (Chapter 1) to analyse private contributions and money spent through NGOs, the Red Cross and Red Crescent Movement or a UN agency. • As well as being the custodian of data relating to UN CAP appeals, UN OCHA FTS receives data from donor governments and recipient agencies and also gathers information on specific pledges carried in the media or on donor websites, or quoted in pledging conferences. • Data for 2000–2010 was downloaded on 5 April 2011. un CeRF weBsite Our data on the CERF is taken from the UN CERF website. Data up to the end of 2010 was downloaded on 1 February 2011. CRed em-dAt disAsteR dAtABAse The Centre for Research on the Epidemiology of Disasters (CRED) is a leading repository of information on the impact of disasters. One of CRED’s core data projects is the EM-DAT disaster database, which contains data on the impact of 16,000 mass disaster events dating back to 1900. Data is sourced from UN agencies, NGOs, insurance companies, research institutes and press agencies. We use this data to generate analysis of the incidence and impact of natural disasters in developing countries. stoCkHolm inteRnAtionAl peACe ReseARCH institute (sipRi) SIPRI is an independent international institute dedicated to research into conflict, armaments, arms control and disarmament. SIPRI manages publicly accessible databases on: • multilateral peace operations – UN and non-UN peace operations since 2000, including location, dates of deployment and operation, mandates, participating countries, number of personnel, costs and fatalities. • military expenditure of 172 countries since 1988, allowing comparison of countries’ military spending: in local currency, at current prices; in US dollars, at constant prices and exchange rates; and as a share of GDP. • transfers of major conventional arms since 1950. • arms embargoes implemented by international organisations or groups of nations since 1998. We use this data to track international expenditure on multilateral peacekeeping operations. uppsAlA ConFliCt dAtA pRoGRAm (uCdp) UCDP has been recording data on ongoing violent conflicts since the 1970s. Its definition of armed conflict – ‘a contested incompatibility that concerns government and/or territory where the use of armed force between two parties, of which at least one is the government of a state, results in at least 25 battle-related deaths in one calendar year’ – is becoming a standard in how conflicts are systematically defined and studied. It has been operating an online database on armed conflicts and organised violence since 2004. inteRnAtionAl monetARy Fund (imF) We downloaded data from the International Monetary Fund’s (IMF) World Economic Outlook (WEO) database in April 2011 and used its gross domestic product (GDP) for DAC donors and 94
  • 99.
    gross national income(GNI) for non-DAC donors to measure economic performance. We also used IMF Regional Economic Outlook (REO) survey data, which shows additional information Further details and guides to our on specific countries and indicators, such as dependence on commodities and oil exports. We methodology and classifications use this data mainly to analyse government revenues (excluding grants); when this information can be found in the Data & Guides was missing, calculations have been made (subtracting ODA flows from general government section of our website: revenues data downloaded from the IMF WEO, to avoid double-counting grants). http://www.globalhumanitarian woRld BAnk assistance.org The World Bank data catalogue includes different datasets such as remittance inflows and outflows. The Global Economic Monitor (GEM) provides prices and indices relating to food, energy and other commodities, which are fundamental in understanding fluctuations and trends. Data from the World Bank’s online reports is also used for the multi-donor trust funds (MDTFs) that it manages. These include the Afghanistan Reconstruction Trust Fund (ARTF), Iraq’s MDTF, the Palestinian Recovery and Development Plan MDTF, Pakistan’s MDTF, South Sudan’s MDTF and the Sudan National MDTF, as well as the State and Peacebuilding Fund (SPF). un depARtment oF eConomiC And soCiAl AFFAiRs (un desA) Our per citizen/per capita/per person analyses use UN DESA’s population data. The data was downloaded in November 2010. united nAtions development pRoGRAmme (undp) multi-donoR tRust Fund (mdtF) oFFiCe GAtewAy The UNDP’s MDTF office database holds information on UN-managed pooled funds. We use this to collate data on the UN Peacekeeping Fund and the UN-managed Iraq MDTF. united nAtions ConFeRenCe on tRAde And development (unCtAd) UNCTAD is the United Nations body focusing on trade. Its online database provides statistics on trade flows and foreign direct investments (FDI). ouR own ReseARCH Our analysis on the sources of income for Red Cross and Red Crescent National Societies (see box in Section 1.3), was derived from data obtained directly from six national societies in response to a request from us. The societies were Denmark, the United Kingdom, Belgium, Canada, Sweden and France. Data on private contributions in Section 1.1 for the period 2006–2008 was collated directly from the sample of organisations and complemented by figures from annual reports. The study-set for this period included five UN agencies (UNHCR, UNRWA, WFP, FAO and UNICEF), 48 NGOs, ICRC and IFRC. Data for 2009 and 2010 was extrapolated from the 2008 figure, using a coefficient of increase/decrease based on the analysis of annual reports, as well as private contributions reported to the FTS. dAtA And tHe inteRnAtionAl Aid tRAnspARenCy initiAtive (iAti) At every stage in humanitarian response, decisions are made intended to encompass all resource flows and the IATI standard about where, how and when to spend money. These decisions was agreed in a way that ensures it can be used by a variety determine the type of organisations that are supported, the of donors and aid organisations, including those working in type of assistance that is delivered, the type of needs that are humanitarian contexts. prioritised and, consequently, whether peoples’ needs are met. With an agreement on what data items to publish, and Good information can help people to make informed choices. It a common format for the data, IATI is now working with can tell us how money is channelled through the system. And it participating donors, philanthropic foundations and CSOs to can help gauge the efficiency and effectiveness of the response. start publishing data that is compliant with the agreed standard. Tracking the humanitarian dollar through the system is currently Three organisations (the United Kingdom’s Department for hindered by the lack of a central repository of information and International Development (DFID), the Hewlett Foundation the absence of a feedback loop that enables the people affected and the World Bank) have started publishing their aid data in by crises to say what they have received and when. Without this a more comparable, timely and accessible format. A further feedback or aggregated data on what commodities and services six organisations have committed to do so before the Fourth have been delivered, the effectiveness and efficiency of the High Level Forum on Aid Effectiveness in November 2011. The humanitarian response is hard to measure. first NGOs are expected to publish their data between June In February 2011, a multi-stakeholder group of donors, aid and August 2011. It is hoped that this coverage will provide a recipient country governments and civil society organisations more comprehensive picture of aid and other resource flows to (CSOs) agreed on a final International Aid Transparency Initiative recipient countries. IATI has also held initial conversations with (IATI) standard for the publication of information about aid. While humanitarian organisations to understand how the standard initial publishers are mainly focused on development aid, IATI is could best be utilised in the humanitarian sector. 95
  • 100.
    ACRonyms And ABBReviAtions ABC Agência Brasileira de Cooperação (Brazilian Cooperation Agency) ARtF Afghanistan Reconstruction Trust Fund BRiCs Brazil, Russia, India, China and South Africa CAp Consolidated appeals process (UN) CAR Central African Republic CeRF Central Emergency Response Fund CHAp Common Humanitarian Action Plan CHF Common humanitarian fund – a country-level pooled fund mechanism CpA Comprehensive Peace Agreement (Sudan) CRed Centre for Epidemiology of Disasters CRs Creditor Reporting System (DAC) Cso Civil society organisation dAC Development Assistance Committee dCd Development Co-operation Directorate (OECD) deC Disasters Emergency Committee dFid Department for International Development (UK) dod Department of Defense (US) dpko UN Department of Peacekeeping Operations dpRk Democratic People’s Republic of Korea dRC Democratic Republic of Congo dRR Disaster risk reduction eC European Commission eCHo EC Directorate General for Humanitarian Aid and Civil Protection em-dAt Emergency Events Database eRF Emergency response fund – a country-level pooled funding mechanism eu European Union FAo Food and Agriculture Organization of the United Nations Fdi Foreign direct investment Fts Financial Tracking Service (UN OCHA) Gdp Gross domestic product Gem Global Economic Monitor (World Bank) GHA Global Humanitarian Assistance (the programme) GHd Good Humanitarian Donorship GnA Global Needs Assessment (EC tool) Gni Gross national income iAsC nAtF Inter-Agency Standing Committee Needs Assessment Taskforce iAti International Aid Transparency Initiative iCRC International Committee of the Red Cross idp Internally displaced person iFRC International Federation of Red Cross and Red Crescent Societies ifs Instrument for Stability (EC) imF International Monetary Fund inGo International non-governmental organisation ipeA Institute of Applied Economic Research 96
  • 101.
    ldC Least developed country liC Low-income country lmiC Lower middle-income country lnGo Local non-governmental organisation ltHAC Long-term humanitarian assistance country mCdA Military and civil defence assets mdG Millennium Development Goal mdtF Multi-donor trust fund miRA Multi-Cluster Initial Rapid Assessment nGo Non-governmental organisation nRdF National Disaster Response Fund (India) odA Official development assistance oeCd Organisation for Economic Cooperation and Development opt Occupied Palestinian Territories pRt Provincial Reconstruction Team (Spain) Reo Regional Economic Outlook (IMF) sAlw Small arms and light weapons sdRF State Disaster Response Fund (India) sipRi Stockholm International Peace Research Institute spF State and Peacebuilding Fund (World Bank) uAe United Arab Emirates uCdp Uppsala Conflict Data Program umiC Upper middle-income country un United Nations unCtAd United Nations Conference on Trade and Development un desA United Nations Department of Economic and Social Affairs undp United Nations Development Programme unFpA United Nations Population Fund unHCR United Nations High Commissioner for Refugees uniCeF United Nations Children’s Fund unisdR United Nations International Strategy for Disaster Reduction un oCHA United Nations Office for the Coordination of Humanitarian Affairs unRwA UN Relief and Works Agency for Palestine Refugees in the Near East wB World Bank weo World Economic Outlook (IMF) wFp World Food Programme 97
  • 102.
    98 FiGuRe 1: un ConsolidAted AppeAls pRoCess (CAp) AppeAls, 2000–2010 Fts AppeAl summARy, 2000-2010 us$ Billion 2000 2001 2002 2003 2004 2005 2006 2007 2008 2009 2010 Revised requirement 1.9 2.6 4.4 5.2 3.4 6.0 5.2 5.1 7.1 9.8 11.3 Funding 1.1 1.4 3.0 4.0 2.2 4.0 3.5 3.7 5.1 6.9 7.1 ReFeRenCe tABles Unmet need 0.8 1.1 1.4 1.3 1.2 2.0 1.7 1.4 2.0 2.8 4.2 % needs met 59.2% 55.4% 67.5% 75.8% 64.3% 67.2% 66.5% 72.2% 71.7% 71.2% 63.0% Number of appeals in year 14 18 24 27 31 25 24 30 23 23 19 ConsolidAted AppeAls us$ Billion 2000 2001 2002 2003 2004 2005 2006 2007 2008 2009 2010 Revised requirement 1.9 2.6 4.4 5.2 3.0 3.8 4.9 4.8 6.3 9.5 7.7 Funding 1.1 1.4 3.0 3.9 2.0 2.3 3.2 3.5 4.5 6.8 4.6 Unmet need 0.8 1.1 1.4 1.2 0.9 1.5 1.7 1.3 1.8 2.7 3.1 % needs met 59.2% 55.4% 67.5% 76.0% 68.0% 59.3% 65.3% 73.3% 71.9% 71.8% 59.8% Number of consolidated appeals in year 14 18 24 25 22 15 17 15 13 15 15 FlAsH AppeAls us$ Billion 2000 2001 2002 2003 2004 2005 2006 2007 2008 2009 2010 Revised requirement 0 0 0 0.03 0.5 2.2 0.3 0.4 0.8 0.3 3.6 Funding 0 0 0 0.02 0.2 1.8 0.3 0.2 0.6 0.1 2.5 Unmet need 0 0 0 0.02 0.3 0.4 0.0 0.2 0.2 0.1 1.1 % needs met 50.7% 39.8% 81.0% 85.3% 57.2% 70.8% 51.6% 70.0% Number of flash appeals in year 0 0 0 2 9 10 7 15 10 8 4 Source: OECD DAC, UN OCHA FTS and UN CERF
  • 103.
    FiGuRe 2: top20 ReCipients oF inteRnAtionAl HumAnitARiAn Aid 2000-2009 (us$ million) 5 yeARs 10 yeARs 2000 2001 2002 2003 2004 2005 2006 2007 2008 2009 05-’09 00-’09 Serbia Palestine/OPT Afghanistan Iraq Iraq Sudan Sudan Sudan Sudan Sudan sudan sudan 721 1,009 967 1,276 1,056 1,391 1,384 1,345 1,458 1,422 6,999 8,873 States Ex- Afghanistan Palestine/OPT Ethiopia Sudan Indonesia Palestine/OPT Palestine/OPT Ethiopia Palestine/OPT palestine/opt palestine/opt Yugoslavia 290 561 467 804 941 870 796 857 886 1,303 4,316 7,182 Palestine/OPT Serbia Angola Afghanistan Palestine/OPT Pakistan Lebanon DRC Palestine/OPT Ethiopia ethiopia iraq 273 309 279 488 654 721 536 414 863 692 2,881 5,121 Ethiopia Ethiopia Sudan Palestine/OPT Ethiopia Iraq Indonesia Lebanon Afghanistan Afghanistan Afghanistan Afghanistan 230 215 262 464 439 696 524 363 860 634 2,482 5,094 Mozambique DRC DRC Sudan Afghanistan Ethiopia Pakistan Iraq Somalia Somalia iraq ethiopia 169 187 262 361 431 658 451 363 604 573 2,325 4,801 Afghanistan Iraq Ethiopia Angola DRC Sri Lanka DRC Afghanistan DRC DRC dRC dRC 166 178 232 317 287 544 435 317 529 567 2,252 3,341 Angola Sudan Sierra Leone DRC Angola Palestine/OPT Iraq Ethiopia Myanmar Pakistan pakistan somalia 159 175 178 257 218 498 423 300 466 486 2,106 2,569 Timor-Leste India States Ex- Eritrea Liberia Afghanistan Afghanistan Bangladesh Iraq Iraq indonesia pakistan 142 158 Yugoslavia 153 177 175 320 349 285 376 468 2,036 2,417 Iraq Bosnia- DPRK Burundi Uganda DRC Ethiopia Somalia Zimbabwe Kenya somalia indonesia 140 Herzegovina 154 149 151 165 307 345 273 334 400 1,969 2,356 Sudan Angola Iraq Uganda Burundi Zimbabwe Somalia Pakistan China Zimbabwe lebanon lebanon 134 148 146 146 164 214 324 252 310 393 1,453 1,880 Bosnia- Sierra Leone Somalia Jordan Somalia Somalia Kenya Indonesia Kenya Chad sri lanka kenya Herzegovina 120 143 130 136 156 195 248 238 305 322 1,400 1,658 Jordan States Ex- Jordan Somalia Serbia Eritrea Uganda Uganda Chad Indonesia kenya sri lanka 119 Yugoslavia137 123 135 137 188 228 225 250 268 1,232 1,627 DRC Jordan Tanzania Sierra Leone Iran Uganda Sri Lanka Sri Lanka Lebanon Sri Lanka zimbabwe serbia 96 125 110 129 137 181 161 211 249 238 1,217 1,544 Tanzania Mozambique Serbia Serbia DPRK Burundi Burundi Kenya Sri Lanka Syria uganda uganda 89 125 108 128 133 171 151 193 246 193 1,025 1,510 India Tanzania Burundi Tanzania Eritrea Liberia Liberia Chad Uganda Lebanon Chad zimbabwe 80 116 104 124 122 146 148 186 238 192 996 1,478 Somalia DPRK Kenya DPRK Jordan India Jordan Zimbabwe Haiti Uganda myanmar Angola 80 100 95 120 109 130 116 163 212 152 740 1,343 Lebanon Somalia Lebanon Liberia Chad Chad Zimbabwe Jordan Pakistan Myanmar Jordan Jordan 78 99 90 106 105 128 115 120 196 151 659 1,272 Kenya Kenya Eritrea Zimbabwe Bangladesh Angola Chad Colombia Jordan Jordan Burundi Burundi 75 89 86 93 94 120 109 110 154 150 602 1,157 Indonesia Lebanon Zimbabwe Lebanon Lebanon Jordan Colombia Burundi Yemen Haiti Bangladesh Chad 74 87 85 81 91 119 102 109 138 145 576 1,135 Eritrea El Salvador Uganda Kenya Kenya Lebanon Niger Liberia Indonesia Georgia liberia liberia 73 86 80 77 90 112 76 108 136 143 551 944 99 Source: OECD DAC, UN OCHA FTS and UN CERF
  • 104.
    100 FiGuRe 3: top 30 donoRs oF inteRnAtionAl HumAnitARiAn Aid, 2000-2009 (us$ million) pReliminARy* 5 yeARs 10 yeARs 2000 2001 2002 2003 2004 2005 2006 2007 2008 2009 2010 05-’09 00-’09 united states united states united states united states united states united states united states united states united states united states united united states united states 1,876 1,996 2,030 3,448 2,812 3,718 3,208 3,087 4,421 4,376 states* 18,810 30,971 4,806 eu eu eu eu eu eu eu eu eu eu eu eu eu institutions institutions institutions institutions institutions institutions institutions institutions institutions institutions institutions* institutions institutions 1,149 1,183 1,067 1,109 1,427 1,850 1,848 1,660 1,959 1,613 1,604 8,930 14,864 united saudi Arabia united united Japan Japan united united united united united united united kingdom 688 657 kingdom 719 kingdom 850 914 885 kingdom kingdom 753 kingdom 895 kingdom kingdom* 951 kingdom 4,583 kingdom 1,054 1,024 8,183 netherlands Germany Germany Germany united united Germany Germany Germany Germany Germany* Germany Germany 566 579 582 506 kingdom 772 kingdom 858 832 659 743 727 685 3,783 6,527 Germany united netherlands norway Germany Germany netherlands netherlands spain spain Japan* netherlands netherlands 517 kingdom 570 390 364 559 822 649 545 614 632 537 2,963 5,094 sweden netherlands italy sweden netherlands netherlands sweden sweden netherlands sweden spain* sweden sweden 403 421 362 362 436 650 502 479 612 573 501 2,559 4,385 Japan sweden Japan netherlands France norway France norway saudi Arabia netherlands Canada* spain Japan 387 419 355 318 360 497 464 425 566 508 452 2,332 4,026 italy norway sweden italy italy sweden norway spain sweden France sweden* France norway 358 319 335 280 333 466 387 394 539 406 393 2,123 3,681 norway italy norway France sweden France spain France France Canada France* norway France 302 311 332 280 307 424 372 391 439 396 374 2,077 3,597 switzerland France France Japan norway italy italy italy italy norway norway* italy italy 242 303 294 276 286 387 371 372 416 375 339 1,908 3,552 France switzerland switzerland Canada spain spain Canada Canada norway italy netherlands* Japan spain 237 224 227 220 219 320 327 317 393 362 297 1,869 3,223 denmark Japan Australia switzerland switzerland denmark denmark denmark Canada uAe Australia* Canada Canada 199 224 225 210 215 307 297 266 380 353 266 1,666 2,640 Canada Canada Canada spain Canada switzerland Japan ireland Japan Australia saudi Arabia denmark denmark 176 192 187 207 198 260 240 227 302 324 256 1,400 2,278 Australia denmark denmark Australia denmark Australia switzerland switzerland Australia Japan Belgium* Australia switzerland 168 191 153 181 160 254 240 223 291 298 235 1,258 2,224 spain spain spain denmark Australia Canada Australia saudi Arabia denmark denmark italy* switzerland Australia 162 167 136 175 153 247 227 212 288 242 232 1,105 2,132
  • 105.
    FiGuRe 3: top30 donoRs oF inteRnAtionAl HumAnitARiAn Aid 2000-2009 (us$ million) – Continued pReliminARy* 5 yeARs 10 yeARs 2000 2001 2002 2003 2004 2005 2006 2007 2008 2009 2010 05-’09 00-’09 Belgium Australia Belgium Belgium Belgium Belgium Belgium Belgium ireland Belgium switzerland* saudi Arabia saudi Arabia 101 146 95 95 131 158 180 167 221 202 161 1,103 1,894 Finland Belgium Finland Finland uAe Finland Finland Australia Belgium switzerland Finland* Belgium Belgium 79 100 88 87 101 140 147 162 218 186 123 924 1,446 ireland Finland ireland saudi Arabia Finland saudi Arabia ireland Finland switzerland Finland denmark* ireland Finland 61 84 51 58 81 112 131 150 195 151 110 830 1,148 Greece ireland Greece ireland ireland ireland saudi Arabia Japan Finland ireland ireland* Finland ireland 38 59 35 57 68 109 131 144 141 142 109 729 1,127 Austria Greece luxembourg Austria Austria uAe Austria Austria uAe saudi Arabia Austria* uAe uAe 38 34 30 34 43 100 68 57 110 82 62 651 755 luxembourg luxembourg saudi Arabia Greece portugal turkey Greece luxembourg kuwait Austria turkey Austria Austria 25 33 29 33 41 79 57 49 96 77 61 374 548 portugal Austria Austria luxembourg Greece Austria luxembourg Greece Austria luxembourg luxembourg* Greece Greece 22 33 26 30 40 78 53 48 94 59 52 265 445 saudi Arabia portugal south Africa kuwait luxembourg China uAe uAe Greece Greece Russia luxembourg luxembourg 12 23 20 28 38 66 44 45 54 50 38 250 405 new zealand korea portugal Russia saudi Arabia Greece portugal new zealand luxembourg kuwait Greece* kuwait portugal 7 15 19 17 35 57 33 36 52 34 38 178 272 China new zealand Russia portugal new zealand new zealand new zealand portugal Russia Russia uAe new zealand new zealand 6 7 18 17 20 55 27 23 44 32 38 174 234 turkey taiwan (province new zealand Qatar Russia Qatar kuwait korea, Rep new zealand new zealand China portugal kuwait 3 of China) 1 11 15 17 46 24 15 29 27 38 150 221 korea, Rep Qatar india new zealand korea, Rep portugal korea, Rep turkey thailand portugal india Russia Russian 2 1 7 15 14 42 21 11 27 25 37 120 Federation 175 Romania China korea, Rep india kuwait luxembourg Russia kuwait portugal korea, Rep Brazil turkey korea, Rep 2 1 5 13 11 37 20 11 27 19 29 116 146 Russia Russia Algeria south Africa turkey kyrgyzstan south Africa China korea, Rep Qatar portugal* korea, Rep turkey 2 1 5 9 10 27 16 7 24 13 22 104 134 south Africa south Africa turkey korea, Rep south Africa india turkey Czech kazakhstan india new zealand* China China 2 0 4 5 5 25 11 Republic 4 10 11 19 83 94 Note: Data for members of the OECD DAC, 2000-2009, includes their core ODA to UNHCR, UNRWA and WFP (as well as core ODA to EU institutions for EU15 members). It is expressed in constant 2009 prices. *Data for 2010 is partial and preliminary. It does not include the core ODA elements. Data for other donors is taken from UN OCHA FTS and is in current prices. All figures include contributions through the UN’s Central Emergency Response Fund (CERF) and pooled funding mechanisms. Source: Development Initiatives based on OECD DAC and UN OCHA FTS 101
  • 106.
    FiGuRe 4: top20 ReCipients oF totAl oFFiCiAl HumAnitARiAn AssistAnCe (us$ million, ConstAnt 2009 pRiCes) 102 5 yeARs 10 yeARs 2000 2001 2002 2003 2004 2005 2006 2007 2008 2009 05-’09 00-’09 Serbia Afghanistan Afghanistan Iraq Iraq Sudan Sudan Sudan Sudan Sudan sudan sudan 721 562 856 1,140 1,077 1,376 1,363 1,314 1,371 1,305 6,729 8,495 States Ex- Palestine/OPT Palestine/OPT Ethiopia Sudan Indonesia Palestine/OPT Palestine/OPT Afghanistan Palestine/OPT palestine/opt palestine/opt Yugoslavia 290 363 465 804 845 740 805 858 850 1,188 4,101 6,229 Palestine/OPT Serbia Angola Afghanistan Palestine/OPT Iraq Indonesia DRC Ethiopia Ethiopia ethiopia iraq 273 309 276 486 564 668 507 416 832 681 2,814 5,031 Ethiopia Ethiopia Sudan Palestine/OPT Ethiopia Ethiopia Pakistan Iraq Palestine/OPT Afghanistan Afghanistan Afghanistan 229 213 261 462 439 656 448 376 773 578 2,418 4,914 Afghanistan DRC DRC Sudan Afghanistan Pakistan DRC Lebanon Somalia DRC iraq ethiopia 164 187 261 358 429 533 436 338 552 561 2,349 4,731 Mozambique Iraq Ethiopia Angola DRC Palestine/OPT Iraq Afghanistan DRC Pakistan dRC dRC 160 178 232 311 287 478 433 318 528 544 2,247 3,333 Angola Sudan Sierra Leone DRC Angola Sri Lanka Lebanon Ethiopia Iraq Somalia pakistan somalia 158 172 177 256 215 400 418 302 382 528 1,944 2,452 Timor-Leste India States Ex- Eritrea Liberia Afghanistan Afghanistan Somalia Myanmar Iraq indonesia pakistan 142 154 Yugoslavia 154 175 172 320 352 267 350 491 1,874 2,247 Iraq Bosnia- DPRK Burundi Uganda DRC Ethiopia Pakistan Zimbabwe Kenya somalia indonesia 140 Herzegovina 154 148 150 165 307 343 244 328 395 1,857 2,196 Sudan Angola Iraq Uganda Burundi Zimbabwe Somalia Indonesia Kenya Zimbabwe lebanon lebanon 130 145 147 145 163 213 319 237 300 390 1,309 1,736 Bosnia- Sierra Leone Somalia Jordan Somalia Somalia Kenya Uganda Lebanon Chad sri lanka kenya Herzegovina 120 141 129 136 154 190 243 225 249 318 1,245 1,641 Jordan States Ex- Jordan Somalia Serbia Eritrea Uganda Sri Lanka Sri Lanka Indonesia kenya serbia 119 Yugoslavia 137 123 134 133 188 228 210 242 257 1,216 1,539 DRC Jordan Tanzania Serbia DPRK Uganda Sri Lanka Kenya Chad Sri Lanka zimbabwe uganda 95 126 110 128 124 180 162 194 239 231 1,208 1,504 Tanzania Mozambique Serbia Sierra Leone Iran Burundi Burundi Chad Uganda Lebanon uganda sri lanka 89 125 109 128 124 170 151 182 235 192 1,019 1,466 India Tanzania Burundi Tanzania Eritrea Liberia Liberia Zimbabwe Haiti Uganda Chad zimbabwe 80 115 104 124 121 145 148 163 201 152 970 1,465 Somalia Somalia Kenya Liberia Jordan Chad Jordan Jordan Pakistan Jordan Jordan Angola 80 98 95 104 109 123 116 121 174 150 652 1,328 Lebanon Kenya Lebanon Zimbabwe Chad Angola Zimbabwe Bangladesh Jordan Haiti myanmar Jordan 78 88 90 93 97 120 114 115 147 147 620 1,265 Kenya Lebanon Eritrea DPRK Bangladesh Jordan Chad Colombia Bangladesh Myanmar Burundi Burundi 75 87 86 90 94 119 107 110 138 146 605 1,158 Indonesia El Salvador Zimbabwe Lebanon Lebanon Lebanon Colombia Burundi Indonesia Georgia Haiti Chad 74 85 83 81 91 112 102 108 133 143 538 1,100 Eritrea Guinea Uganda Kenya Kenya Colombia India Liberia Syria Syria liberia liberia 73 83 80 77 90 95 75 108 105 111 533 923 Source: Development Initiatives based on OECD DAC
  • 107.
    FiGuRe 5: top20 ReCipients oF totAl odA, exCludinG deBt RelieF (us$ million, ConstAnt 2009 pRiCes) 5 yeARs 10 yeARs 2000 2001 2002 2003 2004 2005 2006 2007 2008 2009 05-’09 00-’09 China India Pakistan Iraq Iraq Iraq Iraq Iraq Afghanistan Afghanistan iraq iraq 2,271 2,493 2,661 2,730 5,141 8,892 5,872 4,469 4,753 6,234 25,272 33,681 Vietnam Pakistan India Vietnam Afghanistan Afghanistan Afghanistan Afghanistan Iraq Ethiopia Afghanistan Afghanistan 2,108 2,481 2,388 2,243 2,649 3,149 3,199 3,960 3,247 3,814 21,295 28,736 Indonesia Serbia China Tanzania Vietnam Indonesia Pakistan Vietnam Ethiopia Vietnam ethiopia vietnam 1,960 2,215 2,055 2,097 2,125 2,309 2,337 2,681 3,216 3,737 13,737 23,641 Serbia China Afghanistan Afghanistan Ethiopia Vietnam Sudan Ethiopia Vietnam Palestine vietnam ethiopia 1,938 2,199 1,864 2,011 1,951 2,181 2,222 2,572 2,528 /OPT 3,026 13,220 22,209 India Vietnam Vietnam Ethiopia China Ethiopia Vietnam Pakistan Palestine Tanzania sudan tanzania 1,837 2,101 1,844 1,989 1,951 2,119 2,093 2,259 /OPT 2,485 2,920 11,010 19,046 Bangladesh Indonesia Ethiopia China Tanzania China Ethiopia Tanzania Sudan Iraq tanzania pakistan 1,491 1,909 1,833 1,672 1,906 2,078 2,017 2,190 2,320 2,791 10,952 18,609 Egypt Ethiopia Mozambique Bangladesh Pakistan Sudan Tanzania Sudan Tanzania Pakistan pakistan China 1,474 1,662 1,765 1,632 1,591 2,047 1,934 2,134 2,231 2,774 10,667 17,793 Mozambique Egypt Indonesia Jordan Bangladesh India Uganda Palestine/OPT India India palestine/opt india 1,372 1,417 1,581 1,464 1,578 2,032 1,627 1,933 2,069 2,502 10,358 17,752 Tanzania Bangladesh DRC Serbia Egypt Pakistan Mozambique Mozambique Bangladesh Sudan india palestine 1,286 1,392 1,546 1,461 1,521 1,825 1,626 1,800 1,972 2,287 9,422 /opt 16,558 Uganda Palestine/OPT Tanzania Indonesia Mozambique Tanzania Palestine Uganda Mozambique DRC mozambique mozambique 1,117 1,364 1,458 1,410 1,460 1,677 /OPT 1,625 1,745 1,907 2,207 8,829 16,083 Ethiopia Tanzania Egypt Mozambique Uganda Mozambique India China Uganda Mozambique uganda Bangladesh 1,036 1,347 1,387 1,346 1,406 1,482 1,479 1,585 1,591 2,013 8,097 14,624 Bosnia-Herzegovina Mozambique Palestine/OPT Uganda Serbia Bangladesh China Bangladesh DRC Uganda dRC uganda 1,005 1,311 1,301 1,261 1,363 1,460 1,454 1,483 1,578 1,785 7,681 14,154 Palestine/OPT Uganda States Ex- Palestine Palestine DRC DRC India Pakistan Kenya China sudan 961 1,255 Yugoslavia 1,165 /OPT 1,257 /OPT 1,317 1,443 1,321 1,340 1,473 1,776 7,645 14,015 Zambia Bosnia Zambia Bolivia DRC Uganda Indonesia Kenya China Nigeria Bangladesh indonesia 909 -Herzegovina 1,024 1,108 1,160 1,221 1,349 1,299 1,314 1,396 1,659 7,439 13,624 Ghana Ghana Bangladesh Ghana Ghana Sri Lanka Bangladesh Nigeria Kenya Ghana indonesia serbia 843 979 1,091 1,157 1,217 1,305 1,299 1,170 1,322 1,573 6,598 12,414 Nicaragua Bolivia Uganda Egypt Sudan Palestine Ghana Ghana Ghana Turkey Ghana dRC 817 971 1,018 992 1,148 /OPT 1,289 1,238 1,165 1,251 1,362 6,436 11,864 Thailand Honduras Serbia Colombia Bolivia Ghana Morocco DRC Nigeria Zambia kenya Ghana 761 930 1,000 959 914 1,209 1,215 1,131 1,186 1,258 6,203 11,513 South Africa Nicaragua Bolivia Philippines Morocco Serbia Colombia Morocco Egypt Bangladesh nigeria egypt 759 837 890 883 914 1,011 1,092 1,130 1,151 1,226 5,424 11,390 Philippines Zambia Ghana Sri Lanka Zambia Zambia Serbia Burkina Faso Indonesia China morocco kenya 738 797 882 844 904 938 1,004 986 1,133 1,132 5,134 9,515 Jordan Philippines Bosnia South Africa Madagascar Egypt Kenya Lebanon Turkey Haiti zambia zambia 724 783 -Herzegovina 847 833 882 923 965 971 1,119 1,098 5,098 9,470 103 Source: Development Initiatives based on OECD DAC
  • 108.
    104 FiGuRe 6:top 20 donoRs oF totAl oFFiCiAl development AssistAnCe (odA), exCludinG deBt RelieF (us$ million, ConstAnt 2009 pRiCes) 5 yeARs 10 yeARs pReliminARy 2000 2001 2002 2003 2004 2005 2006 2007 2008 2009 05-’09 00-’09 2010 Japan United States United States United States United States United States United States United States United States United States United States united states united states 13,662 13,700 15,224 17,298 22,124 26,127 23,191 22,360 26,459 28,654 126,792 207,294 29,852 United States Japan Japan EU institutions EU institutions EU institutions EU institutions EU institutions EU institutions EU institutions EU institutions eu institutions eu institutions 12,154 11,192 10,948 9,867 10,688 11,308 11,985 12,191 12,739 13,285 61,509 110,984 13,546 EU institutions EU institutions EU institutions Japan Japan Japan Japan Germany Germany Germany Germany Japan France 8,897 10,842 9,180 9,438 9,567 9,835 9,626 9,817 11,148 11,982 49,591 99,872 13,523 Germany Germany Germany Germany France France Germany France France United Japan united united 8,046 8,222 7,345 7,234 8,247 7,944 8,902 8,756 9,595 Kingdom 45,063 kingdom kingdom 11,240 88,668 13,475 France France France United Germany Germany United United United France France Germany Germany 6,510 6,800 6,975 Kingdom 8,230 7,742 Kingdom Kingdom Kingdom 9,702 44,150 78,680 13,272 6,880 8,174 7,968 9,586 United Netherlands United France United United Kingdom France Japan Japan Japan United France Japan Kingdom 5,628 Kingdom 5,996 Kingdom 6,914 8,153 7,557 8,630 9,415 Kingdom 74,324 10,574 5,695 5,380 6,868 43,882 Netherlands United Netherlands Netherlands Netherlands Netherlands Netherlands Netherlands Netherlands Spain Netherlands netherlands netherlands 5,587 Kingdom 5,022 5,005 4,849 5,661 5,935 6,062 6,621 6,488 30,662 56,754 6,570 5,616 Denmark Italy Arab Countries Arab Countries Canada Italy Spain Spain Spain Netherlands Spain spain spain 3,049 3,066 3,633 3,218 3,210 4,190 3,896 5,132 6,338 6,382 25,001 38,900 6,197 Canada Denmark Norway Norway Norway Canada Sweden Sweden Arab Countries Sweden Sweden sweden Canada 2,751 2,980 2,980 3,092 3,006 3,783 3,827 3,979 5,118 4,528 20,115 33,706 4,509 Sweden Spain Spain Spain Spain Sweden Canada Canada Canada Norway Canada Canada norway 2,548 2,7373 2,962 2,791 2,978 3,562 3,576 3,898 4,291 4,070 19,500 33,515 4,233 Norway Norway Italy Canada Italy Norway Norway Italy Sweden Canada Norway norway sweden 2,443 2,615 2,940 2,731 2,940 3,361 3,227 3,631 4,219 3,952 17,732 31,870 4,225 Spain Sweden Sweden Sweden Sweden Spain Denmark Norway Italy Arab Countries Italy italy italy 2,430 2,604 2,912 2,646 2,879 3,147 2,503 3,617 3,916 3,355 17,294 31,044 3,248 Italy Canada Canada Italy Denmark Denmark Italy Denmark Norway Italy Arab Countries Arab Countries Belgium 2,206 2,479 2,844 2,597 2,518 2,526 2,433 2,584 3,458 3,123 13,997 26,769 3,109 Australia Australia Denmark Denmark Arab Countries Australia Arab Countries Australia Denmark Denmark Denmark denmark Australia 1,839 1,757 2,726 2,448 2,205 1,991 2,415 2,370 2,628 2,806 13,047 24,112 3,096 Switzerland Switzerland Australia Australia Switzerland Switzerland Australia Belgium Australia Australia Australia Australia denmark 1,535 1,551 1,842 1,856 1,897 1,912 2,127 1,852 2,565 2,759 11,813 20,988 2,931 Belgium Belgium Belgium Switzerland Australia Belgium Switzerland Switzerland Belgium Belgium Belgium Belgium switzerland 1,427 1,493 1,545 1,705 1,879 1,804 1,886 1,844 2,231 2,505 10,240 17,919 2,205 Austria Austria Switzerland Belgium Belgium Arab Countries Belgium Arab Countries Switzerland Switzerland Switzerland switzerland Finland 670 685 1,474 1,532 1,557 1,411 1,848 1,699 1,967 2,147 9,756 17,795 1,380 Arab Countries Finland Finland Finland Finland Finland Ireland Ireland Ireland Finland Finland Finland Austria 636 654 732 742 788 900 1,084 1,147 1,230 1,290 5,331 8,875 1,242 Finland Ireland Ireland Ireland Austria Austria Finland Finland Finland Austria Ireland ireland korea, Rep 627 496 626 644 713 802 979 1,026 1,135 1,083 5,267 8,142 1,026 Portugal Portugal Austria Austria Ireland Ireland Austria Austria Austria Ireland Austria Austria ireland 477 469 583 634 692 799 861 922 956 1,006 4,624 7,910 957 Source: Development Initiatives based on OECD DAC
  • 109.
    ACknowledGements THANK YOU The GlobalHumanitarian Assistance team would like to thank the many people that have been involved in helping us put GHA Report 2011 together. • Our colleagues at Development Initiatives (DI), including the consulting staff and interns. • Diane Broadley of Broadley Design and David Robinson of Hype & Slippers for their substantial input into the design of this report. Their creativity and commitment to the project is very much appreciated. Also David Wilson for proofreading the report, and Jenn Warren, Ton Koene, IFRC and WFP for providing the photographs. • The OECD DAC and UN OCHA FTS for extensive use of their data. In addition, we would like to extend our thanks to the teams within these organisations for their ongoing support in assisting us with its interpretation and use. • Red Cross societies for their contributions: Croix-Rouge de Belgique, Canadian Red Cross, Swedish Red Cross, Croix-Rouge française, Danish Red Cross, British Red Cross. We would like to thank the programme’s funders for their support: the International Humanitarian Assistance Directorate (IHA) of the Canadian International Development Agency (CIDA); the Department for Humanitarian Assistance and NGO Cooperation, Ministry of Foreign Affairs, Denmark; the Humanitarian Aid Division of the Ministry of Foreign Affairs, the Netherlands; the Swedish International Development Cooperation Agency (Sida), Sweden; and the Department for International Development (DFID), the United Kingdom. The report was authored by GHA team members Jan Kellett (Programme Leader), Lisa Walmsley (Data & Communications Advisor) and Lydia Poole (Policy Advisor) with extensive assistance from the rest of the team: Kerry Smith, Jane Keylock, Hannah Sweeney, Velina Stoianova, Daniele Malerba, Dan Sparks and Georgina Brereton coordinating production. Additional editorial guidance was given by DI Co-Director, Judith Randel. 105
  • 110.
  • 111.
    Development Initiatives isan independent organisation that sees improving aid effectiveness as part of its commitment to the elimination of absolute poverty by 2025. Global Humanitarian Assistance (GHA) is a data access and transparency programme of Development Initiatives which analyses aid flows to people living in humanitarian crises, and researches and publishes annual GHA reports. The programme is funded by the governments of Canada, Denmark, Netherlands, Sweden and the United Kingdom. The report is produced entirely independently. The data analysis, content and presentation are solely the work of Development Initiatives and are a representation of its opinions alone. For further details on the content of this report including communication with its authors, or to ask questions or provide comments, please contact us by email (gha@devinit.org) or visit our website at www.globalhumanitarianassistance.org
  • 112.
    GHA Report 2011presents the very latest data on financial flows to humanitarian crises. Chapters on the provenance, destination and journey of humanitarian funding, the forces which shape humanitarian assistance, and looking beyond humanitarian assistance to put it in the context of other resource flows, reveal the complexity of humanitarian response. In a world where humanitarian aid is being called upon to respond to multiple coexisting challenges, it is essential that decision makers have a transparent view of all funding flows and resources allocated. It is only in this way that we can determine whether the right choices are being made. Development Initiatives, Keward Court Jocelyn Drive, Wells,Somerset, BA5 1DB, UK T: +44 (0) 1749 671343 F: +44 (0) 1749 676721