
Recommended
Recommended
More Related Content
What's hot
What's hot (20)
Viewers also liked
Viewers also liked (12)
Similar to Kainai Environmental Education Awareness Summit 2014
Similar to Kainai Environmental Education Awareness Summit 2014 (20)
Recently uploaded
Recently uploaded (20)
Kainai Environmental Education Awareness Summit 2014
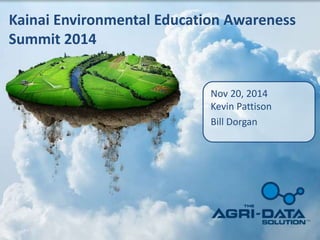
- 1. TITLE HEREKainai Environmental Education Awareness Summit 2014 Nov 20, 2014 Kevin Pattison Bill Dorgan
- 2. TITLE HERE Your land is your most precious resource. Why is Data Important?
- 3. TITLE HERE • Projected 9 Billion mouths to feed by 2050. • Food production must increase 70% percent to feed that many people. • Farms must find a way to meet the rising demand for food in an environmentally sustainable manner. Why is data Important
- 4. TITLE HEREConsumers Want Sustainable Food
- 6. TITLE HERE • Soil Conservation (Tillage Practices) • Nitrogen Use Efficiency (4-Rs) – Right Rate – Right Source – Right placement – Right Timing • Water Use Efficiency • Energy Use How do we measure sustainability.
- 7. TITLE HERE • The Agri-Data Solution is a secure, global online sustainability & food security platform for agriculture. • It is a secure web based application that can track all aspects of what is happening on your land. Why Agri-Data Solution
- 8. TITLE HEREOver 65 Million Acres to date 8
- 9. TITLE HERETrack Tennants Management Agri-Data Solution can help you keep track of your tenants and which fields they are farming each year.
- 10. TITLE HERETrack all the fields and their history
- 11. TITLE HEREIntegration of Geo Spatial Data Integration of GIS Data into a system everyone can access. Pull the system up real time to see a map of the fields and confirm you are in the right field. 11
- 12. TITLE HEREReal time GIS tracking. Use an IPAD, IPhone or Android device to locate a field boundary and navigate to it.
- 13. TITLE HERETrack Seeding and Fertility Data Seed and variety details for Crop Rotation. Fertility details to make sure tenants are not mining the land.
- 14. TITLE HEREVRT Report for Applicator breaks down rates by tank and details product blends. Variable Rate takes data management to a whole new level. Great way to increase efficiency. 14
- 15. TITLE HERE • Integrate Lab Data directly back into your data platform, via web services. • Use of Barcoding to eliminate data entry errors. • Analyze data Integration of Soil Test Data 15
- 17. TITLE HEREPesticides Track which pesticides are applied each year. Ability to provide tenants pesticide history report on land for crop rotation selection.
- 18. TITLE HERE • Instantly pull up crop history and pesticide history for any field. Pesticide and Crop History
- 19. TITLE HERE Field scouting would let you conduct and organize field audits. Review weeds, insects or diseases, take soil or tissue tests and document with pictures.
- 20. TITLE HEREIrrigation Management Track how much water is being used on each field. Benchmark water usage between crops or growers. Integrate weather data and soil moisture Probes
- 22. TITLE HERESoil Moisture Monitoring
- 23. TITLE HERETrack Yield History Track yields to access land productivity. Potentially adjust rental rates based on historical data. Use yield data to benchmark fertilizer efficiency
- 26. TITLE HEREMobile Interface for Collecting Data
- 30. People – Platform - Process
- 31. Legislative History Climate Change and Emissions Management Act (2007) Mandatory reporting of GHGs by industry - 2003 • Intensity targets and baselines for large facilities established in 2007 – a 12% reduction/year • Large Final Emitters (“LFEs”) defined and identified • LFEs MUST be compliant by March 31st of each year
- 32. Large Industrial Emitters Profile (>100,000 tonnes CO2e/year)
- 33. Options to Achieve Targets-12% Reduction from Baseline Annually • Emission Performance Credits – These are credits for better than target performance • Fund Credits – Invest in the Climate Change and Emissions Management Fund at $15/tonne – funds used to develop or invest in Alberta based technologies, programs, and other priority areas (as per CCEMA) • Emission Offsets – Voluntary emission reduction opportunities in support of achieving environmental objectives
- 34. Applicable Producer Protocols for Producers Conservation Tillage NERP (Nitrous Oxide Emission Reduction Protocol)
- 35. Definitions of tillage systems in the Parkland1 and Dry Prairie Protocol areas Tillage System Cropped Land Period 2 Fallow Period 3 No Till Up to two passes with low-disturbance openers (up to 38%) 4, 5 or one pass with a slightly higher disturbance opener (up to 46%) to apply seed, fertilizer or manure 5, discretionary tillage of up to10% 6 No cultivations Notes: 1 The Peace River Lowland ecoregion is contained within the Parkland zone. 2 Cropped land period applies to the management cycle that terminates at harvest, (e.g. harvest to harvest is the cropped land period). This includes land preparation for seeding which may occur in the previous fall. 3 Fallow period extends from harvest for one full year to the next fall. 4 Percentage values associated with openers are based on maximum opener width (e.g. 5 inch openers actually measure 5.5 inches) divided by the shank spacing of the implement. 5 Additional operations with harrows, packers, or similar non-soil disturbing implements are accepted. Where a second low soil disturbance operation is performed it is normally for injection of fertilizer or manure. 6 Discretionary tillage of up to 10% means that up to 10% of the surface area of a single agricultural field may be cultivated to address specific management issues. These areas are determined on an annual basis, meaning that specific areas may change from year to year.
- 37. Rules for the Offset Market Emission Offsets must: – Result from actions taken on or after Jan 1, 2002; Major change January 1, 2012 – Be real, demonstrable, quantifiable, measurable; – Occur at a place other than a regulated facility and from actions not otherwise required by law; – Have clearly established ownership- Tillage (not NERP) – Be counted once for compliance purposes; – Be verified by a qualified third party; – Occur in Alberta – Data must be housed for 7 years in a suitable format.
- 38. Changes January 1, 2012 Yield: Was Now Parkland Zero Till 0.16 t/ac 0.11 t/ac Dry Prairie Zero Till 0.089 t/ac 0.058 t/ac “No till adoptions levels based on 2006 Census of Agriculture data, have increased 20% since 2001. This has resulted in a reduction in the sequestration coefficients based on higher adoption levels. The scope for the tillage system management component of the protocol has also been restricted to farms practicing no till management. All coefficients in this protocol have been revised based on 2006 Census of Agriculture data.”
- 39. Changes Cont’d • Assurance (Evidence) Was “Limited” level- grower’s attestation Now “Reasonable” level - more evidence • No Retroactive claims allowed Was – Jan 1, 2002 Now - Current year only and each year going forward
- 40. NERP • Nitrogen use efficiency • Based on Kg production vs. Kg of N applied • “stacks” on top of Tillage • ACCURATE timing, rates, yield, and a crop plan • Agronomically “sound”
- 41. Looking Ahead….. NERP Feedlot Beef Methane Reductions $30-40/tonne National and International regulations
- 42. A Useful Partner
- 43. ISO
- 44. Thank you for your interest.
- 45. TITLE HERE
Editor's Notes
- Each boundary is color coded based on crop type. As crop types are changed, the map colors change dynamically.
- Produce simple report for users to put plans into action.
- Integration of Analytical data into the system. Soil Test, Tissue Tests, etc. All lab data can be integrated automatically from Labs via Web Services or FTP of Flat files. Current working with labs in the Canada and the USA.
- Export Yield data into professional reports.