June 2017 Investment Commentary & Performance
•
0 likes•53 views

Second Quarter 2017 Market Commentary & Portfolio Review

Recommended
Recommended
More Related Content
What's hot
What's hot (20)
Similar to June 2017 Investment Commentary & Performance
Similar to June 2017 Investment Commentary & Performance (20)
More from Anthony A. Lombardi, CFA
More from Anthony A. Lombardi, CFA (20)
Recently uploaded
Recently uploaded (20)
June 2017 Investment Commentary & Performance
- 1. ¹Comments and opinions expressed reflect solely the personal views of Anthony Lombardi as of 6/30/17, and not any other individual or firm. Such views are not a recommendation to buy or sell any security, fund or portfolio. Any investment decision should be made in consultation with a financial advisor. JUNE 2017 INVESTMENT COMMENTARY1 What’s Old is New Again With our typical investment horizon targeted at ~3-5 years, implicit in this holding period is not simply low turnover (and low cost), but a time-period integral to an investment discipline that is undeterred by short-term events and emotions. In managing our high conviction, concentrated, contrarian, large cap value process, we need not scramble adjusting our long-standing views, or portfolio positioning due to weekly or quarterly events. In our December and March commentaries we detailed our reasons as to not succumbing to near-term emotions of a new political landscape, including the election results, celebratory festivities, the subsequent executive branch management hangover, in-fighting and bipartisan battles sprinkled with investigations that have since transpired. Investment backdrops do not simply formulate overnight, nor should a disciplined investment process and philosophy seek to radically alter a portfolio’s stock selection and sector allocation in the same vein.
- 2. ¹Comments and opinions expressed reflect solely the personal views of Anthony Lombardi as of 6/30/17, and not any other individual or firm. Such views are not a recommendation to buy or sell any security, fund or portfolio. Any investment decision should be made in consultation with a financial advisor. JUNE 2017 INVESTMENT COMMENTARY1 We continue to listen to the market, the macro backdrop, sector and company news flow, and the corresponding swings in investor psychology. The pendulum in the second quarter remained quite active and, as it always does, reflected market emotions at work. No investor, us included, is going to get things right all the time, but we will always bring 100% of our passion for finding contrarian value, stay true to our process, and have unrelenting focus on MOS (margin of safety). Whether a function of near- or intermediate-term fundamentals, and/or investor psychology, our focus remains on recognizing, assessing and seizing upon valuations that potentially present opportunities, be they BUY or SELL. As contrarian, high conviction, long-term investors, employing an active, concentrated, large cap value strategy, such swings serve as a building block in our constant assault seeking out opportunities for entry into, and exit from, investment positions. In implementing our disciplined process, we overlay our longer-term secular view as it pertains to the broader macroeconomic and market backdrop, which results in active sector and stock exposures. Due to these factors and our assessment of the landscape, we have maintained a notably contrarian view in our LCV portfolio, with a heavy dose of conviction, cheapness, free cash flow and MOS. As the offspring of a “merger” between a regional bell operating company, mid-level manager mother, and a blue collar, tri-part mailman/supermarket shelf-stacking/paper delivering father, the trends, competitive dynamics, transformations, destruction and birth we have personally witnessed during our lifetime in business models permutating within connectivity and delivery logistics has been nothing short of amazing. And, it has certainly provided us perspective. Things take time, but less time than they did in the past. And things purchased online certainly seem inexpensive, and likely more so to a certain cohort of a millennial-aged demographic---although dad still stands firm about the cheap price of many items, circa “When I was your age….”. But we think even dad would agree that speed of delivery of items ordered, the digital substitution of letters & stamps, auto-bill pay, emails and social networks have clearly taken a bite out of the door-to-door neighborhood walks he was accustomed, and come without having to carry that big ‘ole heavy leather bag on his shoulder through all types of inclement weather. However, he is still getting his head around asking a gal named Alexa--who is quite friendly, engages in friendly conversation but never shows her face--to order an item and have it delivered within a day or two. Mom’s world was sprung from the forced regulatory divestiture of King Pin AT&T, only to then bear witness to the massive “re-consolidation” wave of the “Bell children” back into their parents. As kids, my siblings and I thought getting the extra rotary land-line phone in our bedroom, with the help of mom’s corporate discount, put us ahead of the class in connecting with our friends. We were slightly off with our early market assessment. As investment professionals, this investor has worked thorough the reconstitution and analysis of the RBOC offspring, back into two major players, whom have experimented heavily with their business models in many areas, but most successfully in wireless and broadband/fiber. These permutations came with heavy capital investment and acquisitions, with the goal to solidify a higher growth and margin profile, particularly as the legacy landline business atrophied, both organically and via divestiture. Now, however, competition in both these higher margin areas has intensified, particularly from stand-alone players that have become stronger, both operationally and financially with the help of low interest rates. Content distribution technology and consumer demands are also applying pressure on traditional owners within media, and has pressured management teams to react once
- 3. ¹Comments and opinions expressed reflect solely the personal views of Anthony Lombardi as of 6/30/17, and not any other individual or firm. Such views are not a recommendation to buy or sell any security, fund or portfolio. Any investment decision should be made in consultation with a financial advisor. JUNE 2017 INVESTMENT COMMENTARY1 again. AT&T’s genetic code has kept it biased to bigness, boldness and broad market reach as it made a strategic decision to “dilute-away” from wireless pressure via acquisitions in media content and satellite distribution. Meanwhile, VZ has attempted to retain is gold-standard status and position within wireless, seeking to make itself a pure-play by having divested itself of numerous legacy assets, while surgically acquiring in the digital asset arena, while maintaining its investment commitment to its wireless network. From our perspective, T has the challenge of executing and proving the benefits of a truly horizontal model, while VZ likely needs to prove it can insulate itself from growth and margin pressure in wireless through network and digital investments. But these old-timers are not the only players thinking new. Amazon/Whole Foods vs Walmart/Jet.com. A year ago, WMT agreed to pay $3.3 billion for Jet.com. The Jet.com acquisition was premised on building upon, and complementing WMT’s significant foundation already in place to serve customers across the Walmart app, site and stores, and position the company for even faster e- commerce growth in the future by expanding customer reach and adding new capabilities. This past quarter, not surprising to us, AMZN accelerated its own timeline to become a more significant player in the retail food and distribution business with the announced acquisition of Whole Foods (WFM), a premium player in the supermarket segment that has been attempting to regain traction and deliver improved execution. The irony of these two transactions is telling. WMT, a traditional big box retailer, founded upon a low price, low margin, high volume business model, which has grown its physical U.S. presence to ~700 million square feet, 147 distribution centers (including 22 e-commerce dedicated fulfillment centers), commanding #1 position with ~25% market share of the food/beverage segment, purchased online and logistic expertise with Jet.com. Meanwhile, Amazon (AMZN), the current proverbial king of online, low price, low margin, high volume, distribution models announced the acquisition of Whole Foods Market (WFM), a high-end, above-peer margin, physical retail square footage supermarket, but a player that garners just 2% share of the retail food/beverage market. While not completely in jest, we somewhat amusingly ponder whether WMT now consider entering AMZN’s turf with a competitive entry into Web Services. Heck, AT&T was once in the credit card business with its Universal card. Amongst several thoughts on the above permutations is this: with all the noise, clamoring and fear in the market with respect to AMZN’s impact on any market segment it chooses, or is speculated, to enter strategically, no impact and no fear has been greater than that which has engulfed traditional retail. Yet, here we are today with the new era online King Pin (run by a CEO who personally purchased a newspaper company) spending $14 billion, in a heartbeat, for ~18 million square feet of box, signage and associated distribution centers, principally in the U.S. That said, we think a lot of motivation to do this deal resides in AMZN crystallizing its distribution and logistics capability within the food/beverage market, essentially adding further to its hub and spokes, an effort to get increasingly close to its customer base. So, what’s old is new again, particularly in a game of corporate significance, creative destruction, growth, market share and profit margins. Portfolio Positioning & Review Throughout 2016 and first half of 2017, we have believed numerous individual security opportunities existed across several sectors of the large cap US stock market, boding particularly well for a more concentrated, contrarian strategy. Such an optimistic perspective was our long-standing view prior to seeding our LCV portfolio, and despite broader headline valuation multiples of major indices. Our conviction has been anchored in a belief that conditions, while not optimal, were attractive for generating returns over our stated time-horizon, a view
- 4. ¹Comments and opinions expressed reflect solely the personal views of Anthony Lombardi as of 6/30/17, and not any other individual or firm. Such views are not a recommendation to buy or sell any security, fund or portfolio. Any investment decision should be made in consultation with a financial advisor. JUNE 2017 INVESTMENT COMMENTARY1 that was contrarian to prevailing perceptions at the time. However, as noted in our December and March commentaries, increasingly our perspective has become a more centrally-held market view, particularly post- election. Given our contrarian nature, we have been cognizant of consensus continuing to move in our direction, and have remained quite sensitive to the psychological shifts which have occurred. With our radar dialed up for changes causing swings in the market pendulum too far in any one direction, we took the opportunity, afforded in our investment process, to modestly raise interim cash levels during the quarter. That said, we remain optimistic in our portfolio positioning, and holdings, but always with MOS as our guide. While our LCV portfolio remains fully exposed to all 11 sectors of the market, our focus has been steadfast—a favorable disposition to traditionally cyclical areas possessing compelling valuations, financial statement strength, and where near-term psychology serve to compensate for risk, providing the inherent MOS we seek when investing over a 3 to 5-year time horizon. Other value investors may choose to stray to own safety, but our value conscious, and investment process, simply will not allow us to pay any multiple for quality. While conscious of risk factors, we are investors viewing through a risk/reward prism, in active pursuit of opportunities providing the right balance. We believe in seeking companies that offer a combination of cheapness, a contrarian view, and possessing stable balance sheets and attractive FCF characteristics, provide for a more compelling alternative to simply positioning our portfolio in a traditionally defensive manor (i.e. high allocations Staples, Healthcare, Utilities, & Telecom). As regular readers of our commentary are fully aware, such areas of the large- cap market have been simply too rich, with many individual equities garnering valuation levels well above the broader market. Most notable in this context has been the lofty valuations in Consumer Staples and Healthcare that existed during course of 2016, and entering 2017. Combined, these latter two sectors comprise ~24% of the S&P 500; materially higher than our 14% target allocation at quarter-end. With the broader S&P 500 trading at ~19x forward 2017 EPS, many traditionally defensive areas of the market command multiples at or above this level, particularly when viewed on a purely GAAP basis. We have readily identified quality, balance sheet strength, and cash flows much cheaper elsewhere. Not only is this more acceptable to our value and contrarian- based investment discipline, but also in recognition that forward long-term returns are typically related to point- of-entry valuation multiples. Our long-term investment views have remained unchanged and we have stayed true to our process discipline and convictions. Compared to 1Q17, our portfolio positioning, sector allocations and stock positions are largely unchanged at the end of 2Q17, except for actions we took to further underscore our convictions in sector target weights, existing holdings, and or to remain true to process constraints. Where we think it prudent to rebalance, we continue to make active decisions, but without change to our conviction in the large cap value opportunity set we see. We are still finding, buying and remaining owners of cheapness, MOS and compelling free cash flow (FCF). When juxtaposed against our belief that favorable operating leverage opportunities exist in the economy, and amongst the companies we target, we remain steadfast in how we desire to position our LCV portfolio. Key Trades & Attribution We seeded a concentrated LCV strategy during the first quarter 2016. Since inception, as opportunities have been presented, we have made several active decisions, at both the stock and sector level. During 2Q17, the most notable actions included:
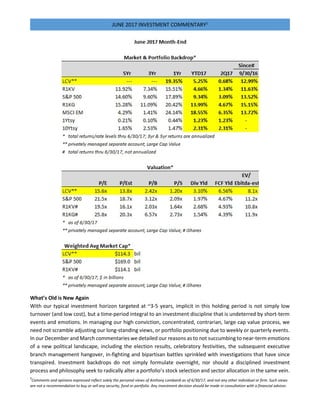
- 5. ¹Comments and opinions expressed reflect solely the personal views of Anthony Lombardi as of 6/30/17, and not any other individual or firm. Such views are not a recommendation to buy or sell any security, fund or portfolio. Any investment decision should be made in consultation with a financial advisor. JUNE 2017 INVESTMENT COMMENTARY1 100bp DECREASE Energy Sector target, our second consecutive quarterly 100bp DECREASE 100bp INCREASE Technology Sector target Selective rebalance trades in individual holdings within CD, IND, TECH & FIN sectors. This was the first quarter in five, where fundamentals did not warrant any full position SALEs or BUYs. As noted in prior commentaries, target sector weightings are influenced by our top-down and bottom-up views. Quarter- end target and market value weights for our LCV portfolio are detailed below. On a market value basis, we ended 2Q17 with our highest cash position during the past year, ~2.3% (vs 0.9% 1Q17), just below our interim model target of 2.5% (unchanged vs 2.5% 1Q17). We have been methodical in deploying available cash, having purposefully set aside some initial dry powder at inception. From a process perspective, our targeted process cash range is designed to provide flexibility, allowing for repositioning within a highly concentrated, yet diversified portfolio. We have a stated preference to monetize winners and/or sell- down positions based on process discipline, in so doing avoid placing capital at risk by simply holding investments as place-markers. MOS is paramount for us and is critical in limiting potential downside. Protection of capital is a covenant we are unwilling to break and we firmly believe in utilizing process-permitted cash level when situations dictate, to adhere to this core investment principle. Examples of our cash/MOS discipline include: the full sale of CSX Corporation (CSX) in the March 2017 quarter, following a ~100% gain versus original purchase, the full sale of Time Warner (TWX) in the December 2016 quarter following the announced acquisition by AT&T (T), and the full sale of St. Jude Medical (STJ) during the June 2016 quarter following the announced acquisition by Abbott Labs (ABT). Similarly, significant rebalancing trades we have executed since inception serve in the same way. As we have noted previously, our individual position re-balance trades, typically in the ~50bps to ~100bps range, are likely equal to another, less concentrated, lower conviction manager’s full target positions. This is among several key distinguishing characteristics in our process. We simply have no penchant to manage a portfolio structured with individual positions not representative of high conviction, and firmly believe in a
- 6. ¹Comments and opinions expressed reflect solely the personal views of Anthony Lombardi as of 6/30/17, and not any other individual or firm. Such views are not a recommendation to buy or sell any security, fund or portfolio. Any investment decision should be made in consultation with a financial advisor. JUNE 2017 INVESTMENT COMMENTARY1 concentrated list of holdings, yet diversified across market sectors. Being accused of closet indexing, or subject to extinction by ETFs or automated algorithmic-driven strategies is least among our concerns. Investment Performance. For the June quarter, our LCV portfolio generated total return of 0.68% vs the Russell 1000 Value (R1KV) return of 1.34%, and broader S&P 500 return of 3.09%. For the full year ended June, our LCV portfolio generated total return of 19.4% vs R1KV return of 15.5% and broader S&P 500 return of 17.9%. Our portfolio’s underperformance of -66bps vs R1KV in the June quarter was primarily driven by stock selection in one sector as we retained continued high conviction in respective target holdings, and took advantage (ex-post) of pullbacks in select positions by rebalancing to target levels. Our portfolio’s characteristics continue to reflect a disciplined, contrarian, value-oriented process. To this end, despite strong outperformance in 2016-2017, the portfolio remains materially cheaper across nearly every valuation metric, notably boasting higher FCF & dividend yields compared to the broader S&P 500 and R1KV, the latter our primary large cap value benchmark. From a performance attribution standpoint, versus the R1KV, the contribution from Allocation was more than offset by a negative contribution from Security Selection during the June quarter, amounting to ~+50bps and ~- 120bps, respectively. Energy, Consumer Staples and Industrials were the most significant contributors in total attribution, while Consumer Discretionary and Healthcare were the most significant detractors. By Allocation, the Energy and Consumer Discretionary sectors had the largest positive attribution, while Financials was the largest detractor. By Stock Selection, Financials, Staples and Technology were the largest contributors, while Consumer Discretionary was the single largest drag on performance, representing the near entirety of the portfolio’s negative attribution in the quarter. On an absolute basis, our portfolio had three sectors decline quarter/quarter; Consumer Discretionary, Telecom and Energy. Within the R1KV, for the second consecutive quarter, both Energy and Telecom experienced declines. With Telecom’s continued weakness, it became the first sector in our LCV portfolio, since inception, to post a point-to-point decline on an absolute basis. Every sector in the R1KV remains in positive territory on an absolute basis, since inception of our LCV portfolio, although Telecom is modestly above breakeven for the benchmark. During 2Q17 we made several active decisions to both increase certain stock and sector level weightings while reducing others, reflective of process, our conviction level and targeted investment opportunities. Many of our decisions in 2Q17 were heavily biased toward reducing several positions back down to target levels, following appreciation. There was a modest increase in portfolio liquidity versus prior quarter-end levels, which was an active decision on our part. During the quarter, our cash position resulted in a drag of ~5bps. Energy target weighting reduced 100bps for second consecutive quarter: 5.00% to 4.00% Energy remains our most pronounced exception to our favorable cyclical bias, with our portfolio allocation emphasizing a strategic decision to be prudent and mindful of our concerns. As was the case in 1Q17, we again took process-related action during 2Q17 to further REDUCE our target sector allocation. Process is key for us, and we listen and actively implement it, otherwise there is no process. With the quarter-end S&P 500 Energy weighting at ~6.00%, our allowable process maximum allocation to the sector is ~9.00%. Strategically we desire to remain meaningfully underweight, thus our Energy sector target was cut an additional 100bps to 4%, from 5%, which at quarter-end was ~200bps and ~650bps below the S&P 500 and R1KV, respectively. As we have previously stated, we believe the sector to be a quintessential “value trap”. Our fundamental concerns remain
- 7. ¹Comments and opinions expressed reflect solely the personal views of Anthony Lombardi as of 6/30/17, and not any other individual or firm. Such views are not a recommendation to buy or sell any security, fund or portfolio. Any investment decision should be made in consultation with a financial advisor. JUNE 2017 INVESTMENT COMMENTARY1 the same and, in our opinion, will take several years to~ fully play out. Our view has been premised upon a multitude of macro, secular and company specific issues, ranging from demand/supply imbalance, record inventories, technological change, a less influential OPEC in the context of history, corporate restructurings, balance sheet repair and various short/long-term macro factors across developed and emerging market countries. Among major concerns we continue to have is the ability of companies to generate meaningful and requisite FCF over our typical investment horizon, unfavorable balance sheet developments (write-downs, dilutive capital raises, fire sale prices of assets, etc.) and constrained capital management owing to multiple stress points in the end-market. As a result, and as evidenced by our target weight, we remain very cautious given this view, in a sector more technically-driven than others, and where itchy fingers rest on production triggers ready to pull upon any sustained price appreciation in the commodity. In the end, the most significant constraint is valuation, and to suggest shares are cheap simply because of ~50%+ price declines versus 2014 peaks misses a key point regarding multiples and MOS. Many large cap Energy valuation multiples (Book Value, EBITDA, EPS, FCF yield, etc.) on a trailing and forward basis are not compelling, indeed they remain quite expensive or non-existent (due to limited or nominal level of earnings), leverage remains high and FCF is negative-to-modest during the next 2 years, particularly should capital expenditures ramp back up. Against the sector’s current near-term fundamentals, and unfavorable secular backdrop, we remain of the opinion a bifurcated, underweight allocation is most appropriate given our low level of conviction. With more compelling balance sheets, FCF, and valuations available in several cyclical sectors, setting out to be a hero in Energy, against major secular changes, heightened visibility challenges for management, and a technically-driven sector, is not an appetizing proposition looking out the next few years. Perhaps most importantly, our process limits us to a maximum 9% exposure. We’d much rather pursue less direct, alternative opportunities to gain commodity-related exposure, in situations possessing better MOS and/or more compelling risk/reward, while maintaining a direct underweight allocation vs the Energy sector. In the event of lower-for-longer energy prices, we believe there to be other potential beneficiaries that are more compelling. As stated in our prior commentaries, 2017 should prove interesting as to whether end-market prices and production levels hold, as well as the degree to which management teams stay true to the required financial discipline to justify share prices. The first half 2017, inclusive of recent OPEC production actions, has been quite telling. We continue to believe there to be a significant difference in business models and financial flexibility across the sector, anticipating many restructurings and cash flow recoveries in the sector will likely come up well short. We are quite comfortable at 4% allocation and would not hesitate to cut further should process and opportunities warrant. We remain bifurcated in our holdings within Energy, and reduced a target position by 100bps in sourcing our decision. Technology target weighting increased 100bps, and select holdings rebalanced down: 21.0% to 22.0% As we have in quarters past, we made an active decision to trim back positions to initial target within Technology, a sector which has been among the strongest market performers. Cumulatively, our rebalancing transactions within TECH comprised ~165bps of portfolio market value. Due to exceptionally strong performance, one position was trimmed to target twice during the quarter. We further increased our targeted sector weighting in TECH by 100bps, raising it to 22.0%, serving as the counterpart to our decreased Energy sector weighting target. Our sector weighting increase in TECH was achieved by raising an existing target position for which our conviction remains high, secular theme positive, FCF characteristics strong and valuation very compelling. The portfolio’s
- 8. ¹Comments and opinions expressed reflect solely the personal views of Anthony Lombardi as of 6/30/17, and not any other individual or firm. Such views are not a recommendation to buy or sell any security, fund or portfolio. Any investment decision should be made in consultation with a financial advisor. JUNE 2017 INVESTMENT COMMENTARY1 TECH sector target of 22% was ~25bps lower versus the S&P 500 at quarter-end, essentially keeping as neutral against our process benchmark. Compared to the R1KV, our targeted TECH sector weighting represented ~1400bps of overweight, reflecting our conviction in both the macro and company specific backdrops pervasive throughout our LCV portfolio. As with any holding, we are mindful of any distortions that might be artificially embedded in key valuation multiples, notably GAAP vs non-GAAP differentials, as these may present a stock as inexpensive on the surface. Intangibles and stock-based compensation are just two notable examples within TECH that garner our attention during any analysis. Consumer Discretionary: No sector weight change; 3 rebalance trades to target: 16.5% Similar to the prior quarter, we again executed rebalance trades within CD during the second quarter to bring positions to targeted levels. In total, three positions were rebalanced up to target levels, and cumulatively involved nearly 210 bps of portfolio market value. As previously noted, portfolio attribution in the June quarter was most negatively impacted by the drag in CD. Our actions and decision to round-up targeted names within the sector reflected our continued high conviction, anchored in a contrarian view and protected by compelling valuation characteristics. As with TECH, the CD sector comprises a significant part of our portfolio’s cyclical bias. At quarter-end, our sector target allocation remained 16.5%, an active overweighting of ~425bps versus the S&P 500, our process benchmark. Our process compliant maximum weighting for CD was 18.4% at quarter-end. Compared to the R1KV, the portfolio ended the quarter with a target overweight of ~965bps. Industrial target weighting unchanged & overweight, with one position trimmed down to target: 14.5% The IND sector target overweight comprises yet another part of our long-standing, favorable cyclical view, and the opportunity set available amongst individual securities with compelling valuations and characteristics. During the first quarter we funded a new position within IND following the executed full SALE of CSX Corporation, shares which had appreciated ~100% in the span of our one year holding period, and where several of its key valuation multiples had doubled. While we did not have any new full sales or buys in the sector this quarter, one existing position was rebalanced down to initial target, comprising ~45bps of portfolio market value. Overall, we maintained our targeted IND allocation at 14.5%, representing a sector where the maximum allowable process weighting against the S&P 500 was ~15.4% at quarter-end. Compared to the R1KV, our portfolio’s targeted overweight allocation for IND was ~585bps at the end of June. Telecom target weighting unchanged, but with max of 3% it remains under watchful consideration: 3.0% In the prior quarter, we cut our Telecom target weighting 100bps, driven by process. As a reminder, we sold our full position in TWX during the fourth quarter, upon realizing significant appreciation following the announced (and still pending) acquisition by AT&T, a stock we prefer not to own. No changes or rebalance trades were made to holdings in the June quarter, but with the sector now down to just 2% representation in the S&P 500 it remains under watchful consideration for potential further portfolio action. As noted in our March commentary, we have closely followed this sector’s evolution the past 20 years, and seen its weighting in the S&P 500 continue to erode, with it now the smallest market cap weighting of 11 sectors. While the performance of other sectors has contributed to Telecom’s shrinkage, we have found this secular development notable in the context of low nominal interest rates and, more surprisingly, the massive amount of inter- and intra-industry consolidation that has taken place over the prior two decades. Thus, even with Telecom survivors buying their “own”, acquiring media and communications companies residing in Consumer Discretionary, as well as acquiring in Technology,
- 9. ¹Comments and opinions expressed reflect solely the personal views of Anthony Lombardi as of 6/30/17, and not any other individual or firm. Such views are not a recommendation to buy or sell any security, fund or portfolio. Any investment decision should be made in consultation with a financial advisor. JUNE 2017 INVESTMENT COMMENTARY1 this “transfer of market cap” has not been enough to stop the compression in the sector’s representation in the S&P 500. With the its weighting now down to ~2.1% in the S&P 500, our process maximum allocation is only ~3%. With process pointing us lower, and with yield and valuations more readily available and compelling across several other sectors, potential risk of further business model and shareholder dilution rising, and the reduced prospect for material lift in Telecom’s representation within the S&P 500, our bias remains negative. Despite the reduction last quarter, the sector remains on watch for us for potential further actions should fundamentals and/or process warrant. Cash level up 100bps Our portfolio target cash level remained unchanged versus 1Q17, at 2.50%, as we continued making active use of process-permitted cash levels during the quarter through the execution of various actions noted above. From a market value perspective, cash level increased modestly to 2.3% at quarter-end, up from 0.9% in March. Market and Economic backdrop We have highlighted with each commentary key underlying themes in the backdrop, and at the top of the list each quarter has been the constant, and unfortunate events of terrorism. Events in Russia’s St. Petersburg Metro, church bombings on Palm Sunday and attacks on religious transport buses in Egypt, suicide car bombings in Aleppo, vehicular/stabbing attacks in London, and a concert bombing in Manchester served among the most recent. Throughout the world, we all have continued to witness numerous such attacks, devastation and personal tragedies as thousands of innocents were injured, and innocent lives lost. Each time, first responders and the collaborative efforts by all areas of law enforcement are to be commended. However, with each such event, we are also reminded of a world dynamic which has changed, is ever present, and requires continued global attention for such cowardly acts. The world cannot afford to be bifurcated in its stance against this enemy, nor can it ever succumb. Happy 10th ! The June quarter marked the 10-year introduction of the iPhone, as well as the collapse of two Bear Stearns hedge funds, invested in subprime credits. Bifurcation to say the least. While the latter served as a key marker in the early stages of the global financial crisis, the former was a key marker as to what areas of the equity market investors would seek cover within risk assets. At year-end, 2006, the Financial sector represented 22.3% of the S&P 500 market cap, while Technology comprised 15.1%. Fully 2 years later, with the S&P 500 having declined 36%, the balance of power had shifted with the Financial sector comprising 13.3% and Technology, Healthcare, Energy and Staples comprising 15.3%, 14.8%, 13.3% and 12.0%, respectively. Rolling forward to June 2017 quarter end, Technology remains the largest sector by market cap, representing 22.3% of the S&P 500, while Financials (adding in the Real Estate sector which has subsequently been segregated), Healthcare, Consumer Discretionary and Industrials comprise 17.5%, 14.5%, 12.3% and 10.3%, respectively. Ex- Real Estate, Financials represent 14.6%. Notably, with one of the most engulfing financial catastrophes to have ever hit, and with extended experimental global central bank policy and sub-par economic growth, fully 10 years out from the crises unfolding, 4 of the 5 largest market cap sectors in the S&P 500 are cyclical, as opposed to the traditionally “safe-haven” defensive areas. Putting a cherry on this sundae, was the Federal Reserve itself, releasing results and approvals of the banking industry’s stress tests and capital plans at quarter-end. Much like the case following the real estate crisis in the late 1980’s-early 1990’s, the banks have again repaired themselves, and regulators have concurred institutions have too much capital, can now release the same through dividends
- 10. ¹Comments and opinions expressed reflect solely the personal views of Anthony Lombardi as of 6/30/17, and not any other individual or firm. Such views are not a recommendation to buy or sell any security, fund or portfolio. Any investment decision should be made in consultation with a financial advisor. JUNE 2017 INVESTMENT COMMENTARY1 and buybacks, and begin relieving themselves of significant headwinds to ROE. Meanwhile, AAPL’s innovation, balance sheet, cash flow and share price performance, literally speak for themselves: nearly $60 billion in FCF, $158 billion net cash, net debt/EBITDA of minus 2.7x, its shares are up 1,100% since year-end 2006, and represent nearly 4% of the S&P 500 market cap. Two very different anniversaries, but celebratory events nonetheless ex-post. Still yet another example of swings in the market pendulum and investor psychology, where time horizon proves to be a critical variable. As has been the case during this recovery, the broader US equity market in the second quarter was able to absorb a multitude of events, including the political landscape at home, geopolitical events around the world, terrorist attacks, dollar and oil price weakness, softer economic data and actions by the Federal Reserve to continue normalizing monetary policy through a combination of rate and balance sheet actions. Despite a mid- May pullback to breakeven for the quarter, the S&P 500 posted a respectable performance on the heels of a strong showing in the prior two prior quarters. Bifurcation of performance across styles and regions remained status quo, with the backdrop continuing to very much favor growth and emerging markets. For the quarter, the S&P 500 posted a 3% total return, with continued variance by sector and industry group. Growth (as measured by Russell 1000 Growth) meaningfully outperformed Value for the second consecutive quarter, ~335bps. Emerging Markets (MSCI) continued to trounce the pack, adding to its +11.5% total return in the first quarter with an additional 6.4% in the second quarter. While U.S. interest rates and spreads have struggled to make a significant and sustained turn higher, we remain of the opinion their extended path lower appears to have bottomed given broad expectations for improved growth, higher inflation, and changes in monetary and fiscal policy. Across the globe, performance of stock markets (total returns measured in U.S. Dollars) was bifurcated, with the most recent political election “host country” topping the list: France +7.1%, Hong Kong +8.0%, Mexico +7.4% (on top of +17.3% in 1Q17), Germany +6.8%, Japan +5.1%, UK +5.3%, Australia -0.9%, China -2.4% and Brazil -8.4%. For the quarter, the S&P 500 posted +2.6% price increase. Comparatively, the R1KV fell below the broader market, at +0.7%, and meaningfully below R1KG, at +4.3%. Despite quarter-end weakness in the sector, Technology drove a significant part of the differential between Growth and Value, with an underweight in Energy, outperformance in Healthcare and overweight in Consumer Discretionary as the other top contributors. The most significant positive contributor for Value vs Growth in the quarter was attributed to the Financial sector, due to a massive 2,300bp delta in allocation between the two indices sector representation. Notably, spread compression across the term structure continued in the quarter, driven by a rising short-end and a pull-back in long rates. The former due in part to Fed action while the latter due in part to concerns regarding potential for a stalled Fiscal agenda and soft interim economic data and still modest inflation. As measured by the 10-year US Treasury yield, the benchmark rate began 2016 at 2.27%, declined to 1.47% by the end of 2Q16, 2.45% by year-end 2016, and finished 2Q17 at 2.31%. Intra-quarter, the 10-year yield hit a low of 2.13% in mid-June prior to spiking to its finish. The 10-year has managed to hold the initial spike which occurred during the first few days post US election. Yield curve slope, using 1yr-10yr spread, which had expanded to ~ 165bps at year-end 2016, subsequently declined to ~ 140bps at end of 1Q17 and subsequently to ~110bps at end of 2Q17, a level well below ~245bps just 3-years ago. Despite actions in the yield curve, stress test results and regulatory approval of material capital plans by the banks served as a major catalyst for Financials near quarter-end.
- 11. ¹Comments and opinions expressed reflect solely the personal views of Anthony Lombardi as of 6/30/17, and not any other individual or firm. Such views are not a recommendation to buy or sell any security, fund or portfolio. Any investment decision should be made in consultation with a financial advisor. JUNE 2017 INVESTMENT COMMENTARY1 We continue to believe data dependency will remain the foundation for monetary policy, with any changes needing to be justified by the backdrop—the latter which we have been positively disposed for some time, and expect to continue driving interest rate movements and broader policy agenda. As noted in prior commentary, at this stage of the domestic economic, monetary and fiscal policy cycles, we remain less focused upon unit count of rate increases anticipated by the market and more biased to the level of potential rate changes, and the impact such step-changes could serve to vastly exceed market expectations. Our expectations for more transparent discussions from the Fed regarding policy actions pertaining to more active reduction of its $4.5 trillion in assets was fortified by recent FOMC meetings where more detail was provided regarding same. At times, this part of monetary policy seems to have been lost amongst the market’s laser focus, and expectations upon, the unit count of rate increases in the forward 12-month calendar. Notably, other central banks are increasingly signaling corresponding changes in policy to reflect improvements abroad. We reiterate our own expectations with respect to U.S. monetary policy we stated in our December commentary: “…we would not be surprised to see a more fluid pace of change regarding monetary policy should situations warrant. This would include the possibility of at least one 50bp change amongst the current unit count of rate change decisions anticipated, and/or more action steps than currently discounted by the market.” Capital allocations and priorities are likely to change. We reiterate we would not be surprised to witness corporate actions that lead to a re-ranking of capital management priorities given potential for more a favorable tax code, deregulation, improving economic activity and executive management confidence, along with a corresponding increase in capital and human resource investments. Such changes could have negative implications for the level and/or pace of share repurchases and dividend increaseswitnessed during the recovery period since the trough of the financial crisis, and would likely vary by sector. To this end, given underlying performance of the stock market, simple mathematics suggest lower marginal buying power of previously approved, and remaining buyback authorizations. Still further yet, finance 101 would suggest higher valuation multiples present as less appetizing to corporate CFO’s and Treasurers, acting as an incremental constraint to share buybacks. We also remain cognizant that saber rattling regarding manufacturing and trade could create the potential for supply chain issues to become quite noteworthy. With exposure to several such factors, we note the Tech sector remains squarely in these cross-hairs, both positive and negative. The banks, as evidenced by recent regulatory results, standout as one industry for which the capital return process is in early stages. As typically the case, earnings and free cash flow generation will serve as a key driver of the ultimate determinant of capital allocation. Volatility swung more than prior quarter but remains below long-term average. While market volatility, as measured by the CBOE Volatility Index (VIX), remains at relatively subdued levels, there were more notable swings during the second quarter. The VIX hit a new 2017 low of 9.8 in early June, which was preceded by spikes in April and May to ~16.0. At quarter-end, the VIX rested at 11.2, still near 5-year lows. As we have noted previously, since 1990, a year marked by the precipice of a multiyear financial crisis (and recession) involving S&L’s and commercial banks, the low mark on the VIX has been 9.3, and the average, 19.6. During the past several quarters, exceptions were an immediate, post-UK “Brexit” vote increase in late June, a less prominent increase in September 2016, and the November spike (to 22.5) subsequent to the U.S presidential election. Recent FOMC decisions; intra-meeting commentary regarding rate policy; swirling, divisive and emotional
- 12. ¹Comments and opinions expressed reflect solely the personal views of Anthony Lombardi as of 6/30/17, and not any other individual or firm. Such views are not a recommendation to buy or sell any security, fund or portfolio. Any investment decision should be made in consultation with a financial advisor. JUNE 2017 INVESTMENT COMMENTARY1 political winds blowing in Washington, geopolitical events & disruptions across the globe, and a late quarter sell- off in Tech (the market’s anchor tenant), have had less of an impact on VIX than either the Brexit vote or U.S. presidential election. Dollar recoiled. Given the confluence of global events, relative strength of the U.S. economic backdrop, and perceived safety of U.S. capital markets, we have been of the view that an overly dire outcome for the Dollar will remain an unlikely scenario in the near-to-intermediate term. For the quarter, however, the Dollar index (DXY) did recoil ~5%, reflecting in part the undercurrents in DC and expectations for economic improvement outside the US. By quarter-end, while the DXY had broached a level last realized post-Brexit vote, it remains near the 10-year high attained during 4Q16, and well-above financial crisis lows of ~70 reached in 1Q08. Capital investment and potential cross-border M&A, utilizing a stronger currency, remain benefits of the Dollar’s strength. Further, to the point where any such investments or acquisitions lead to internationally parked cash, any potential favorable tax changes allowing for repatriation would serve as an incremental benefit from internationally exposed businesses. Oil continues to leak lower. Along with most commodities (notable exception being wheat), oil continued to retreat during the quarter, despite the latest attempts by OPEC members to utilize production cuts. The front- end contract for WTI hit an intra-quarter low of $42, down 17% versus period-end March, and within striking distance of breaking the $30’s marker. The commodity remains more than 50% below its 2014 high and 60% above its $26 low in February 2016, underscoring a basic, yet painful investment fact: a 50% loss requires a 100% recovery. With the latest production actions taken, it also now appears that any new formalized OPEC actions would not be implemented until 2018. Beyond the risks we have previously highlighted with respect to high inventories, technological benefits and change, potential production cut slippage amongst OPEC, and production triggers being pulled by U.S. producers, a further constraint on materially higher price levels is the potential headwinds to economic growth that could metastasize with any material rise in WTI. Thus, while we simply don’t see what the oil bulls do, we caution they should be mindful of what they wish. As evident in our 200bp reduction in sector allocation during the past two quarters, we remain in no rush to add portfolio exposure to Energy given opportunities elsewhere. Confidence of management and boards to take on risk, evidenced by appetite to do deals spanning various sectors and geographies, remains high. Among some notable announcements and news flow in 2Q17: Becton Dickinson/CR Bard ($24 bil), Amazon/Whole Foods ($14 bil cash), JAB Holdings/Panera Bread ($8 bil cash), Thermo Fisher Scientific/Patheon NV ($7 bil cash) and Sycamore Partners/Staples ($6 bil cash). Rumor and speculation has continued to percolate regarding several names in media & telecom, including potential large deals involving Sprint, T-Mobile, Dish and Verizon ($182 bil market cap). Having digested prior acquisitions, both Charter (CHTR ~ $100 bil cap) and Comcast (CMCSA ~ $182 bil cap) appear to be signaling increasing interest in strategic deals, notably involving wireless assets. Notable in the cellular/cable/media space was this quarter’s $2 billion IPO of Altice USA, a $24 bil market cap company whose parent made inroads with its acquisition of Cablevision last year. BMC Software, which was taken private in 2013, is also reportedly close to a deal to acquire CA Technologies (CA) that could be valued above $16 billion. One large deal fell apart at quarter-end, due principally to antitrust pressures related to market share concentration. Walgreens/Rite Aid terminated their originally announced $17 billion cash deal (10/27/15), replacing it with an asset sale by RAD to WAG involving ~
- 13. ¹Comments and opinions expressed reflect solely the personal views of Anthony Lombardi as of 6/30/17, and not any other individual or firm. Such views are not a recommendation to buy or sell any security, fund or portfolio. Any investment decision should be made in consultation with a financial advisor. JUNE 2017 INVESTMENT COMMENTARY1 50% of RAD locations. The newly announced cash transaction valued at $5 billion would still leave RAD with the chore of managing its high debt load, net of any reductions from cash utilized in the deal. From an economic perspective, 1Q17 Real GDP’s most recent revision was +2.1%, with 2Q17 estimated at +2.4%. Forward estimates for 2017, 2018 and 2019 remain unchanged, currently +2.2%, 2.3% and +2.2%, respectively. Versus crisis level losses of ~ 900k/month in 2008-09, the labor market has witnessed continued improvement, generally posting nonfarm payroll gains of ~150k-300k/month since 2013, with the most recent print of 138k at the low-end. The unemployment rate recently hit a 16-year, post-recession low of 4.3%, having declined nearly 600 bps from its peak. Estimates for 2017 and 2018 now stand at 4.4% and 4.2%, respectively. As noted in our prior commentaries, despite the labor market backdrop, aggregate economic growth has yet to accelerate. FOMC commentary has continually underscored policy maker’s data dependency, with a bias to more than just U.S. economic conditions. During the past year, the Fed has clearly shifted to a much-anticipated policy rate increase cycle, with additional transparency more recently regarding balance sheet management. This change mimicked the increased hawkishness that appeared to be stirring in FOMC statements, despite longer-term projections of growth and rate levels (the dots) in the Fed forecasts having remained subdued for some time. Given global monetary stimulants that have existed for an extended period, and with the prospect of added Fiscal accelerants, monitoring of price and wage inflation metrics remain at the forefront. Despite some softness in recent economic data, wage and price pressure have been warming a bit. We have repeatedly underscored our belief that there is a good amount of operating leverage in the system, that can be readily monetized for the benefit of shareholders/consumers should top-line revenue (& GDP) growth move sustainably higher. We have also been cognizant of the amount of monetary stimulus that has occurred without a meaningful ramp in GDP, but in the context of the magnitude of the deepness of the economic hole, a longer ladder was required. Our comfort level in having positioned with a more cyclical bias remains founded upon valuation multiples and balance sheet/cash flow conditions of the company’s we both seek, and own, as well as the corporate actions and broader economic conditions we continue to witness, and expect—all which well-preceded the election results last year. Five and Dime earnings picture intact following a strong first quarter print. Heading into 2Q17 earnings season, based on FactSet data, aggregate S&P 500 EPS on a reported basis are estimated at ~ $31.50, representing a year/year increase of ~6%, versus the 14% gain posted in 1Q17. Compared to March 31, the estimated 2Q17 earnings growth for the S&P 500 has dropped modestly, down ~2%. Estimates typically come down during a quarter, however, current and recent quarter downward trajectories have been less than average due to a combination of lower cuts by analysts, a reduced level of negative guidance by companies and generally easing comps in the more pressured sectors. Top-line revenue growth forecast of 4.9% for 2Q17 has declined modestly vs March 31, and lower than the 7.7% increase in 1Q17. Profit margins implied in forecasts are stable in the aggregate, including positive operating leverage in outer quarters (in line with our long-held bullish view). Basic math of the market supports the margin trajectory embedded in forecasts given the underlying mix and weighting of the high-level contributors, notably Technology (22.3% of S&P 500 market cap) and the declining weight of the largest detractor, Energy (6.0% of S&P 500 market cap). With Financials the second largest sector (14.6% market cap), and banks having been given green light on capital plans, with potential to benefit from rising interest rates, nearly 40% of the S&P market cap appears reasonably anchored. Should earnings growth increase in 2Q17 as expected, it will represent the 4th consecutive quarter of y/y improvement. Beyond
- 14. ¹Comments and opinions expressed reflect solely the personal views of Anthony Lombardi as of 6/30/17, and not any other individual or firm. Such views are not a recommendation to buy or sell any security, fund or portfolio. Any investment decision should be made in consultation with a financial advisor. JUNE 2017 INVESTMENT COMMENTARY1 Technology, a large part of the earnings turn has been the improving picture for Financials and the lapping of poor comparisons within the commodity complex, the latter most visible in the Energy sector. While the level of earnings degradation within Energy has apparently run its course, we continue to believe a long and uncertain road remains ahead. The sector has transitioned from the precipice of negative comparisons. FY16 earnings and revenue for the Energy sector declined ~ 76% and ~ 18% y/y, respectively, and are expected to post gains of ~ +275% and ~+20% in FY17. On a reported basis, 9 of 11 sectors are expected to be in positive territory for the quarter, with Utilities and Consumer Discretionary in the red; however, Telecom and Healthcare estimates have declined near breakeven since March 31. Energy, Technology and Financials possess the highest expected improvement. Recall also, that our two most significant underweight portfolio allocations are amongst the most sizeable sectors of market; traditionally defensive areas of Healthcare and Consumer Staples. Notably, 2Q17 estimates have declined quite during the past 90 days for HC and CS, to +0.4% (vs +2.0%) and +2.8% (+4.2%), respectively. Currently, the outlook for 2017 and 2018 is for estimated top-line growth of ~ +5% for both, and earnings growth of ~ 10%-12%, what we have affectionately called a “Five & Dime” picture for the market backdrop (5% top and 10% bottom-line growth). By sector, the picture is quite different, with bifurcation in earnings led by Energy and Telecom/Utilities (latter two sectors estimated to be down/breakeven) at the extreme tails of expectations. As these sectors are materially smaller in market capitalization, we reiterate the more relevant story to monitor during the year will be those sectors within the tails. All else constant, the basic math of the market’s forward P/E would suggest it may not be as rich as generally perceived when viewed in the context of the Technology sector’s high profit margins and higher growth, the Financial sector trading at less than 15x forward EPS (with newly approved bank capital plans), and Energy trading above 25x forward estimates. Bottom line: As contrarians, we remain attracted to many facets in the backdrop noted above, particularly those that underscore the fundamental and emotional swings that are part of any natural market environment. It is the short-to-intermediate term fluctuations which provide the right backdrop for us to position our portfolio for the long-term at both the sector and security level. While we have noted selective areas of the market as expensive (namely traditionally defensive, higher quality sectors and a fundamentally challenged energy complex), many of the cyclical areas within our value-based discipline, remain quite compelling to us. If one simply focuses on the aggregate level of the market, to include broader market earnings growth, valuation metrics, GDP growth, and nominal debt levels the backdrop might be viewed challenging. We prefer to go deeper, into sectors and individual stocks, assess related fundamentals and metrics, place broader macroeconomic measures such as GDP growth into context, and break apart aggregate metrics such as debt into more relevant measures such as net debt, interest costs and coverage ratios, etc. In so doing, we have been quite bullish as to the opportunity set in our concentrated, yet diversified large cap value strategy. That is not to say the opportunity set would be the same for other investors in different or less-concentrated strategies. As long-term investors, we remain focused on executing a consistent process, buying cheapness and not over- paying for quality. As disciplined contrarians, mindful of capital protection, we continue to find the cyclical sectors, ex-energy/commodities, home to stocks with the most compelling valuations relative to the broader market. Given our contrarian nature, we are also cognizant of consensus having moved in our direction during 2016 and 2017, although much of the change was back-end loaded post US elections, and not universal across the macroeconomic, sector or individual stock landscape. Nevertheless, we remain quite sensitive to the shifts
- 15. ¹Comments and opinions expressed reflect solely the personal views of Anthony Lombardi as of 6/30/17, and not any other individual or firm. Such views are not a recommendation to buy or sell any security, fund or portfolio. Any investment decision should be made in consultation with a financial advisor. JUNE 2017 INVESTMENT COMMENTARY1 that have occurred. With our radar dialed up for changes that cause swings in the pendulum too far in any one direction, we have taken actions during the last two quarters to solidify cheapness in our portfolio, and be protective of capital. Conviction is key for us, and is reflected in our portfolio actions. Most importantly, with any company, it is those possessing characteristics strong in balance sheet and free-cash flow, combined with compelling equity valuation, that garner our attention--these remain the type of roommates we prefer when seeking opportunity and MOS. AAL Document is meant to be used in its entirety. Reference to prior quarterly and monthly publications is noted. Views expressed represent personal assessment of privately managed separate account and market environment as of the date indicated, and should not be considered a recommendation to buy, hold or sell any security, and should not be relied on as research or investment advice. Information is as of the date indicated and subject to change. All market and other related information relied upon and mentioned is from market data sources viewed as reliable. No guarantees are made regarding accuracy. Index returns are for illustrative purposes only. Index performance returns do not reflect any management fees, transaction costs or expenses. Indexes are unmanaged and one cannot invest directly in an index. Past performance does not guarantee future results. The S&P 500 Index measures the performance of 500 mostly large-cap stocks weighted by market value, and is often used to represent performance of the U.S. Stock market. The Russell 1000 Value Index measures the performance of the large-cap value segment of the U.S. equity universe. It includes those Russell 1000 companies with lower price-to-book ratios and lower forecasted growth values. The Russell 1000 Growth Index measures the performance of the large- cap growth segment of the U.S. equity universe. It includes those Russell 1000 companies with higher price-to-book ratios and higher forecasted growth values. Russell Investment Group is the source and owner of the trademarks, service marks, and copyrights related to the Russell Indexes. Russell® is a trademark of the Russell Investment Group. iShares® Funds are distributed by BlackRock Investments, LLC. The iShares Funds are not sponsored, endorsed, issued, sold or promoted by Russell Investment Group. Nor does this company make any representation regarding the advisability of investing in iShares Funds. BlackRock is not affiliated with the company listed above. iShares® and BlackRock® are registered trademarks of BlackRock, Inc., or its subsidiaries. MSCI Emerging Market index is an index created by Morgan Stanley Capital International (MSCI), designed to measure equity market performance in global emerging markets. The Emerging Markets Index is a float-adjusted market capitalization index. MSCI®, and the MSCI index names are registered trademarks of MSCI Inc. or its affiliates. Where noted, S&P 500® Index, Russell 1000® Value Index, Russell 1000® Growth Index, iShares® Russell 1000 Value ETF and MSCI® Emerging Market Index are referenced with abbreviations and respective footnotes. Abbreviations include S&P 500, R1KV, R1KG and MSCI EM. Use of iShares ETF for a respective index is footnoted accordingly and/or mentioned as such. Performance commentary comparisons are made in reference to iShares, unless otherwise noted. Performance quoted represents past performance and does not guarantee future results. Investment return and principal value of an investment will fluctuate, and when sold, may be worth more or less than original cost. Returns for less than one year are not annualized.