Weather Risk Managers Facing Dilemma of Marking Positions to Model or Market
1. DECEMBER 2002–JANUARY 2003 ENVIRONMENTAL FINANCE36
W E A T H E R R I S K
Marking to
model –
or to market?Should weather risk managers continue to value weather
portfolios in line with their pricing models? Or does growing
trading activity mean they can be valued against market
prices? Paul VanderMarck weighs up the arguments
this isn’t just a theoretical exercise – the port-
folio has an HDD delta of –$10,000 at
LaGuardia, which means its value would be
reduced by approximately $1 million if valued
at 3,850. In all other markets the risk manag-
er tracks, a contract that traded yesterday at
3,850 would be marked to market at 3,850
without a second thought. So, should the
same concepts be applied here, or should he
take the trader’s advice and leave the mark at
3,750?
Such is the dilemma that confronts weath-
er market participants as the market matures.
In its early days, there was intermittent trad-
ing on many different locations. Liquidity at
individual locations was low, and everyone in
the market tracked positions on the basis of a
model. These models produced static valua-
tions before the start of a season which then
moved around during the season as actual
temperature measurements came in and as
short-term forecasts were adjusted.
Over the past two years, trading has con-
solidated at key locations such as Chicago
O’Hare, New York LaGuardia and London
Consider a risk manager responsi-
ble for overseeing a growing
weather derivatives portfolio. In late
September he notices that a November–
March Heating Degree Day (HDD) swap ref-
erenced to temperatures at New York
LaGuardia is trading at 3,850 HDDs. Several
months earlier, he had agreed with the head
weather trader to establish a pre-season val-
uation of 3,750 for this contract, on the basis
of modelling of historical weather data.
When he asks the trader about the dis-
crepancy, she tells him the market has been
bid up from earlier levels close to 3,750,
because of a couple of rumoured large end-
user deals and because of forecasts of a cold
winter. She tells the risk manager not to
worry and that the 3,750 valuation is still
appropriate: such seasonal forecasts often
don’t have any bearing on what kind of weath-
er will actually occur.
Admittedly, the start of the November–
March winter season is still over a month
away, and nothing has changed in the histori-
cal data that was used in the modelling. But
Heathrow. This shift, and the continuing
growth of the market, have resulted in a sig-
nificant increase in liquidity, introducing the
possibility of valuing positions based on cur-
rent market price levels.
This would fit with trends in other mar-
kets. Risk managers, particularly within finan-
cial institutions, are increasingly demanding
that positions be marked to market, partly to
ensure a more accurate reflection of a port-
folio’s value should it need to be liquidated.
The debate around whether to conduct
weather portfolio risk management on a
mark-to-model or mark-to-market basis cen-
tres on three main issues.
The first is a theoretical one: are the stan-
dard mark-to-market concepts used for other
commodities relevant for weather derivatives,
or is weather somehow different in a way that
makes mark-to-model more appropriate?
The crux of this issue is the argument that
supply/demand dynamics can potentially dis-
tort the valuation of a weather contract away
from the best ‘fair value’ estimate of where
that contract will settle at maturity. In other
commodity markets, supply/demand dynamics
are an intrinsic aspect of what a position will
be worth at its expiration. Current market
forward curves provide the best indication of
future settlement value in those markets, and
a mark-to-market approach is therefore the
most appropriate way to estimate the expect-
ed settlement value of a position.
In contrast, weather derivatives settle on
a meteorological index that cannot be influ-
enced by any amount of buying or selling.And
so,the argument goes,mark-to-model is more
accurate than mark-to-market.
Although theoretically convincing,
the practical problem with this is
that it is difficult to isolate the
supply/demand component of
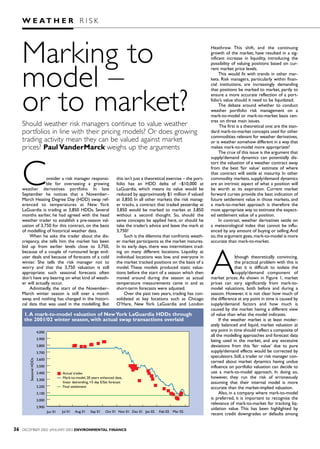
market prices. As shown in Figure 1, market
prices can vary significantly from mark-to-
model valuations, both before and during a
season. However, it is not clear how much of
the difference at any point in time is caused by
supply/demand factors and how much is
caused by the market having a different view
of value than what the model indicates.
If the weather market is at least moder-
ately balanced and liquid, market valuation at
any point in time should reflect a composite of
all the modelling approaches and forecast data
being used in the market, and any excessive
deviations from this ‘fair value’ due to pure
supply/demand effects would be corrected by
speculators.Still,a trader or risk manager con-
cerned about market dynamics having undue
influence on portfolio valuation can decide to
use a mark-to-model approach. In doing so,
however, they run the risk of erroneously
assuming that their internal model is more
accurate than the market-implied valuation.
Also, in a company where mark-to-model
is preferred, it is important to recognise the
relevance of mark-to-market for tracking liq-
uidation value. This has been highlighted by
recent credit downgrades or defaults among
2,900
3,000
3,100
3,200
3,300
3,400
3,500
3,600
3,700
3,800
3,900
4,000
Jun 01 Nov 01Oct 01Sep 01Aug 01Jul 01 Dec 01 Jan 02 Feb 02 Mar 02
SeasonalHDDs
Actual trades
Mark-to-model, 20 years enhanced data,
linear detrending, +5 day E/Sat forecast
Final settlement
1.A mark-to-model valuation of NewYork LaGuardia HDDs through
the 2001/02 winter season, with actual swap transactions overlaid
2. ENVIRONMENTAL FINANCE DECEMBER 2002–JANUARY 2003 37
trading counterparties which have caused
premature termination of some positions.
The second issue is one of timing: at what
point is liquidity sufficient to justify a switch
from mark-to-model to mark-to-market? This
is an issue that must be addressed in most
over-the-counter derivatives markets, since
liquidity varies across products and tenors.
One guideline is provided by the
Committee of Chief Risk Officers (CCRO), a
coalition of energy companies, which has
recently published best practices for calculat-
ing the value and risk exposure of energy-
related commodity positions (see
www.ccro.org). It recommends that mark-to-
market be used “when there is a liquid market
in which the underlying commodities or
instruments are being actively traded” and
goes on to suggest that this level of liquidity
has been reached “when the market is suffi-
ciently deep to accommodate exchange of the
positions being evaluated”.
Other possible criteria for evaluating liq-
uidity at a specific location include general
trading volume statistics, or the existence of a
regularly posted two-way market, either via
brokers or on an exchange such as the
Chicago Mercantile Exchange. Ultimately, each
dealer must decide for itself when it believes
trading activity at a certain location has
reached the critical juncture to support mark-
to-market.
At present, most active traders in the
market consider five to 10 locations in the US
and up to five in Europe as being sufficiently
liquid to support mark-to-market.
Another area addressed by the CCRO is
the possibility of extending mark-to-market
concepts to less liquid positions.In the weath-
er market, this is relevant for locations that
may trade only infrequently and therefore
cannot be directly marked to market but
which are highly correlated with liquid loca-
tions. For example, a Hartford, Connecticut,
trade could very reasonably be marked to
market by inferring a market valuation from
nearby New York LaGuardia, which is highly
correlated to Hartford and much more liquid.
With such techniques, many of the positions
in a typical portfolio can be marked to market
in some form once sufficient liquidity exists at
a few regional anchor locations.
Figure 2 indicates how liquidity can be
considered in deciding whether a particular
position should be marked to market, marked
to model or valued using a hybrid approach as
discussed below.
The third issue in the debate is the prac-
tical challenge of how to implement mark-to-
market concepts for weather derivatives.This
initially seems to be a difficult task: since mar-
ket data on its own is rarely sufficient for valu-
ing all positions in a portfolio, it is necessary
to combine market data and modelling to
develop accurate portfolio valuations and risk
metrics. With a sufficiently robust portfolio
risk management framework, however, this
should be a straightforward process.
Such a framework starts with an analysis
of the indexes underlying each contract in a
portfolio. Each type of index at each location
needs to be characterised with a probability
distribution that accurately represents the
range of possible outcomes at expiry. Because
of the caps on most weather swaps, account-
ing for the full distribution is relevant for valu-
ing swaps as well as options.
When there is active trading of both
swaps and options on an index, such as
Heathrow HDDs,its entire distribution can be
derived from market price data. Conversely,
when there is no liquidity on a particular index
– as is common for customised end-user solu-
tions – and when that index has minimal cor-
relation with a liquid index or location, model-
ling of historical data is necessary to charac-
terise the full distribution.
For all other cases,an index distribution
may be best defined with a hybrid
approach that combines market and
historical data. One common example
is found at locations with a liquid swap market
but only occasional option trading. In such
cases,the index mean can be set to the market
swap level while the remainder of the distribu-
tion can be derived from historical data.
Hybrid approaches are also feasible for
valuing indexes at illiquid locations that are at
least moderately correlated with liquid
locations.
As noted above, a mean index value for a
location like Hartford can sometimes be
inferred directly from swap prices at a more
liquid location like NewYork. However, this is
only possible when the two locations are
highly correlated. When correlations are
weaker, one approach used by some market
participants is to set the mean index at a value
that is a weighted combination of the market-
implied swap level and a mean derived from
historical data, with the weight on the market
data reflecting the degree of correlation.
Although somewhat arbitrary, this sort of
approach provides a rational way of combin-
ing market and historical data. Similar hybrid
approaches can also be applied to non-stan-
dard indexes.
Once each of the underlying indexes has
been characterised, portfolio valuation and
risk is calculated by simulating the combined
behaviour of all contracts in the portfolio.
Monte Carlo simulation can generate thou-
sands of realistic scenarios across all positions
in a portfolio, while maintaining the correla-
tions that have been observed historically
between indexes. In addition to portfolio val-
uation, the simulation output quantifies the
full range of possible portfolio outcomes and
the associated probabilities. Key portfolio risk
measures such as standard deviation, expiry
value at risk (VAR), and mean losses in excess
of VAR are calculated from this information.
With such a framework, the effects of
changing market prices, actual weather mea-
surements, and revised short-term weather
forecasts can all be quickly reflected in updat-
ed portfolio analyses. Changing views of liq-
uidity can also be easily incorporated by
adjusting the mix of market data and model-
ling used to value individual positions.
Increasingly widespread use of mark-to-
market concepts in the weather market is a
result of continuing growth as well as the
entry into the market of banks and other
financial institutions. These companies are
insisting on implementing mark-to-market
risk management approaches similar to those
used on their other trading desks.
At the same time, there is still a legitimate
role for models of historical weather data in
quantifying portfolio value and risk. Modelling
is important for supplementing market data
and is necessary to be able to value illiquid
positions.
Ultimately, each market participant must
consider their unique portfolio and business
mix in establishing an appropriate combina-
tion of mark-to-market and mark-to-model
approaches within their overall portfolio
analysis framework.
Paul VanderMarck is managing director, weather
risk, at Risk Management Solutions, a California-
based weather and catastrophe risk modelling
firm.
E-mail: Paul.VanderMarck@rms.com
EF
Mark-to-modelHybrid
approach
Mark-to-
market
Location
(decreasing liquidity)
San Francisco, Rome
Minneapolis, Munich
NewYork, London
Degree days Non 18/65
degree days
Precipitation
event indexes
Index
(decreasing
liquidity)
2. Index and location liquidity must be considered in establishing
a valuation method