
Recommended
Recommended
More Related Content
What's hot
What's hot (20)
Viewers also liked
Similar to Macy's stock update examines valuation, bears and bulls cases
Similar to Macy's stock update examines valuation, bears and bulls cases (20)
Recently uploaded
Recently uploaded (20)
Macy's stock update examines valuation, bears and bulls cases
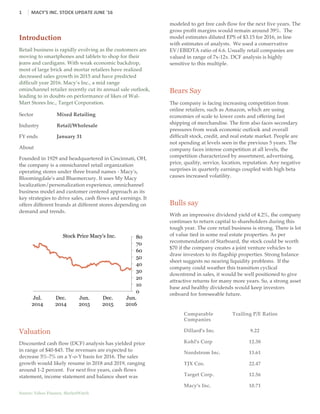
- 1. 1 MACY'S INC. STOCK UPDATE JUNE '16 Source: Yahoo Finance, MarketWatch Introduction Retail business is rapidly evolving as the customers are moving to smartphones and tablets to shop for their jeans and cardigans. With weak economic backdrop, most of large brick and mortar retailers have realized decreased sales growth in 2015 and have predicted difficult year 2016. Macy’s Inc., a mid range ominchannel retailer recently cut its annual sale outlook, leading to in doubts on performance of likes of Wal- Mart Stores Inc., Target Corporation. Sector Mixed Retailing Industry Retail/Wholesale FY ends January 31 About Founded in 1929 and headquartered in Cincinnati, OH, the company is a omnichannel retail organization operating stores under three brand names - Macy's, Bloomingdale's and Bluemercury. It uses My Macy localization/personalization experience, omnichannel business model and customer centered approach as its key strategies to drive sales, cash flows and earnings. It offers different brands at different stores depending on demand and trends. Valuation Discounted cash flow (DCF) analysis has yielded price in range of $40-$45. The revenues are expected to decrease 5%-7% on a Y-o-Y basis for 2016. The sales growth would likely resume in 2018 and 2019, ranging around 1-2 percent. For next five years, cash flows statement, income statement and balance sheet was modeled to get free cash flow for the next five years. The gross profit margins would remain around 39%. The model estimates diluted EPS of $3.15 for 2016, in line with estimates of analysts. We used a conservative EV/EBIDTA ratio of 6.6. Usually retail companies are valued in range of 7x-12x. DCF analysis is highly sensitive to this multiple. Bears Say The company is facing increasing competition from online retailers, such as Amazon, which are using economies of scale to lower costs and offering fast shipping of merchandise. The firm also faces secondary pressures from weak economic outlook and overall difficult stock, credit, and real estate market. People are not spending at levels seen in the previous 5 years. The company faces intense competition at all levels, the competition characterized by assortment, advertising, price, quality, service, location, reputation. Any negative surprises in quarterly earnings coupled with high beta causes increased volatility. Bulls say With an impressive dividend yield of 4.2%, the company continues to return capital to shareholders during this tough year. The core retail business is strong. There is lot of value tied in some real estate properties. As per recommendation of Starboard, the stock could be worth $70 if the company creates a joint venture vehicles to draw investors to its flagship properties. Strong balance sheet suggests no nearing liquidity problems. If the company could weather this transition cyclical downtrend in sales, it would be well positioned to give attractive returns for many more years. So, a strong asset base and healthy dividends would keep investors onboard for foreseeable future.0 10 20 30 40 50 60 70 80 Jun. 2016 Dec. 2015 Jun. 2015 Dec. 2014 Jul. 2014 Stock Price Macy's Inc. Comparable Companies Trailing P/E Ratios Dillard's Inc. 9.22 Kohl's Corp 12.38 Nordstrom Inc. 13.61 TJX Cos. 22.47 Target Corp. 12.56 Macy's Inc. 10.71
- 2. 2 MACY'S INC. STOCK UPDATE JUNE '16 Source: Company Reports, Capital IQ. Bikram Singh Last 12 months The stock has lost 50% of its value from adjusted price of $67 to the current value of $33.2 as of 21 June '16. In the same time period, the retail-wholesale index has gained 29% and S&P 500 index is slightly down by -1.5%. It has paid quarterly dividends of $0.36, $0.36, $0.36 and $0.3775. Surprisingly, the latest dividend increase to $0.3775 caused dividend yield to jump from 2-3% range to whooping 4.8%. The current market cap is $10.24 billion. From Jan '09 - Jan '16, the stock returned an astounding 412%. The company enjoyed 5 year uninterrupted growth in revenues and earnings from 2009-2014. Year 2015 saw decline in revenue of 3.7%. Trailing twelve months (TTM) ROE and ROA stands at 21% and 6.6%, indicating management value addition. Recent News and Outlook This spring awakening in April's retail sales didn't go dormant in May. It is estimated real consumer spending could rise 4% in April-June quarter. With modest expectations, it could translate into 2% quarterly increase in retail sales. But this growth could fall into the lap of online retailers and outlets like Macy's could be again looking at a lousy quarter, even though better than Jan-March quarter. Understandably, consumer spending hasn't been a good predictor of retail sales. A lot is ridding on how Macy's management and execution team catch up the online preferences of the consumer and make the experience as good as stepping into the store and trying the outfit. The investors would be demanding the results of online channels in coming years, as it could lead to the crucial decision of staying in the stock or getting out. The company is likely hold off its plans for international expansion for the near future and focus on cost efficiencies, the tactic companies usually take when revenue growth stalls. The risk reward ratio is very attractive, given 50% loss of value. Cost of Equity 9.85% Cost of Debt 5.68% WACC 7.44% Tax Rate 36.23% Capital supplied by Debt 38.72% EV/EBITDA 6.6 x WACC Sensitivity analysis WACC 6.0% 6.5% 7.0% 7.5% 8.0% 8.5% Stock Price 45.3 45.1 44.9 44.7 44.7 44.2 Present Value of next 5 year FCFF $5,092 million Present Value of terminal value $15,609 million Total Enterprise Value $20,702 million Total Equity Value $14,817 million Total diluted shares outstanding 333 million Per Share Value $44.5 EV/EBIDTA sensitivity analysis EV/EBIDTA 5.0 5.5 6.0 6.5 7.0 7.5 Stock Price 33.6 37.17 40.8 44.3 47.9 51.4