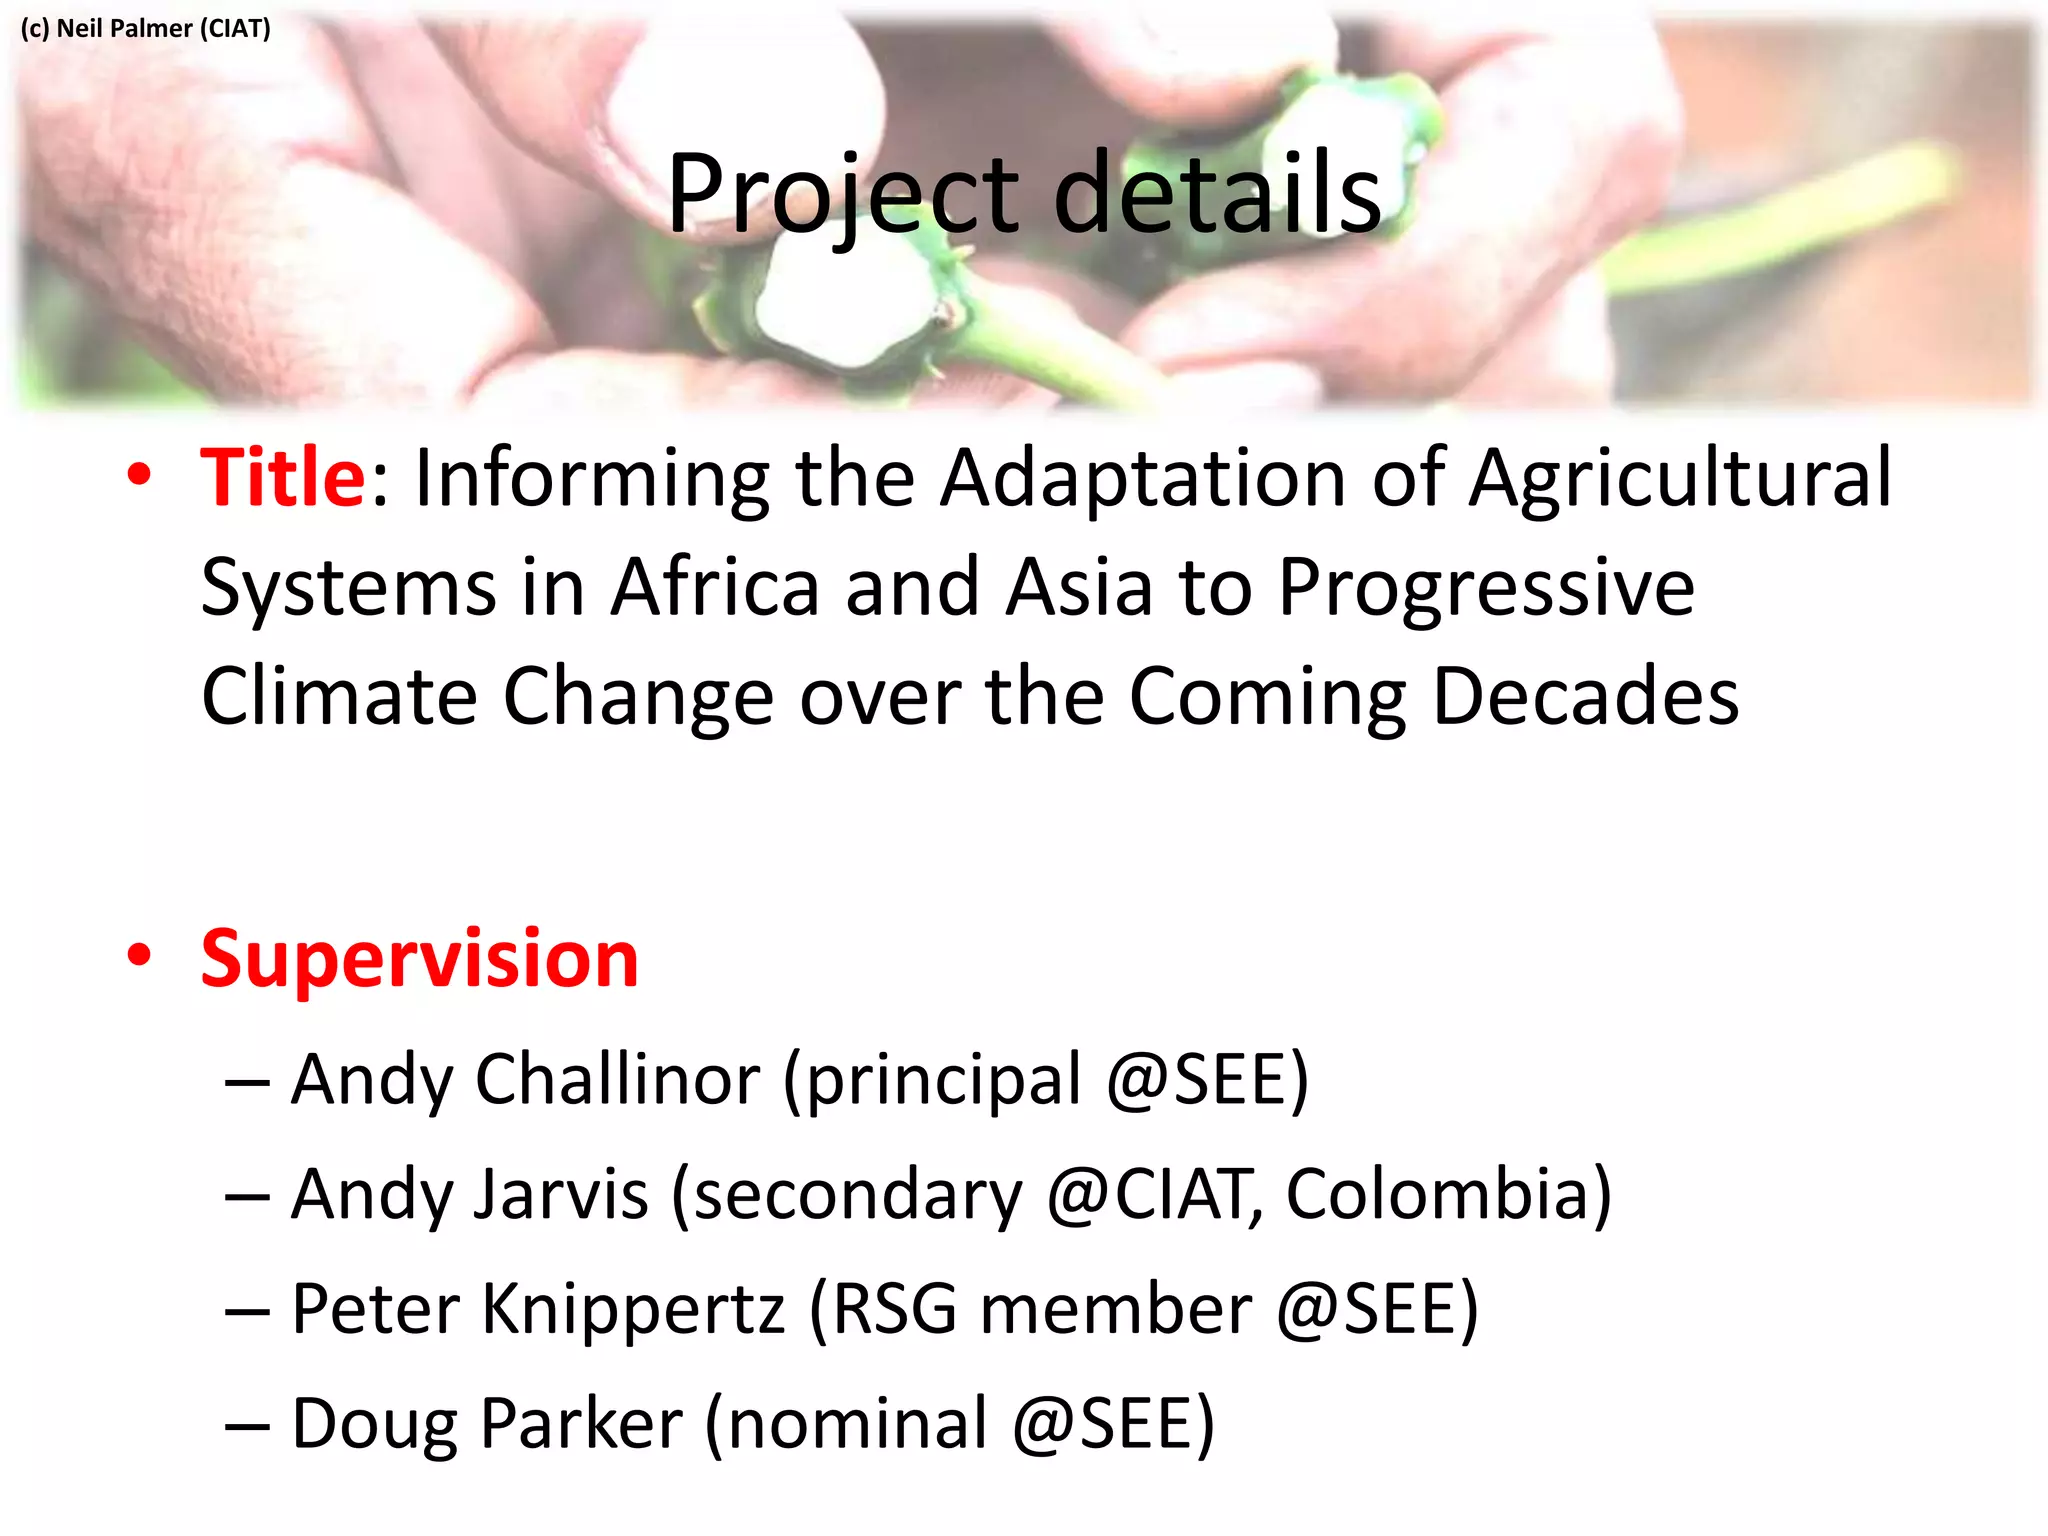
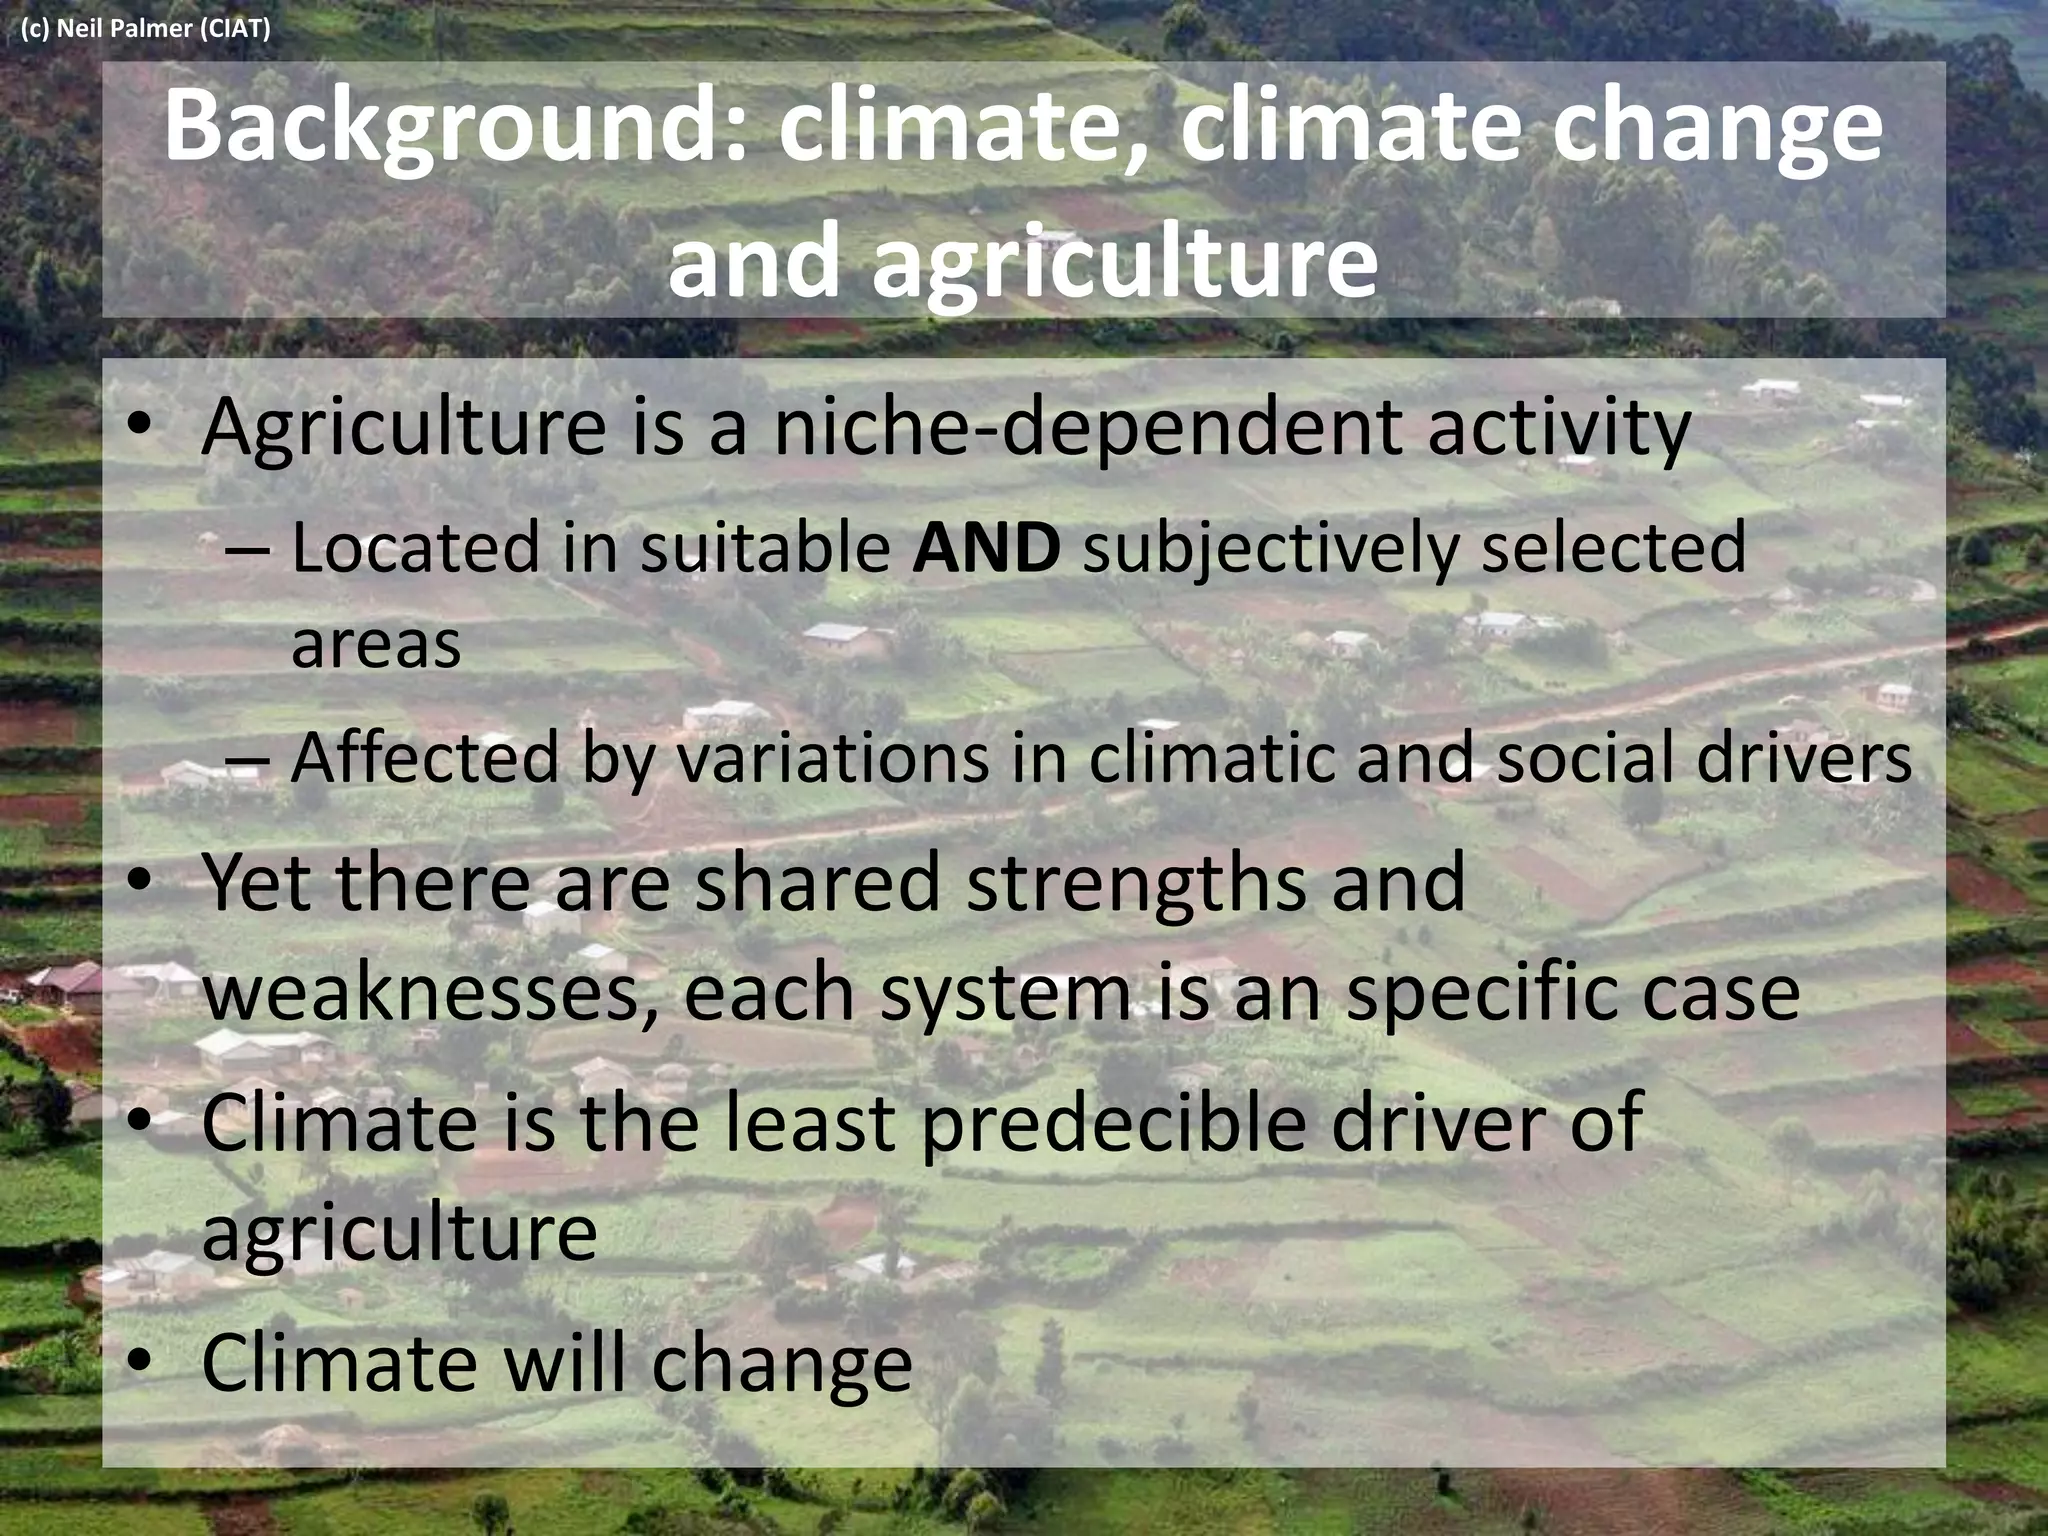
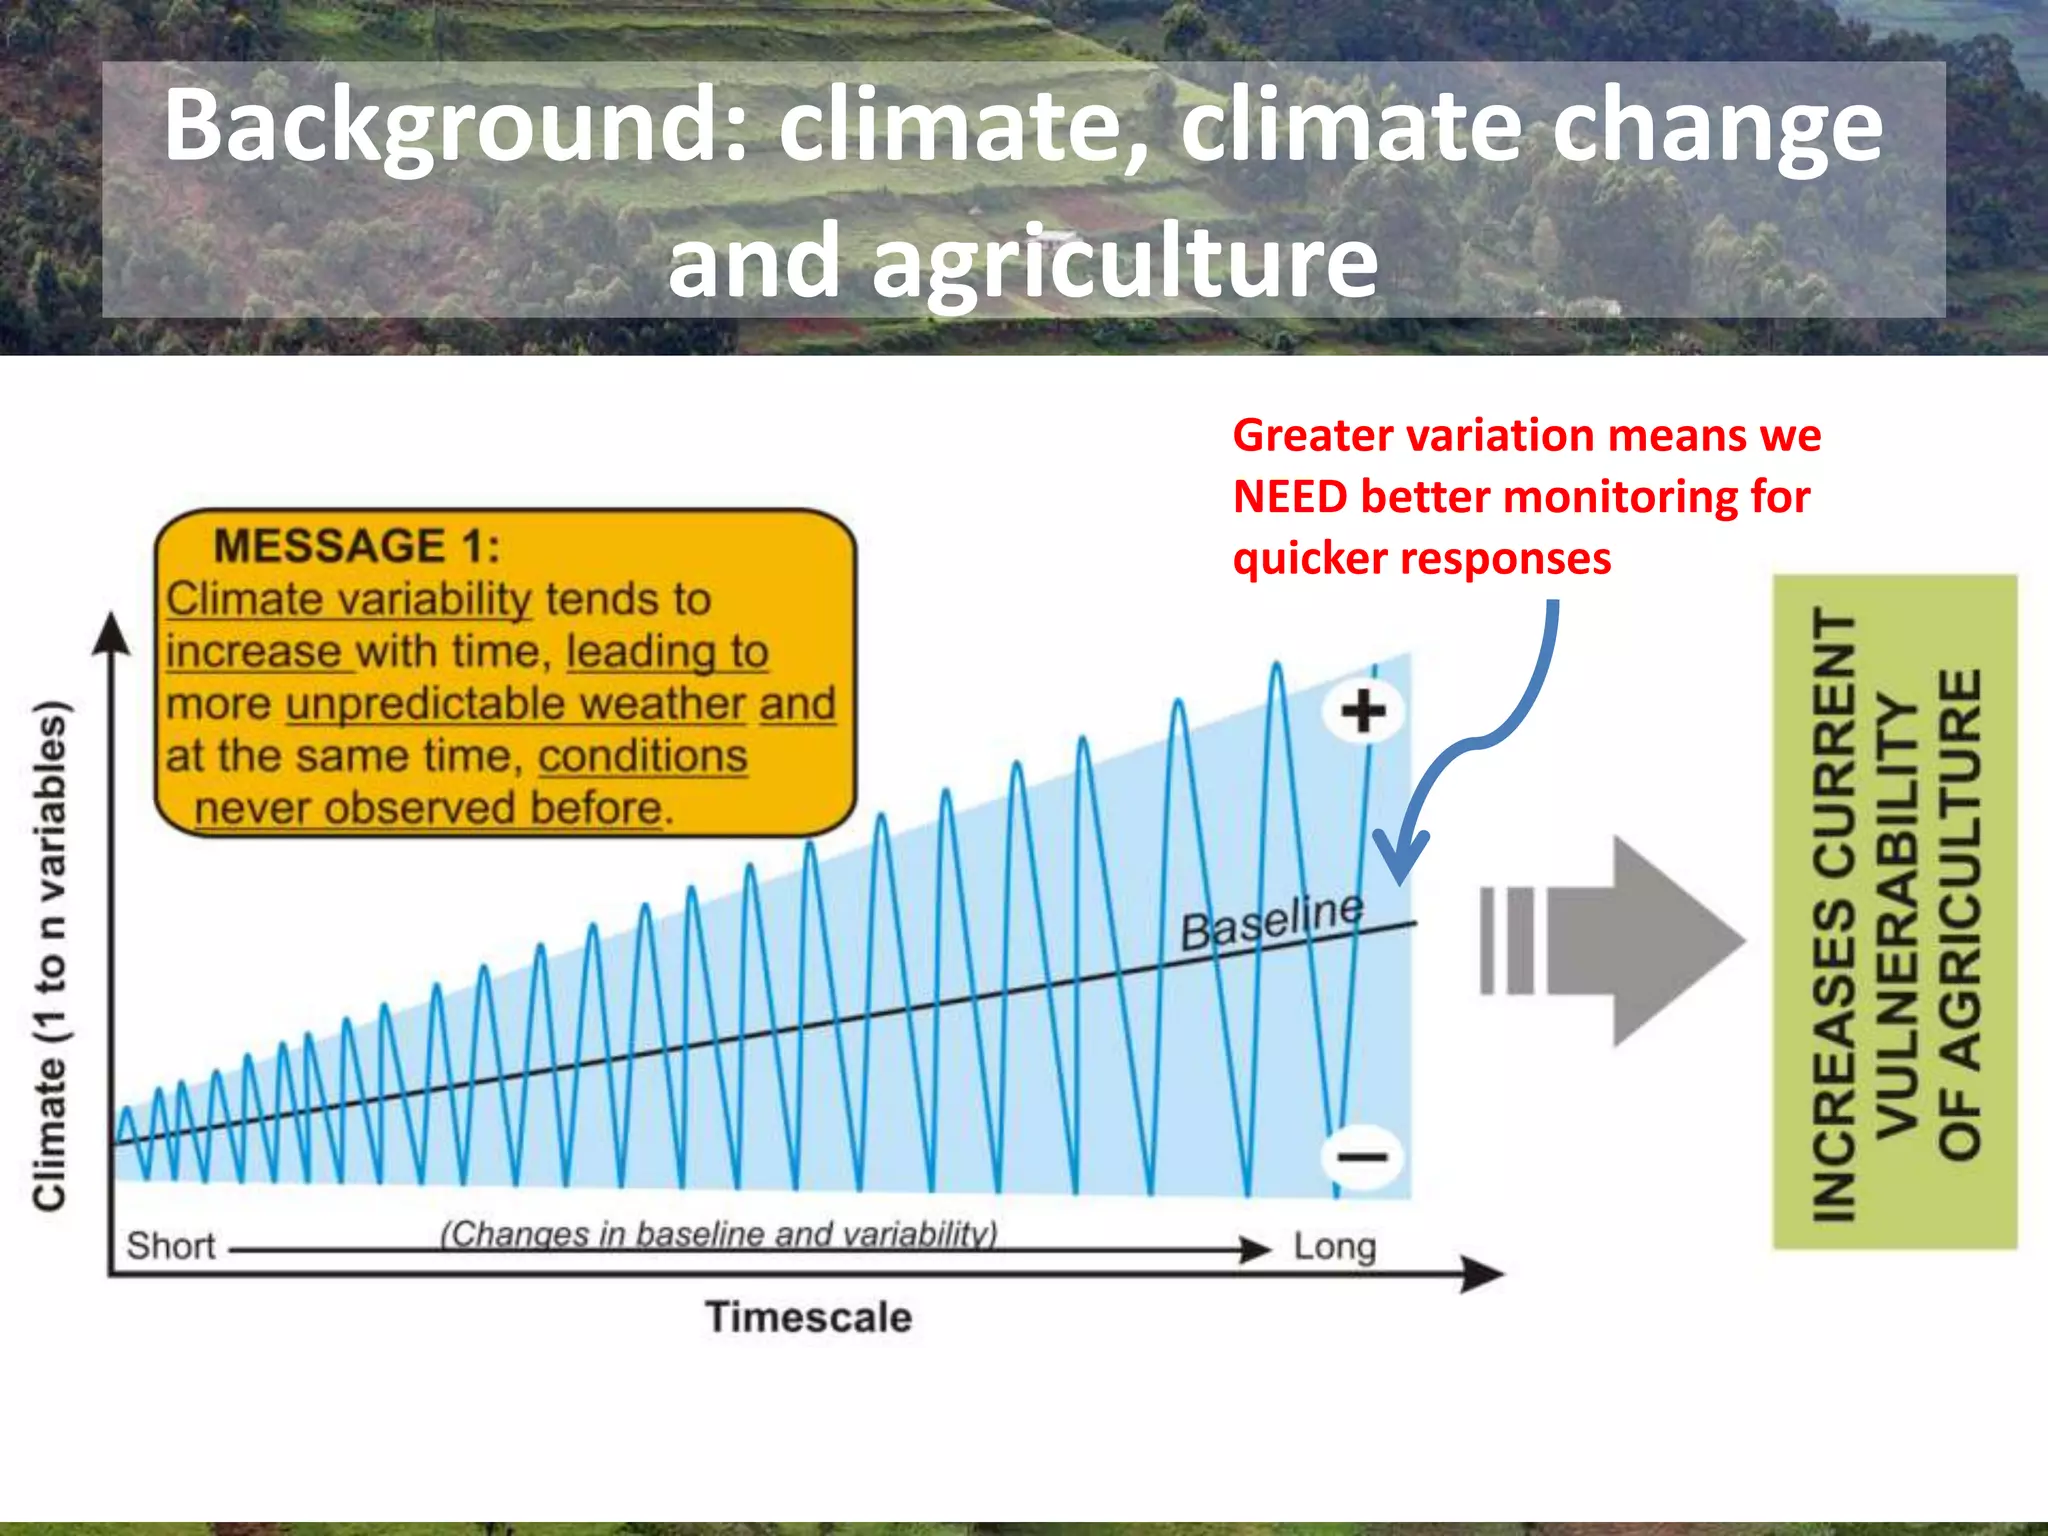
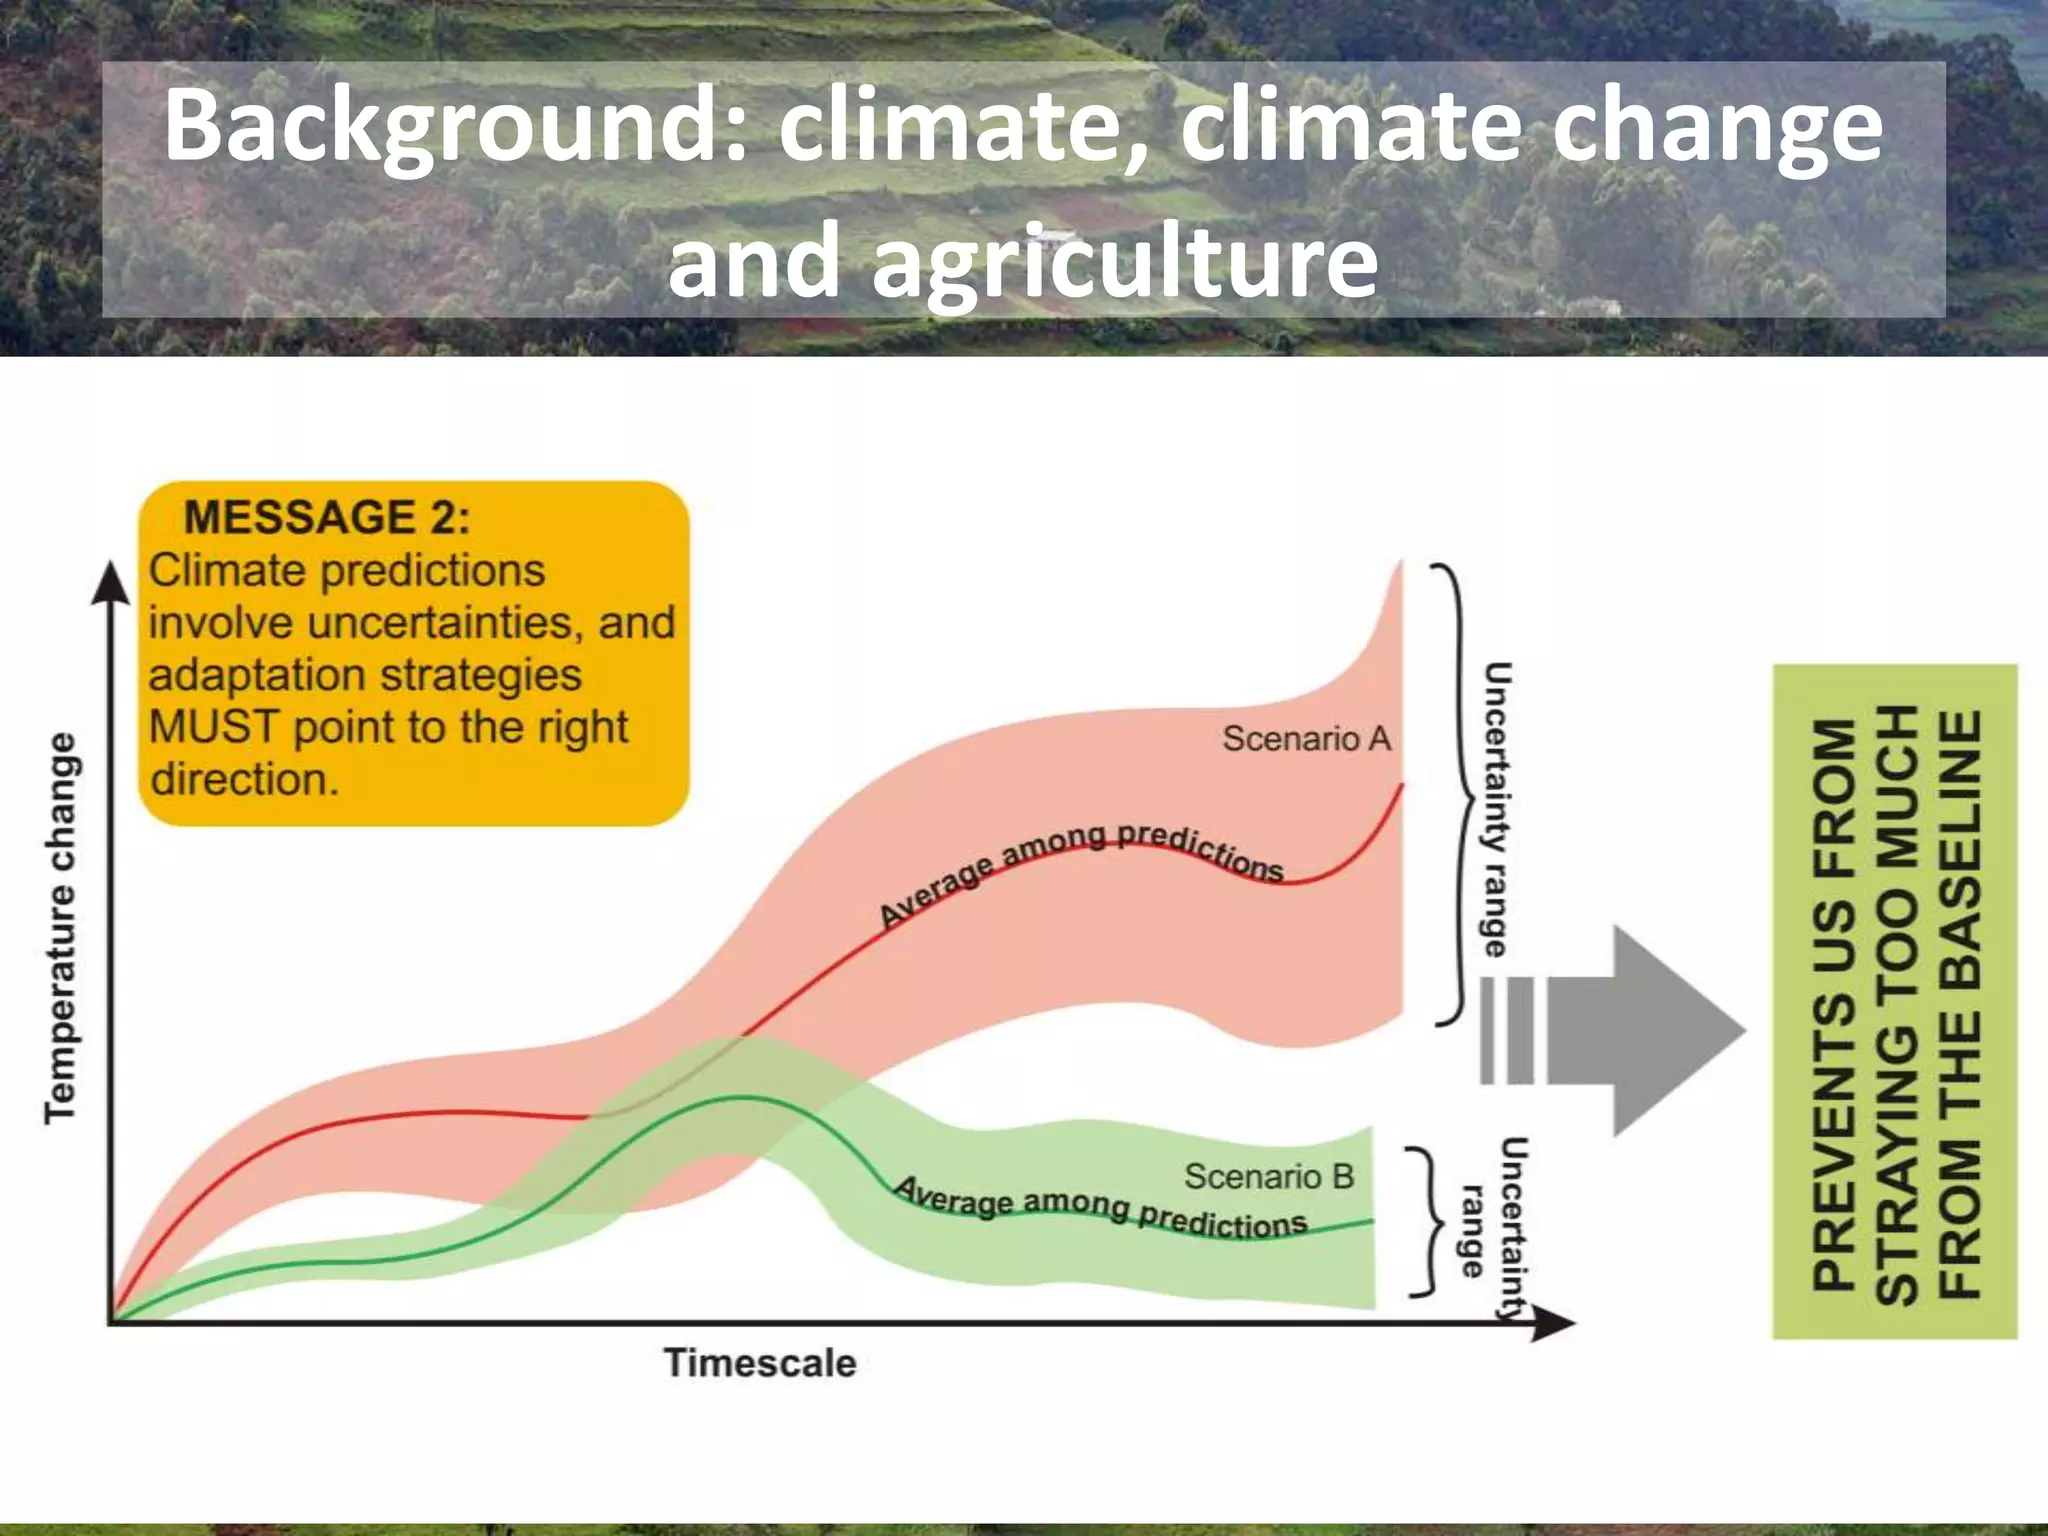
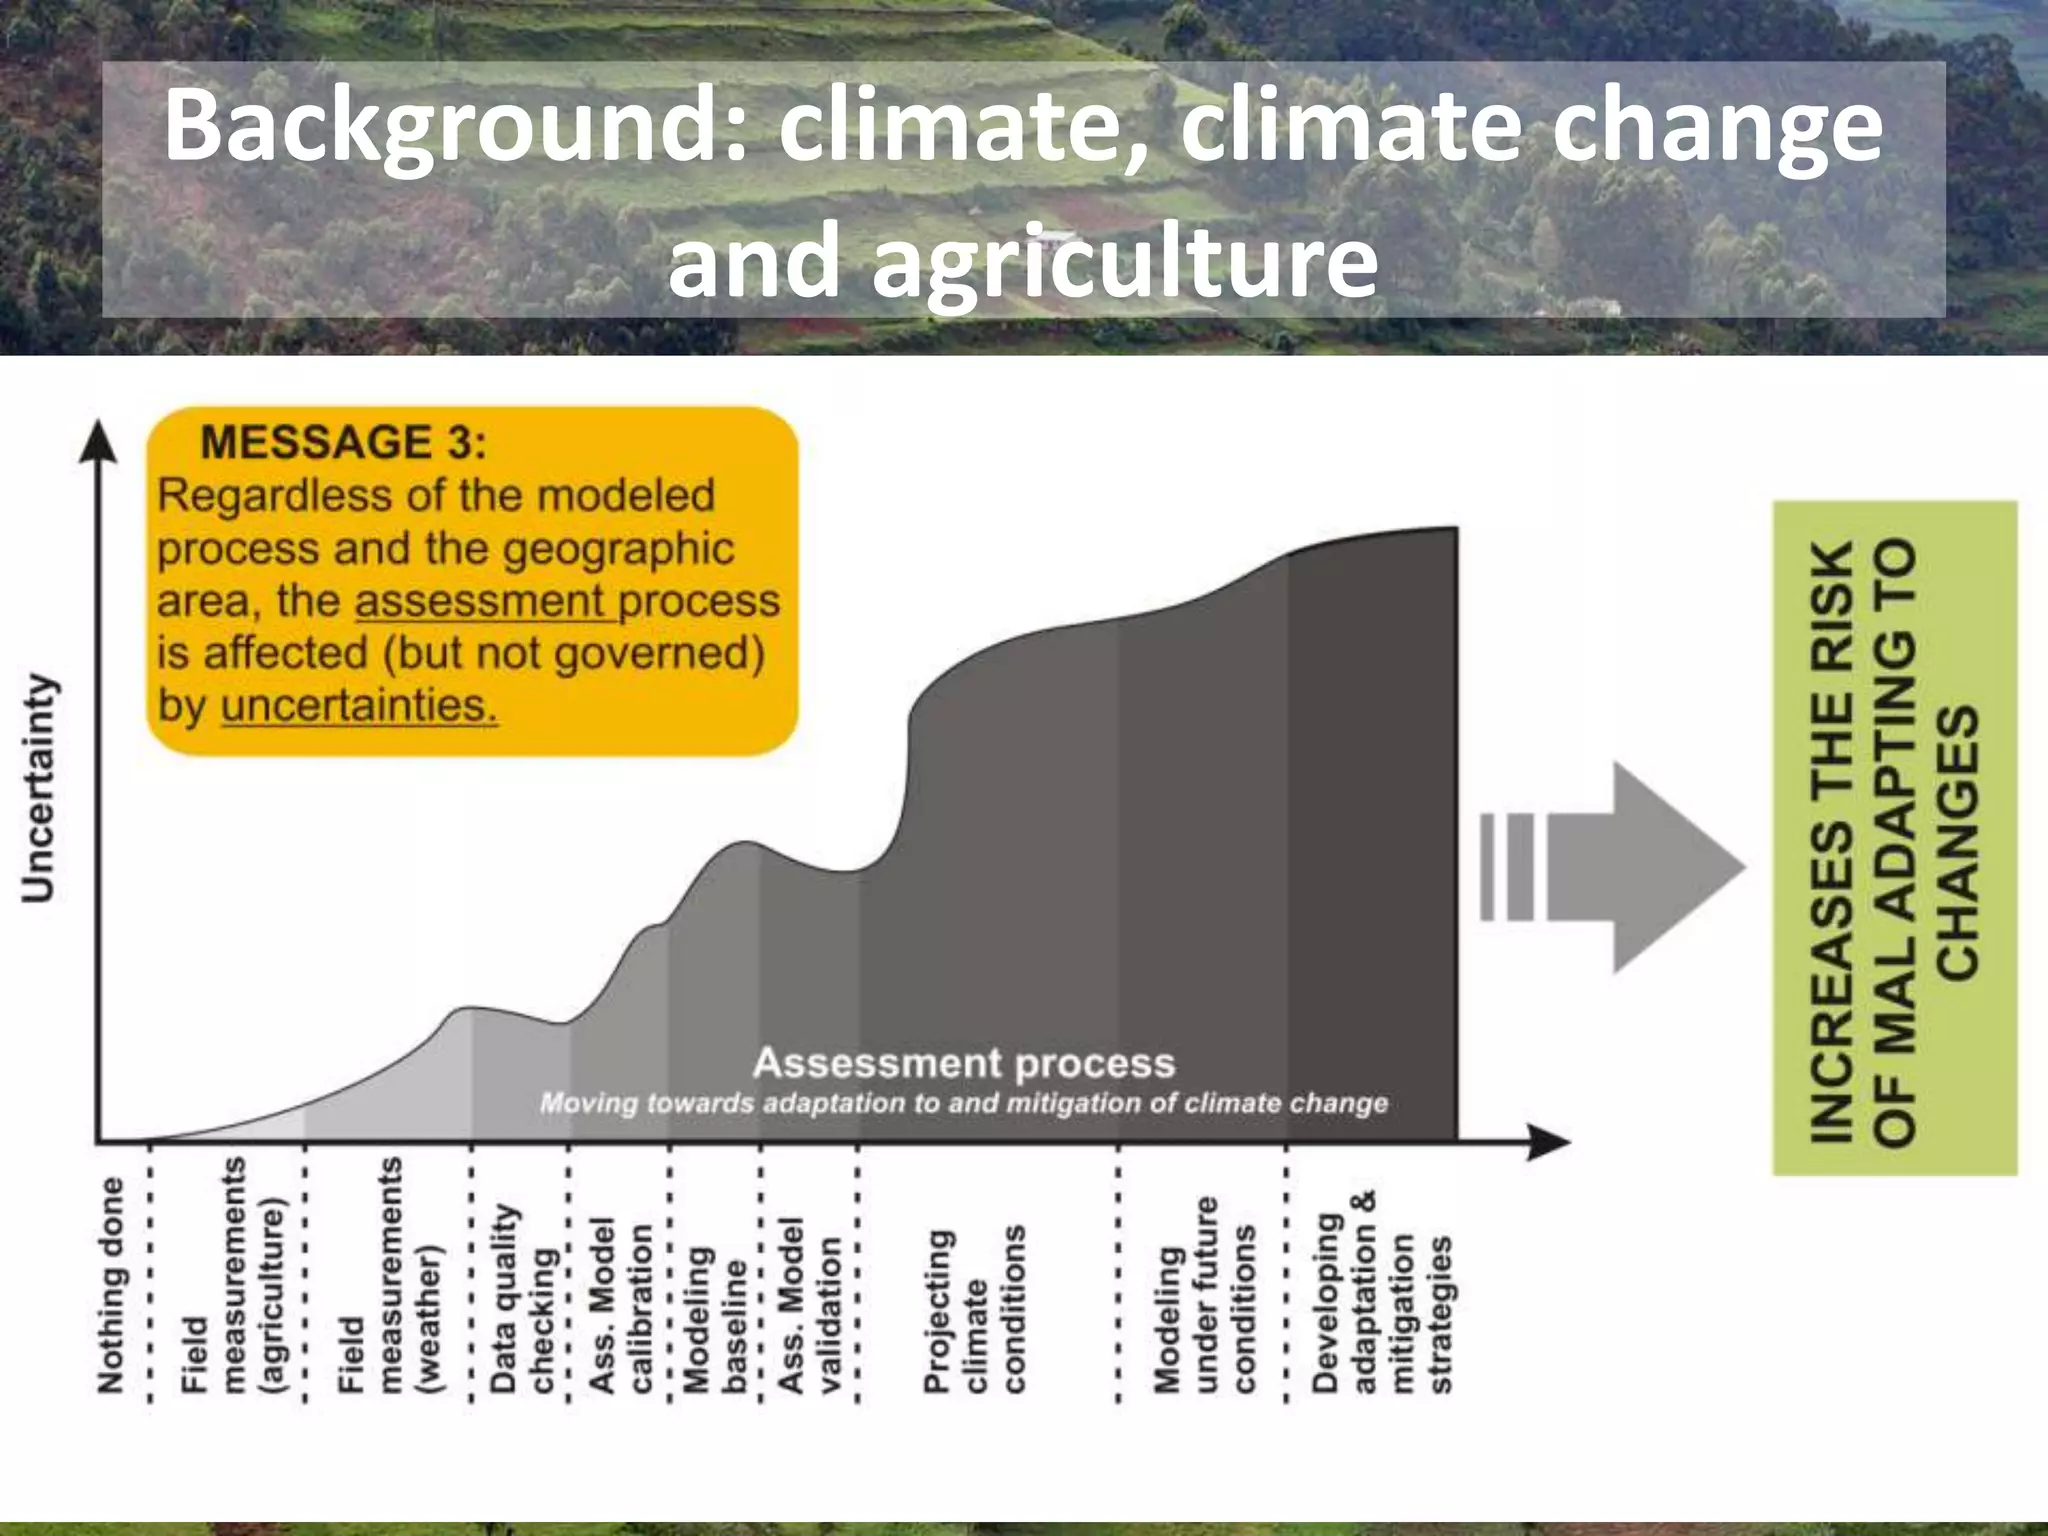
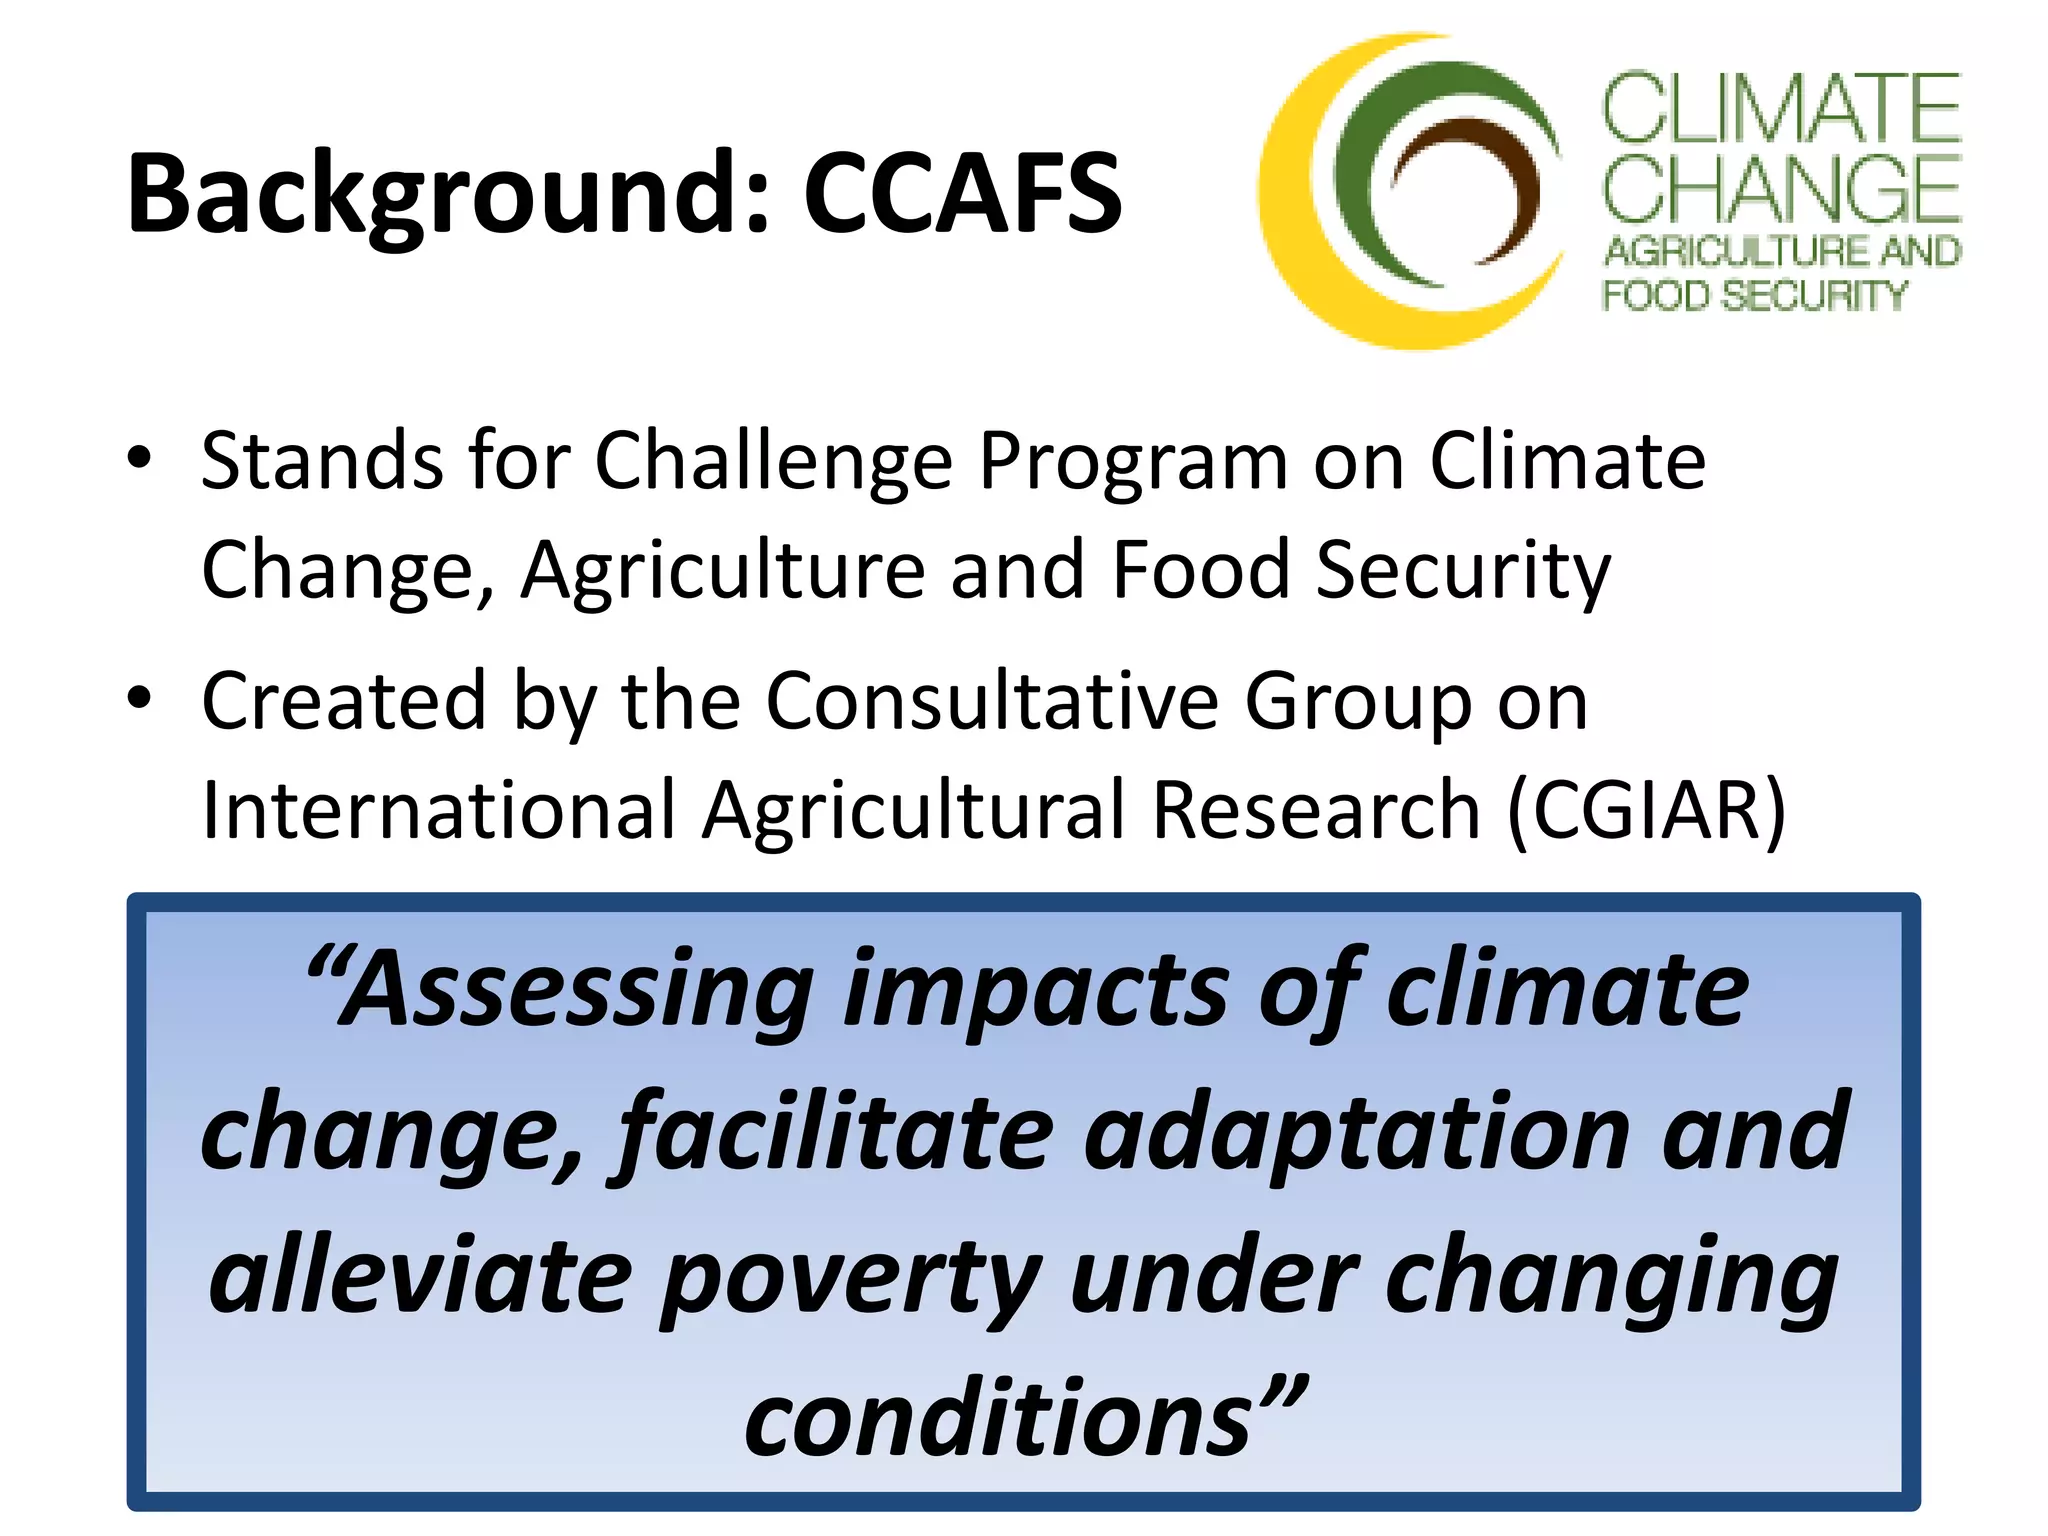
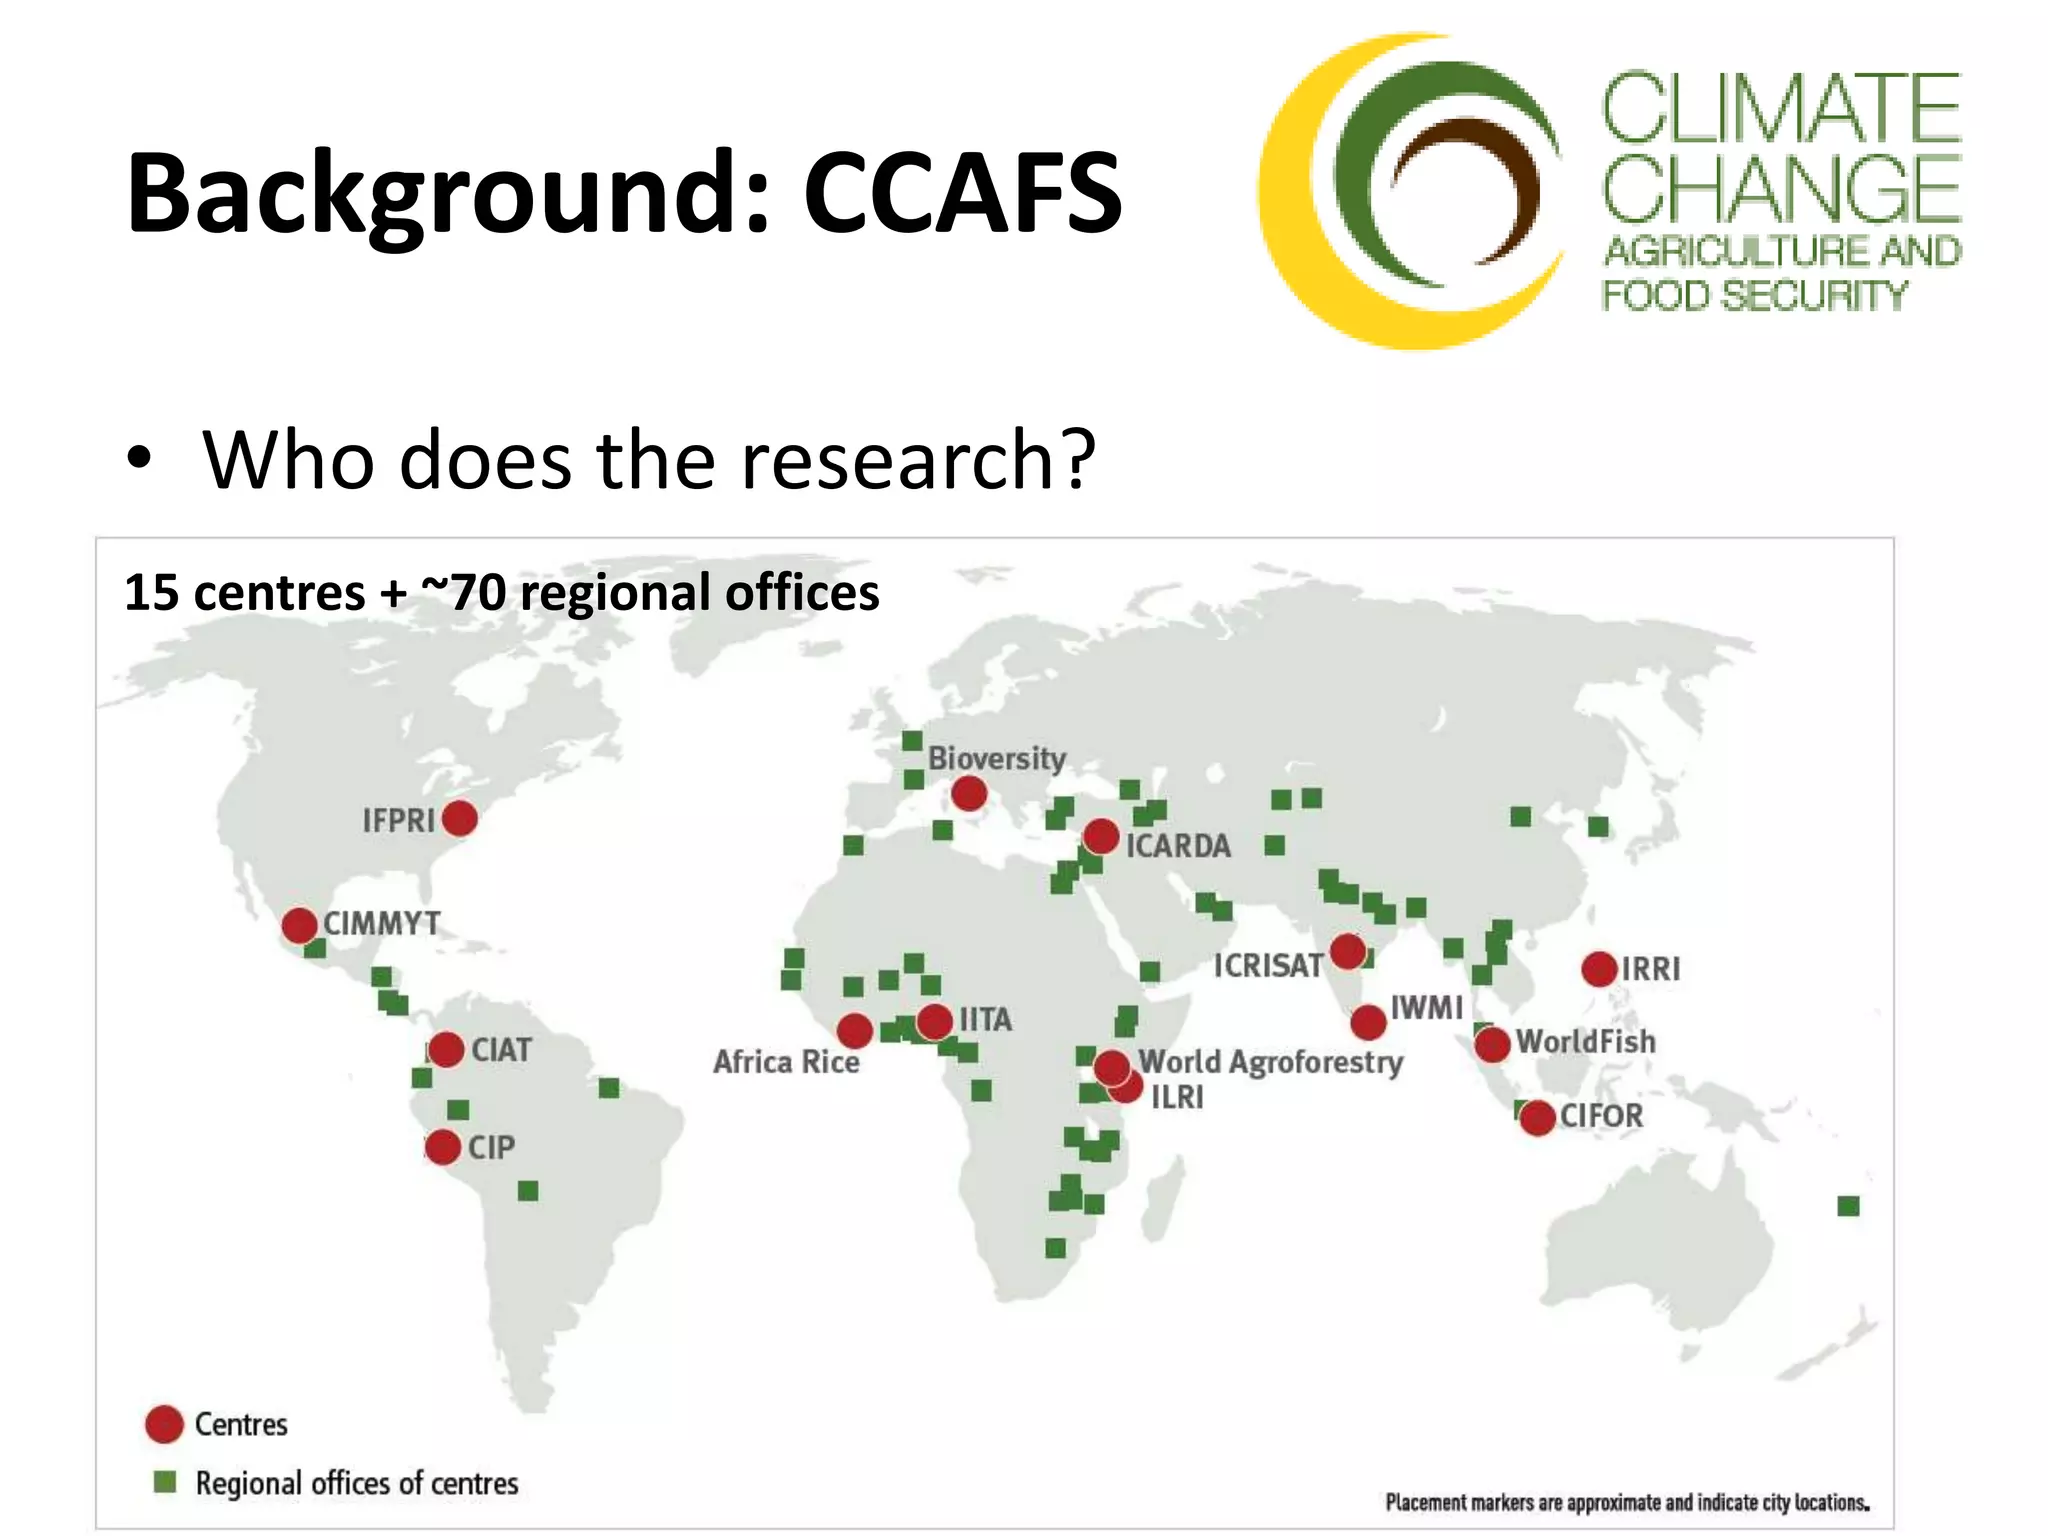
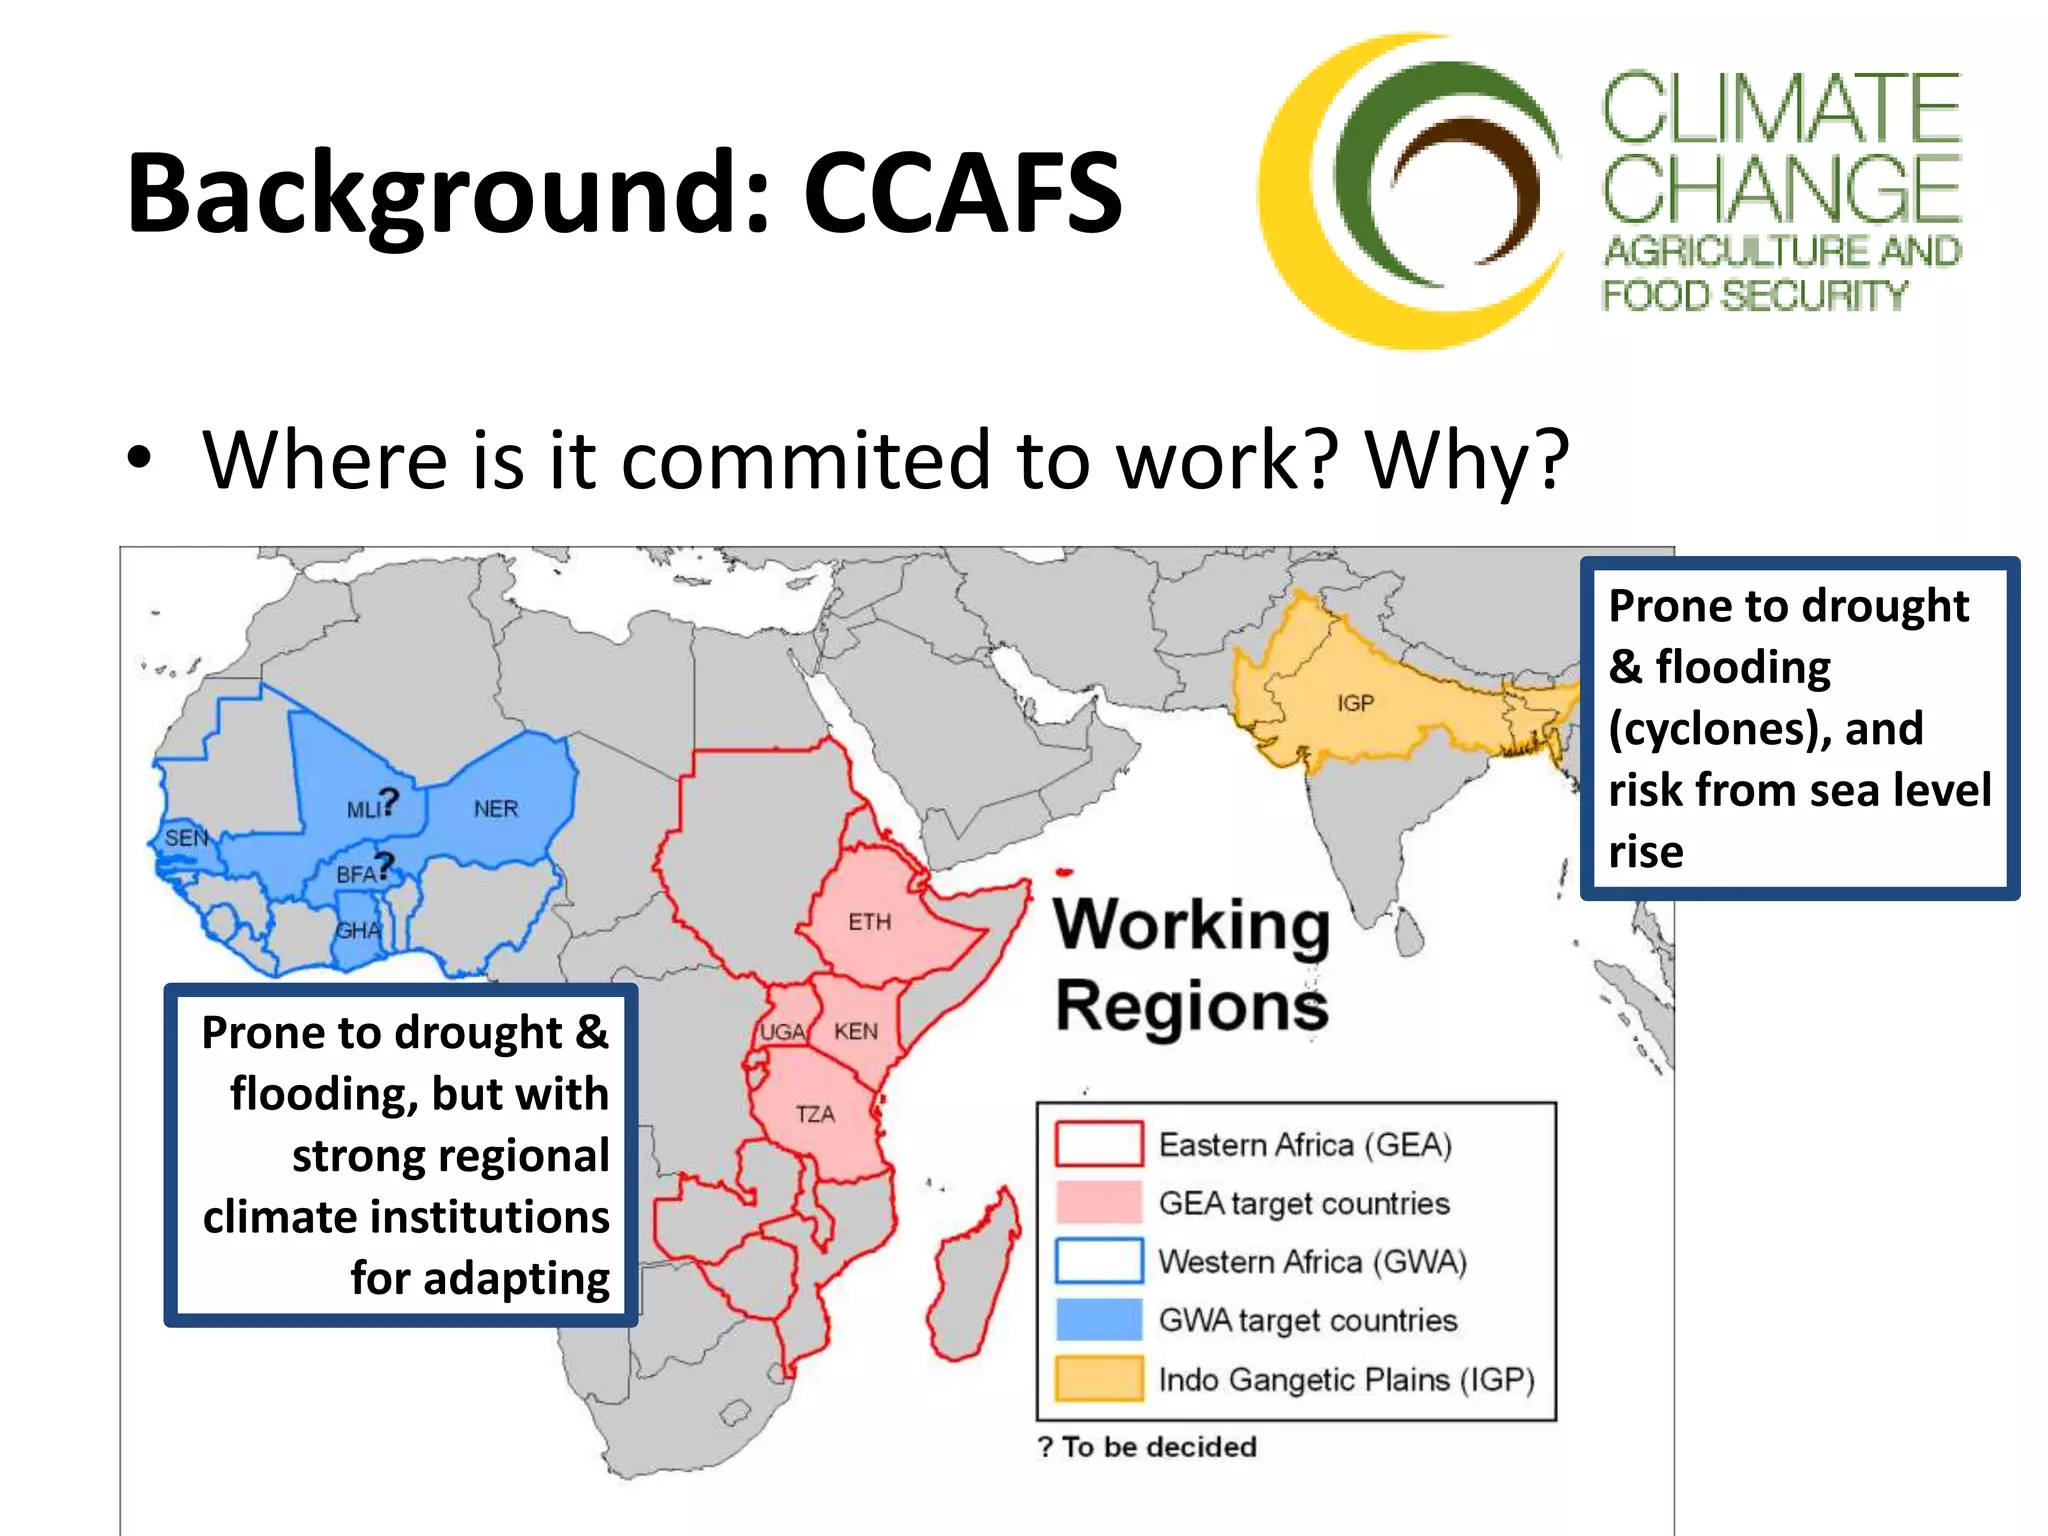
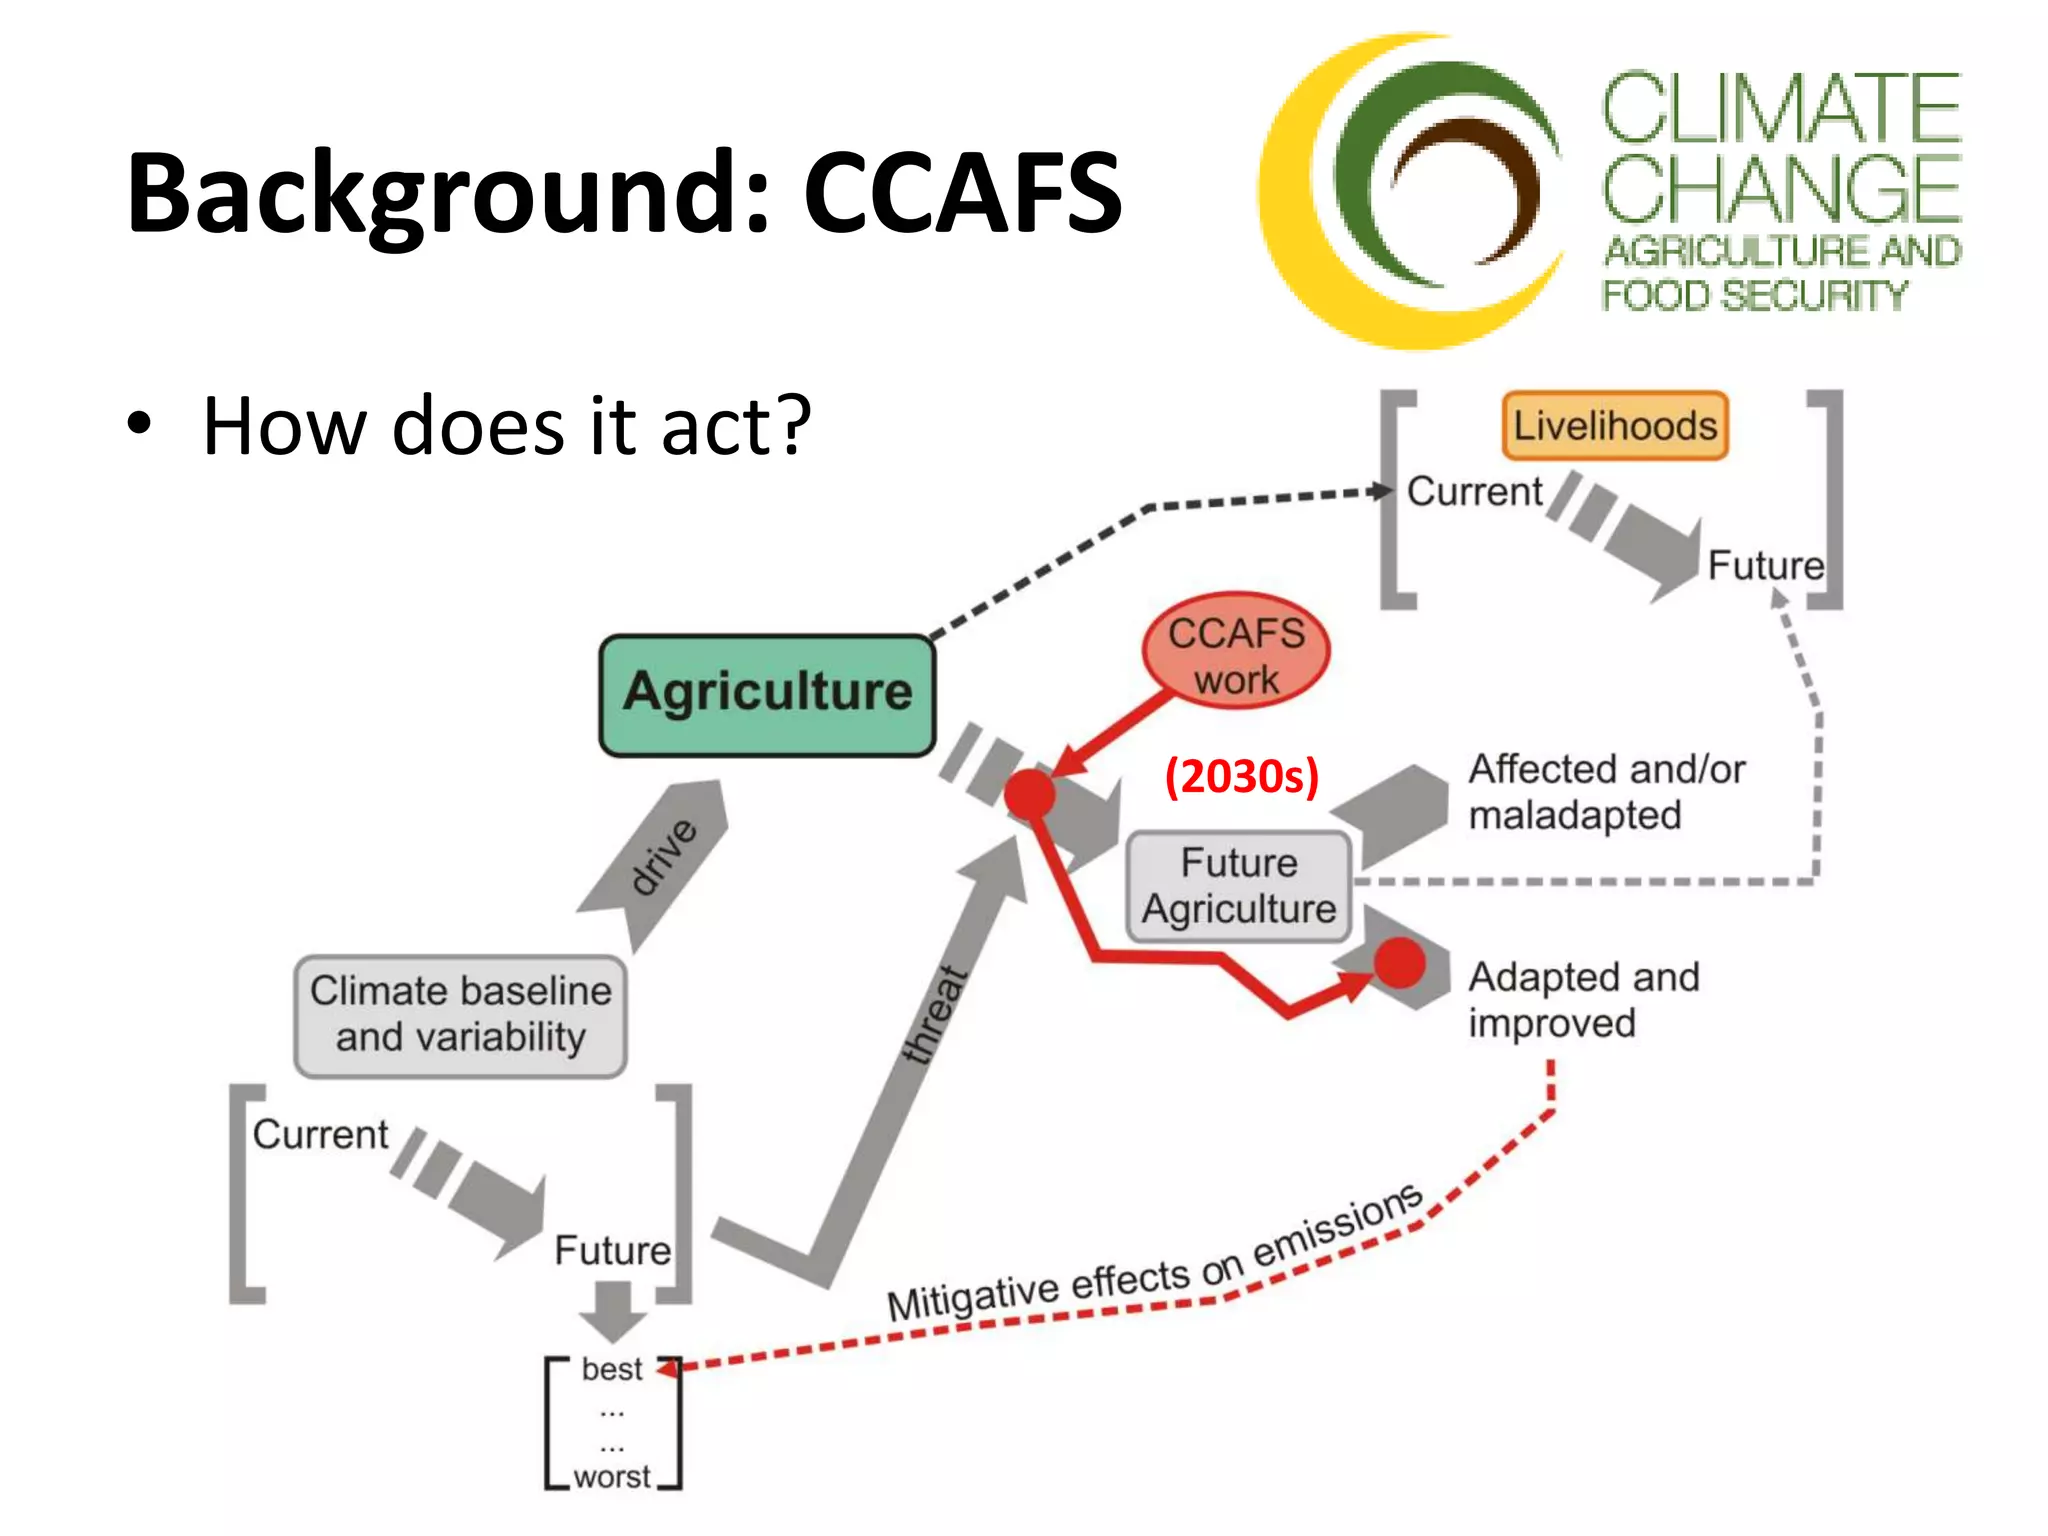
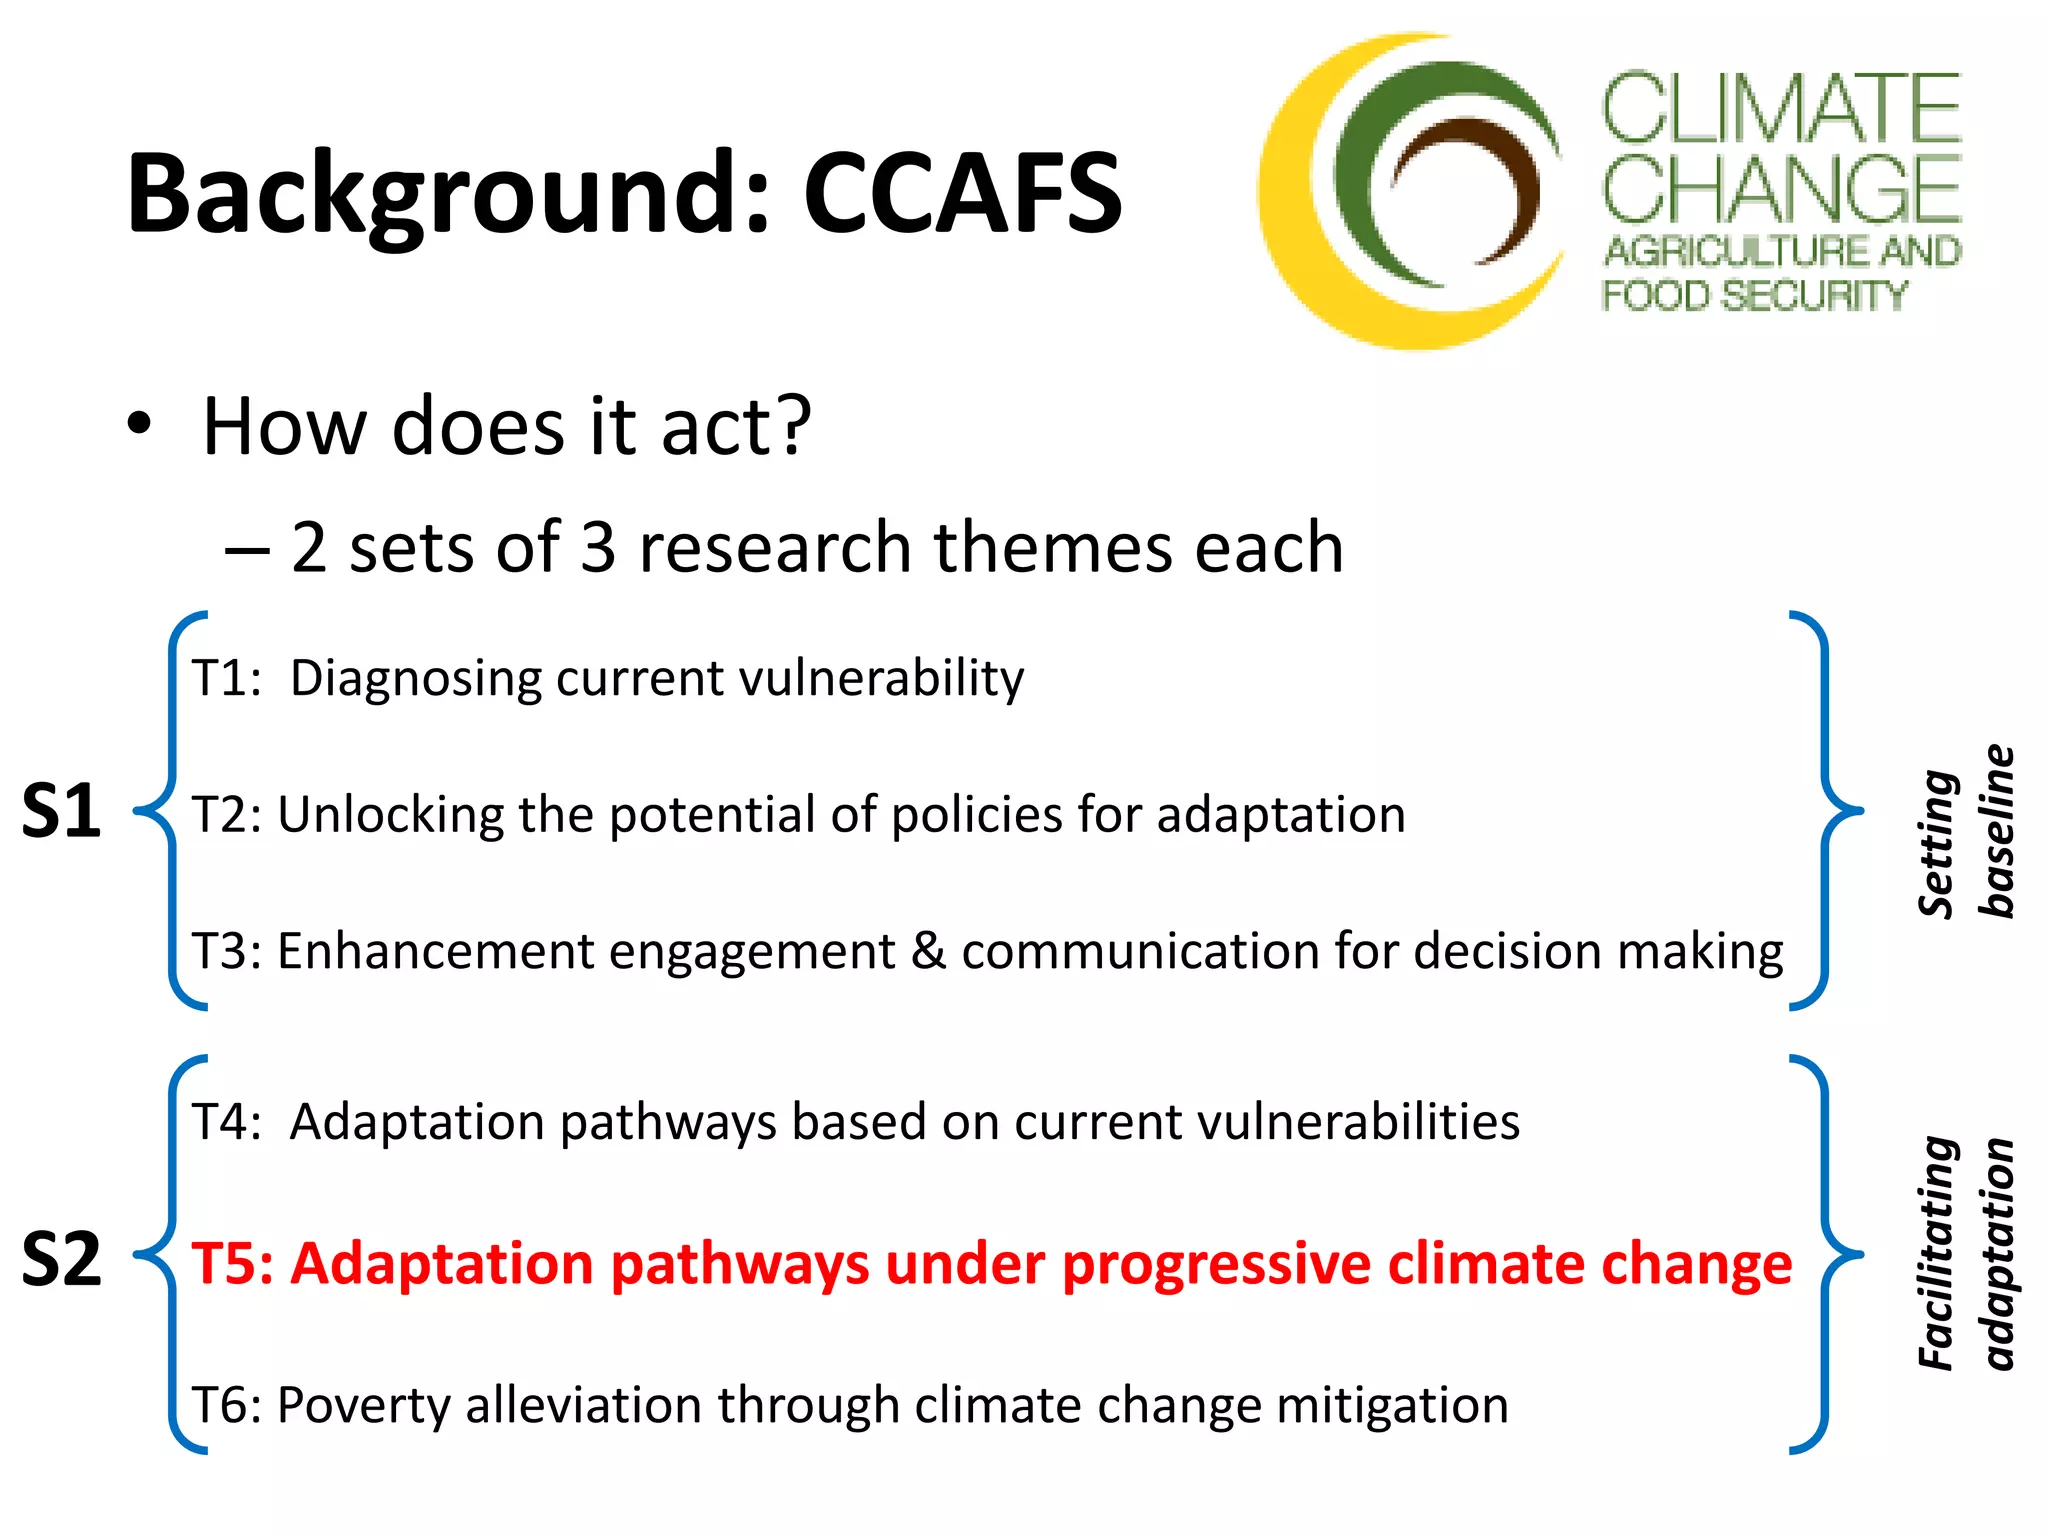
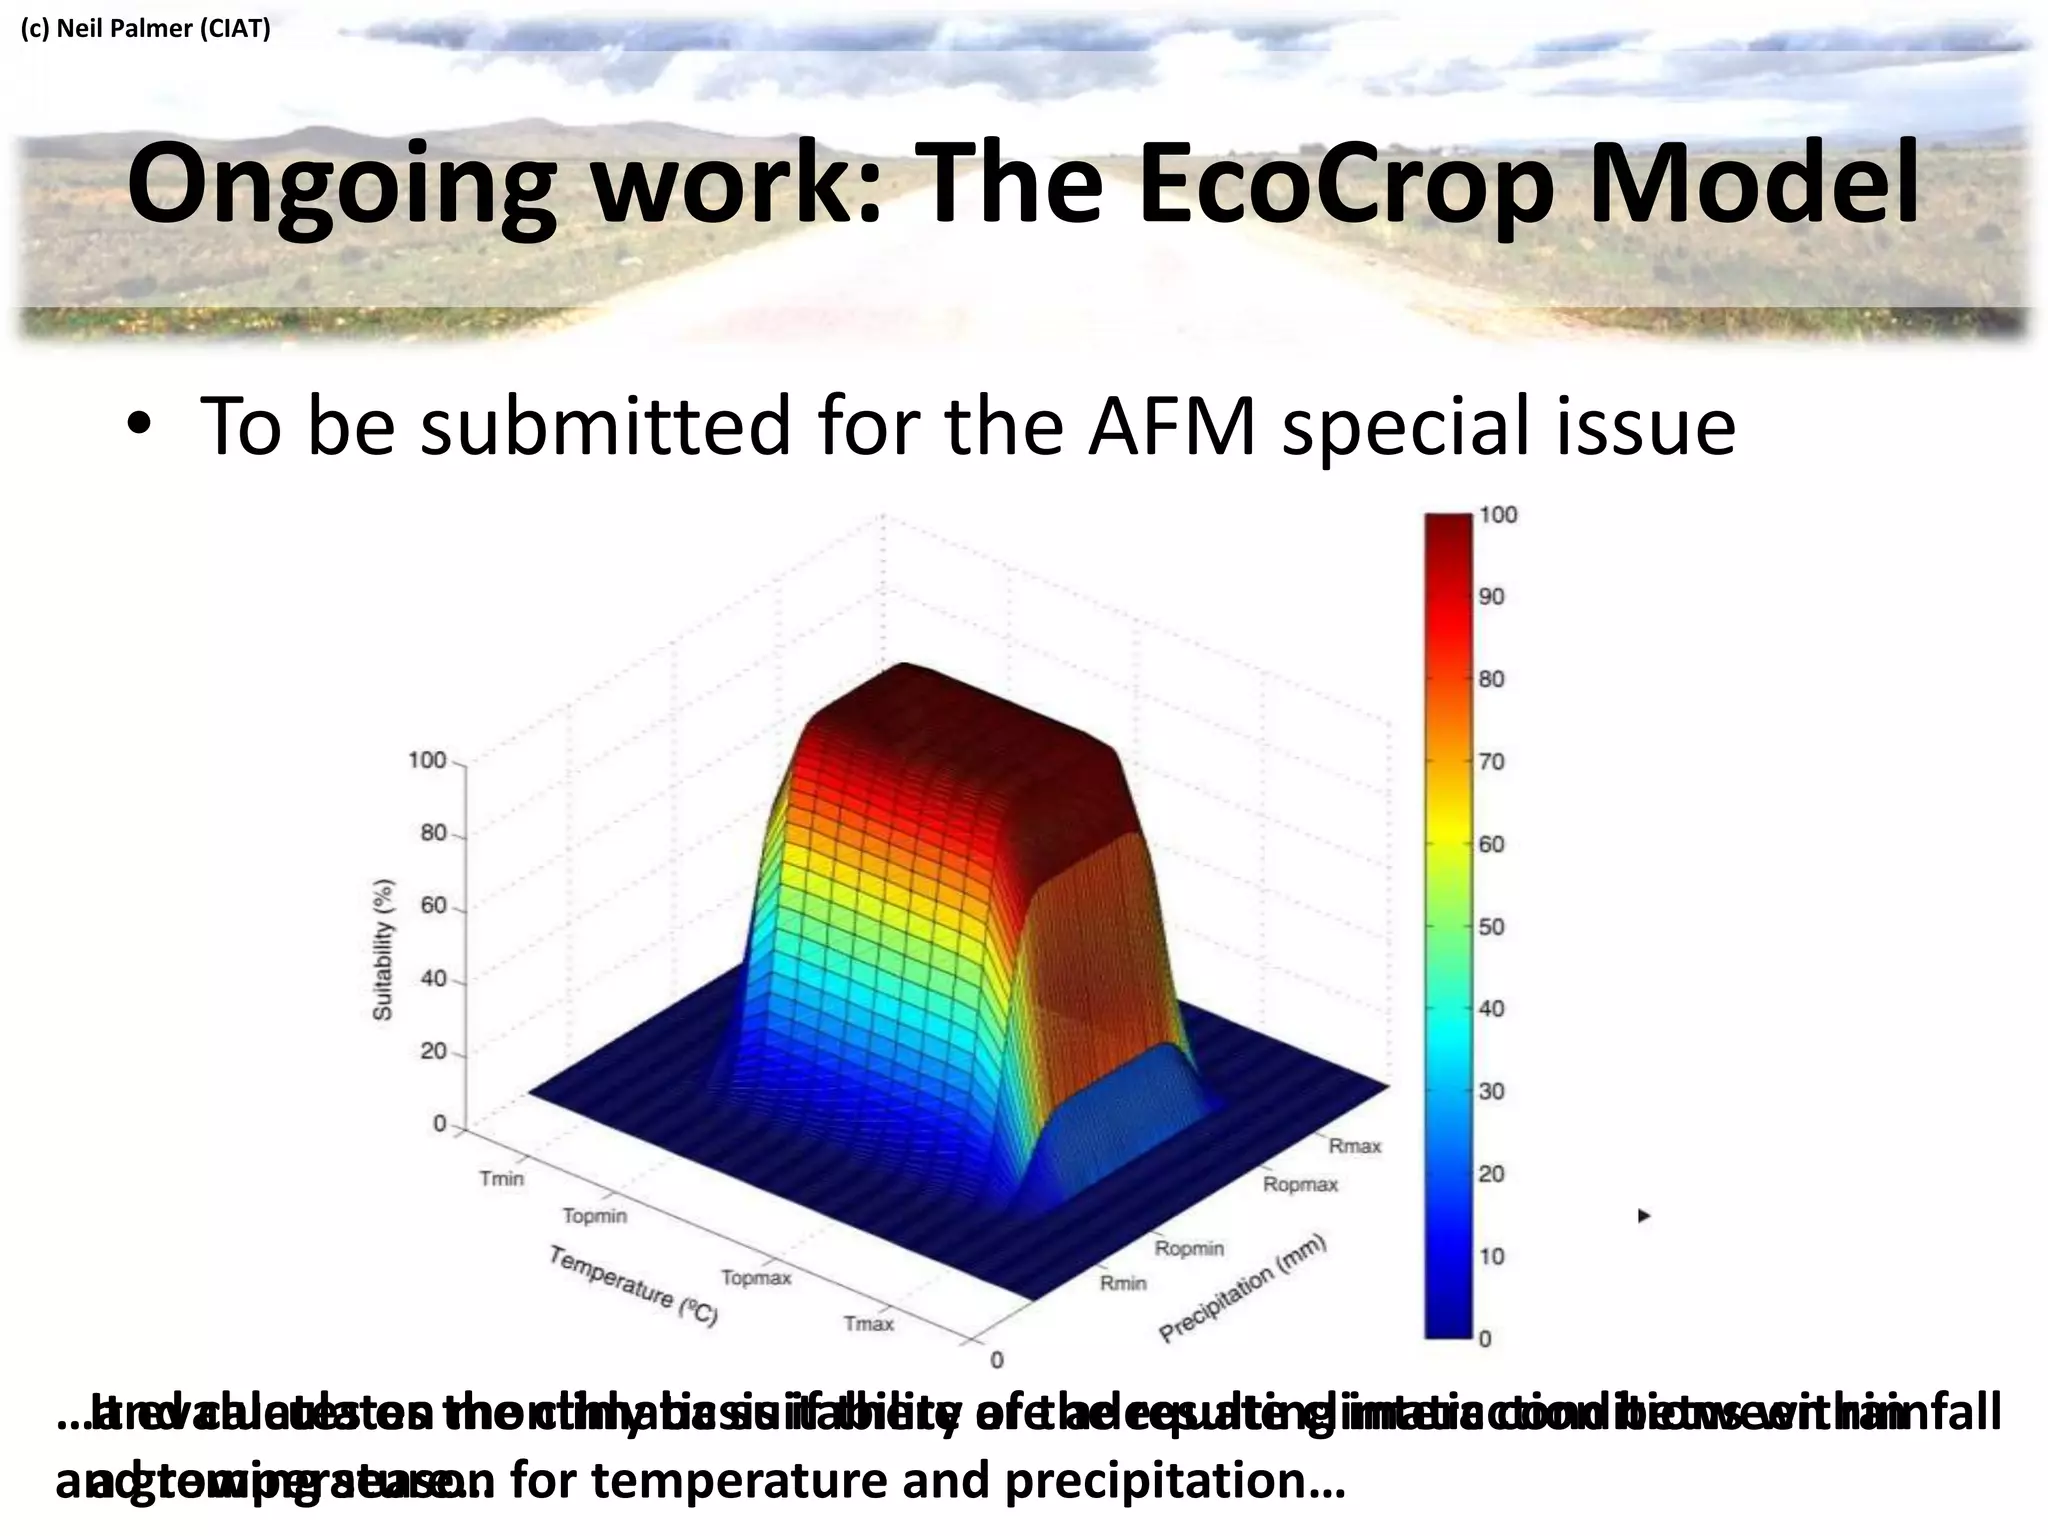
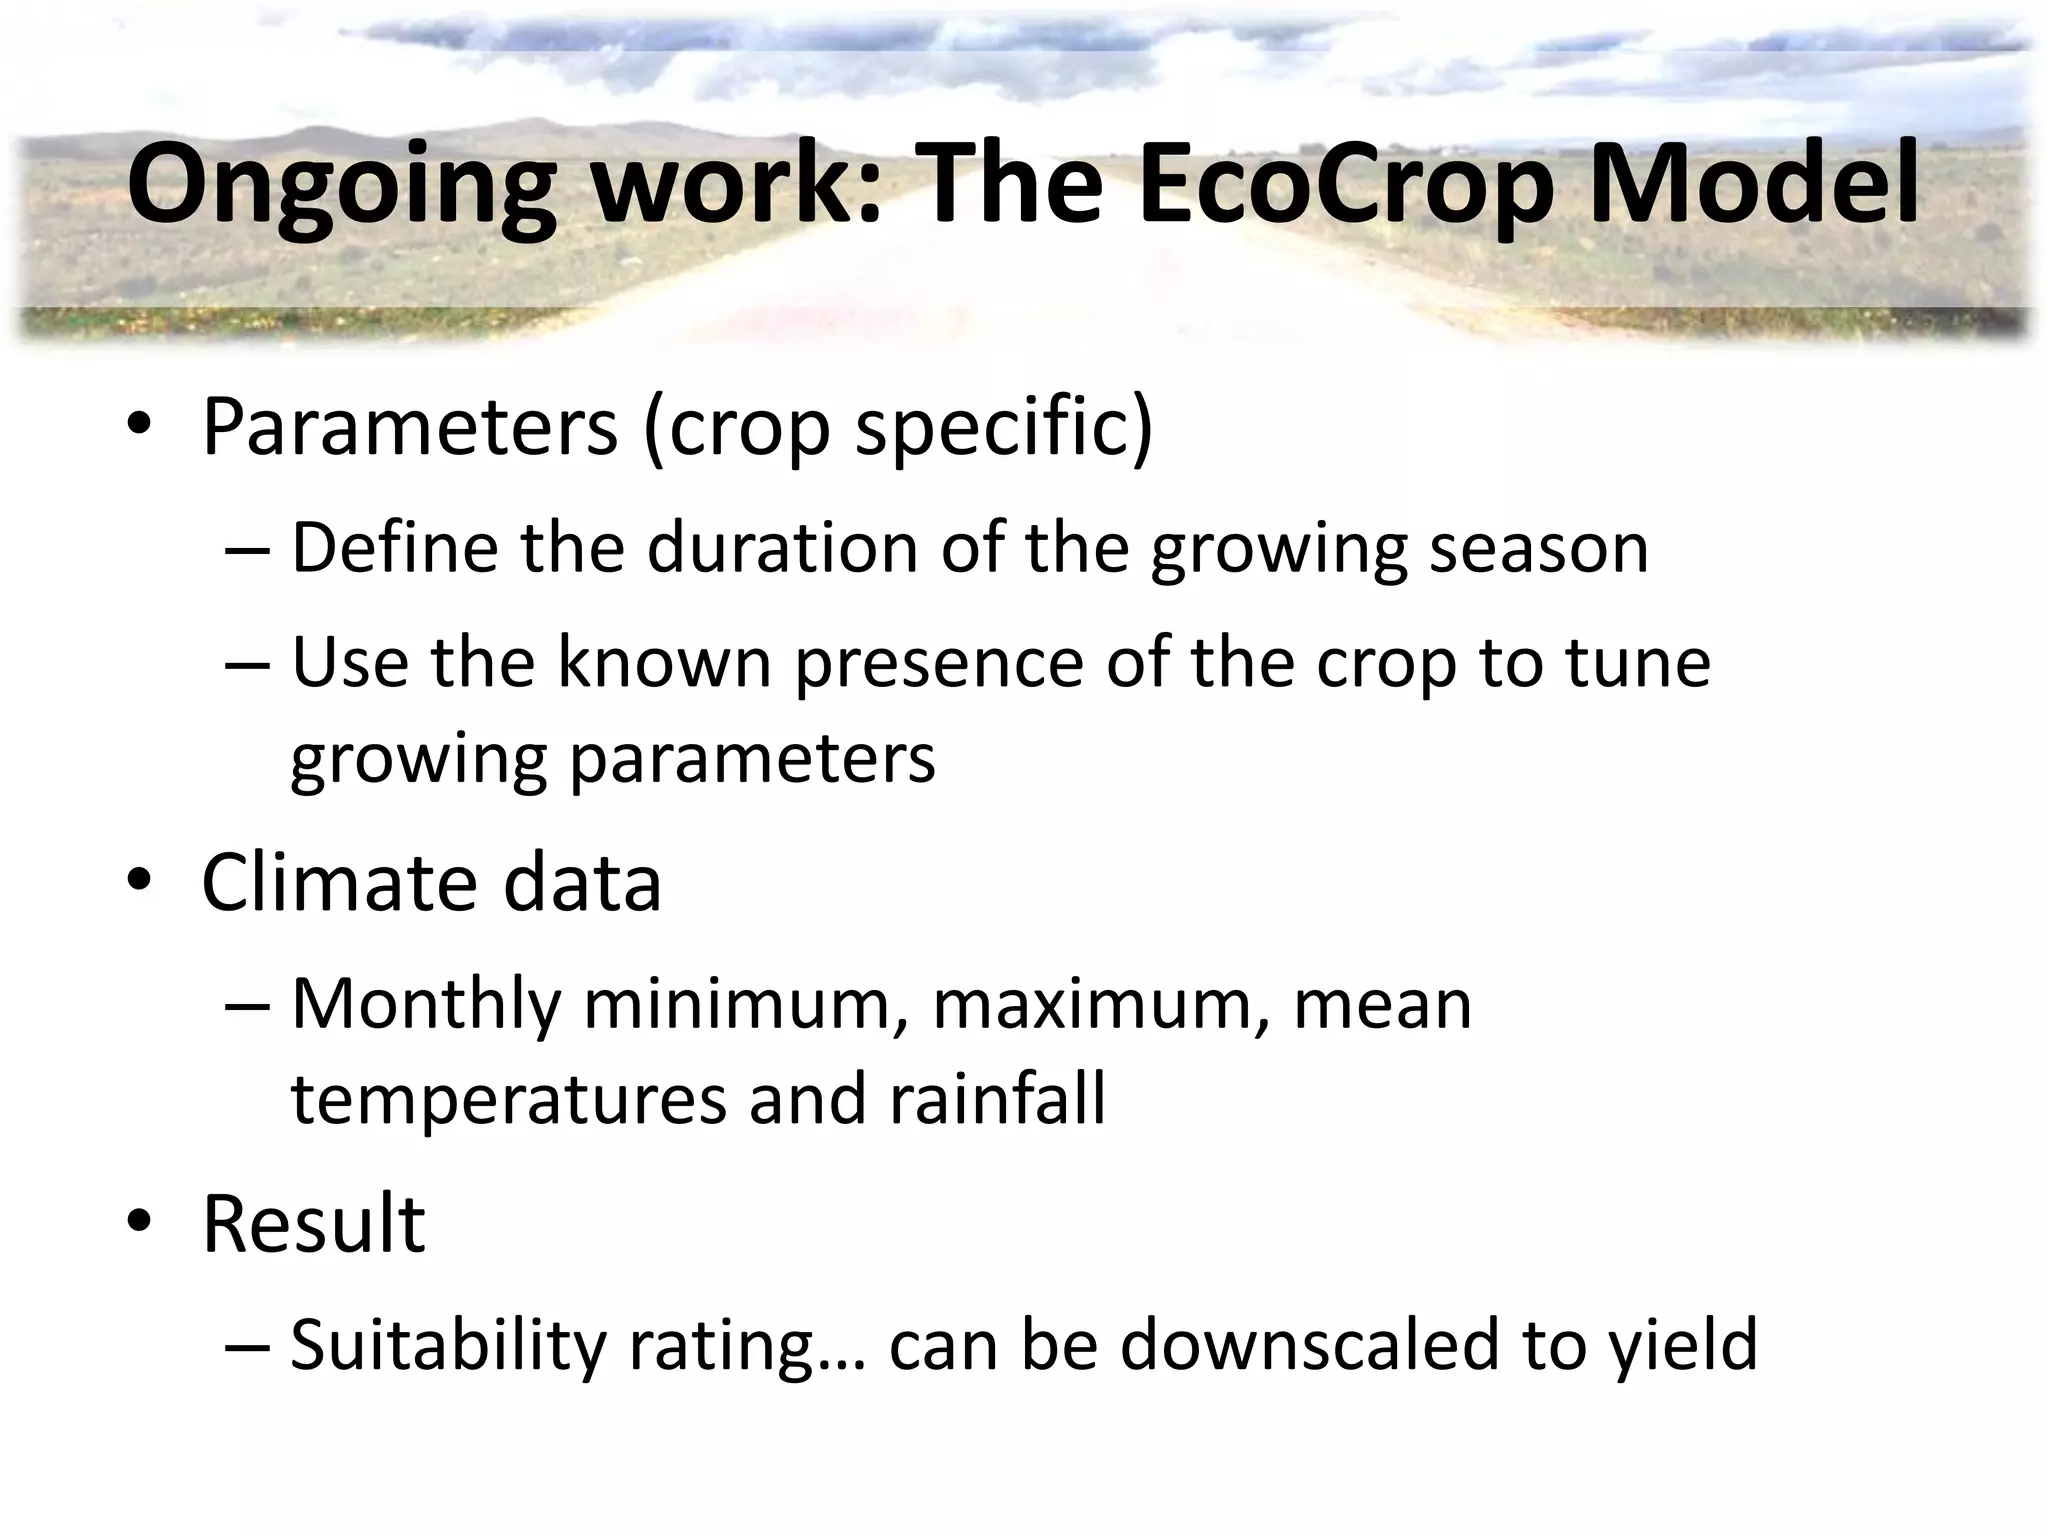
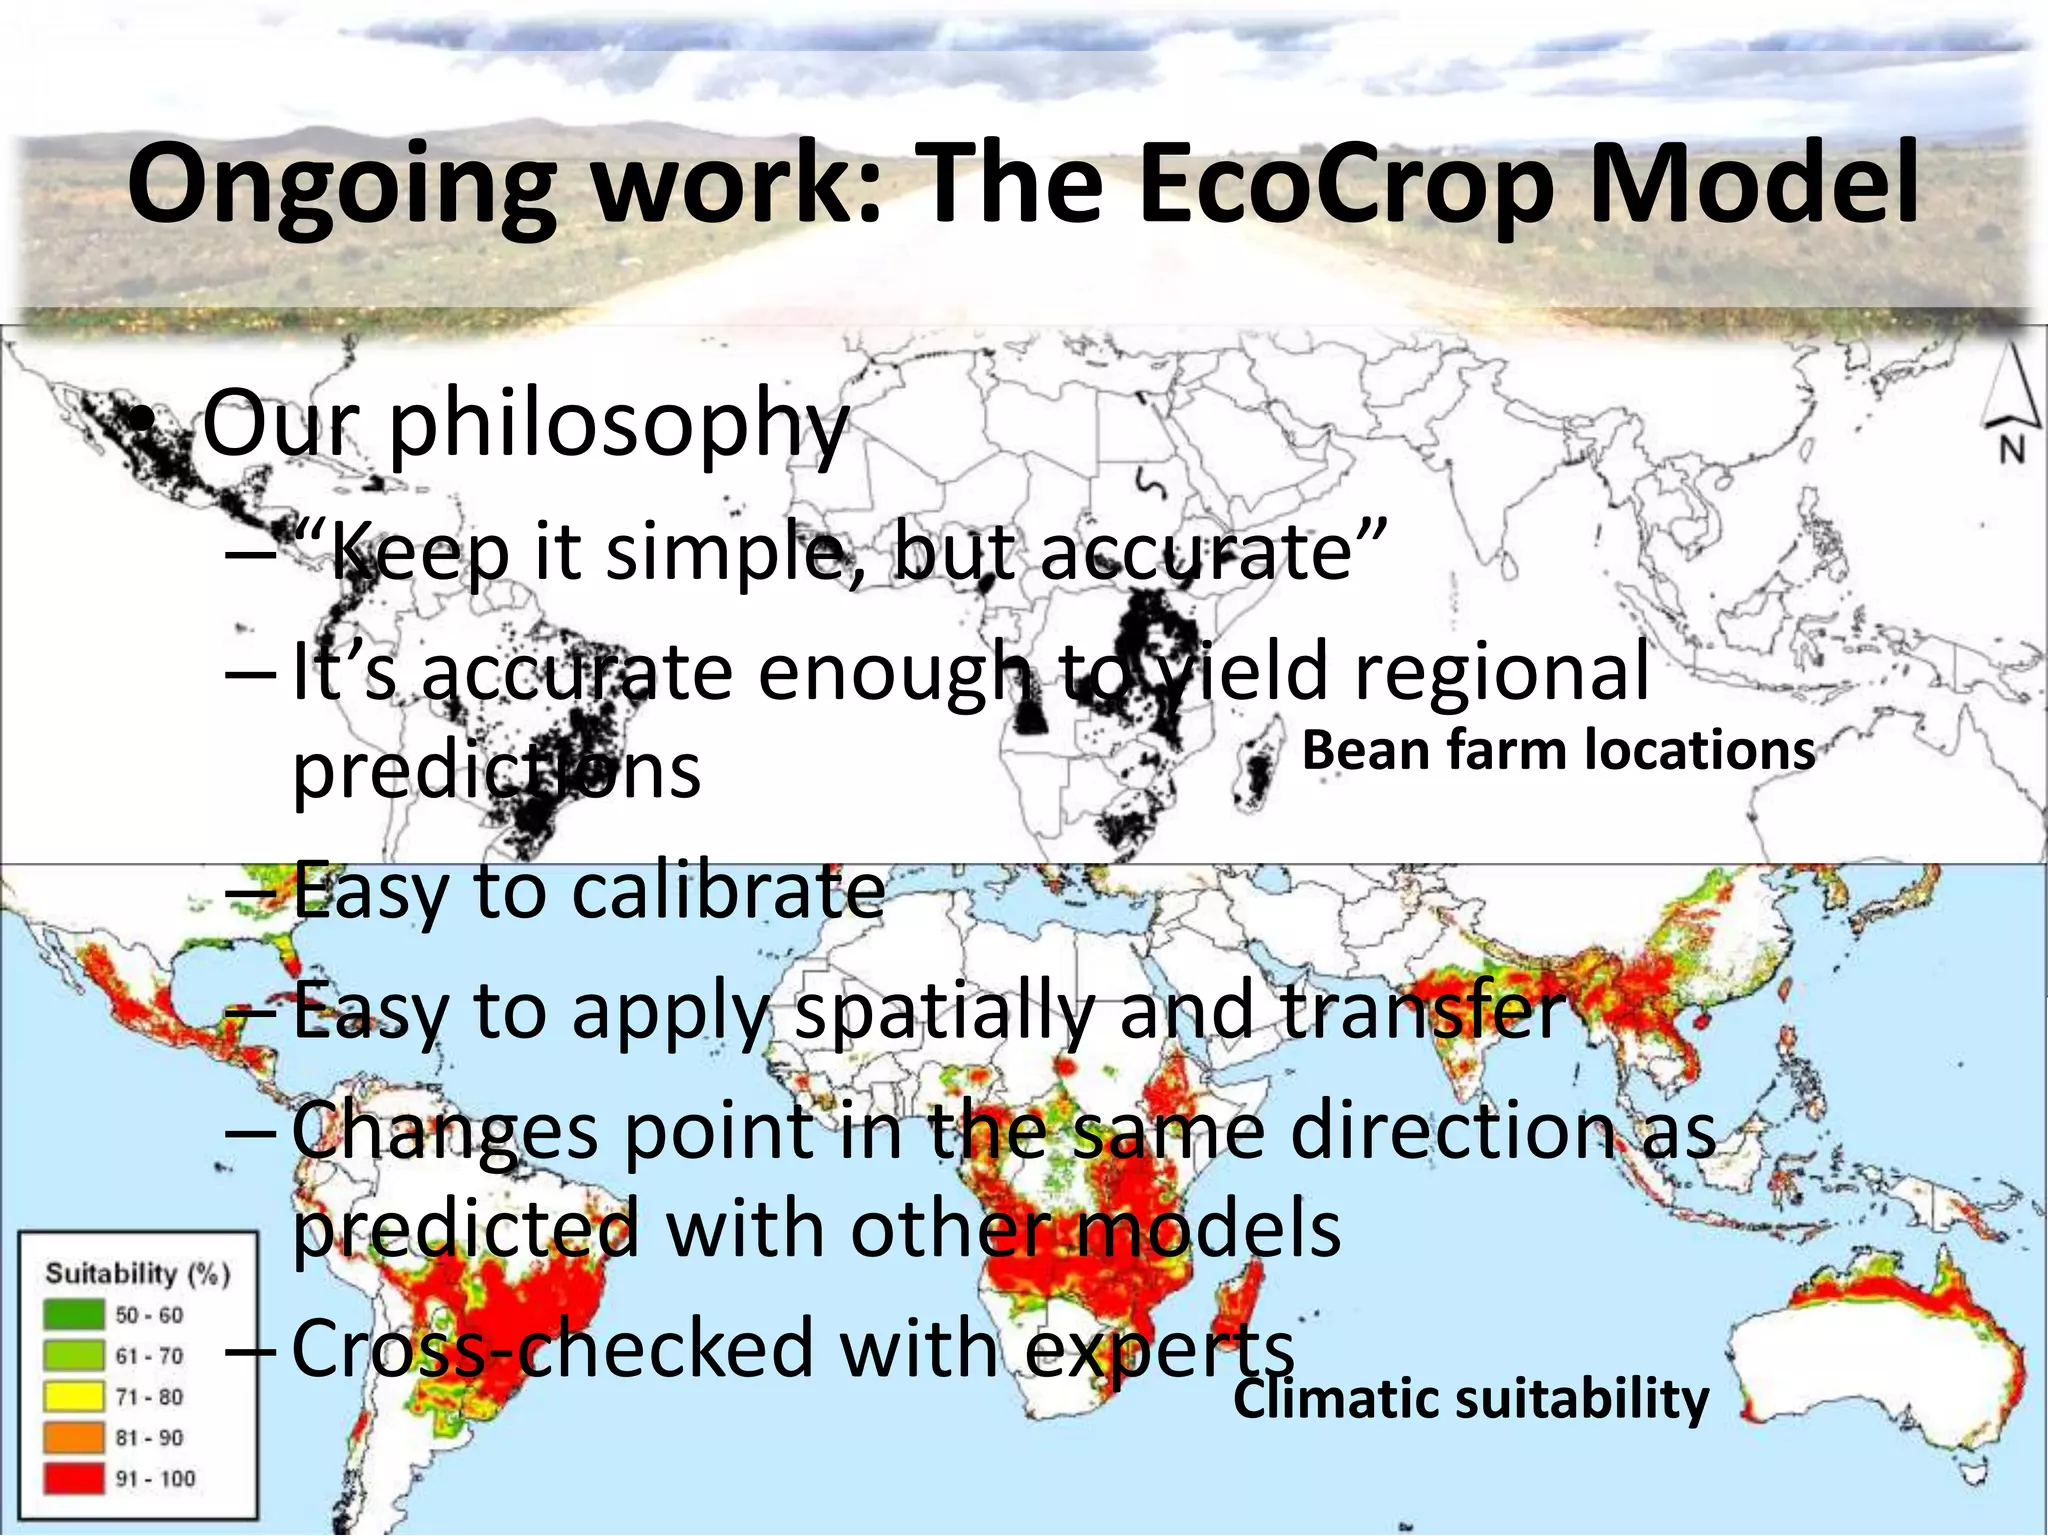
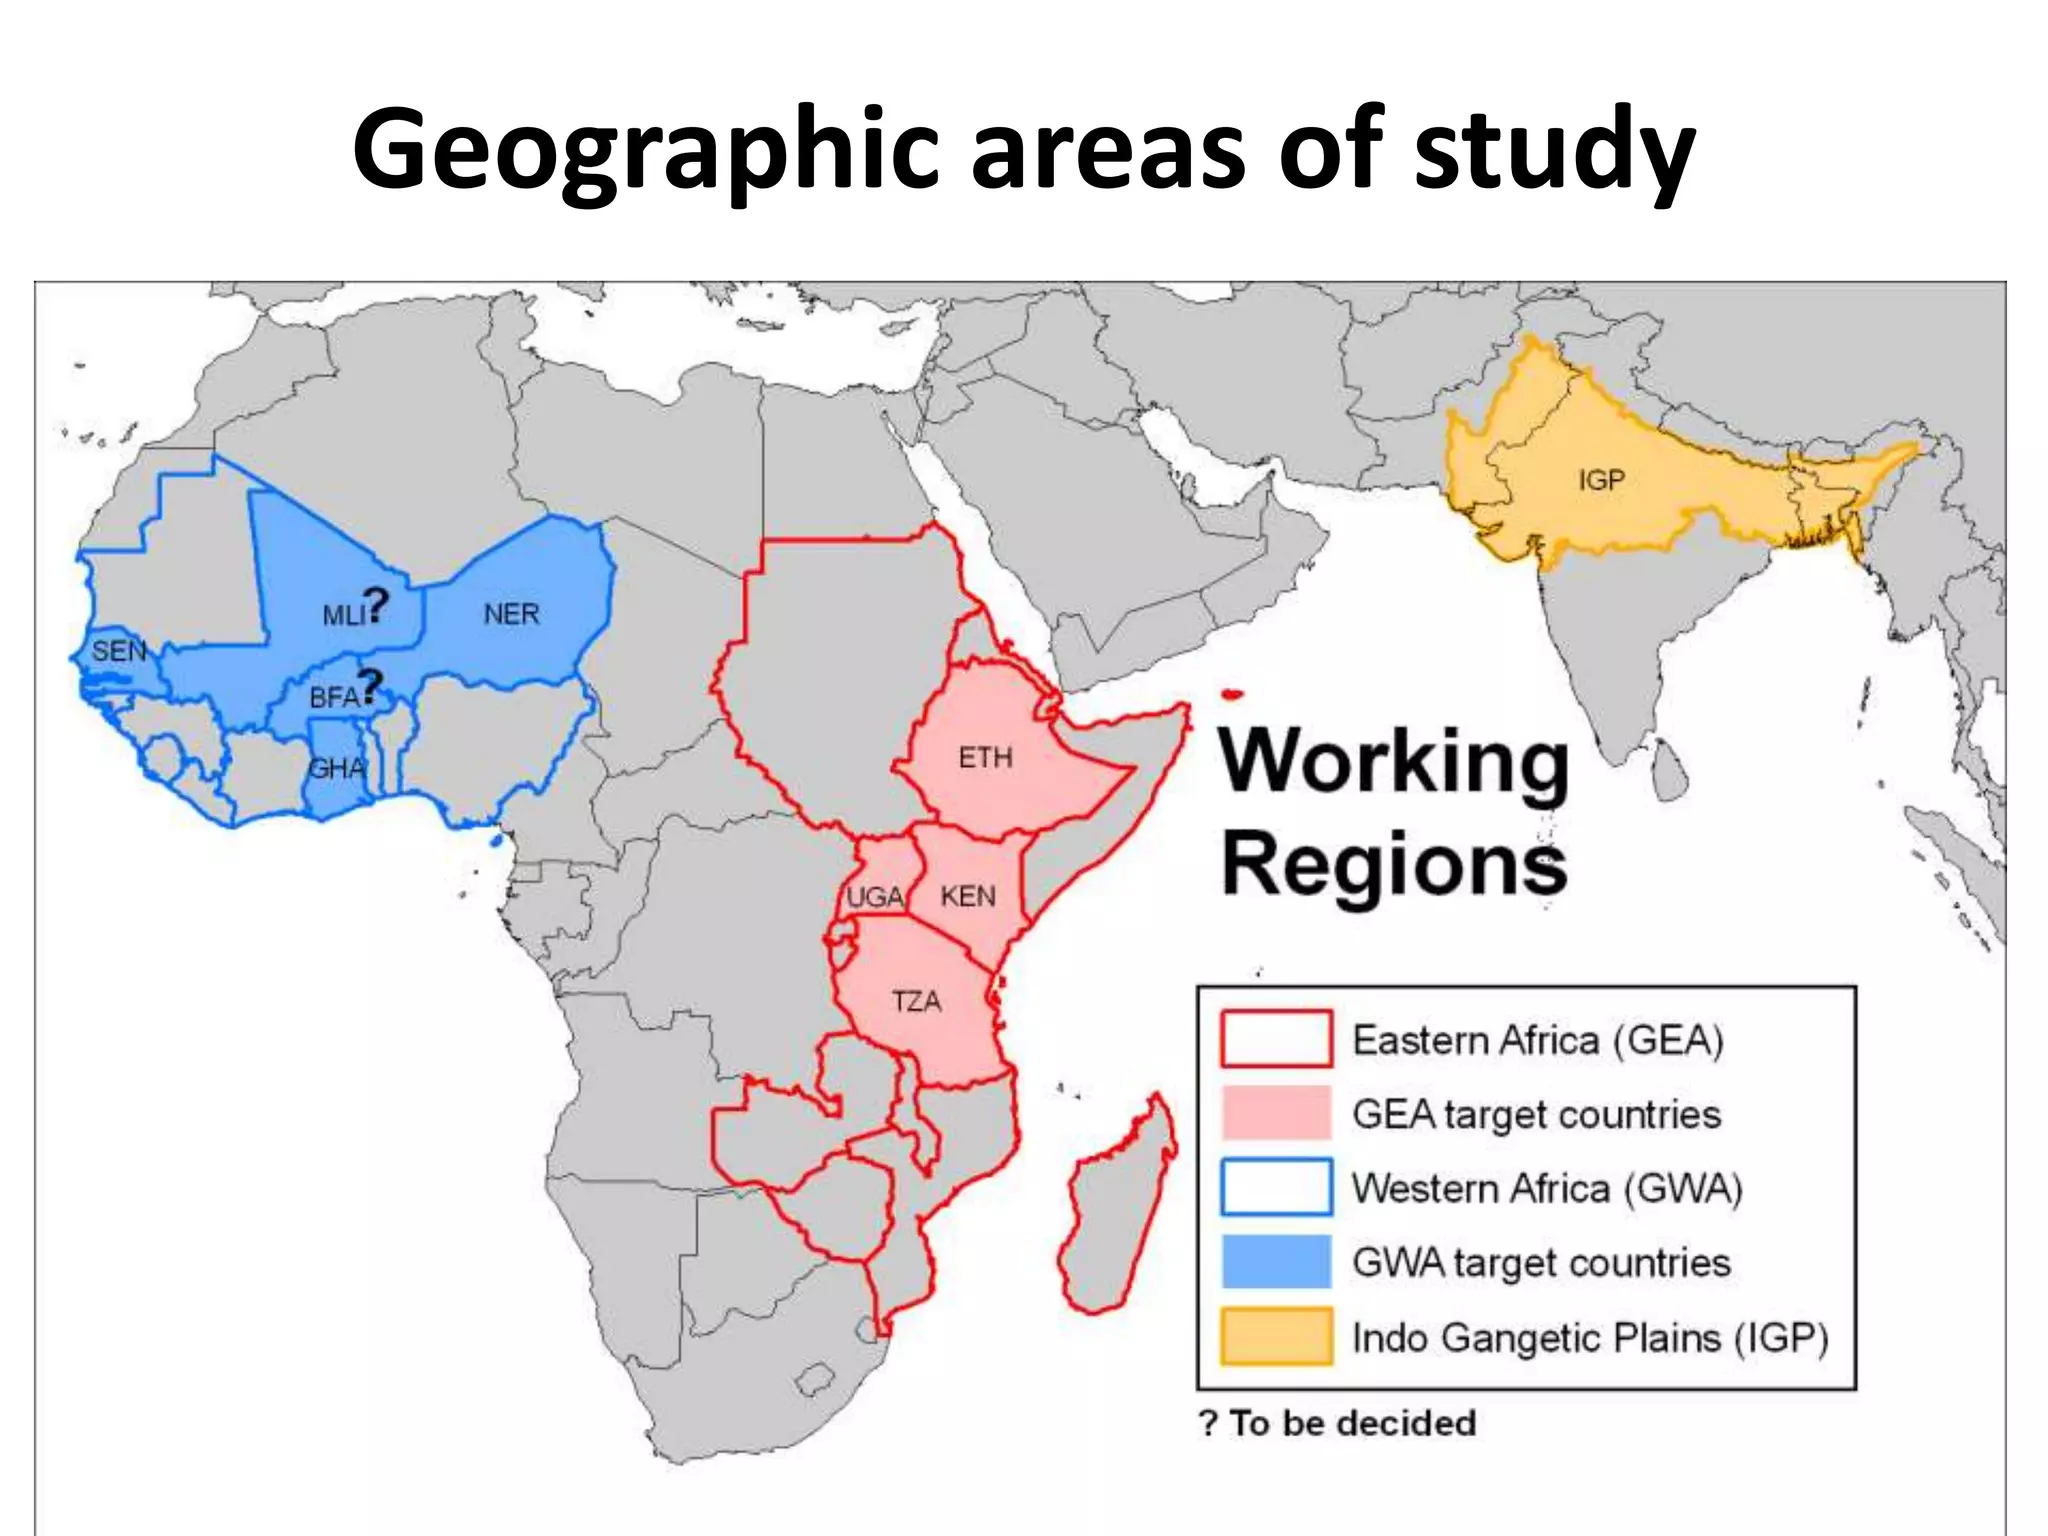
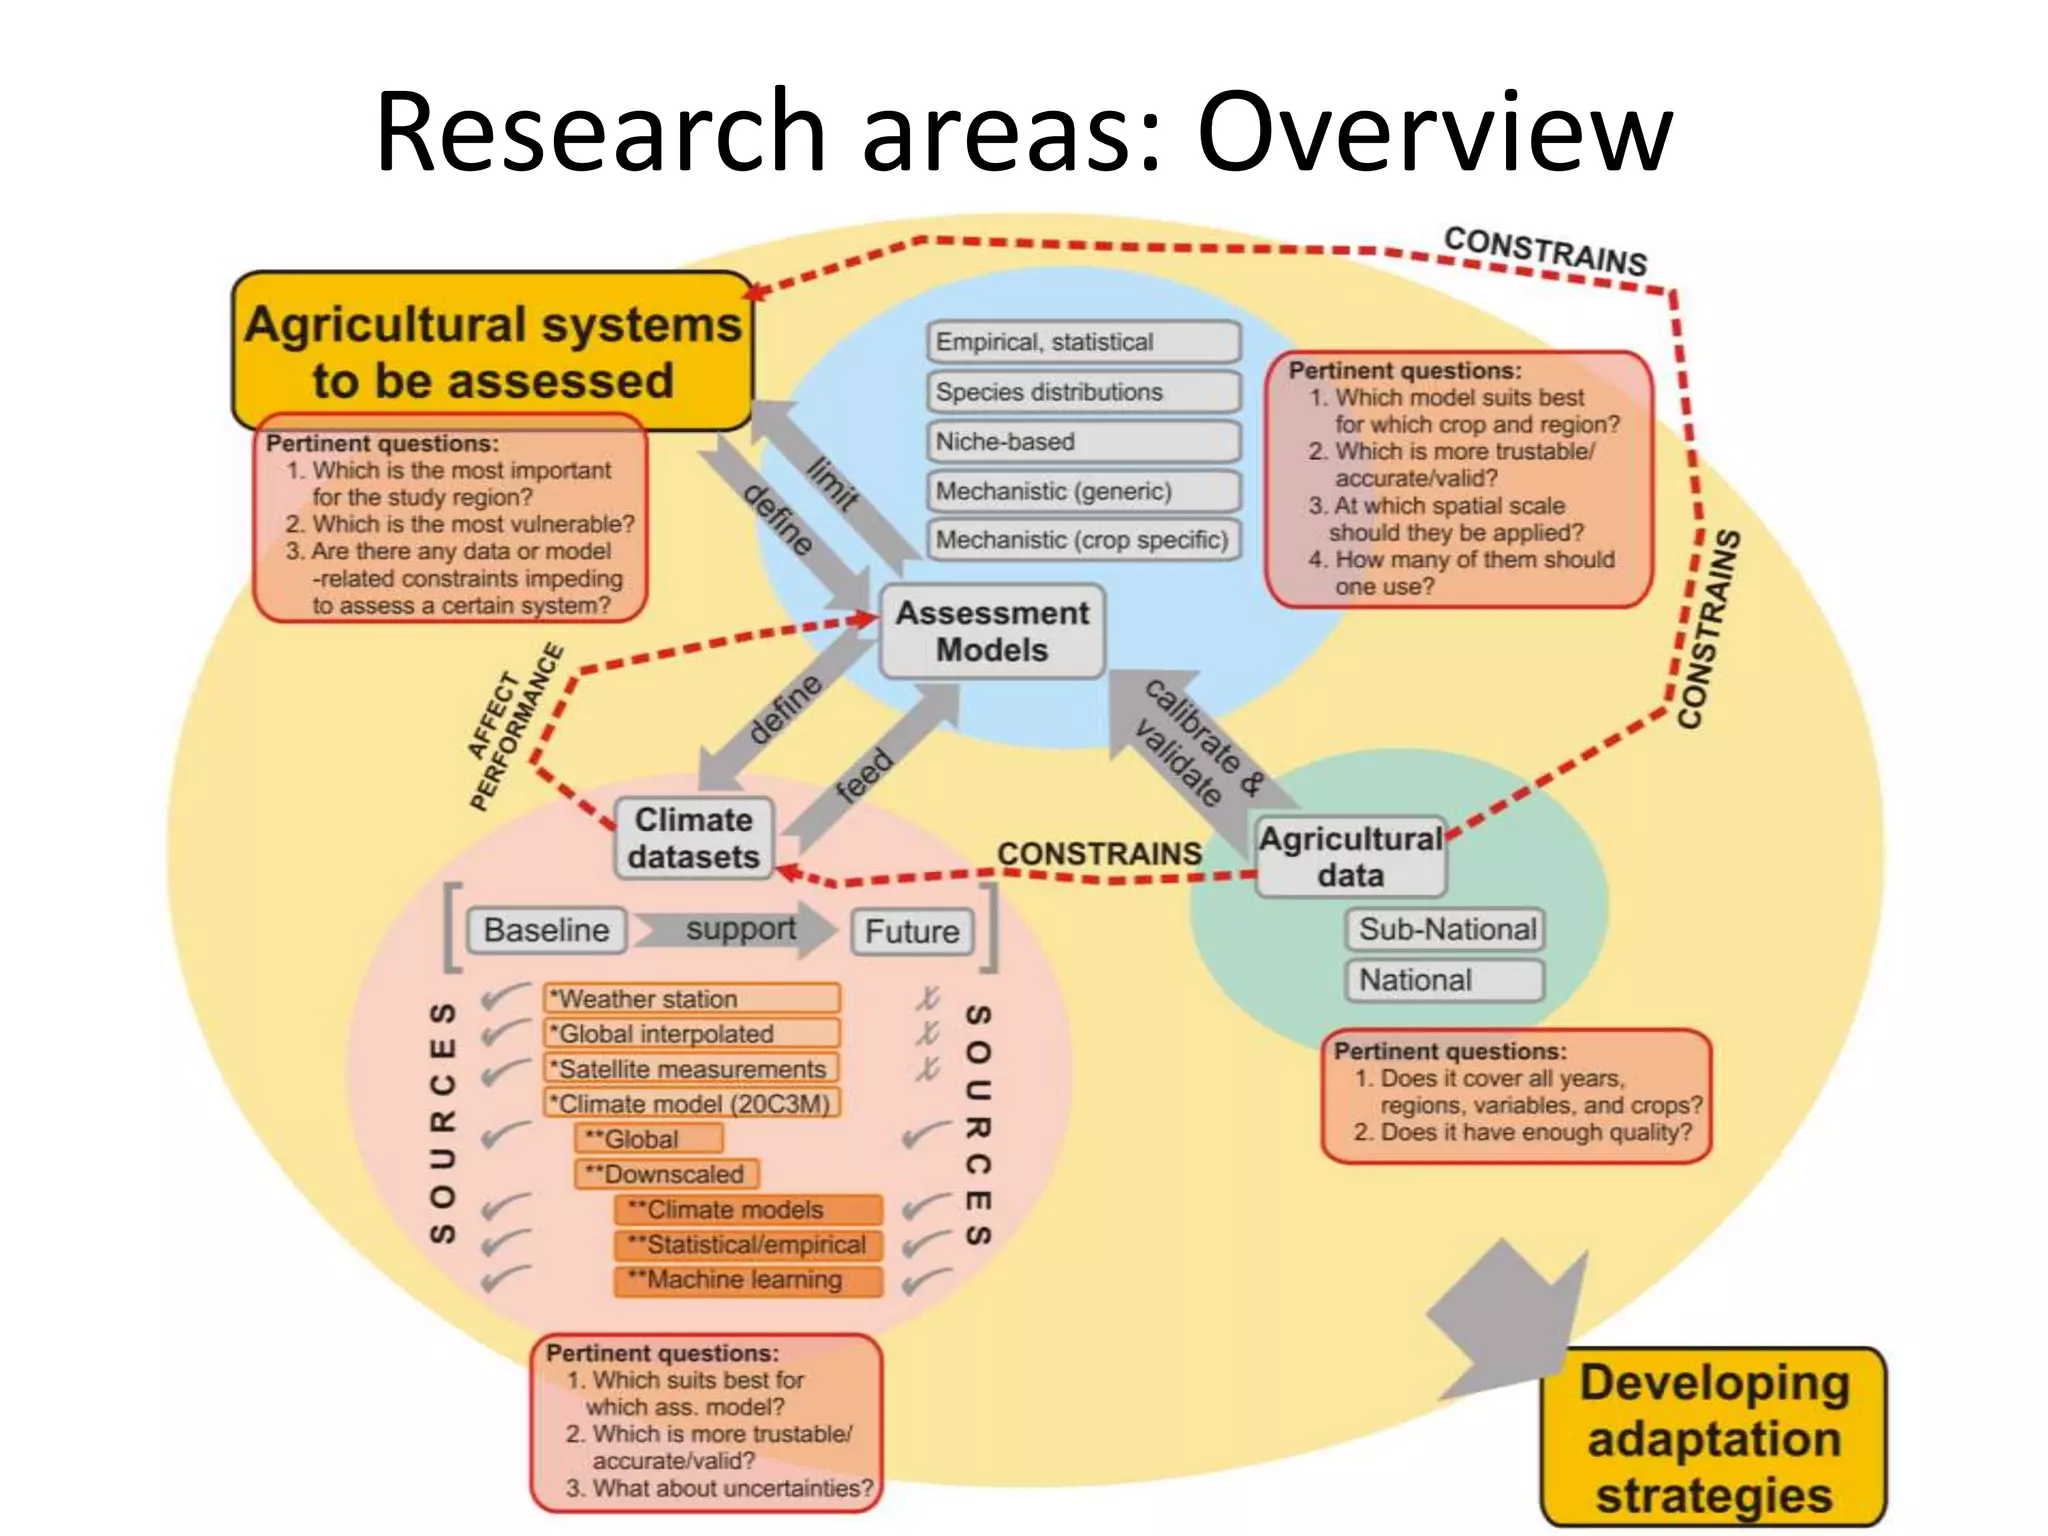
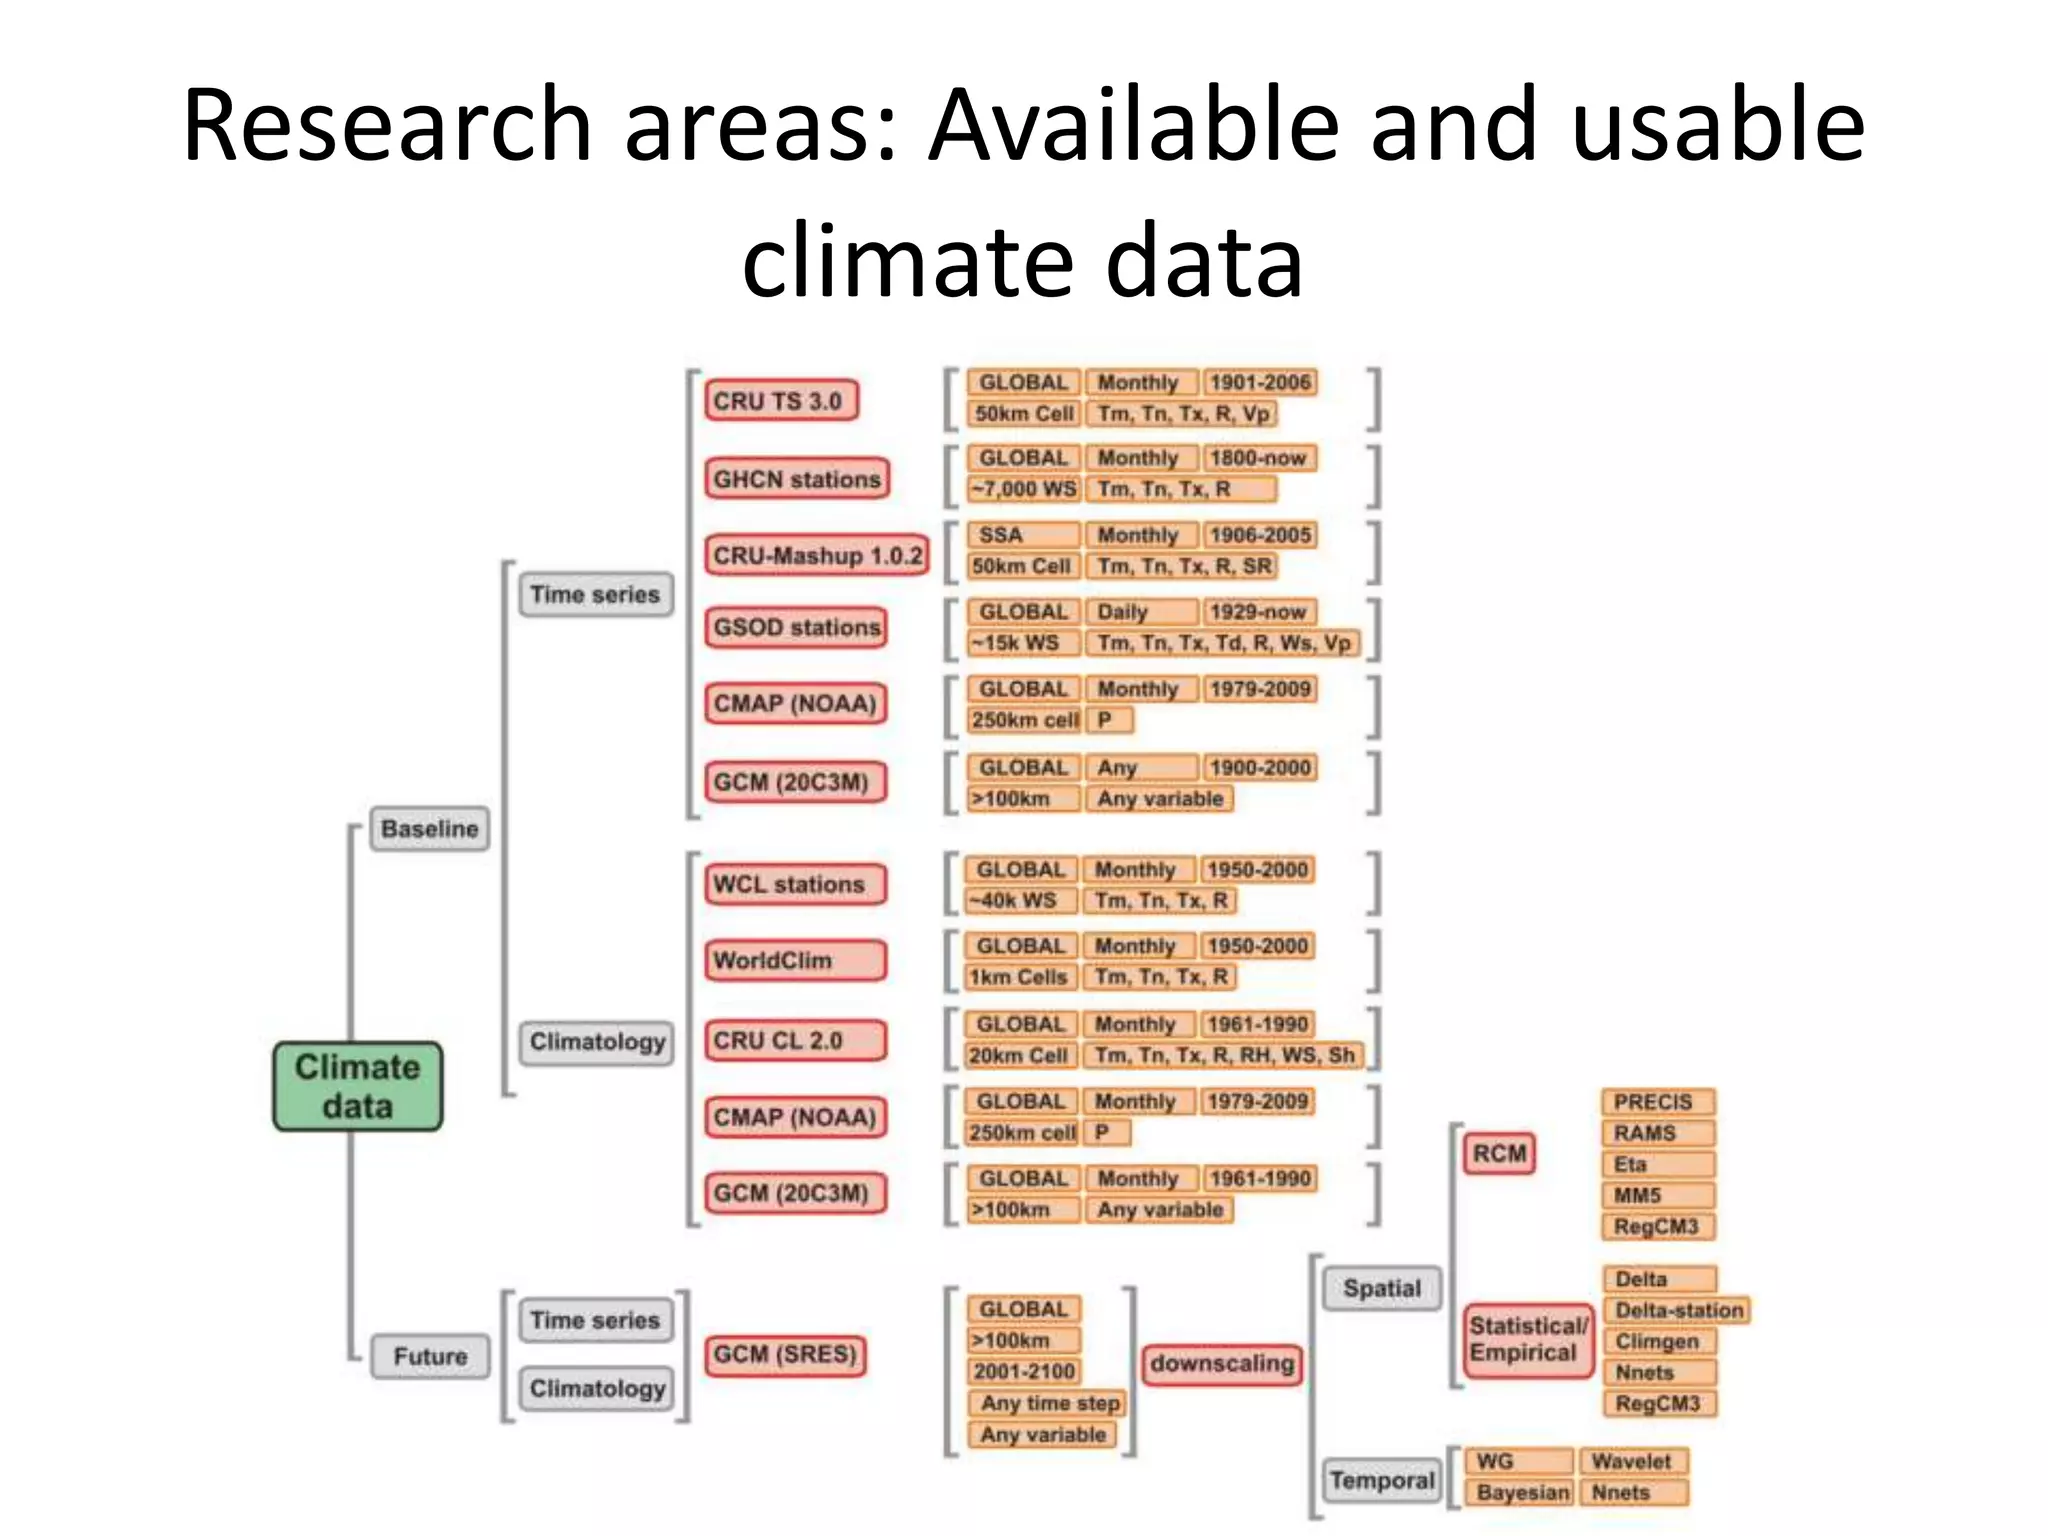
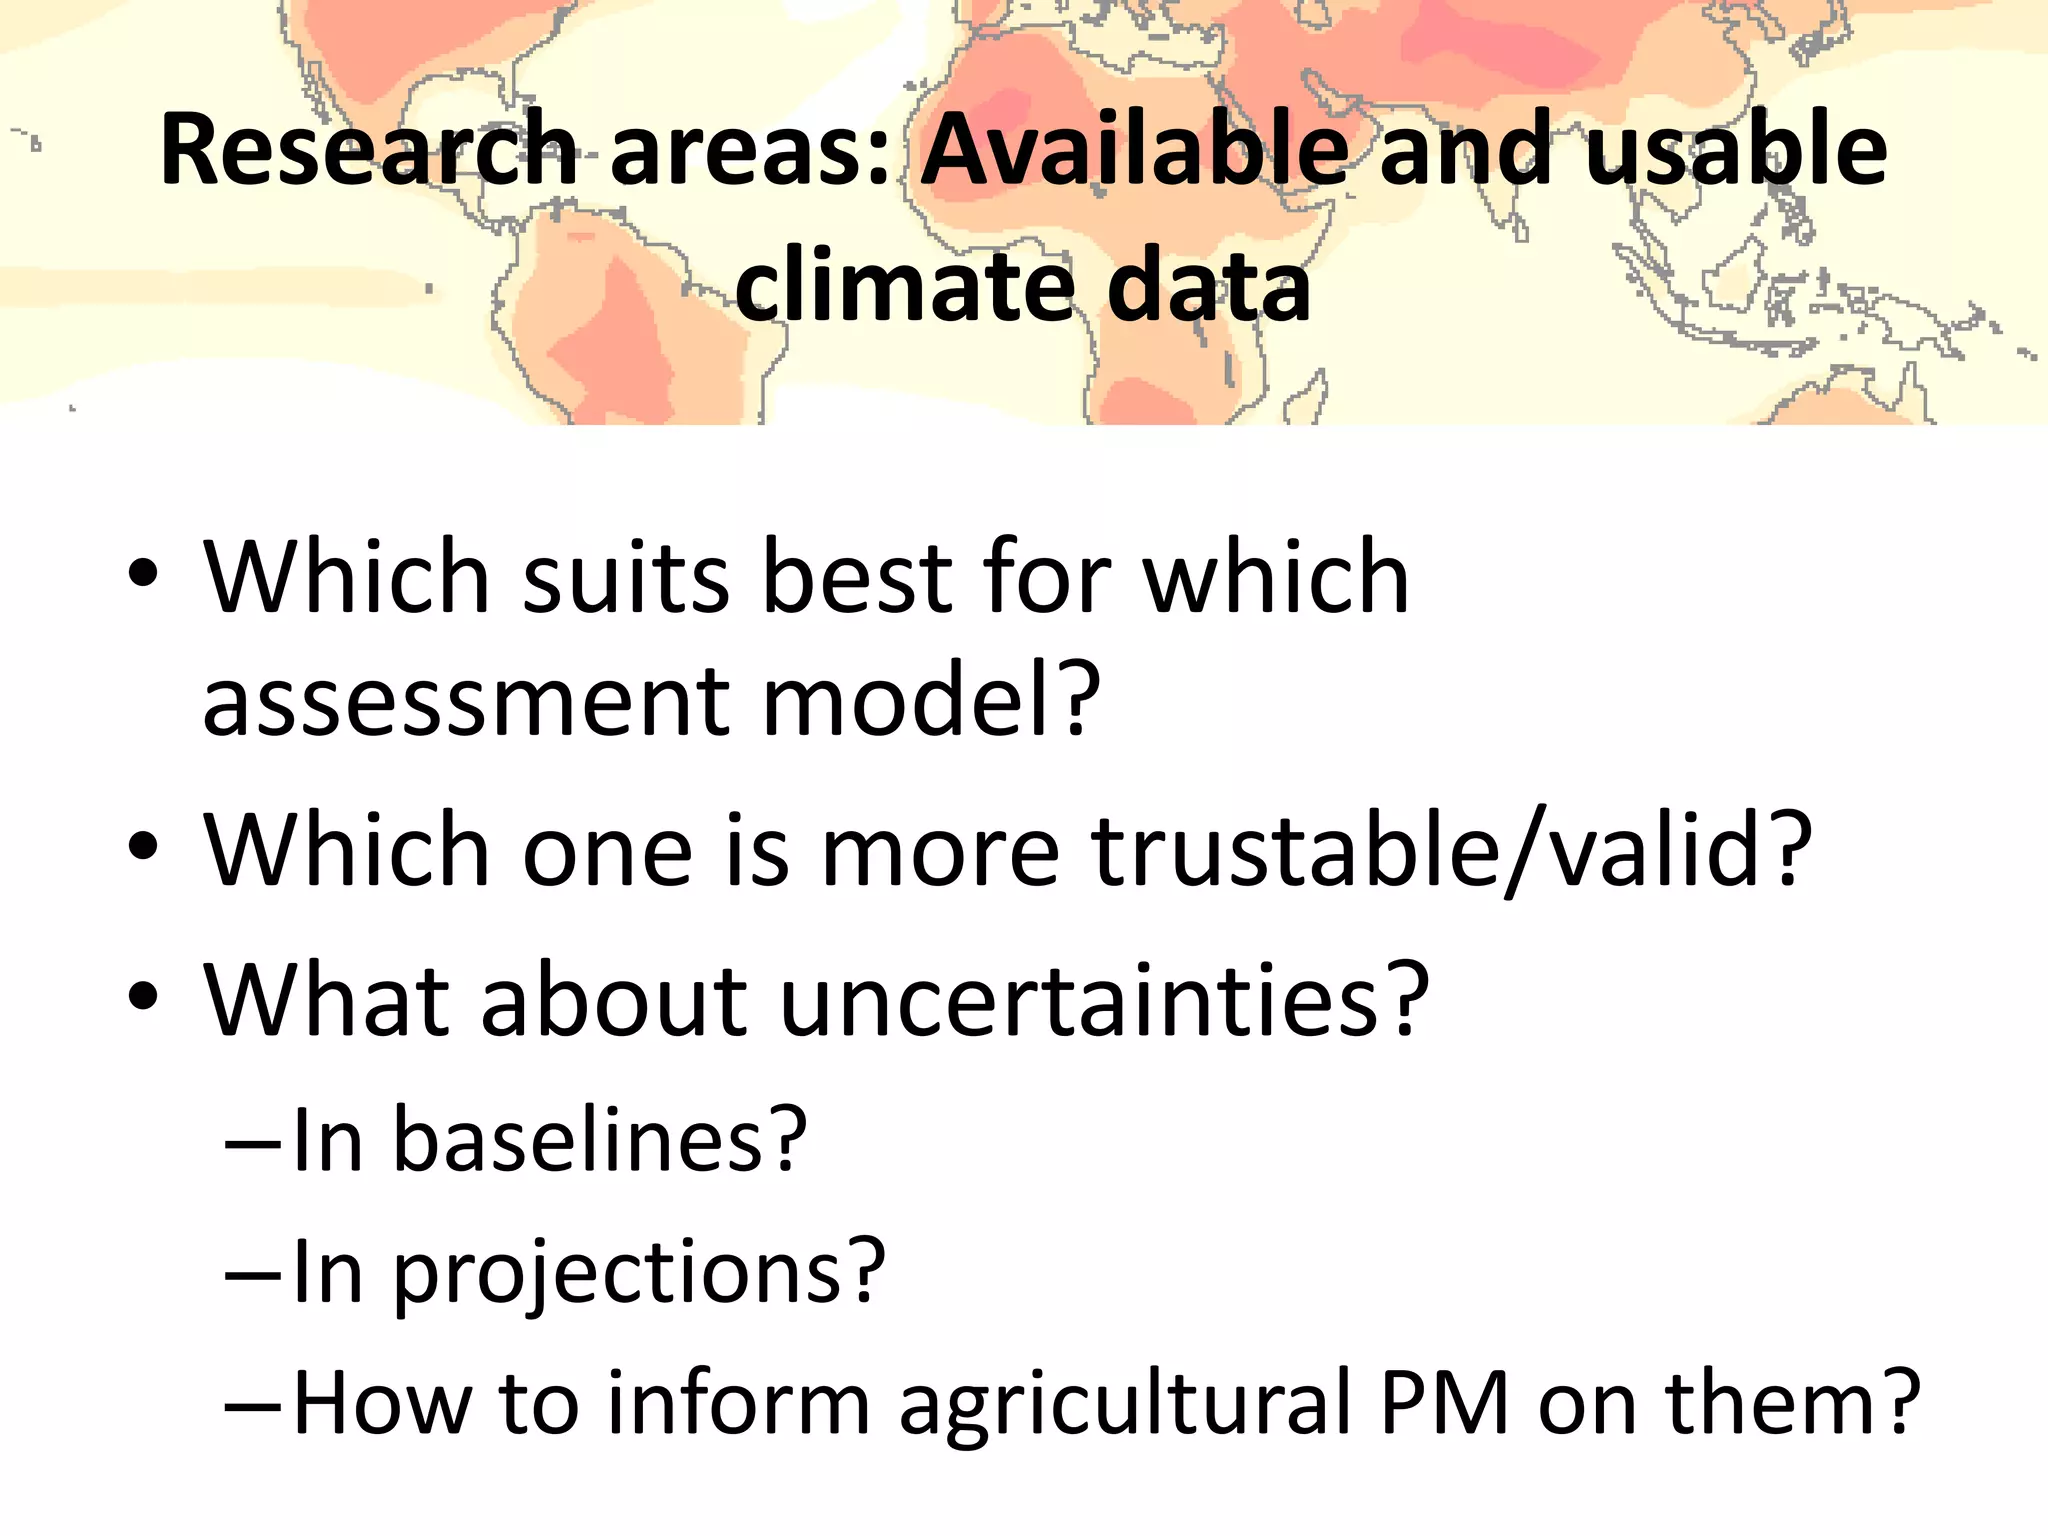
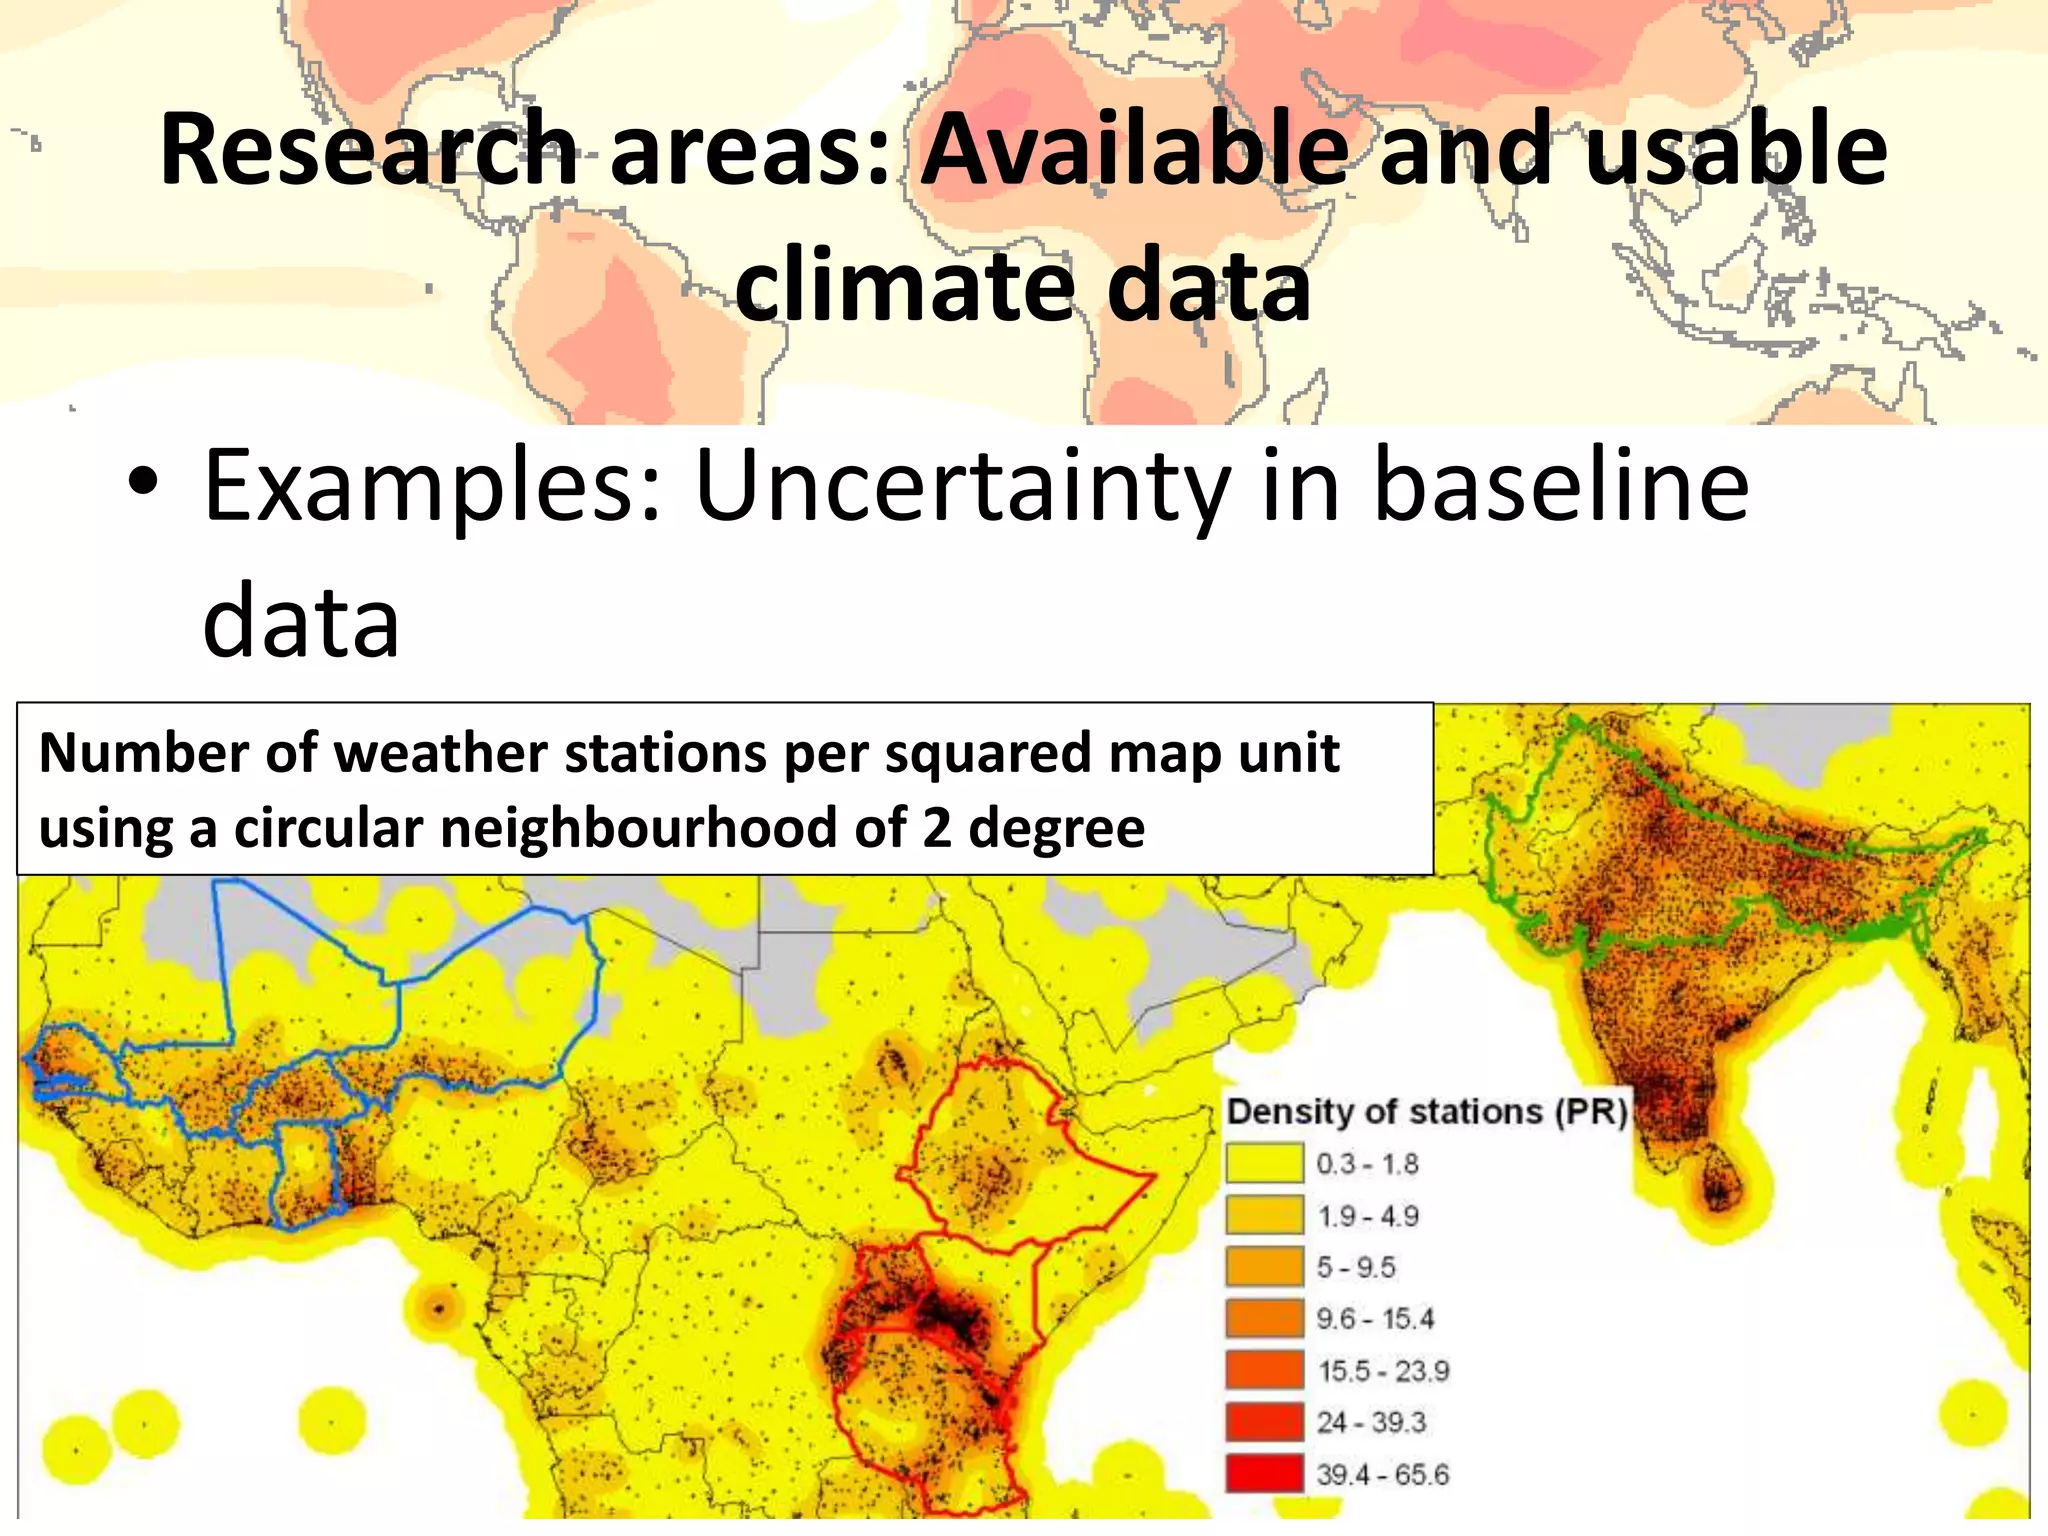
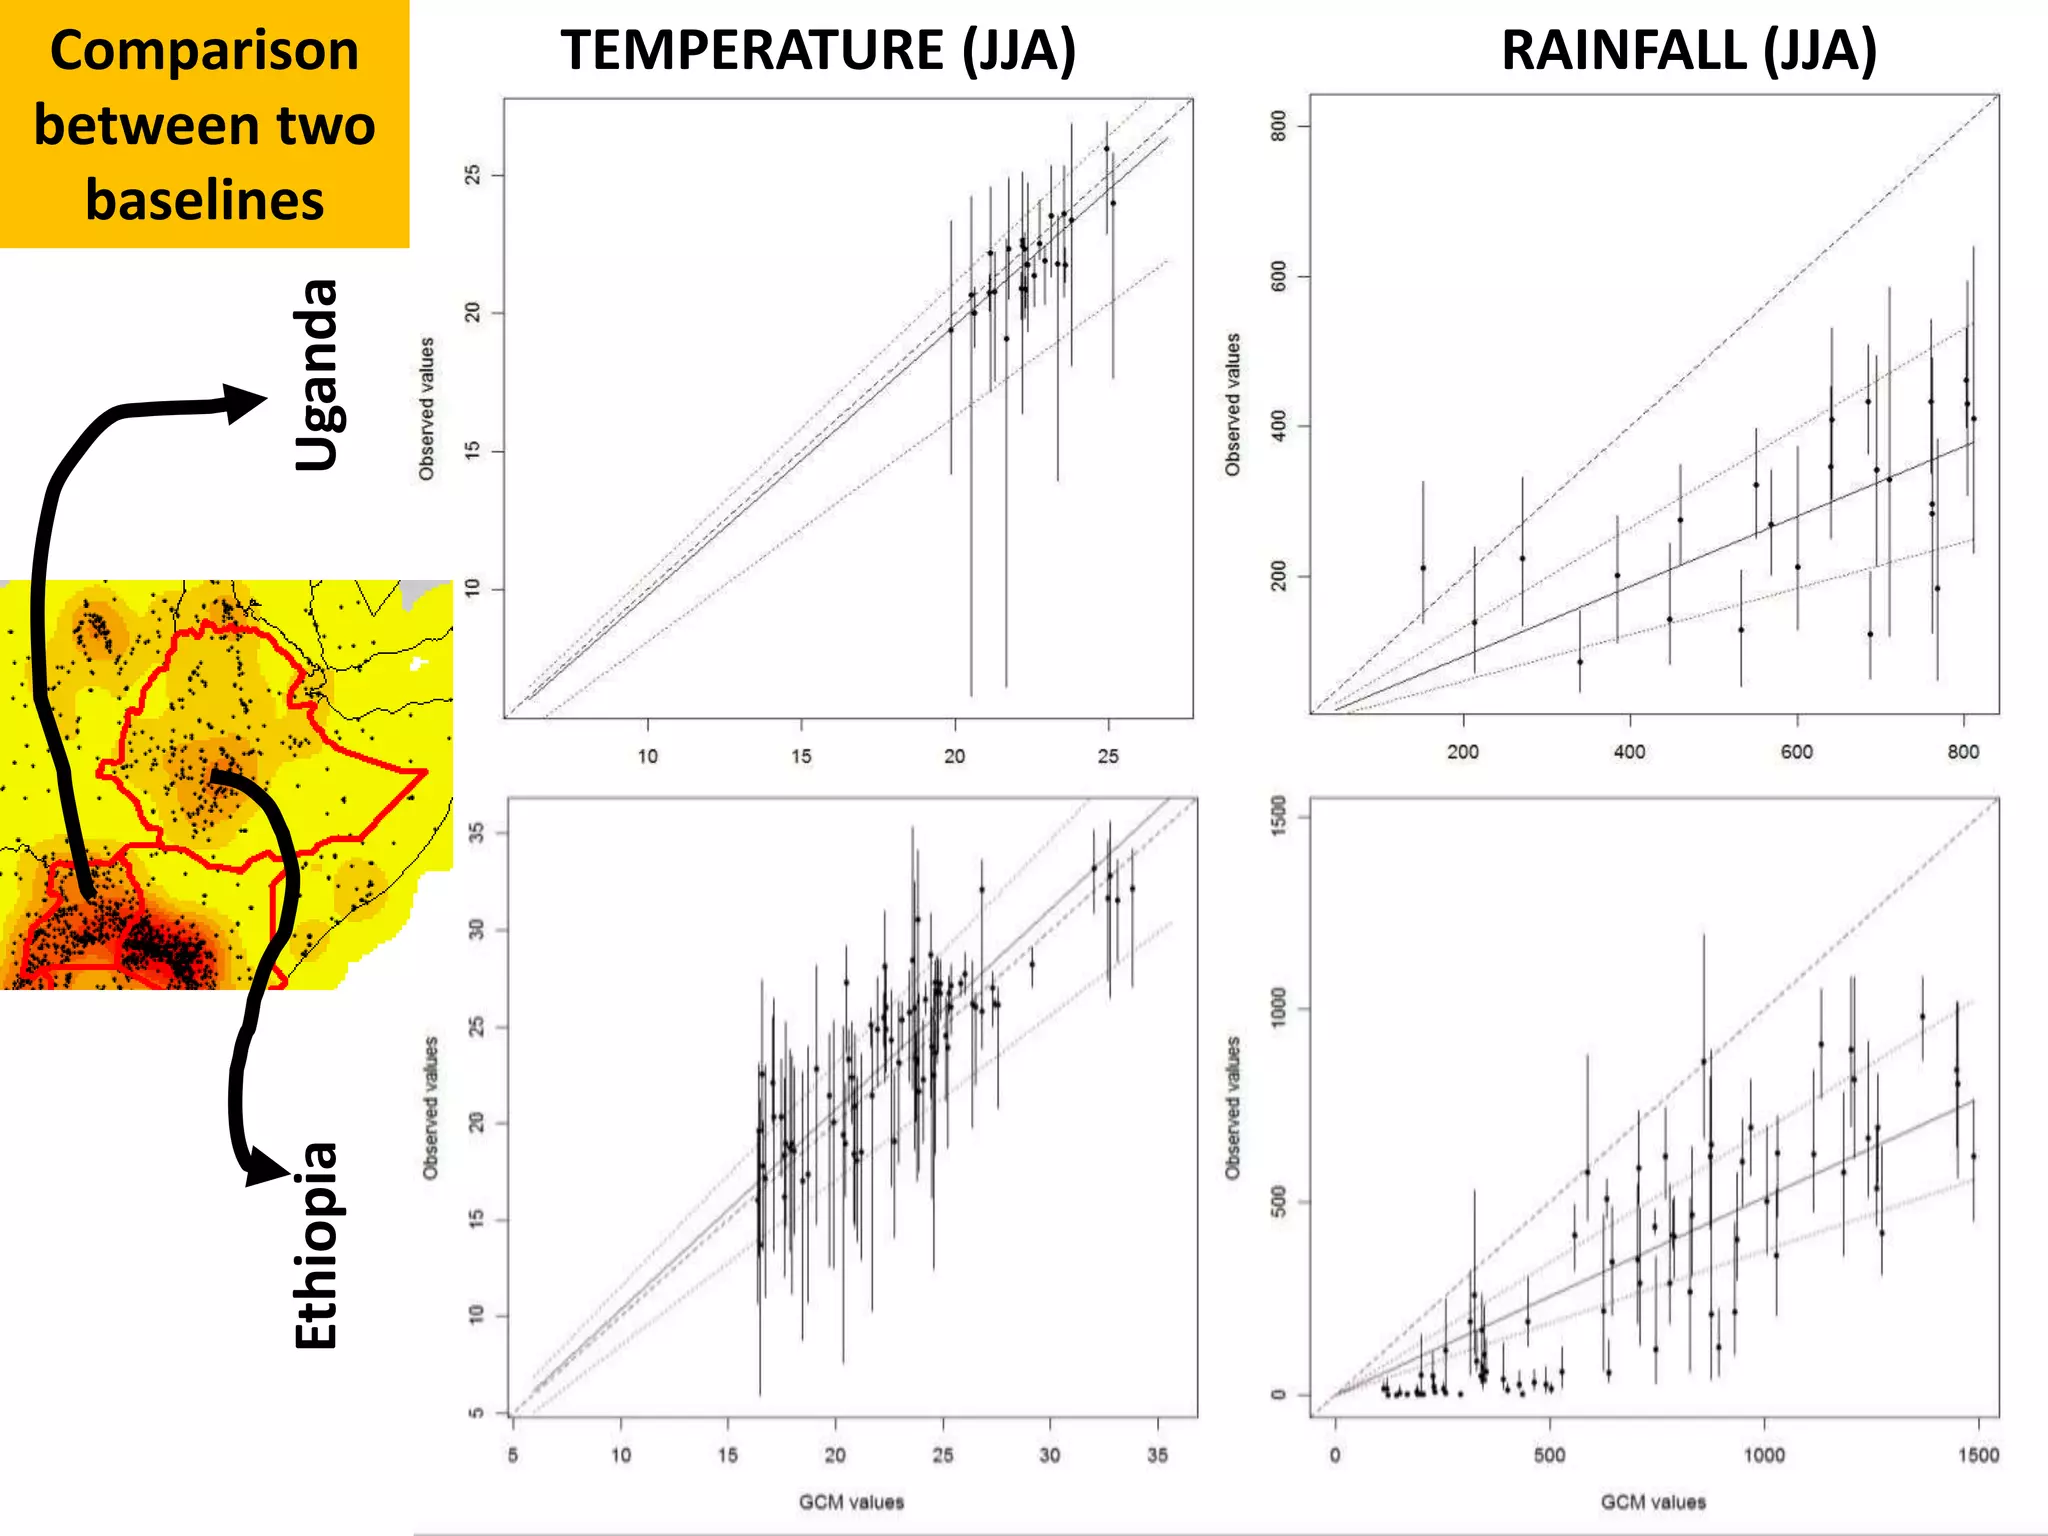
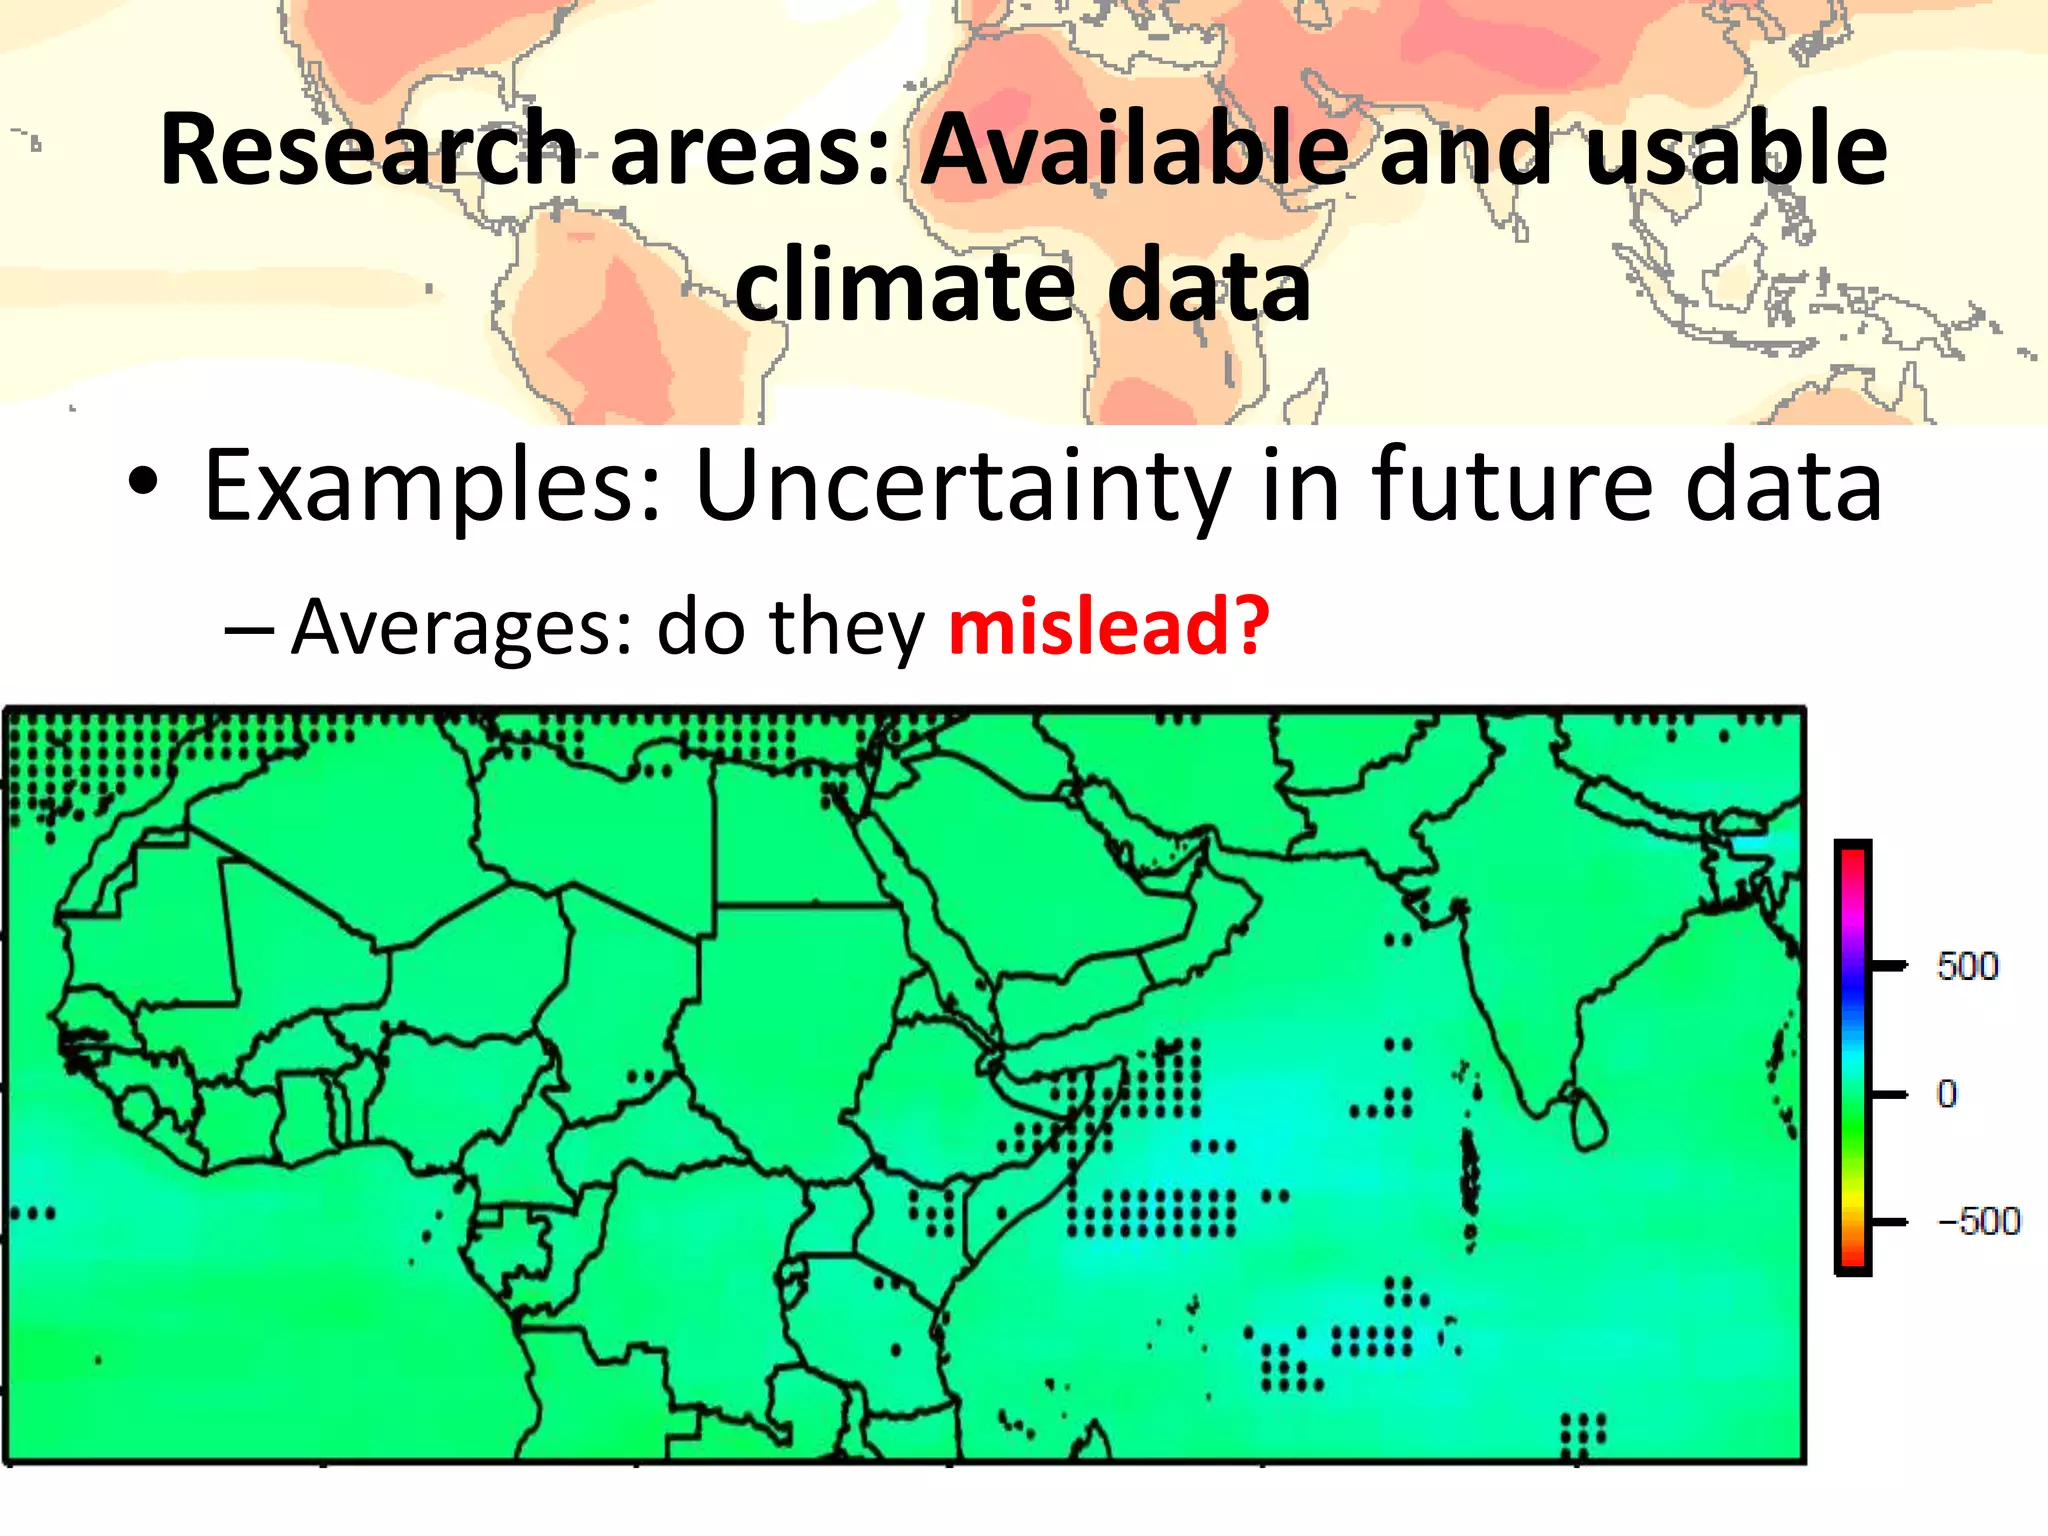
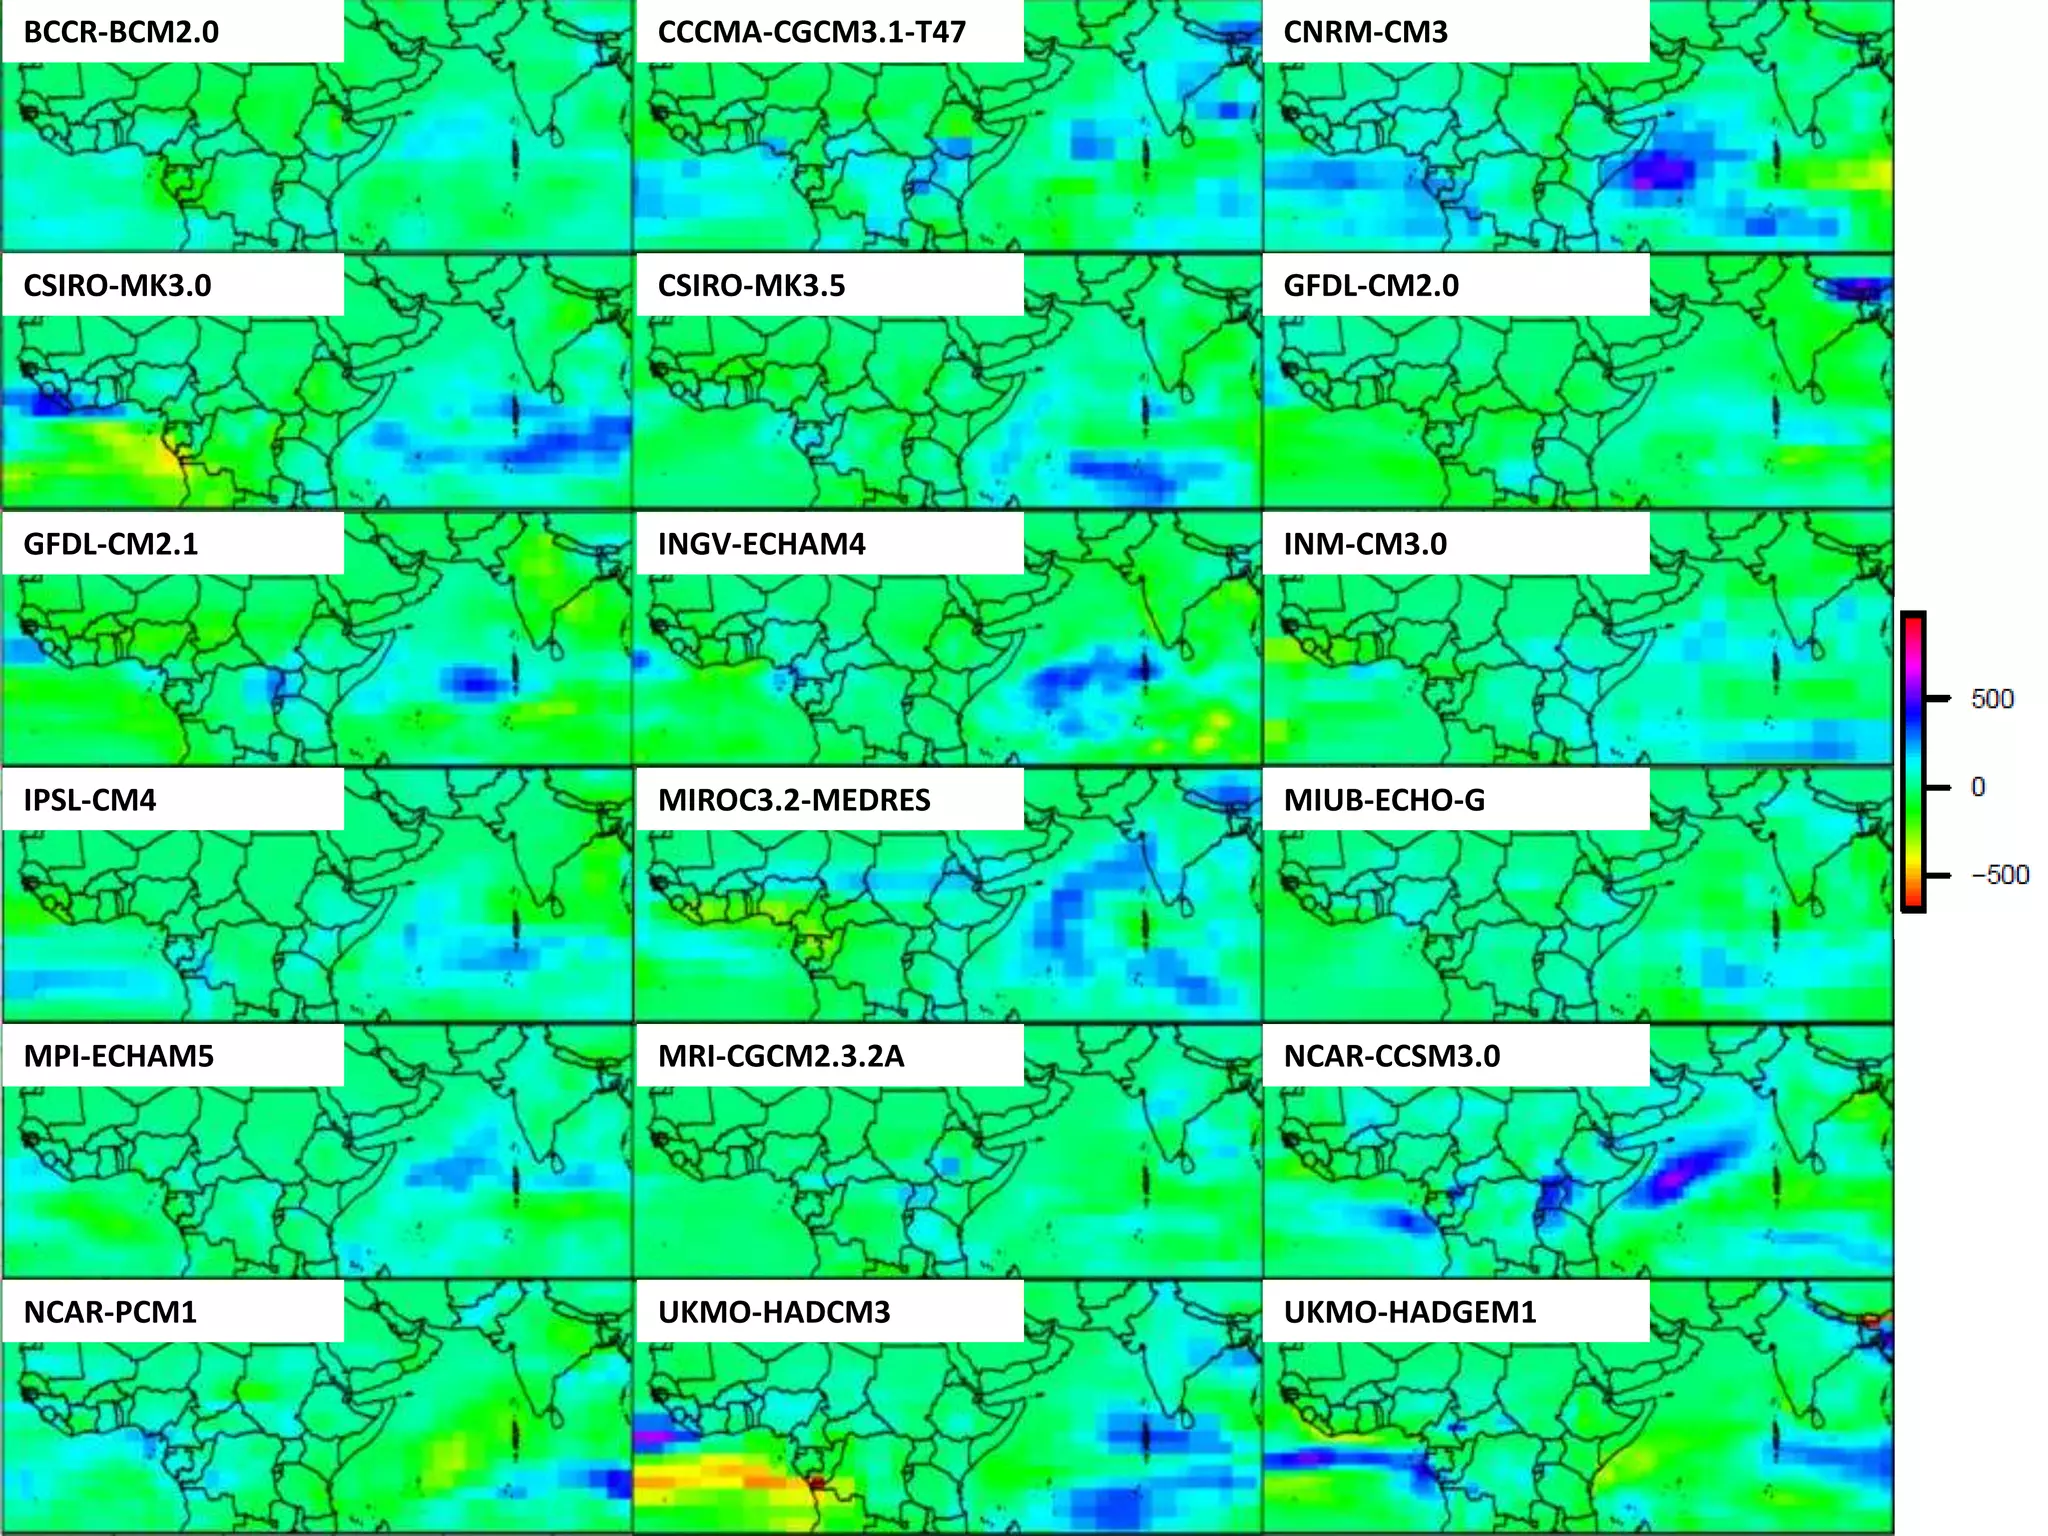
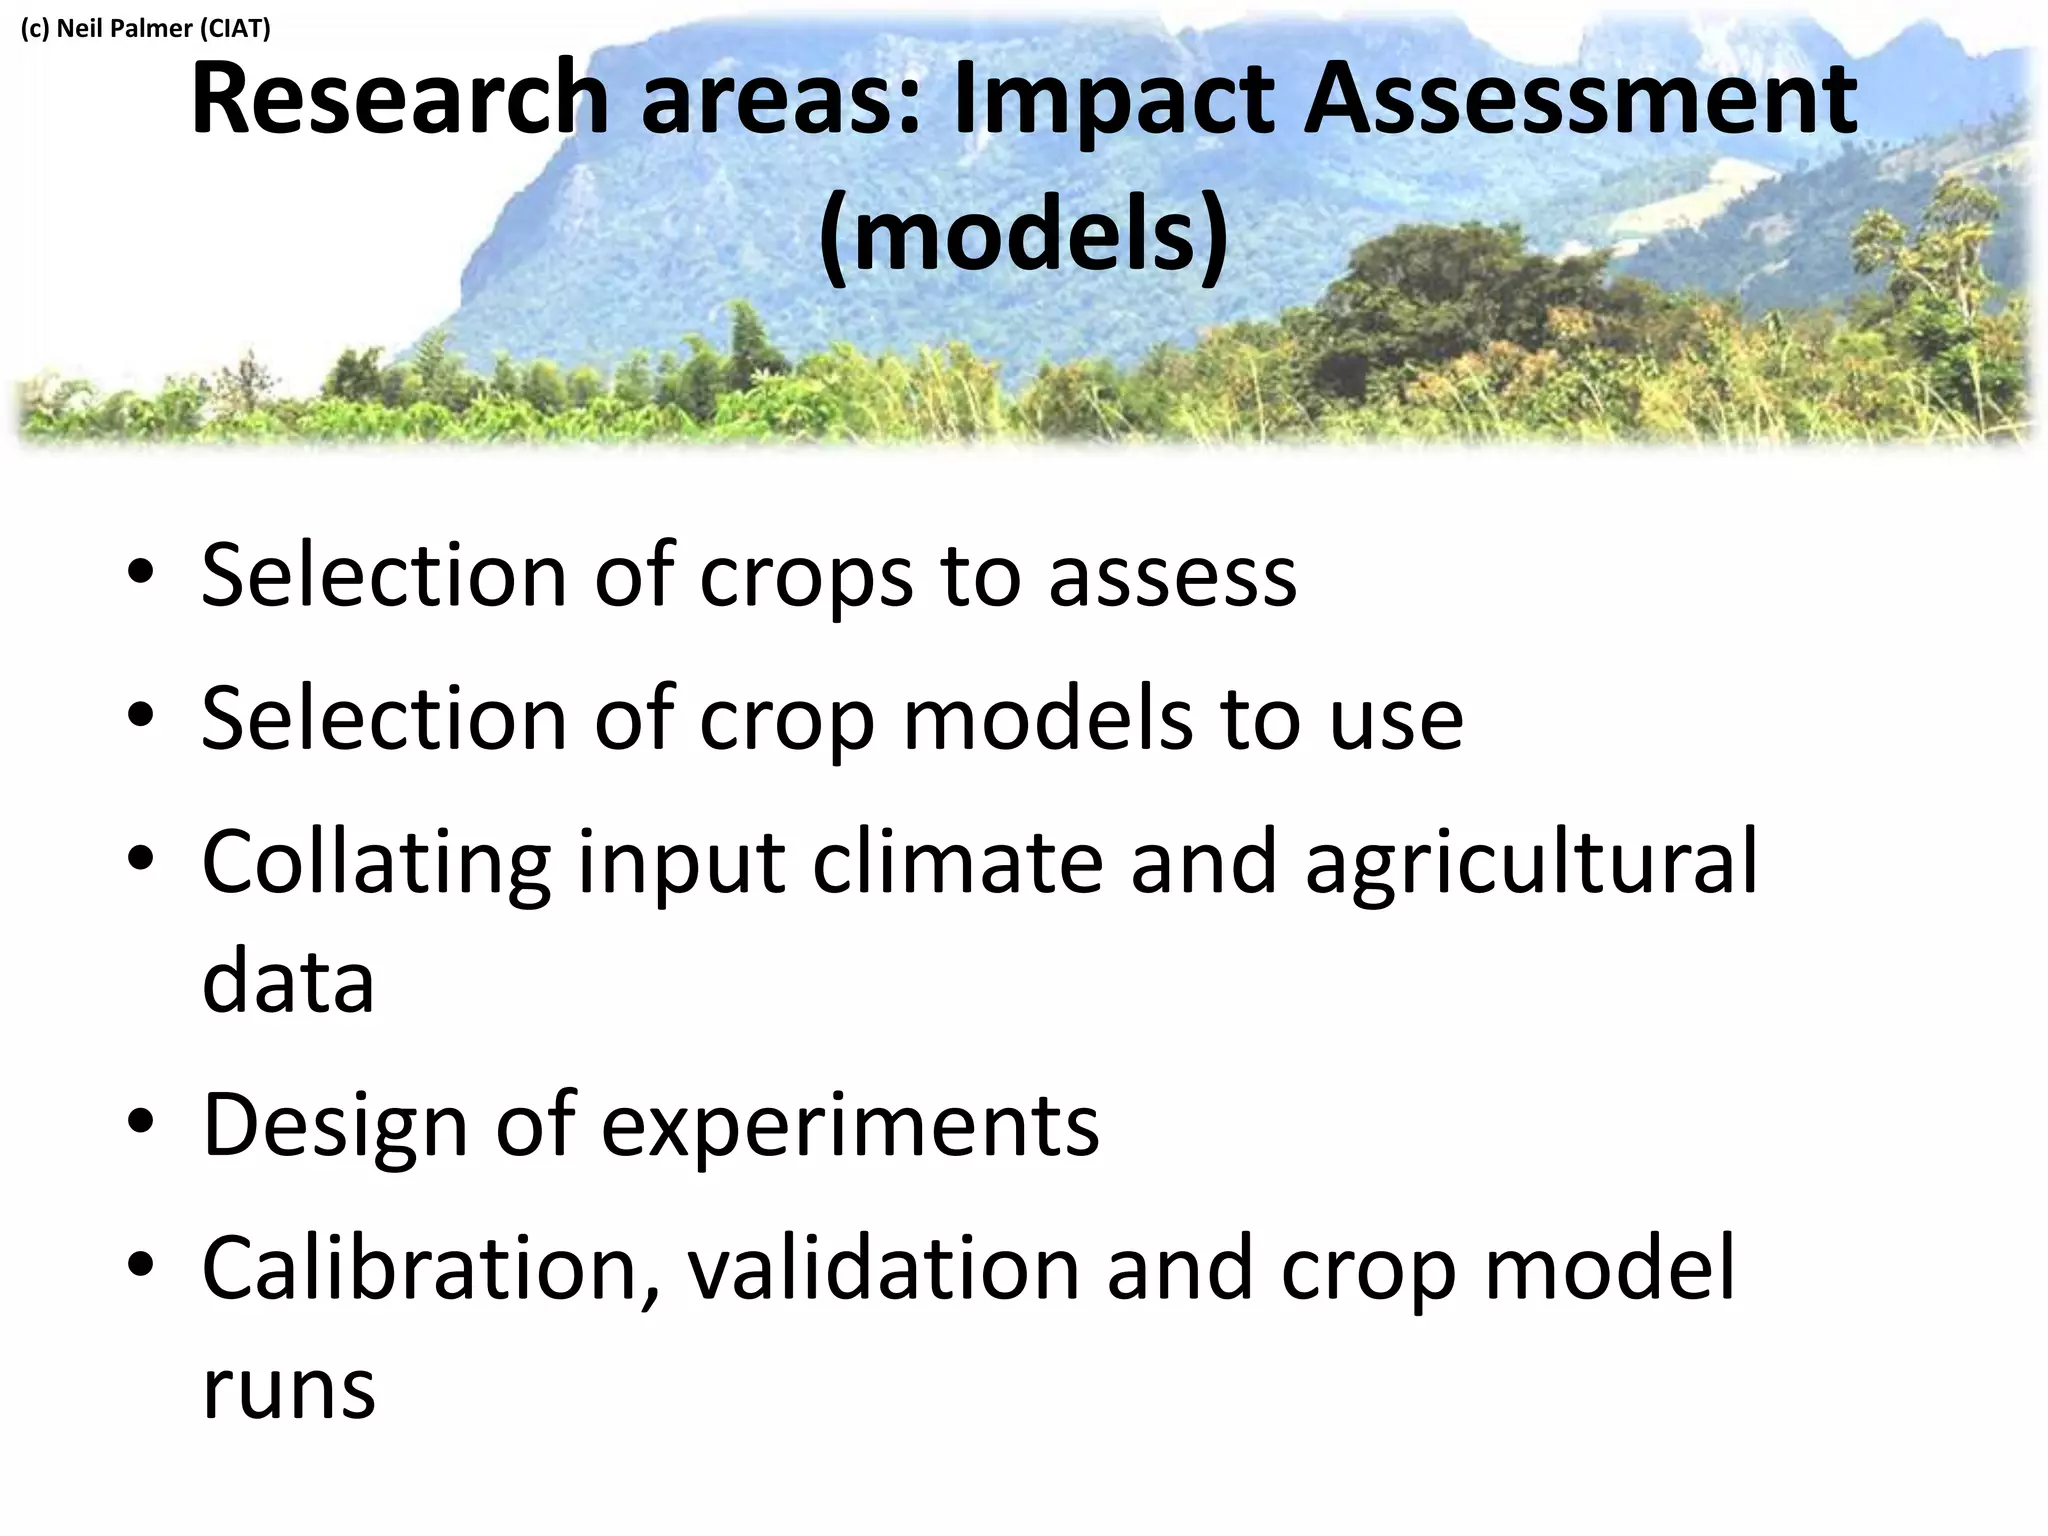
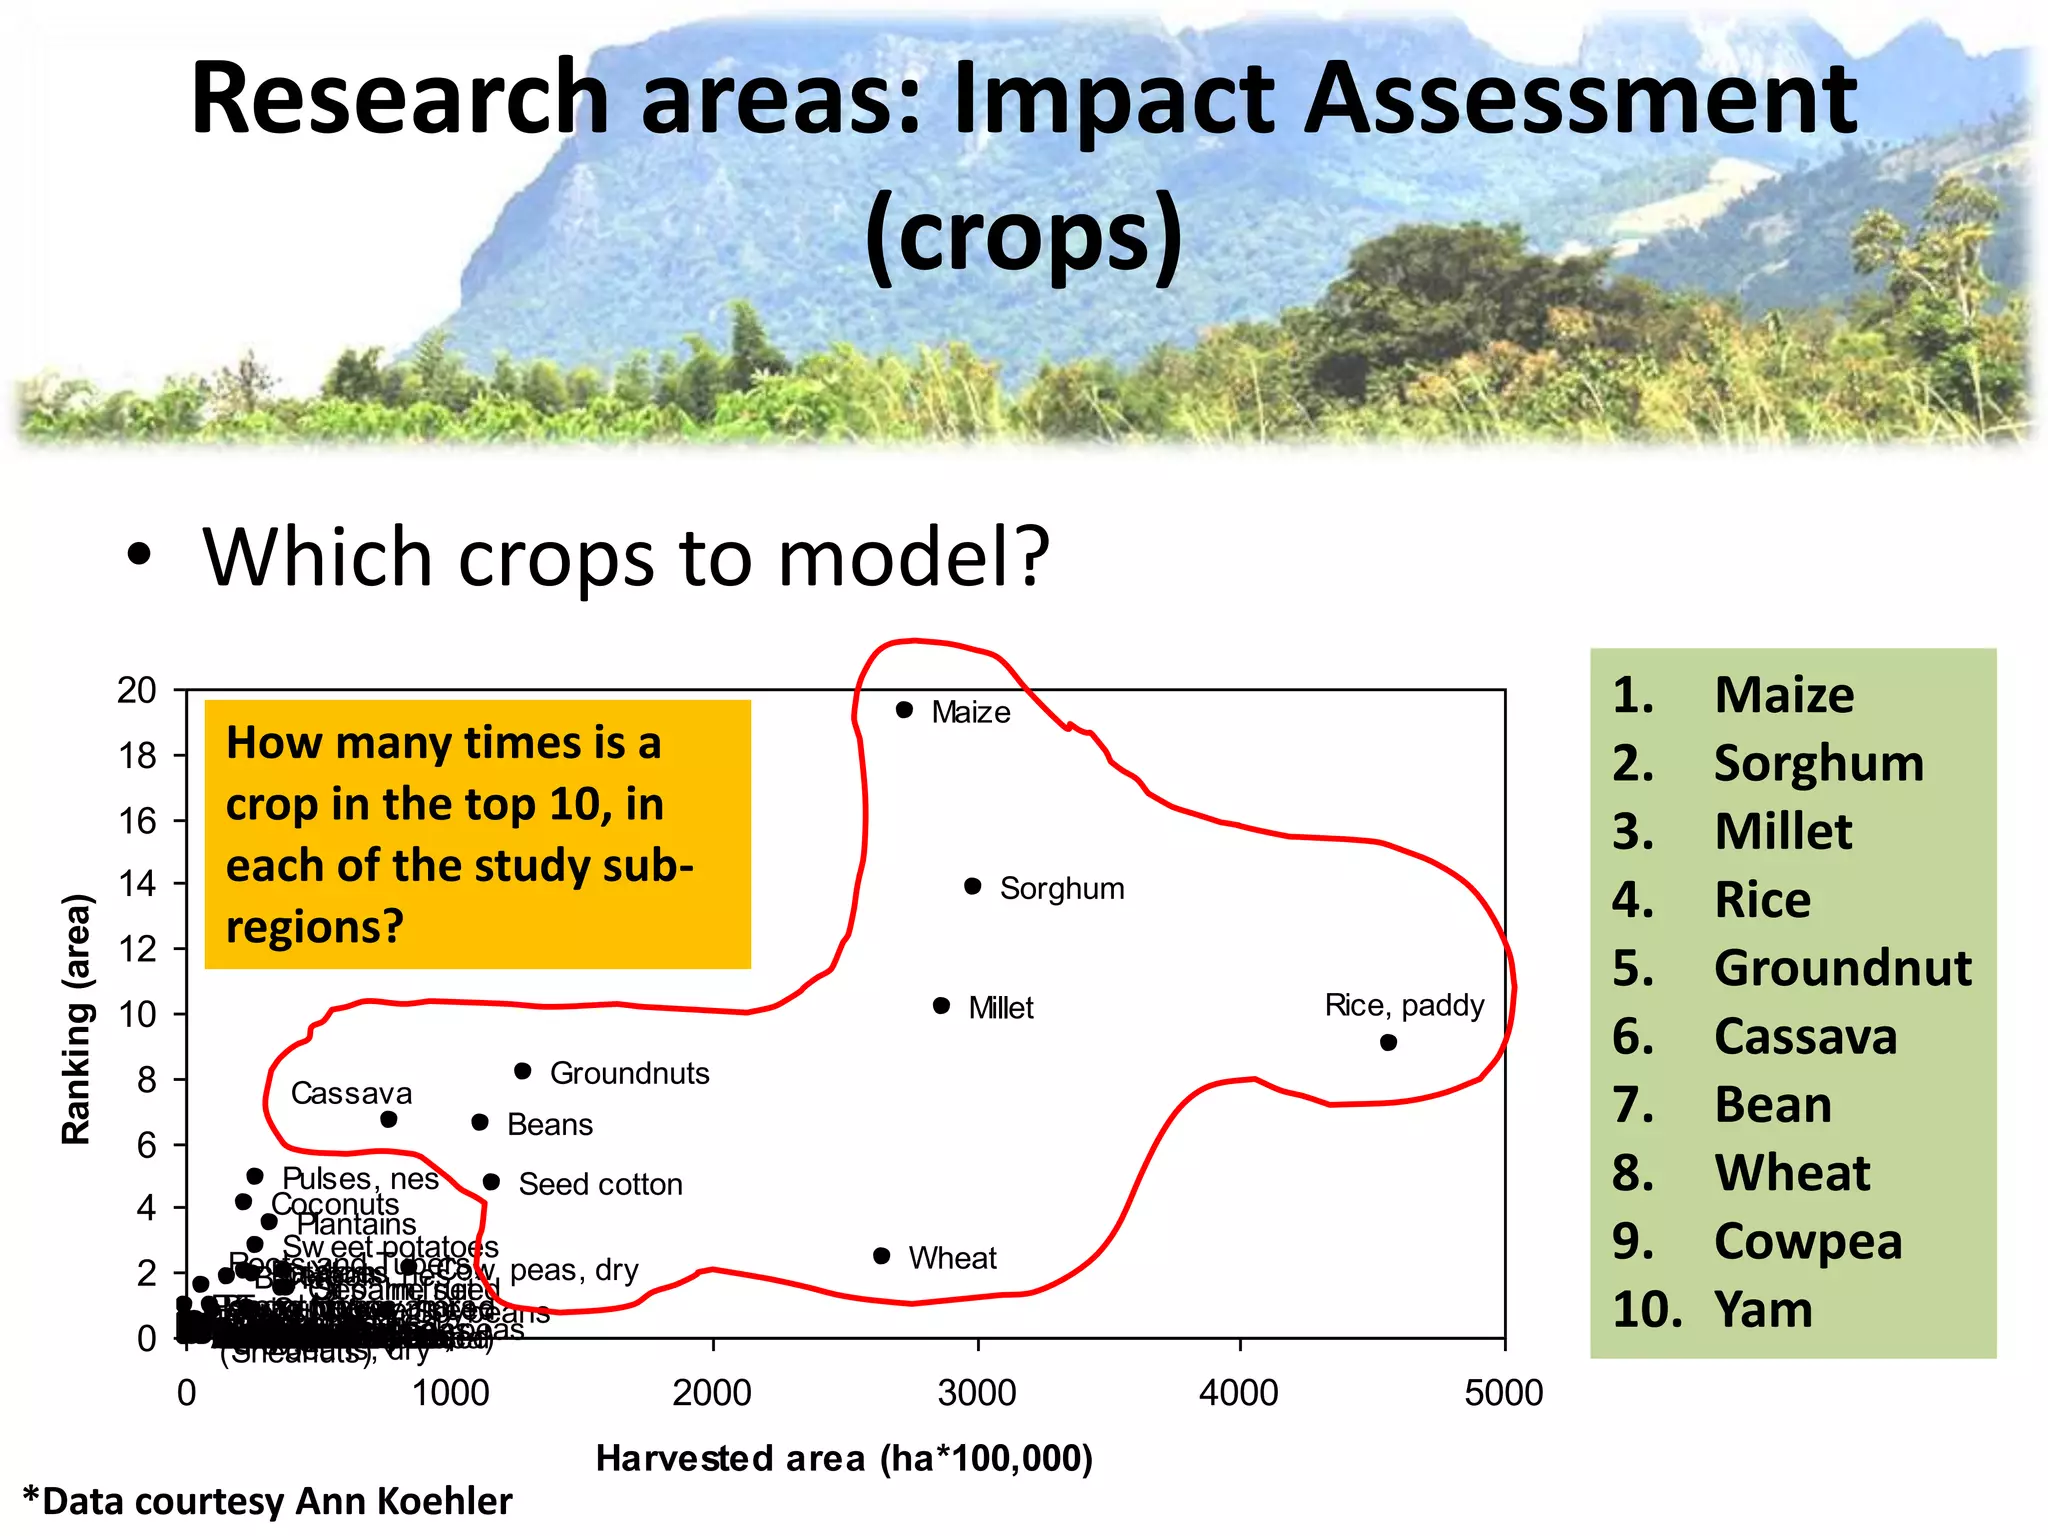
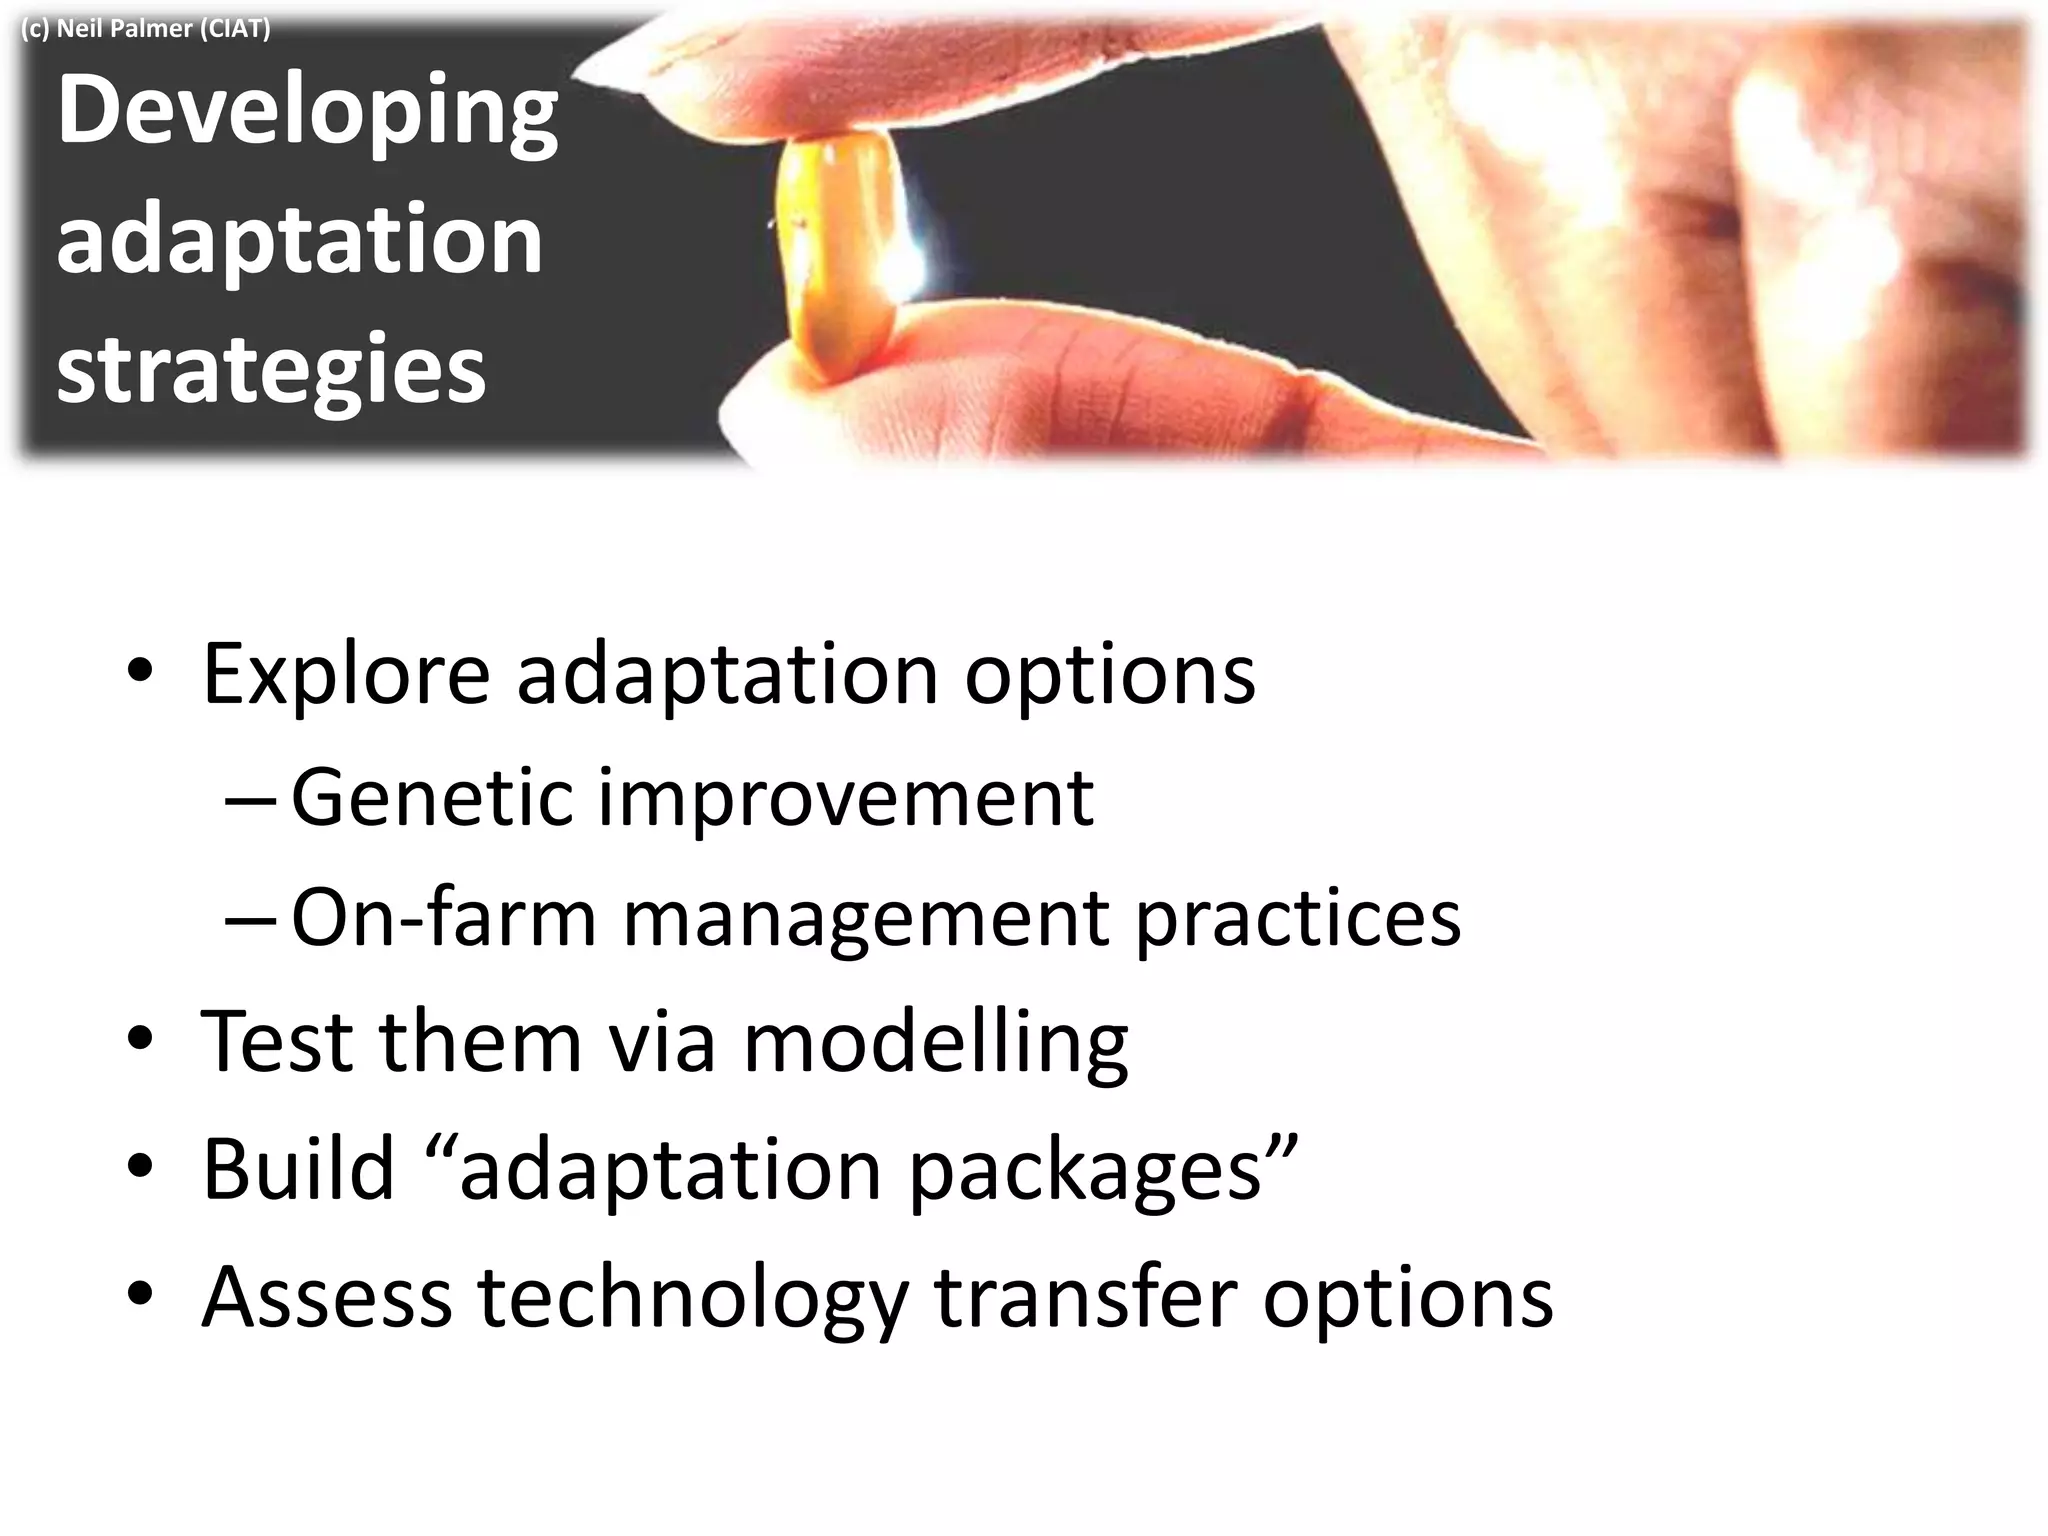
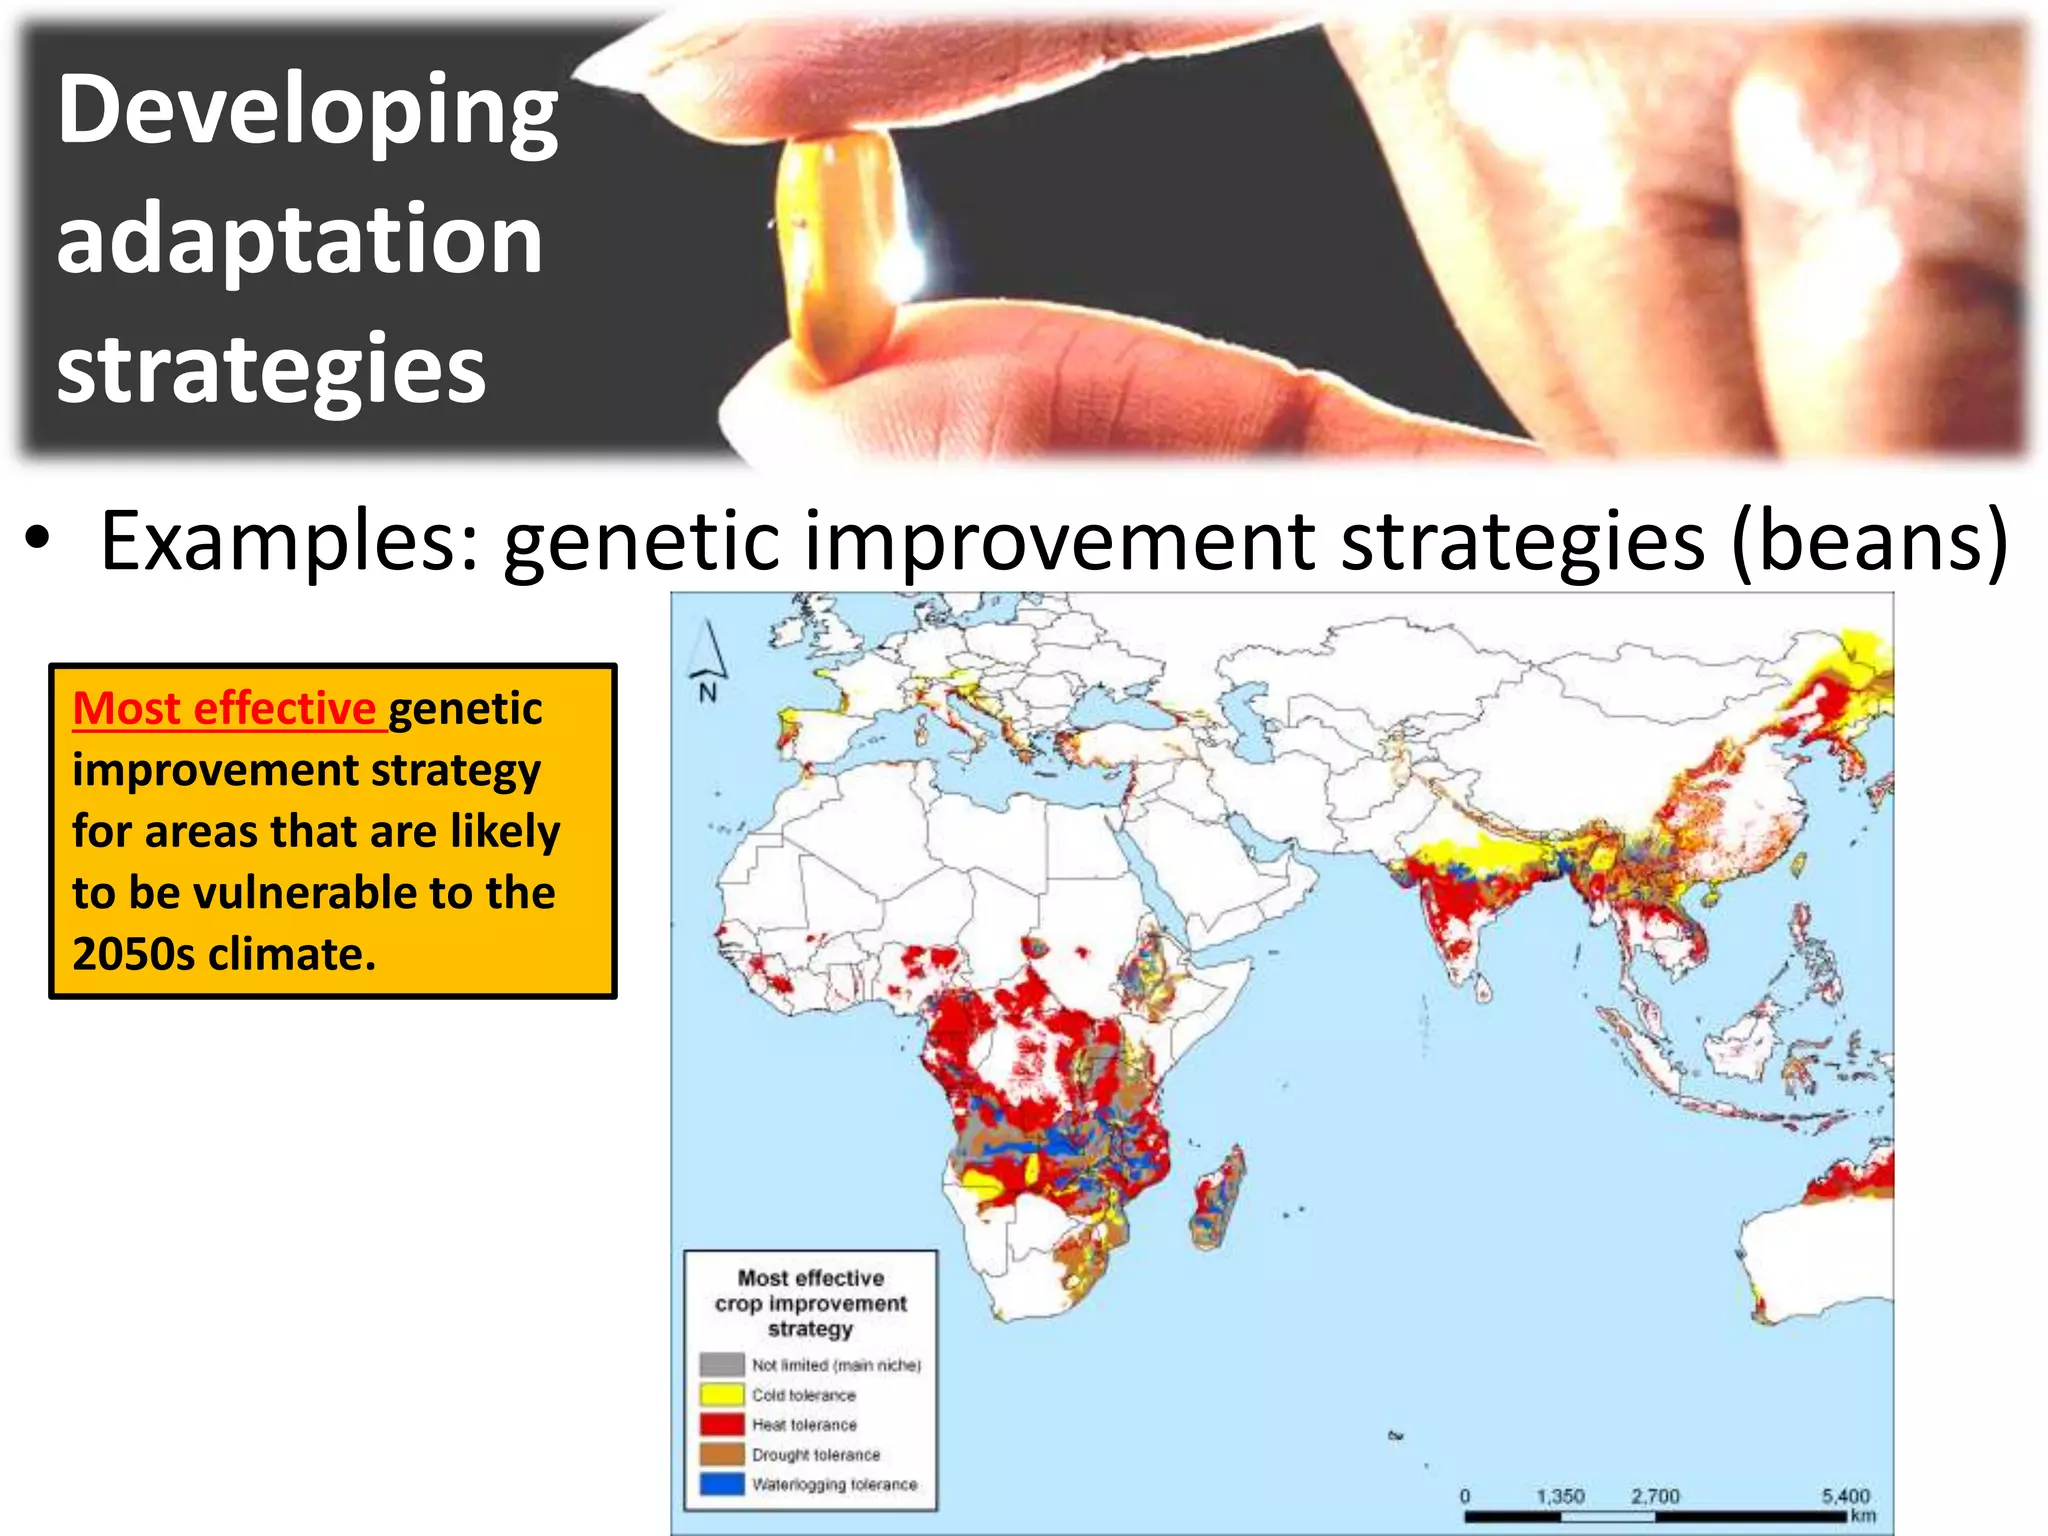
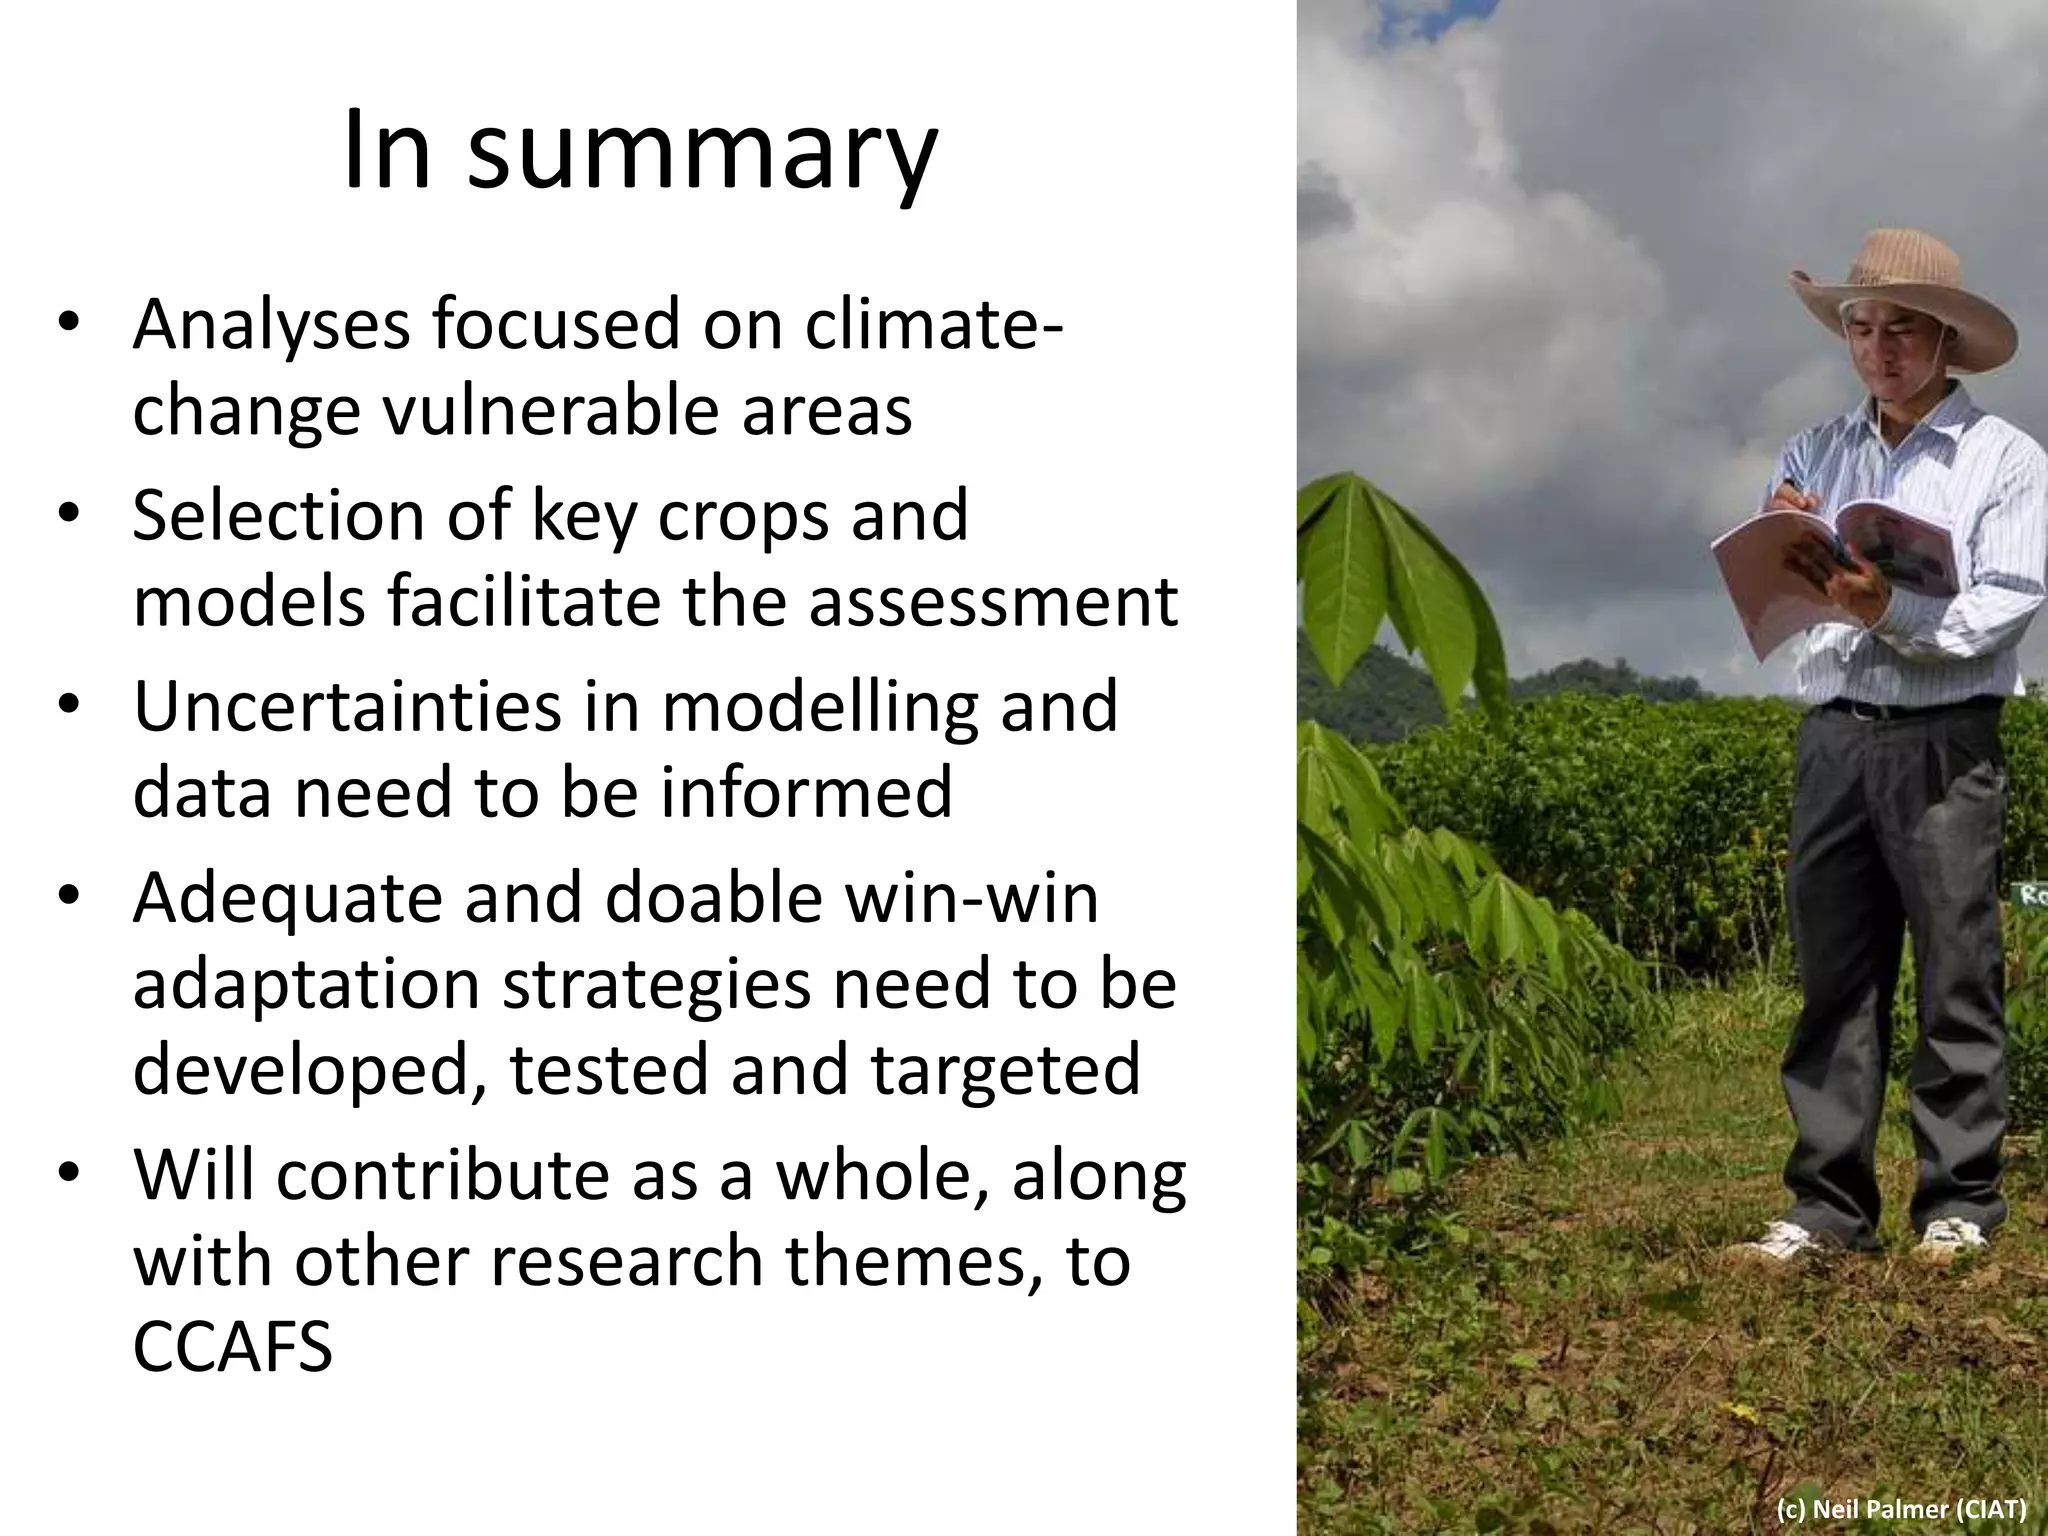
Towards adapted
agro-ecosystems
Julian Ramirez-Villegas
Climate Impacts Group
ICAS
(c) Neil Palmer (CIAT)
Contents
• Project details
• Background
– The problem: Climate, climate change and agriculture
– The framework: CCAFS
• Ongoing work: The EcoCrop model
• Geographic areas of study
• Research areas
– Overview
– Available and usable climate data
– Impact assessment
– Developing adaptation strategies
(c) Neil Palmer (CIAT)
Project details
• Title: Informing the Adaptation of Agricultural
Systems in Africa and Asia to Progressive
Climate Change over the Coming Decades
• Supervision
– Andy Challinor (principal @SEE)
– Andy Jarvis (secondary @CIAT, Colombia)
– Peter Knippertz (RSG member @SEE)
– Doug Parker (nominal @SEE)
(c) Neil Palmer (CIAT)
Background: climate, climate change
and agriculture
• Agriculture is a niche-dependent activity
– Located in suitable AND subjectively selected
areas
– Affected by variations in climatic and social drivers
• Yet there are shared strengths and
weaknesses, each system is an specific case
• Climate is the least predecible driver of
agriculture
• Climate will change
(c) Neil Palmer (CIAT)
Background: climate, climate change
and agriculture
Greater variation means we
NEED better monitoring for
quicker responses
Background: climate, climate change
and agriculture
Background: climate, climate change
and agriculture
Background: CCAFS
• Stands for Challenge Program on Climate
Change, Agriculture and Food Security
• Created by the Consultative Group on
International Agricultural Research (CGIAR)
“Assessing impacts of climate
change, facilitate adaptation and
alleviate poverty under changing
conditions”
Background: CCAFS
• Who does the research?
15 centres + ~70 regional offices
Background: CCAFS
• Where is it commited to work? Why?
Prone to drought &
flooding, but with
strong regional
climate institutions
for adapting
Prone to drought
& flooding
(cyclones), and
risk from sea level
rise
Background: CCAFS
• How does it act?
(2030s)
Background: CCAFS
• How does it act?
– 2 sets of 3 research themes each
S1
S2
T1: Diagnosing current vulnerability
T2: Unlocking the potential of policies for adaptation
T3: Enhancement engagement & communication for decision making
T4: Adaptation pathways based on current vulnerabilities
T5: Adaptation pathways under progressive climate change
T6: Poverty alleviation through climate change mitigation
Setting
baseline
Facilitating
adaptation
Ongoing work: The EcoCrop Model
It evaluates on monthly basis if there are adequate climatic conditions within
a growing season for temperature and precipitation…
• To be submitted for the AFM special issue
…and calculates the climatic suitability of the resulting interaction between rainfall
and temperature…
(c) Neil Palmer (CIAT)
Ongoing work: The EcoCrop Model
• Parameters (crop specific)
– Define the duration of the growing season
– Use the known presence of the crop to tune
growing parameters
• Climate data
– Monthly minimum, maximum, mean
temperatures and rainfall
• Result
– Suitability rating… can be downscaled to yield
Bean farm locations
Climatic suitability
Ongoing work: The EcoCrop Model
• Our philosophy
–“Keep it simple, but accurate”
–It’s accurate enough to yield regional
predictions
–Easy to calibrate
–Easy to apply spatially and transfer
–Changes point in the same direction as
predicted with other models
–Cross-checked with experts
Geographic areas of study
Research areas: Overview
Research areas: Available and usable
climate data
Research areas: Available and usable
climate data
• Which suits best for which
assessment model?
• Which one is more trustable/valid?
• What about uncertainties?
–In baselines?
–In projections?
–How to inform agricultural PM on them?
Research areas: Available and usable
climate data
• Examples: Uncertainty in baseline
data
Number of weather stations per squared map unit
using a circular neighbourhood of 2 degree
TEMPERATURE (JJA) RAINFALL (JJA)
UgandaEthiopia
Comparison
between two
baselines
Research areas: Available and usable
climate data
• Examples: Uncertainty in future data
– Averages: do they mislead?
Research areas: Available and usable
climate data
BCCR-BCM2.0 CCCMA-CGCM3.1-T47 CNRM-CM3
CSIRO-MK3.0 CSIRO-MK3.5 GFDL-CM2.0
GFDL-CM2.1 INGV-ECHAM4 INM-CM3.0
IPSL-CM4 MIROC3.2-MEDRES MIUB-ECHO-G
MPI-ECHAM5 MRI-CGCM2.3.2A NCAR-CCSM3.0
NCAR-PCM1 UKMO-HADCM3 UKMO-HADGEM1
Research areas: Impact Assessment
(models)
• Selection of crops to assess
• Selection of crop models to use
• Collating input climate and agricultural
data
• Design of experiments
• Calibration, validation and crop model
runs
(c) Neil Palmer (CIAT)
Research areas: Impact Assessment
(crops)
• Which crops to model?
Yautia (cocoyam)
Yams Wheat
VetchesTung NutsTriticale
Taro (cocoyam)
Sw eet potatoes
Sunflow er seedSoybeans
Sorghum
Sisal
Sesame seed
Seed cotton
Safflow er seed
Rye
Roots and Tubers,
nes
Rice, paddy
RapeseedRamieQuinoa
Pulses, nes
Potatoes
Poppy seed
Popcorn
Plantains
Pigeon peas
Peas, dry
Other BastfibresOlivesOilseeds, Nes
Oil palm fruit
OatsMustard seedMixed grain
Millet
MelonseedManila Fibre (Abaca)
Maize
LupinsLinseedLentils
Karite Nuts
(Sheanuts)JuteHempseedHemp Tow Waste
Groundnuts
Fonio
Flax fibre and tow
Fibre Crops Nes
Cow peas, dry
Coconuts
Chick peas
Cereals, nes
Castor oil seed
Cassava
Canary seedBuckw heat
Broad beans, horse
beans, dry
Beans
Barley
Bambara beansAgave Fibres Nes0
2
4
6
8
10
12
14
16
18
20
0 1000 2000 3000 4000 5000
Harvested area (ha*100,000)
Ranking(area)
How many times is a
crop in the top 10, in
each of the study sub-
regions?
*Data courtesy Ann Koehler
1. Maize
2. Sorghum
3. Millet
4. Rice
5. Groundnut
6. Cassava
7. Bean
8. Wheat
9. Cowpea
10. Yam
Research areas: Impact Assessment
(models)
• Which model(s) to use?
– Which model(s) suit best for a particular
• Crop?
• (Sub-)region?
– Which is more trustable/accurate/valid?
– At which spatial scale should it be applied?
– How many of them should be used?
Research areas: Impact Assessment
(models)
• Two approaches currently selected
– GLAM (Challinor et al. 2004)
– EcoCrop (Ramirez et al. in prep)
• One more being decided
– InfoCrop (Aggarwal et al. 2006): widely used &
tested in India
• (Not written in stone)
Developing
adaptation
strategies
• Explore adaptation options
–Genetic improvement
–On-farm management practices
• Test them via modelling
• Build “adaptation packages”
• Assess technology transfer options
(c) Neil Palmer (CIAT)
Developing
adaptation
strategies
• Examples: genetic improvement strategies (beans)
Most effective genetic
improvement strategy
for areas that are likely
to be vulnerable to the
2050s climate.
In summary
• Analyses focused on climate-
change vulnerable areas
• Selection of key crops and
models facilitate the assessment
• Uncertainties in modelling and
data need to be informed
• Adequate and doable win-win
adaptation strategies need to be
developed, tested and targeted
• Will contribute as a whole, along
with other research themes, to
CCAFS
(c) Neil Palmer (CIAT)

Julian R - PhD overview

  • 1.
    Towards adapted agro-ecosystems Julian Ramirez-Villegas ClimateImpacts Group ICAS (c) Neil Palmer (CIAT)
  • 2.
    Contents • Project details •Background – The problem: Climate, climate change and agriculture – The framework: CCAFS • Ongoing work: The EcoCrop model • Geographic areas of study • Research areas – Overview – Available and usable climate data – Impact assessment – Developing adaptation strategies (c) Neil Palmer (CIAT)
  • 3.
    Project details • Title:Informing the Adaptation of Agricultural Systems in Africa and Asia to Progressive Climate Change over the Coming Decades • Supervision – Andy Challinor (principal @SEE) – Andy Jarvis (secondary @CIAT, Colombia) – Peter Knippertz (RSG member @SEE) – Doug Parker (nominal @SEE) (c) Neil Palmer (CIAT)
  • 4.
    Background: climate, climatechange and agriculture • Agriculture is a niche-dependent activity – Located in suitable AND subjectively selected areas – Affected by variations in climatic and social drivers • Yet there are shared strengths and weaknesses, each system is an specific case • Climate is the least predecible driver of agriculture • Climate will change (c) Neil Palmer (CIAT)
  • 5.
    Background: climate, climatechange and agriculture Greater variation means we NEED better monitoring for quicker responses
  • 6.
    Background: climate, climatechange and agriculture
  • 7.
    Background: climate, climatechange and agriculture
  • 8.
    Background: CCAFS • Standsfor Challenge Program on Climate Change, Agriculture and Food Security • Created by the Consultative Group on International Agricultural Research (CGIAR) “Assessing impacts of climate change, facilitate adaptation and alleviate poverty under changing conditions”
  • 9.
    Background: CCAFS • Whodoes the research? 15 centres + ~70 regional offices
  • 10.
    Background: CCAFS • Whereis it commited to work? Why? Prone to drought & flooding, but with strong regional climate institutions for adapting Prone to drought & flooding (cyclones), and risk from sea level rise
  • 11.
    Background: CCAFS • Howdoes it act? (2030s)
  • 12.
    Background: CCAFS • Howdoes it act? – 2 sets of 3 research themes each S1 S2 T1: Diagnosing current vulnerability T2: Unlocking the potential of policies for adaptation T3: Enhancement engagement & communication for decision making T4: Adaptation pathways based on current vulnerabilities T5: Adaptation pathways under progressive climate change T6: Poverty alleviation through climate change mitigation Setting baseline Facilitating adaptation
  • 13.
    Ongoing work: TheEcoCrop Model It evaluates on monthly basis if there are adequate climatic conditions within a growing season for temperature and precipitation… • To be submitted for the AFM special issue …and calculates the climatic suitability of the resulting interaction between rainfall and temperature… (c) Neil Palmer (CIAT)
  • 14.
    Ongoing work: TheEcoCrop Model • Parameters (crop specific) – Define the duration of the growing season – Use the known presence of the crop to tune growing parameters • Climate data – Monthly minimum, maximum, mean temperatures and rainfall • Result – Suitability rating… can be downscaled to yield
  • 15.
    Bean farm locations Climaticsuitability Ongoing work: The EcoCrop Model • Our philosophy –“Keep it simple, but accurate” –It’s accurate enough to yield regional predictions –Easy to calibrate –Easy to apply spatially and transfer –Changes point in the same direction as predicted with other models –Cross-checked with experts
  • 16.
  • 17.
  • 18.
    Research areas: Availableand usable climate data
  • 19.
    Research areas: Availableand usable climate data • Which suits best for which assessment model? • Which one is more trustable/valid? • What about uncertainties? –In baselines? –In projections? –How to inform agricultural PM on them?
  • 20.
    Research areas: Availableand usable climate data • Examples: Uncertainty in baseline data Number of weather stations per squared map unit using a circular neighbourhood of 2 degree
  • 21.
    TEMPERATURE (JJA) RAINFALL(JJA) UgandaEthiopia Comparison between two baselines
  • 22.
    Research areas: Availableand usable climate data • Examples: Uncertainty in future data – Averages: do they mislead?
  • 23.
    Research areas: Availableand usable climate data BCCR-BCM2.0 CCCMA-CGCM3.1-T47 CNRM-CM3 CSIRO-MK3.0 CSIRO-MK3.5 GFDL-CM2.0 GFDL-CM2.1 INGV-ECHAM4 INM-CM3.0 IPSL-CM4 MIROC3.2-MEDRES MIUB-ECHO-G MPI-ECHAM5 MRI-CGCM2.3.2A NCAR-CCSM3.0 NCAR-PCM1 UKMO-HADCM3 UKMO-HADGEM1
  • 24.
    Research areas: ImpactAssessment (models) • Selection of crops to assess • Selection of crop models to use • Collating input climate and agricultural data • Design of experiments • Calibration, validation and crop model runs (c) Neil Palmer (CIAT)
  • 25.
    Research areas: ImpactAssessment (crops) • Which crops to model? Yautia (cocoyam) Yams Wheat VetchesTung NutsTriticale Taro (cocoyam) Sw eet potatoes Sunflow er seedSoybeans Sorghum Sisal Sesame seed Seed cotton Safflow er seed Rye Roots and Tubers, nes Rice, paddy RapeseedRamieQuinoa Pulses, nes Potatoes Poppy seed Popcorn Plantains Pigeon peas Peas, dry Other BastfibresOlivesOilseeds, Nes Oil palm fruit OatsMustard seedMixed grain Millet MelonseedManila Fibre (Abaca) Maize LupinsLinseedLentils Karite Nuts (Sheanuts)JuteHempseedHemp Tow Waste Groundnuts Fonio Flax fibre and tow Fibre Crops Nes Cow peas, dry Coconuts Chick peas Cereals, nes Castor oil seed Cassava Canary seedBuckw heat Broad beans, horse beans, dry Beans Barley Bambara beansAgave Fibres Nes0 2 4 6 8 10 12 14 16 18 20 0 1000 2000 3000 4000 5000 Harvested area (ha*100,000) Ranking(area) How many times is a crop in the top 10, in each of the study sub- regions? *Data courtesy Ann Koehler 1. Maize 2. Sorghum 3. Millet 4. Rice 5. Groundnut 6. Cassava 7. Bean 8. Wheat 9. Cowpea 10. Yam
  • 26.
    Research areas: ImpactAssessment (models) • Which model(s) to use? – Which model(s) suit best for a particular • Crop? • (Sub-)region? – Which is more trustable/accurate/valid? – At which spatial scale should it be applied? – How many of them should be used?
  • 27.
    Research areas: ImpactAssessment (models) • Two approaches currently selected – GLAM (Challinor et al. 2004) – EcoCrop (Ramirez et al. in prep) • One more being decided – InfoCrop (Aggarwal et al. 2006): widely used & tested in India • (Not written in stone)
  • 28.
    Developing adaptation strategies • Explore adaptationoptions –Genetic improvement –On-farm management practices • Test them via modelling • Build “adaptation packages” • Assess technology transfer options (c) Neil Palmer (CIAT)
  • 29.
    Developing adaptation strategies • Examples: geneticimprovement strategies (beans) Most effective genetic improvement strategy for areas that are likely to be vulnerable to the 2050s climate.
  • 30.
    In summary • Analysesfocused on climate- change vulnerable areas • Selection of key crops and models facilitate the assessment • Uncertainties in modelling and data need to be informed • Adequate and doable win-win adaptation strategies need to be developed, tested and targeted • Will contribute as a whole, along with other research themes, to CCAFS (c) Neil Palmer (CIAT)