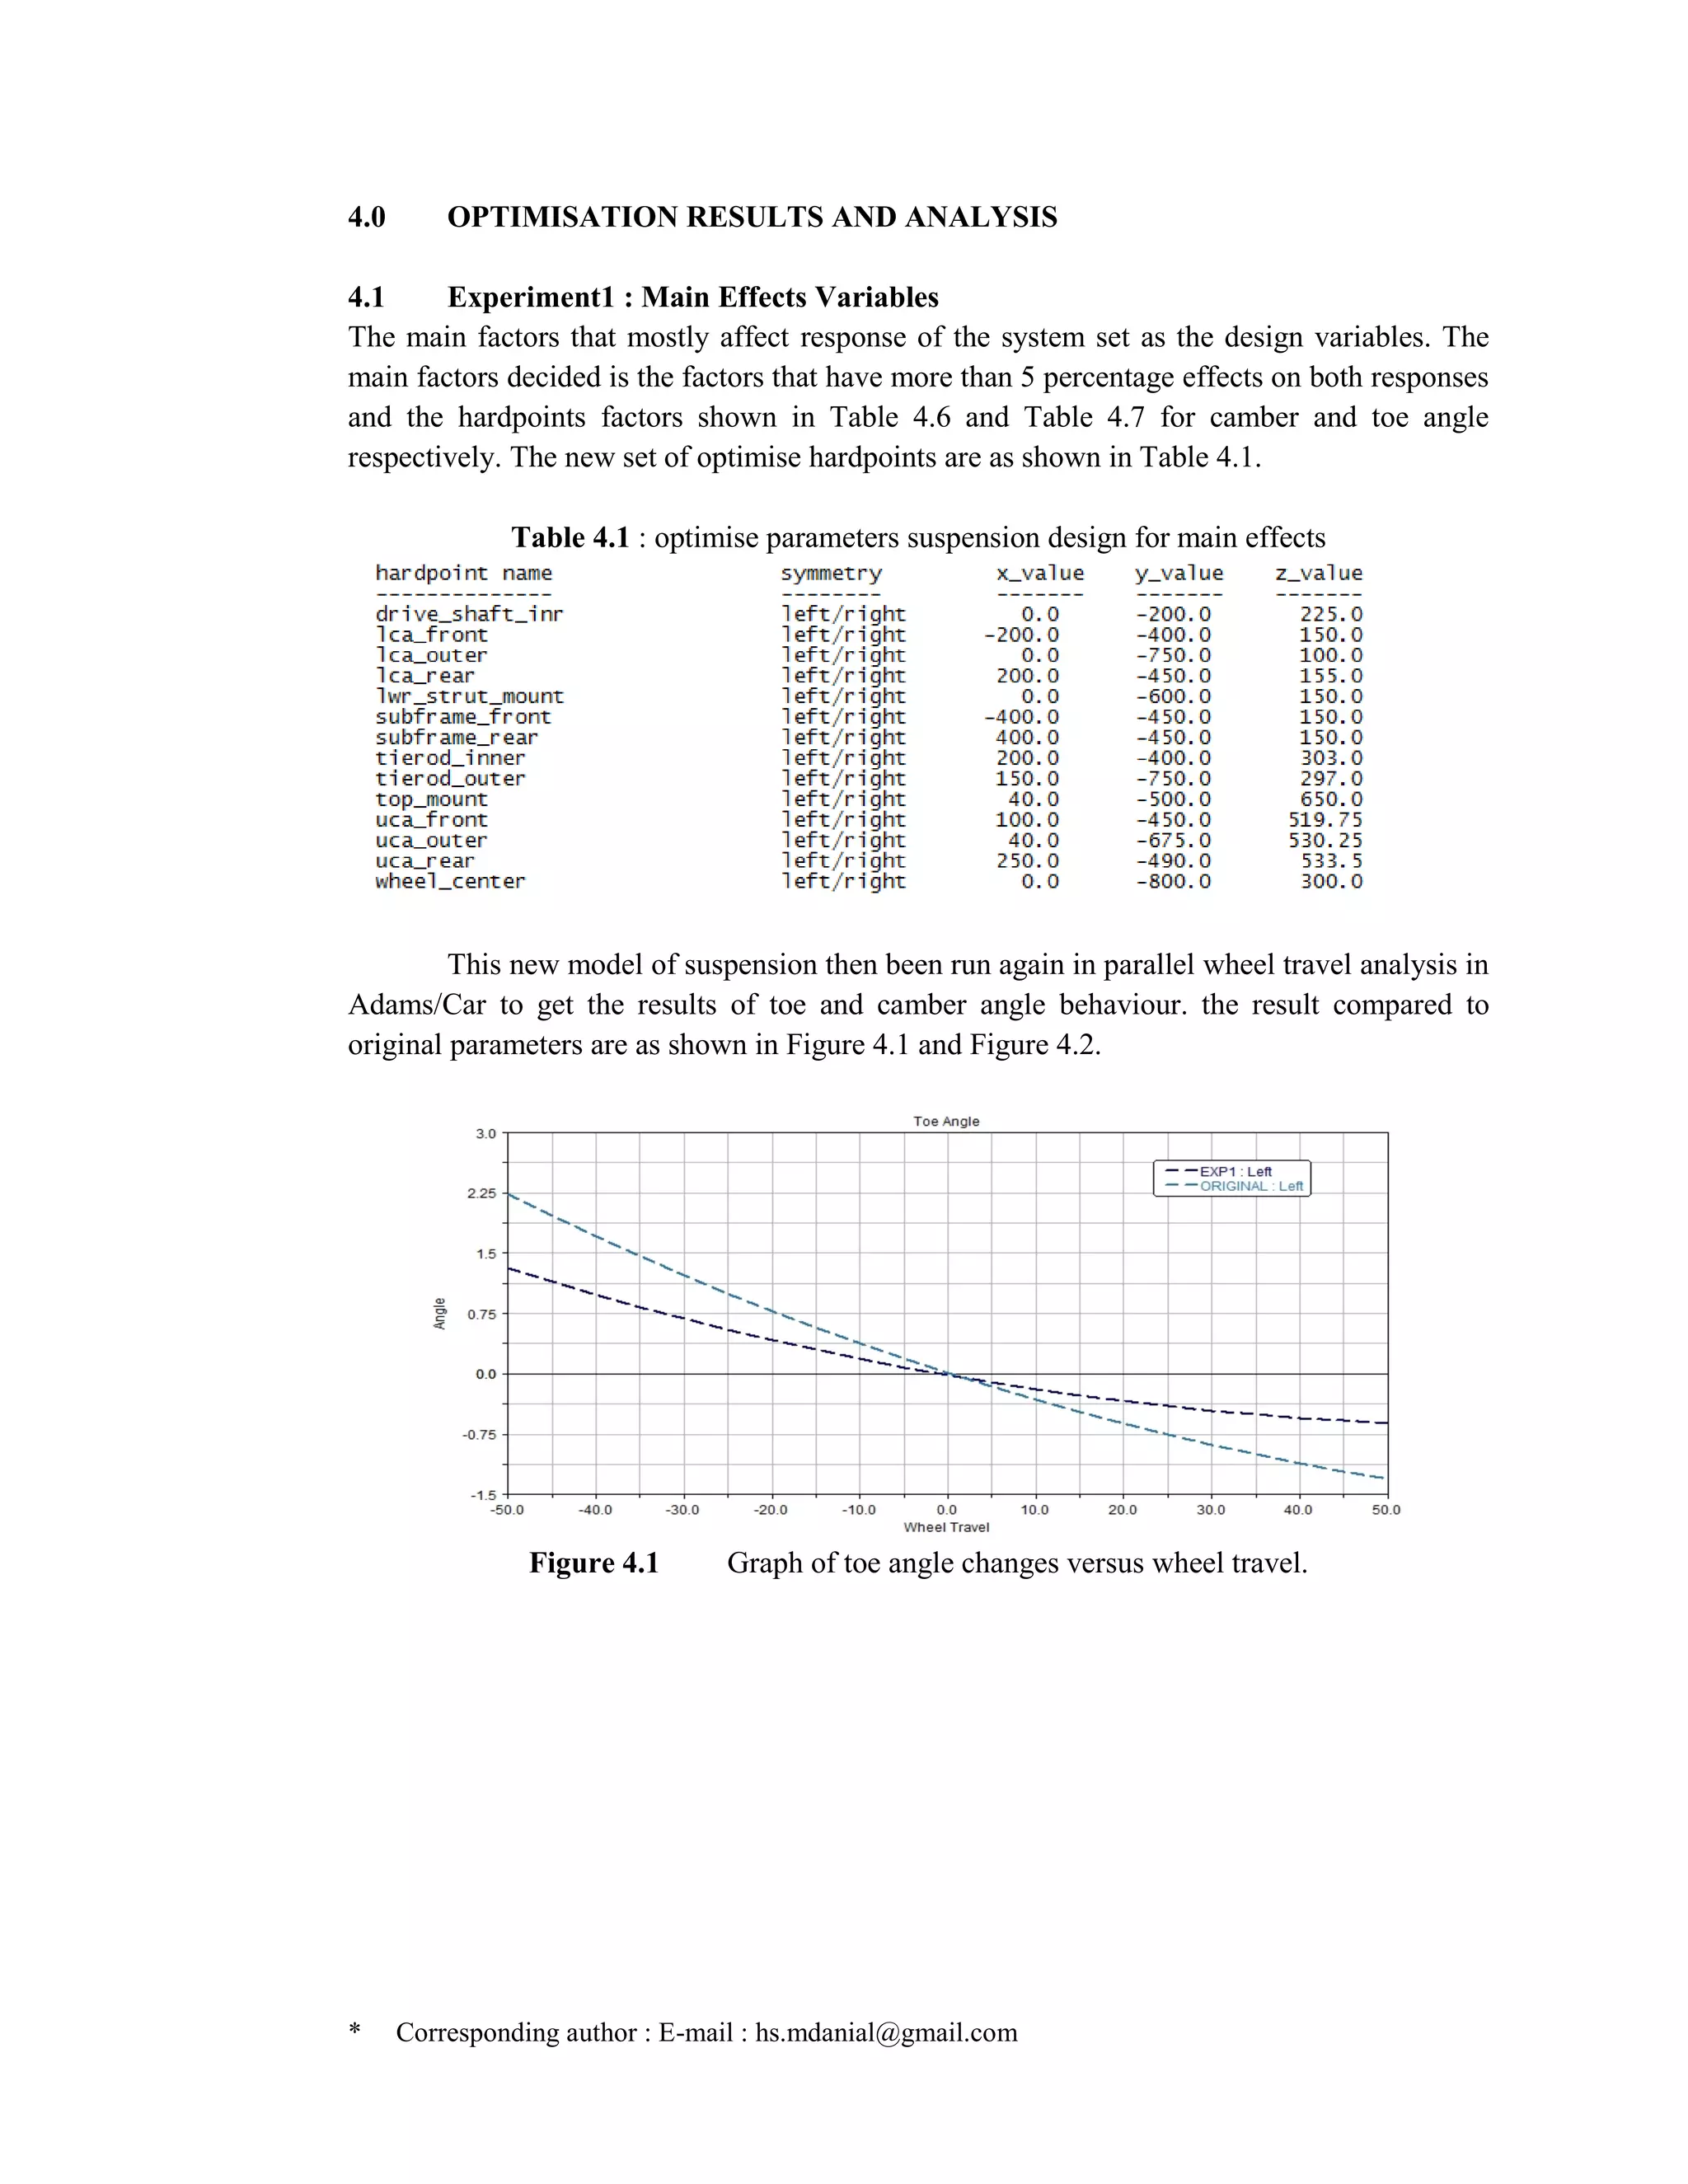
This document discusses the optimization of kinematics characteristics for a double wishbone suspension system using Design of Experiments (DOE) methods. It begins with an introduction to suspension systems and issues like ride performance. It then describes modeling the double wishbone system, analyzing baseline behavior, and formulating the optimization problem. Several experiments are discussed that optimize design variables like hardpoints and control arm parameters. The results show the upper control arm most influences behavior and improves toe and camber angle ranges for better ride quality. While lower control arm adjustment affected behavior significantly, it did not meet design objectives. Overall, the optimization process successfully identified new parameter designs that enhance suspension kinematics.
![* Corresponding author : E-mail : hs.mdanial@gmail.com
2.0 MODEL OF SUSPENSION SYSTEM
2.1 Model of Double Wishbone Suspension
As the suspension system is already build in the Adams/Car as the template and ready to use
by the user, all the needs is just to define the certain parameters that will be affect the
suspension system performance. The parameters need to clarify is important as this is the
main criteria as what double wishbone suspension system is. The Figure 3.1 shows the design
of the double wishbone suspension system
2.2 Baseline Parallel Wheel Travel Analysis
Baseline parallel wheel travel analysis is the experiment to analyze the behavior of the
suspension system of the kinematics parameters on toe and camber angle value when the
wheels of the suspension moving upwards and downwards depends on the setting of the
experiment The experiments are taking place of 20 step simulations and the bump travel and
rebound travel are set at 50mm and -50mm respectively.
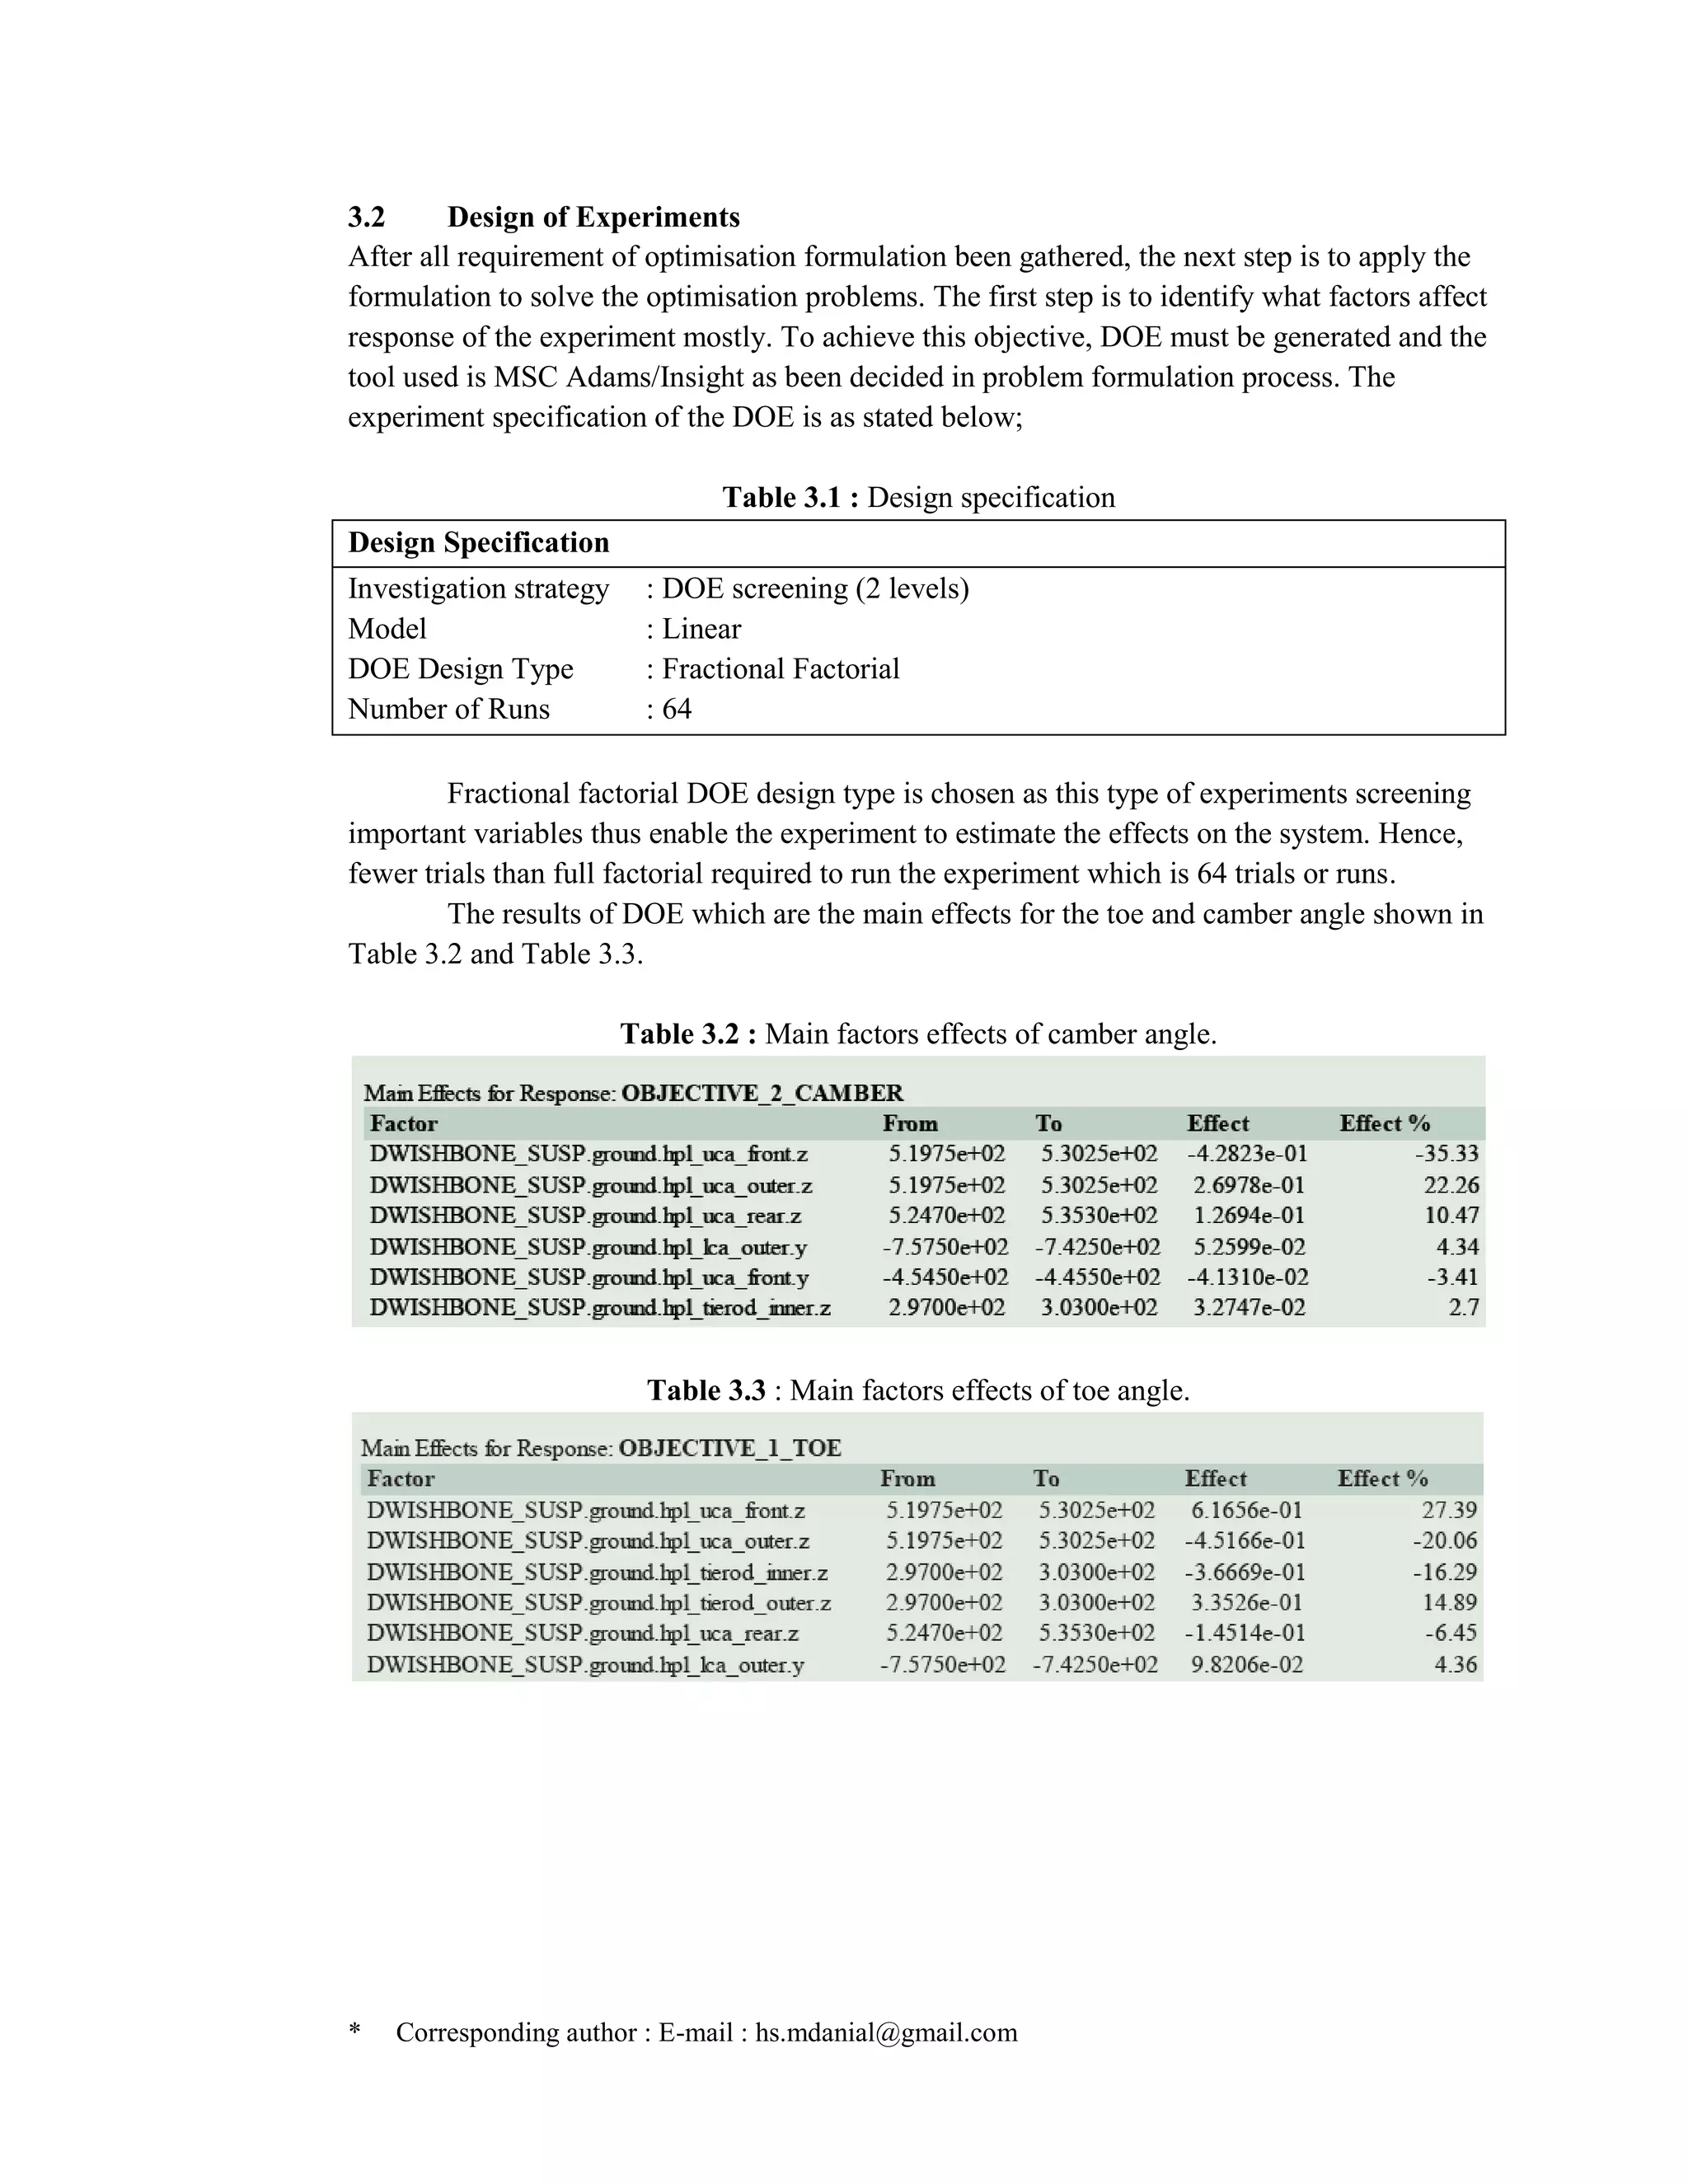
3.0 OPTIMISATION FORMULATION AND DESIGN OF EXPERIMENT (DOE)
3.1 OPTIMISATION FORMULATION
Optimisation formulation have a process to be followed and conducted properly as stated
above a good optimum design come with a good formulation process. Mostly, this
formulation involves translating words of statement into well defined mathematical statement
[9].
1. Project/problem description
2. Data and information collection
3. Definition of design variables
4. Optimisation criteria/objectives
5. Formulation of constraints](https://image.slidesharecdn.com/e63cd9aa-0dcb-4345-9176-312f892d6b75-150710134809-lva1-app6892/75/JOURNAL_OPTIMISATION-OF-VEHICLE-KINEMATICS-CHARACTERISTICS-USING-DESIGN-OF-EXPERIMENT-METHOD-2-2048.jpg)