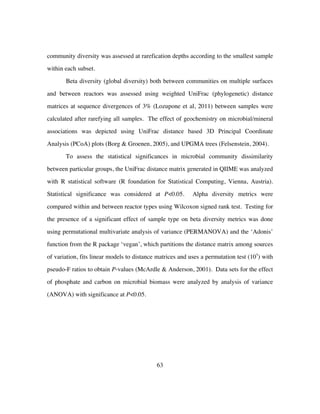
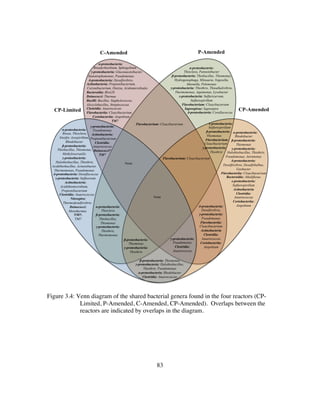
This dissertation by Aaron Alexander Jones examines the relationship between microbial community structure, function, and mineral surfaces in subsurface environments. Chapter 1 introduces the motivation and questions. Chapter 2 demonstrates that biofilm growth and microbial diversity are highly dependent on the type of mineral surface in nutrient-limited systems. Chapter 3 shows that mineral type controls up to 90% of phylogenetic diversity regardless of environmental conditions, indicating mineral selection is genetically ingrained. It also reveals shifts in community structure and function that impact geochemistry. Chapter 4 provides evidence that carbon isotope fractionation can be used to infer microbial community structure and function in sulfuric acid cave ecosystems.


![vii
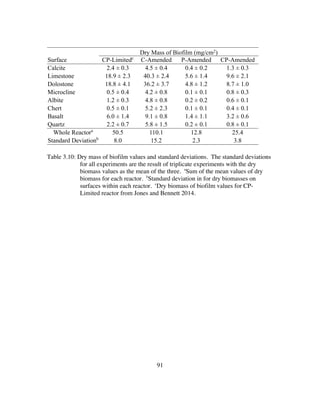
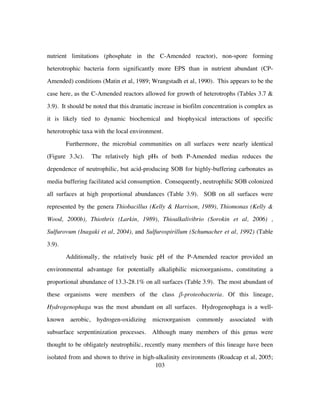
(carbonates vs. silicates vs. aluminosilicates) are more phylogenetically similar. I find
that surface type controls up to 90% of the variance in phylogenetic diversity of a system
regardless of environmental pressures. This is strong evidence that mineral selection is
genetically ingrained.
We provide validated methodology for the use of continuous flow-bioreactors to
expose the fundamentally dynamic nature of microbial structure within biofilms. I
demonstrate that these shifts in community structure can occur rapidly, impacting
geochemistry and carbonate mineral solubility. Specifically, carbonate dissolution is
highly accelerated under autotrophic conditions dominated by sulfur-oxidizers.
Immediately after adding acetate the community shifts to heterotrophic sulfur-reducers
resulting in carbonate precipitation. Additionally, these functional shifts can be inferred
by monitoring geochemical indicators (δ13
CCO2, [CO2], Ca2+
, and pH). I provide evidence
that the responsiveness of carbonate system reactions to the metabolic products of
sulfuric acid cave ecosystems are ideal model ecosystems for studying the effects of
microbial community structure on stable carbon isotope fractionation.
I submit that biogeochemical interactions with mineral surfaces have influenced
development, evolution, and diversification of microbial life. Throughout geologic time,
microorganisms have enhanced survival by colonizing mineral surfaces and developing
complex biofilm communities genetically primed for specific mineral habitats.](https://image.slidesharecdn.com/e7dfd69b-aed2-40be-a698-a68cb2702da4-160817180109/85/JONES-DISSERTATION-2015-7-320.jpg)
![xvi
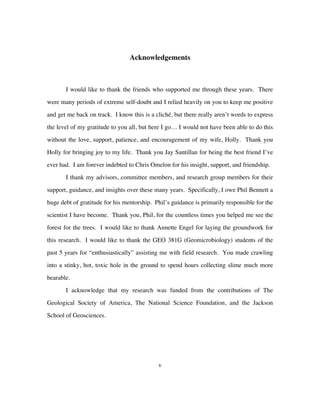
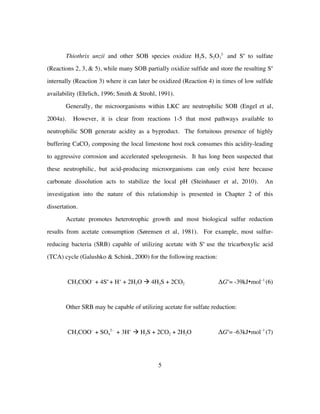
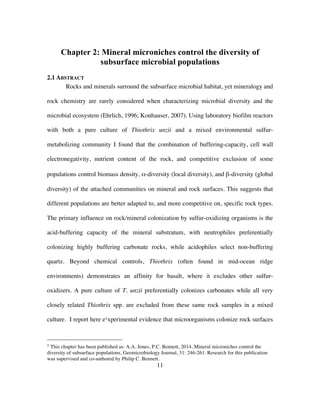
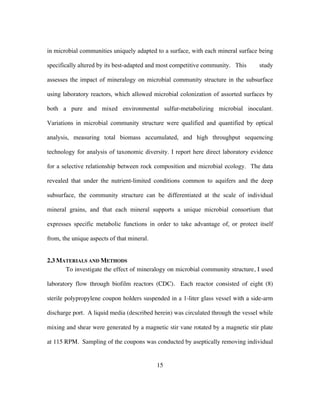
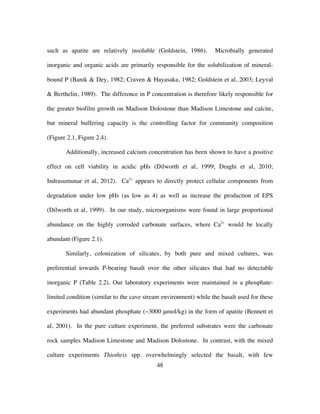
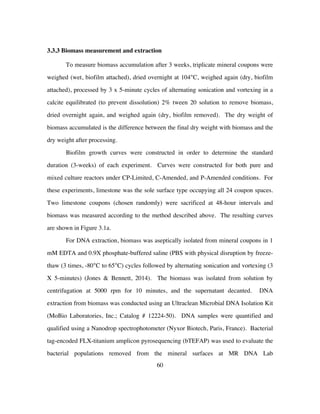
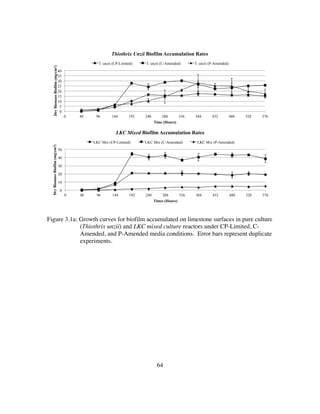
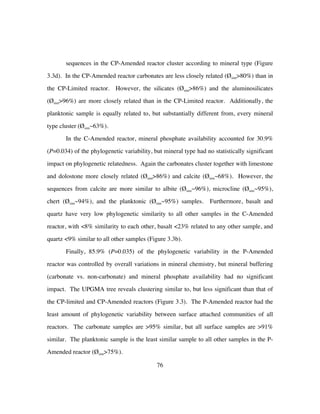
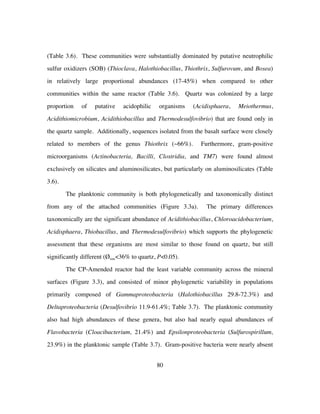
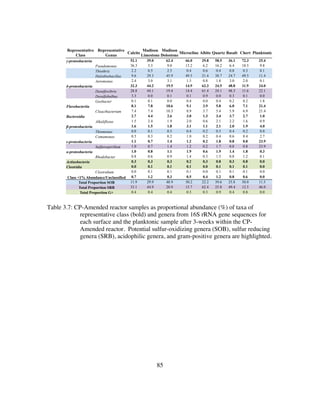
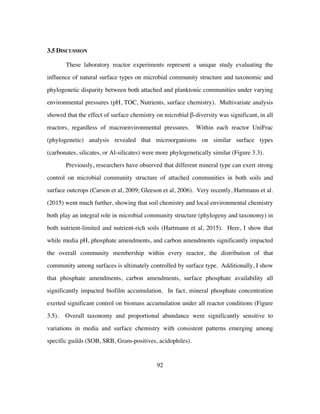
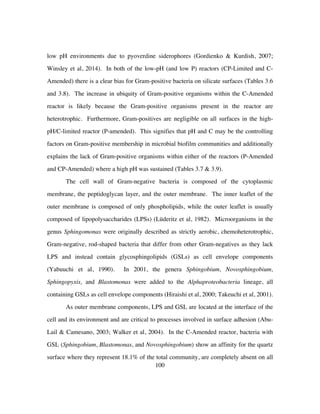
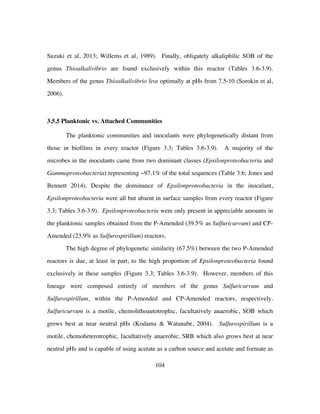
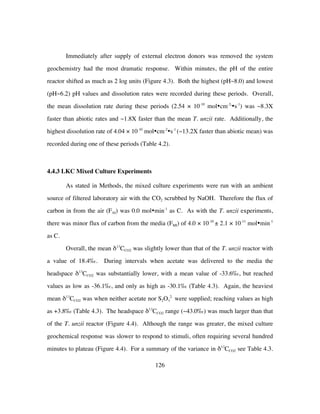
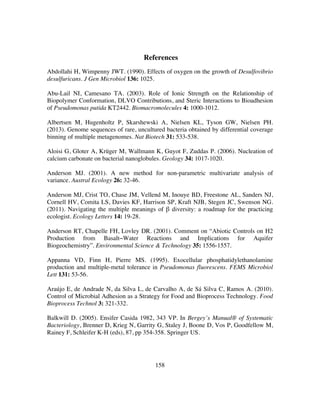
Table 4.3: Table showing the mean, high, and low δ13
CCO2 (‰)within the LKC Mixed
Culture reactor for intervals when the reactor was amended with acetate,
thiosulfate, both, or neither. Table also shows the likely dominant
metabolism during each of these intervals......................................129
Table 4.4: Table showing the mean, high, and biotic/abiotic limestone dissolution
rates (mol•cm2
•s-1
)within the LKC Mixed Culture reactor for intervals
when the reactor was amended with acetate, thiosulfate, both, or neither.
.........................................................................................................131
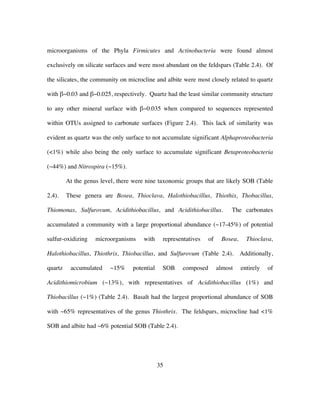
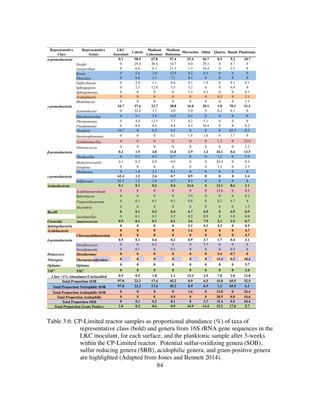
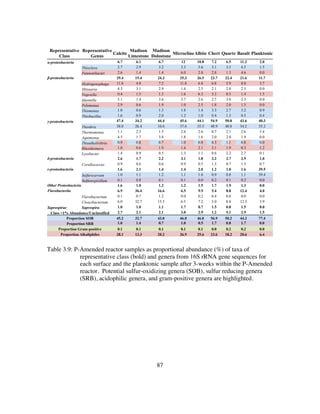
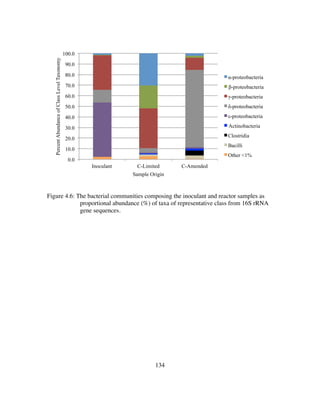
Table 4.5: Inoculant and reactor samples as proportional abundance (%) of taxa of
representative class (bold) and genera from 16S rRNA gene sequences.
Putative sulfur-oxidizing genera (SOB), sulfur reducing genera (SRB),
and gram-positive genera are highlighted.......................................135
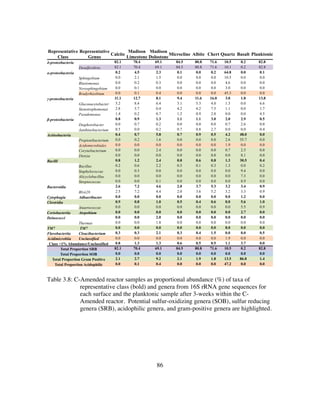
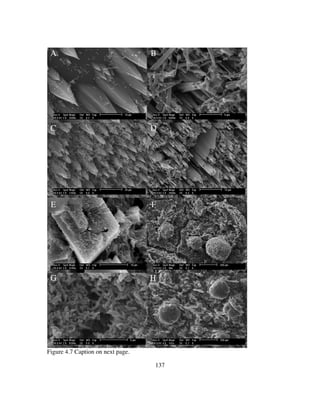
Table 4.6: Summary of mean Δ [Sulfur] (mM) of various sulfur species during
specific periods and overall summary of findings from this study. When
S2O3
2-
in is 0.89mM, Acetate in is 2mM, SO4
2-
in from MgSO4 is
0.94mM...........................................................................................151](https://image.slidesharecdn.com/e7dfd69b-aed2-40be-a698-a68cb2702da4-160817180109/85/JONES-DISSERTATION-2015-16-320.jpg)
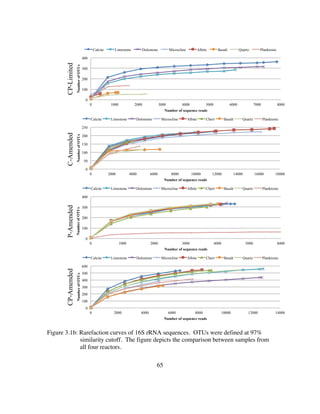
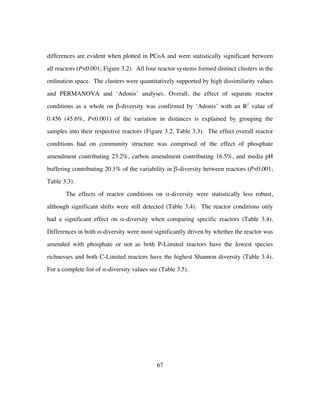
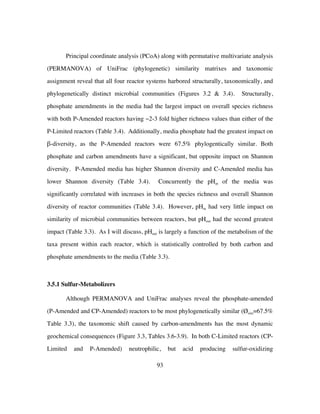
![9
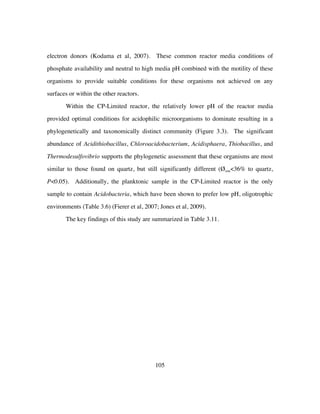
However, this study is likely the first to statistically link the phylogenetic diversity of
microbial communities to specific natural surface types under a variety of geochemical
conditions. Additionally, I coin the term mineraltrophic and define it as microorganisms
with a genetically ingrained affinity for specific mineral types.
Chapter 4 is an investigation into the effect of non-photosynthetic communities on
stable carbon isotope signatures. I test the viability of using the biogeochemical
dynamics of carbon cycling by sulfur metabolizers in sulfuric acid karst environments to
infer microbial community structure and function using δ13
CCO2. Here I inoculate
separate flow-through bioreactors with 1) a pure culture of mixotrophic sulfur-oxidizing
Thiothrix unzii and 2) a mixed culture (composed of SOB and SRB) from LKC to see if
metabolic shifts can be detected by monitoring select geochemical indicators (δ13
CCO2,
[CO2], Ca2+
, and pH). I find that changes in carbonate solubility are uniquely and
adequately sensitive to changes in sulfur metabolizing community function. Carbonate
dissolution is ~13X faster than abiotic rates when a reactor community is dominated by
autotrophic sulfur-oxidizers. The increased dissolution and preferential reduction of
12
CCO2 over 13
CCO2, causes heavier δ13
CCO2 that is enriched up to +3.8‰. Under
heterotrophic conditions, sulfate-reduction pathways dominate causing decreased
carbonate dissolution rate. The slower rate and preferential oxidation of 12
CAcetate causes
lighter δ13
CCO2 values depleted in 13
C to values as low as -36‰. Using 16S rRNA
sequences of communities, during specific metabolic intervals, I show that this is an ideal
system to use stable carbon isotopes to infer community structure and function.
Additionally, this study documented the responsiveness of guild composition in a
microbial community to geochemical stimuli. Future studies using this method have the
potential to resolve microbial community function, composition, and carbon balance to at
unprecedented levels of detail.](https://image.slidesharecdn.com/e7dfd69b-aed2-40be-a698-a68cb2702da4-160817180109/85/JONES-DISSERTATION-2015-31-320.jpg)

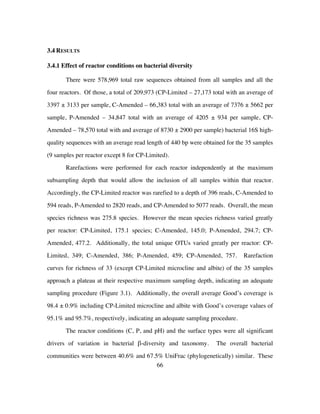
![16
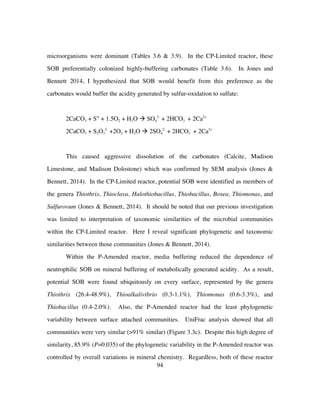
coupon holders and harvesting the coupons. A typical experiment was three weeks in
duration.
The reaction solution was prepared by equilibrating DI-H2O water with finely
powdered Iceland spar calcite. Equilibrium status, with respect to calcite, was
determined by analysis of DIC, [Ca2+
], and pH. This solution was then filtered to 0.2 μm
and 8.3 ml of 0.1 N H2SO4, 0.1 g MgSO4 and 0.25 g NH4Cl was added per liter and
autoclaved at 121o
C for 45 minutes before adding 2 ml/L and 5 ml/L of filter-sterilized
trace metal solution and Wolfe’s Vitamin solution, respectively (Burlage, 1998).
The final prepared solution had a pH of ~6.9 and contained (approximately) 0.1
mM HCO3
−
, 0.83 mM SO4
=
and 1.0 mM Ca2+
, with a typical saturation state with respect
to calcite (Ωcalcite) of ~0.01 (SI~-2). Where, Ωcalcite=IAP/Ksp, IAP is the ion activity
product (aCa2+
· aCO3
2−
) and Ksp is the calcite solubility product. Six hundred ml of this
solution was transferred to a vessel to be combined with the reduced sulfur source, and
pumped aseptically through the reactor at 1.2 ml/min. The reduced sulfur electron donor
was S2O3
2-
and was prepared from a stock filter sterilized 1M solution of Na2S2O3 mixed
in-line via a syringe pump to a final concentration of 0.83 mM. Reactor volume was held
constant at 400 ml, and the outflow tubing was outfitted with a glass bubble trap to
ensure no microbial contamination from drainage.
2.3.1 Mineral Substrata Preparation
Bulk mineral specimens of Iceland spar calcite (calcite), Ontario microcline
(microcline), albite, chert, Columbia River basalt (basalt), and quartz were obtained from](https://image.slidesharecdn.com/e7dfd69b-aed2-40be-a698-a68cb2702da4-160817180109/85/JONES-DISSERTATION-2015-38-320.jpg)
![109
Chapter 4: Biogeochemical dynamics of sulfuric-acid speleogenesis: A
proof of concept environment for inferring microbial community
structure and function using δ13
CCO2
4.1 ABSTRACT
Our previous investigations revealed significant variation in microbial community
structure as a result of changing surface chemistry and metabolites. Carbonate mineral
solubility is particularly sensitive to the metabolic byproducts of sulfur metabolizing
communities. Bacterial carbon cycling, through the reduction of CO2 or oxidation of
reduced carbon substrates like acetate, are associated with a kinetic isotope effect (KIE)
which discriminates against 13
C. This could lead to significant, but unique carbon isotope
signatures, dependent on the function of an active microbial community. Here I
inoculated separate flow through bioreactors with 1) a pure culture of mixotrophic sulfur-
oxidizing Thiothrix unzii and 2) a mixed culture (composed of SOB and SRB) from LKC
to see if these shifts could be detected by monitoring select geochemical indicators
(δ13
CCO2, [CO2], Ca2+
, and pH). I found that the mixed community reactor was
geochemically dynamic and prediction of dominant metabolisms and guild composition
(e.g. sulfide-oxidizers, sulfate-reducers, autotrophs, heterotrophs) was indeed possible.
During heterotrophic sulfur reduction, the preferred consumption of [12
C] acetate caused
δ13
CCO2 to become depleted in 13
C. Conversely, during autotrophic sulfur oxidation to
sulfate, the preferred consumption of 12
CCO2 caused δ13
CCO2 to become enriched in 13
C.
Additionally, I was able to assess the effects of these rapid community functional shifts
on carbonate dissolution rate. I found that dissolution was fastest (13.2X abiotic rates) in
pure cultures of SOB and (8.8X abiotic rates) in mixed cultures when no external sulfur
or acetate was provided. Furthermore, 16S rRNA sequencing during selected intervals
reveal rapid adaptation of community structure and membership to changes in](https://image.slidesharecdn.com/e7dfd69b-aed2-40be-a698-a68cb2702da4-160817180109/85/JONES-DISSERTATION-2015-131-320.jpg)
![112
reaction (1) yields much less free energy than reaction (2) for each mol of acetate
oxidized. Therefore, to do the same amount of work, a sulfur reducer would have to use
much more acetate, resulting in a larger isotope fractionation and thus a lighter δ13
CCO2
(Goevert & Conrad, 2009).
Additionally, when these reactions take place in a carbonate system, the relative
impact on pH will have consequences on carbonate solubility. While the response in
carbonate dissolution rate will not reveal all utilized reaction pathways, it should be an
indicator of the dominant reaction pathway. For example, a primary reaction pathway
using reaction (2), would consume 3mol of H+
for every 1mol of acetate. This would
cause a greater pH increase and drop in Δ[Ca2+
] than reaction (1). In a calcite
undersaturated system, this would also decrease carbonate dissolution rate, resulting in
lower [CO2(g)] and lighter δ13
CCO2 than when reaction (1) is the primary pathway.
Herein, I intend to exploit the aforementioned geochemical intricacies, along with
a few others, to predict changes in microbial community structure by monitoring simple
geochemical parameters (i.e. pH, pCO2, 13
CO2, 12
CO2, Ca2+
). This is an investigation into
the fundamental nature of the microbe mineral relationship. Therefore, the goal is not to
absolutely quantify an effect, but to gain further insight into the nature of these
interactions. In order to monitor these variations, I outfitted a continuous flow bioreactor
with a Picarro Wavelength-Scanned Cavity Ring Down Spectrometer (WS-CRDS) which
continuously monitored and logged [CO2], [12
CO2], and [13
CO2]. I simultaneously
monitored [Ca2+
] and pH in order to quantify the impact of microbial metabolism on
limestone dissolution rate. Additionally, I utilize high-throughput 454-pyrosequencing
(Margulies et al, 2005) of bacterial 16S rRNA sequences to confirm that changes in the
microbial community structure support the inferred functional reaction pathways
indicated by geochemical trends. I hypothesize that prediction of dominant metabolisms](https://image.slidesharecdn.com/e7dfd69b-aed2-40be-a698-a68cb2702da4-160817180109/85/JONES-DISSERTATION-2015-134-320.jpg)
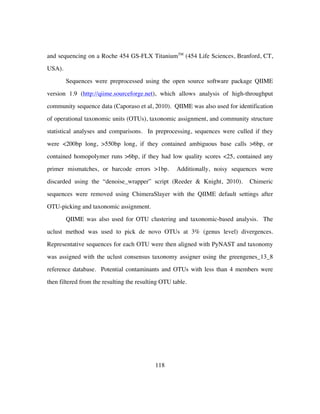
![114
maintaining a constant reactor headspace of 400ml. Additionally, I outfitted the
continuous flow bioreactors with a Picarro Wavelength-Scanned Cavity Ring Down
Spectrometer (WS-CRDS) that continuously monitored and logged 12
CO2 and 13
CO2 of
the air in the reactor headspace at ppmv sensitivity and isotope ratios at <0.3‰ precision.
The pump on the Picarro draws air at ~25 ml/min. The pH within each reactor was
logged at regular intervals using an Omega pH probe and OM-CP-Bridge-110-10 data
logger. Water samples were collected periodically from the outflow of both chambers
and analyzed for [DIC] and alkalinity. [Ca2+
] was monitored and logged using an [Ca2+
]
ion specific electrode (ISE). [Ca2+
] was verified periodically by measuring total hardness
by EDTA titration (Eaton et al, 2005), and by ICP-MS analysis. The change in hardness
over time was the result of changing [Ca2+
] due to dissolution of the Madison Limestone.
Periodic thiosulfate concentrations were measured by the Sulfite Iodometric method
(Eaton et al, 2005). Dissolved sulfide and sulfate were measured against standards by
methylene blue complex and turbidimetric method, respectively (Chemetrics). The
laboratory reactor is illustrated in Figure 4.1.
CO2 isotope compositions are reported in the usual δ-notation (e.g., δ13
C)
expressed here in permil (‰) and defined as follows:
𝛿! =
𝑅! !"#$%&
𝑅! !"#$%#&%
− 1 10!
‰
where Ra is the 13
C/12
C ratios relative to the PDB standards.
Furthermore, the carbon isotope fractionation between two end members (A and
B) will be expressed as Δ13
CA−B. which is defined as Δ13
CA−B= δ13
CA − δ13CB. In the](https://image.slidesharecdn.com/e7dfd69b-aed2-40be-a698-a68cb2702da4-160817180109/85/JONES-DISSERTATION-2015-136-320.jpg)
![120
4.4 RESULTS
4.4.1 Abiotic Experiments
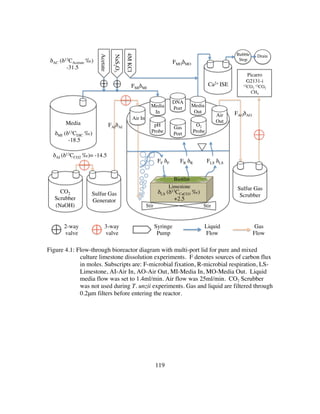
The average dissolution rate for abiotic reactor experiments varied slightly due to
geochemical parameters (addition of acetate, S2O3
2-
, both, or neither) of the media (Table
4.1). However, once each experiment reached steady state, abiotic limestone dissolution
rate, pH, and [Ca2+
] remained constant. For each of the abiotic experiments steady state
was reached within 24 hours of initiation. During initial equilibration with limestone the
pH rose to ~8.3 which is consistent with a water in equilibrium with calcite and
atmospheric CO2. Overall, the mean dissolution rate over the entirety of the abiotic
experiment was 2.97 × 10⁻¹¹
mol•cm-2
•s-1
. SEM images of the limestone retrieved from
an abiotic reactor run under identical conditions showed no obvious evidence of
dissolution (See Chapter 2: Figure 2.3).
To mimic the conditions of the bioreactor experiments, abiotic reactors were run
with CO2 scrubbed air and with ambient CO2 from the lab. When compared to the biotic
reactors, there was relatively little variability in the δ13
CCO2 of the headspace gas within
the abiotic reactor regardless if the air input was CO2 scrubbed or not. By definition,
when ambient CO2 was not supplied CO2 flux was due to exchange of DIC with
headspace gas and carbonate dissolution. In the non-CO2 scrubbed abiotic reactor, the
mean value of δ13
CCO2 was lowest (-12.6‰) when the media was amended with 9.7 mM
acetate. However, δ13
CO2 of the headspace was nearly identical when S2O3
2-
was added (-
12.1‰). In the abiotic reactor with ambient CO2, there was minor variability in δ13
CCO2
values (Table 4.2). Only when neither acetate nor S2O3
2-
was added to the CO2 scrubbed
reactor did the abiotic mean δ13
CCO2 reached -8.1‰ (Table 4.3). However, δ13
CCO2 of the
ambient CO2 reactor was significantly lower (-19.2‰ to -18.6‰) when compared to the
CO2 scrubbed reactor (-12.6‰ to -8.1‰).](https://image.slidesharecdn.com/e7dfd69b-aed2-40be-a698-a68cb2702da4-160817180109/85/JONES-DISSERTATION-2015-142-320.jpg)
![121
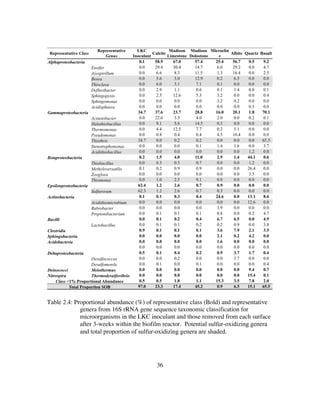
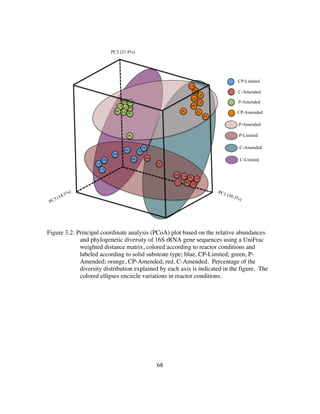
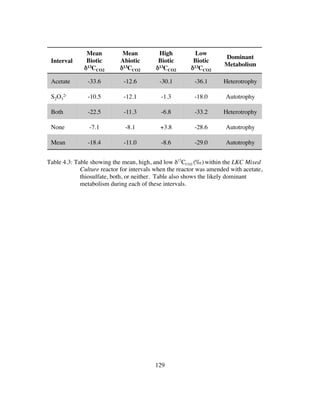
Figure 4.2: Log of CO2 gas concentration (atm) in the headspace and δ13
CCO2 (‰) within
the Thiothrix unzii pure culture reactor. Also shown are the flux from air in
CO2 gas concentration (atm) and the air in δ13
CCO2 (‰) since the air in for
this reactor was not CO2 scrubbed. Periods when acetate (Yellow),
thiosulfate (Blue), or both acetate and thiosulfate (Green) are shaded
accordingly. Note that this figure shows a representative period taken from
the much longer experiment.
-30
-25
-20
-15
-10
-5
0.00E+00
5.00E-04
1.00E-03
1.50E-03
2.00E-03
0 1000 2000 3000 4000 5000 6000 7000
δ13CO2
Time (min)
12CO2 atm
Background 12CO2 (atm)
δ13CO2
Background δ
Time (min)
Acetate S2O3
2- Both
1000 2000 3000 4000 5000 6000 70000
-30
2.0
1.5
1.0
-20
-25
0.5
0
δ13CCO2 (‰)
[CO2]
Headspace
δ13CCO2
Headspace
[CO2]
Airin
δ13CCO2
Airin
-15
-10
-5
[CO2]×10-3(atm)](https://image.slidesharecdn.com/e7dfd69b-aed2-40be-a698-a68cb2702da4-160817180109/85/JONES-DISSERTATION-2015-143-320.jpg)

pH
[Ca2+]pH
Time (min)
Acetate S2O3
2- Both](https://image.slidesharecdn.com/e7dfd69b-aed2-40be-a698-a68cb2702da4-160817180109/85/JONES-DISSERTATION-2015-145-320.jpg)
![125
4.4.2 Thiothrix unzii Experiments
As stated in Methods, the Thiothrix unzii experiments failed to produce viable
cultures without an outside source of CO2. Therefore, the pure culture experiments were
run with an ambient source of filtered laboratory air with an ambient [CO2] averaging
~450ppm and δ13
CCO2 of air in (δAI) of -14.6‰. It should be noted that both [CO2] and
δ13
CCO2 of the ambient air were sensitive to laboratory conditions (e.g. human presence
and diurnal fluctuations). The flux of carbon in from the air (FAI) was 5.0 × 10⁻⁷
± 3.4 ×
10-8
mol•min-1
as C. The flux of carbon in from the media (FMI) was negligible at 4.0 ×
10-10
± 2.1 × 10⁻¹¹
mol•min-1
as C. Additional reactor constraints are shown on Figure 1.
Overall, the mean δ13
CCO2 was -16.8‰. When amended with acetate the
headspace δ13
CCO2 was lighter with a mean value of -22.5‰. The mean δ13
CCO2 was
heaviest, most 13
C enriched, when neither acetate nor S2O3
2-
were supplied (Table 4.1).
The headspace δ13
CCO2 increased sharply, by as much as ~20‰ in about 65 minutes, when
acetate supply is shut off (Figure 4.2). The highest δ13
CCO2 recorded in this experiment
was -5.1‰ and the lowest was -25.7‰ (Table 4.1). It should be noted that these highs
and lows in δ13
CCO2 coincided with highs and lows in [CO2] (Figure 4.2).
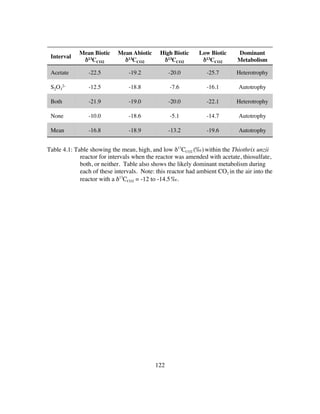
The pH and dissolution rates achieved within the reactor inoculated with pure
cultures of T. unzii were dynamic and quickly responded to environmental stimuli (Figure
4.3). The mean rate of dissolution achieved in this reactor (1.40 × 10⁻¹⁰
mol.
cm-2.
s-1
) is
~4.8X faster than the mean abiotic rate (Table 4.2). The addition of acetate only resulted
in a mean increase in dissolution rate ~1.80X faster than the abiotic rate and ~1.57X
faster when added with S2O3
2-
. The mean increase in dissolution rate when only S2O3
2-
was supplied to the media was ~7.7X faster than the mean abiotic rate with a high of
~9.8X faster (Table 4.2).](https://image.slidesharecdn.com/e7dfd69b-aed2-40be-a698-a68cb2702da4-160817180109/85/JONES-DISSERTATION-2015-147-320.jpg)
![127
At times, these δ13
CCO2 values were heavier than the δ13
CCO2 of the Madison limestone and
lower than that of the acetate substrate (Figure 4.4). Additionally, it should be noted that
the highs and lows in δ13
CCO2 generally opposed the highs and lows in [CO2 (g)], showing
an opposite trend to that seen in T. unzii experiments (Figure 4.4).
The pH and dissolution rates achieved within the mixed culture reactor were
dynamic, but responded less quickly to environmental stimuli (Figure 4.5). The mean
rate of dissolution achieved in this reactor (8.9 × 10⁻¹¹
mol•cm-2
•s-1
) is ~4.3X faster than
the mean abiotic rate (Table 4.4). The addition of acetate resulted in a mean increase in
dissolution rate ~1.1X faster than the abiotic rate, and at times even resulted in negative
ΔCa2+
(Table 4.4; Figure 4.5). When S2O3
2-
alone was added to the media the mean
dissolution rate was ~3.8X faster than the mean abiotic rate with a high of ~4.2X faster
(Table 4.4). When S2O3
2-
and acetate were added the mean dissolution rate was cut in
half (Table 4.4).
Similar to the T. unzii reactor, immediately after supply of acetate and thiosulfate
are removed the system geochemistry has the most dramatic response (Figure 4.5).
However, where these changes in the T. unzii occur over the course of minutes, in the
mixed culture reactor these changes occurred over the course of thousands of minutes (up
to 2500 minutes; ~42 hours) whereby the pH of the entire reactor would shift as much as
2 log units (Figure 4.5). The highest pH values (pH~8.6) and dissolution rate (2.7 × 10⁻¹⁰
mol•cm-2
•s-1
; ~8.8X faster than abiotic) were recorded during one of these intervals
(Table 4.5). Overall, the mean dissolution rate during these periods (1.5 × 10⁻¹⁰
mol•cm-
2
•s-1
) was ~4.9X faster than mean abiotic rates and ~1.7X faster than the mean mixed
culture rate (Table 4.4).](https://image.slidesharecdn.com/e7dfd69b-aed2-40be-a698-a68cb2702da4-160817180109/85/JONES-DISSERTATION-2015-149-320.jpg)
![128
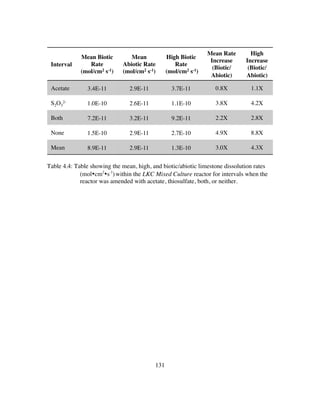
Figure 4.4: Log of CO2 gas concentration (atm) in the headspace and δ13
CCO2 (‰) within
the LKC Mixed Culture reactor. Also shown are the δ13
CAcetate (‰) and
δ13
CCaCO3 (‰) from limestone. The CO2 was scrubbed from the air into this
reactor. Periods when acetate (Yellow), thiosulfate (Blue), or both acetate
and thiosulfate (Green) are shaded accordingly. Note that this figure shows a
representative period taken from the much longer experiment.
-45
-40
-35
-30
-25
-20
-15
-10
-5
0
5
0.00E+00
2.00E-04
4.00E-04
6.00E-04
8.00E-04
1.00E-03
1.20E-03
1.40E-03
1.60E-03
1.80E-03
0 5000 10000 15000 20000 25000 30000 35000
12CO2%atm%
Measured%δ13CO2%
5000 10000 25000 30000 350000
Time (min)
Acetate S2O3
2- Both
15000 20000
-30
-20
-25
[CO2]
Headspace
δ13CCO2
Headspace
δ13CAcetate
δ13CCaCO3
Limestone
-15
0
+5
-35
-40
-45
-30
-5
1.8
1.2
0.2
0
1.6
1.4
1.0
0.6
0.4
0.8
[CO2]×10-3(atm)
δ13CCO2(‰)](https://image.slidesharecdn.com/e7dfd69b-aed2-40be-a698-a68cb2702da4-160817180109/85/JONES-DISSERTATION-2015-150-320.jpg)

pH
[Ca2+]pH
Time (min)
Acetate S2O3
2- Both
5.5
5.0](https://image.slidesharecdn.com/e7dfd69b-aed2-40be-a698-a68cb2702da4-160817180109/85/JONES-DISSERTATION-2015-152-320.jpg)

![140
dissolution rates (2.1-2.8X mean abiotic rates) coincided with intervals where acetate was
supplied (Table 4.2). During periods when acetate was supplied T unzii was using
heterotrophy by the following reaction (Nielsen et al, 2000):
2CH3COO−
+ S2O3
2−
+ O2 + 2H+
à So
+ SO3
2−
+ 4CO2 + 4H2O (3)
ΔGo
= +26.8kJ•(mol S-substrate)−1
Acetate supplied with S2O3
2−
has been shown to increase the efficacy of S2O3
2−
conversion to So
and SO3
2−
as well as expedite S2O3
2−
oxidation to SO4
2−
in the presence of
O2 (Nielsen et al, 2000). Herein, this causes small increases in the pH of the reactor
during these periods, a decrease in ΔCa2+
, and a significantly lighter mean value of
δ13
CCO2 (Figure 4.8A). Despite the decrease in limestone dissolution rate, the increased
metabolic production of CO2 by heterotrophy shown in reaction (3) increases headspace
[CO2] (Figure 4.2). The headspace [CO2] rises to a slightly higher [CO2], but much
lighter δ13
CCO2 than the δ13
CCO2 of the Airin (Figure 4.8A). This is most likely due to
selective oxidation of 12
CAcetate and results in a Δ13
CHS−Air≅8-12‰ (Figure 4.8A).
When acetate was supplied without S2O3
2-
, heterotrophy is again performed by T.
unzii through the following reaction (Nielsen et al, 2000):
2So
+ 2CH3COO−
+ 7O2 à 2SO4
2−
+ 4CO2 + 2H+
+ 2H2O (4)
ΔGo
= -507.4kJ•(mol S-substrate)−1
Whereby, mixotrophic strains of Thiothrix have been shown to pair acetate with
sulfur oxidation against oxygen, resulting in increased growth yield (Nielsen et al, 2000;
Odintsova et al, 1993). This causes a slightly higher mean dissolution rate than the](https://image.slidesharecdn.com/e7dfd69b-aed2-40be-a698-a68cb2702da4-160817180109/85/JONES-DISSERTATION-2015-162-320.jpg)
![141
acetate and S2O3
2-
intervals as there is some light acid production from oxidation of
internal So
(Figure 4.8B). This was confirmed by measuring production of SO4
2−
(0.08mM) during these intervals (Table 4.6). Additional confirmation comes from the
increase in [CO2] and lighter δ13
CCO2 than when acetate and S2O3
2-
are supplied (Table 4.1;
Figure 4.2; Figure 4.8).
Major geochemical changes occurred when S2O3
2-
was provided in the absence of
acetate. The significant increase in [CO2] and enrichment of δ13
CCO2 in 13
CO2 are
accompanied by a large drop in pH and increase in [Ca2+
]. This trend is indicative of a
switch towards autotrophy by the T. unzii that likely follows this reaction (Kelly, 1999):
6CO2 + 3S2O3
2–
+ 9H2O à C6H12O6 + 6SO4
2–
+ 6H+
(5)
ΔGo
= -738.4kJ•(mol S-substrate)−1
This reaction also selects for the relatively light 12
CO2 over 13
CO2 leaving the
headspace reservoir heavier (Figure 4.2, Figure 4.8C). Although CO2 is being consumed
through autotrophy the [CO2] increases dramatically due to the significant increase in
limestone dissolution and drop in pH of the media, which release CO2 back into the
headspace (Figure 4.8C). As further confirmation of this reaction pathway, sulfur species
measurements during these periods showed a complete removal of S2O3
2-
from the media
across the reactor (Table 4.6). This was accompanied by SO4
2-
production to a ~1.25X
higher concentration than S2O3
2-
consumed (Table 4.6).
The highest rates of limestone dissolution were recorded when no acetate or
S2O3
2-
were provided (Table 4.2, Figure 4.8D). During these intervals the heaviest
δ13
CCO2, highest CO2, and lowest pHs were also recorded. This trend is again indicative
of autotrophy that likely follows this reaction:](https://image.slidesharecdn.com/e7dfd69b-aed2-40be-a698-a68cb2702da4-160817180109/85/JONES-DISSERTATION-2015-163-320.jpg)
![142
6CO2 + 4S° + 10H2O à C6H12O6 + 4SO4
2-
+8H+
(6)
ΔGo
= -507.4kJ•(mol S-substrate)−1
Thiothrix unzii has been shown to oxidize internally stored sulfur during these
periods when S2O3
2-
is withheld (Steinhauer et al, 2010). Production of SO4
2-
was
confirmed photometrically at mean concentrations of ~1.90mM during these periods
(Table 4.6). Again the increased [CO2] despite autotrophy is due to the significant
increase in limestone dissolution (~13X abiotic rates) and drop in pH (up to 2 log units)
of the media, which release relatively heavy CO2 (Δ13
CLS−Air≅16‰) back into the
headspace (Figure 4.3; Figure 4.8D).](https://image.slidesharecdn.com/e7dfd69b-aed2-40be-a698-a68cb2702da4-160817180109/85/JONES-DISSERTATION-2015-164-320.jpg)
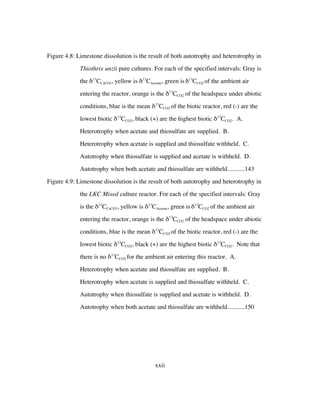
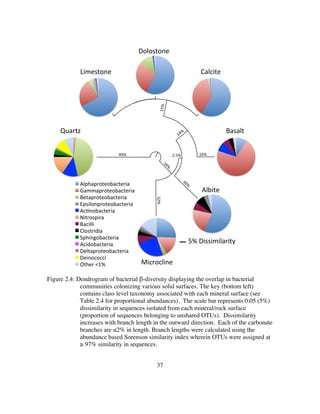
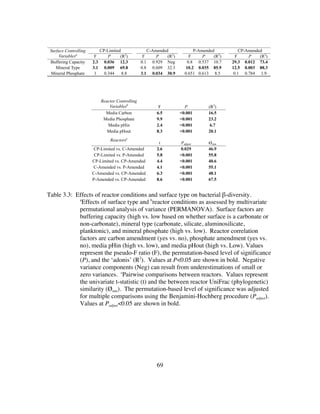
![143
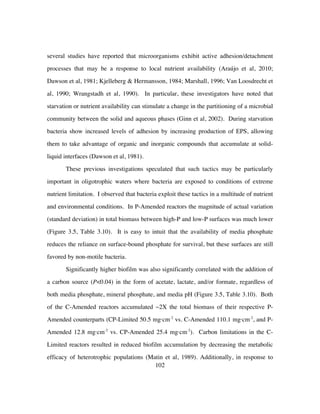
Figure 4.8: Limestone dissolution is the result of both autotrophy and heterotrophy in
Thiothrix unzii pure cultures. For each of the specified intervals: Gray is the
δ13
CCaCO3, yellow is δ13
CAcetate, green isδ13
CCO2 of the ambient air entering the
reactor, orange is the δ13
CCO2 of the headspace under abiotic conditions, blue
is the mean δ13
CCO2 of the biotic reactor, red (-) are the lowest biotic δ13
CCO2,
black (+) are the highest biotic δ13
CCO2. A. Heterotrophy when acetate and
thiosulfate are supplied. B. Heterotrophy when acetate is supplied and
thiosulfate withheld. C. Autotrophy when thiosulfate is supplied and acetate
is withheld. D. Autotrophy when both acetate and thiosulfate are withheld.
Acetate +
Thiosulfate
Acetate
Thiosulfate
Neither
0 +5-5-10-15-20-25-30-35-40
Air In Biotic MeanAcetateLimestone Abiotic Biotic HighBiotic Low
Δ[CO2]
0
LS Dis. Rate
Biotic/Abiotic
0 5 10 15
δ13CCO2 (‰ PDB)
2CH3COO− + S2O3
2− + O2 + 2H+ à So + SO3
2− + 4CO2 + 4H2O
Δδ13CCO2= -9.0‰
A
2So + 2CH3COO− + 7O2 à 2SO4
2− + 4CO2 + 2H+ + 2H2O
Δδ13CCO2= -8.4‰
B
6CO2 + 3S2O3
2– + 9H2O à C6H12O6 + 6SO4
2– + 6H+
Δδ13CCO2= +1.0‰
C
6CO2 + 4S0 + 10H2O à C6H12O6 + 4SO4
2- + 8H+
Δδ13CCO2= +3.5‰
D
Δδ13CCO2= -12.7‰
Δδ13CCO2= -8.6‰
Δδ13CCO2= +5.9‰
Δδ13CCO2= +8.4‰](https://image.slidesharecdn.com/e7dfd69b-aed2-40be-a698-a68cb2702da4-160817180109/85/JONES-DISSERTATION-2015-165-320.jpg)
![144
4.5.2 Limestone Dissolution by LKC Mixed Communities
Our previous investigations revealed significant variation in microbial community
structure, composition, and growth (See Chapter 3). Here I inoculated a reactor with a
mixed culture from LKC to see if I could detect these shifts by monitoring select
geochemical indicators (δ13
CCO2, [CO2], Ca2+
, and pH). I found that the mixed
community reactor was geochemically dynamic and prediction of dominant metabolisms
and guild makeup was indeed possible. Figure 4.9 serves to summarize the impact of
LKC mixed communities on limestone dissolution under heterotrophic (acetate +
thiosulfate, acetate only) and autototrophic (thiosulfate only, thiosulfate and acetate
withheld) conditions and the inferred dominant metabolic pathways during these
intervals.
The inoculant was primarily composed of putative SOB (81.0%) most closely
related to members of the genera Thiothrix and Sulfurovum (Table 4.5). The inoculant
also contained putative SRB (12.0%) composed exclusively of members of the genus
Desulfovibrio. The presence of a diverse consortium, composed of autotrophs,
mixotrophs, and heterotrophs is confirmation that the inoculant was ideal to test our
hypotheses. Additionally, this inoculant is very similar to the inoculant used in
bioreactors from Chapters 2 and 3 (Jones & Bennett, 2014).
Shortly after inoculation, the media was amended with S2O3
2−
and acetate.
Although there were periods of both high and low reactor pH, after equilibration, pH was
relatively high and ΔCa2+
was relatively low during these intervals (Figure 4.5).
Additionally, the lightest mean and overall δ13
CCO2 were achieved during these intervals
(Figure 4.4). This indicates heterotrophy and when combined with geochemical trends
suggests dominance of the reaction pathway (Cypionka, 2000):](https://image.slidesharecdn.com/e7dfd69b-aed2-40be-a698-a68cb2702da4-160817180109/85/JONES-DISSERTATION-2015-166-320.jpg)
![145
CH3COO−
+ S2O3
2−
+ O2 + 2H+
à So
+ SO3
2−
+ 4CO2 + 4H2O (7)
ΔGo
= +26.8kJ•(mol S-substrate)−1
This ability to pair sulfur-reduction with O2 reduction to H2O has been shown in
Desulfovibrio in previous experiments and has been implicated in carbonate precipitation
(Cypionka, 2000; Dupraz et al, 2009). During these intervals, as δ13
CCO2 decreases there
is a proportional increase in headspace [CO2] consistent with the increased metabolic
production of CO2 by heterotrophy shown in this reaction (Figure 4.4; Figure 4.9A).
Interestingly, this reaction generally consumes acidity, but there is still a net
increase in limestone dissolution rate of ~2.8X abiotic rates (Table 4.4; Figure 4.9A).
Additionally, for these time periods SO4
2-
was measured at 0.28mM and all 0.89mM
S2O3
2-
was consumed. The increase in dissolution rate was nearly identical to that
achieved in pure culture experiments using heterotrophy, but ~4X as much SO4
2-
was
generated in the mixed culture reactor (Table 4.6). This suggests the following reaction
pathway is also taking place driven by autotrophic SOB (Kelly, 1999):
2So
+ 3O2 + 2H2O à 4SO4
2−
+ 4H+
(8)
ΔGo
= -507.4kJ•(mol S-substrate)−1
Examination by light microscopy revealed visible sulfur globules in filaments
before and absence of these globules after these intervals. The ability to oxidize
internally stored sulfur by Thiothrix spp. has been shown previously (Howarth et al,
1999; Steinhauer et al, 2010).
During intervals when acetate was supplied without S2O3
2-
, the mean dissolution
rate is nearly identical to the abiotic rate (Table 4.4; Figure 4.9B). However, the mean](https://image.slidesharecdn.com/e7dfd69b-aed2-40be-a698-a68cb2702da4-160817180109/85/JONES-DISSERTATION-2015-167-320.jpg)
![146
δ13
CCO2 during these intervals is up to ~21.9‰ lighter than the mean abiotic δ13
CCO2;
indicating heterotrophy (Figure 4.9B). This trend combined with the increased [CO2] and
high pHs during these intervals suggests the dominant reaction pathway (Goevert &
Conrad, 2009):
CH3COO−
+ SO4
2−
à HS−
+ 2CO2 + 2OH−
(9)
ΔGo
= -24.2kJ•(mol S-substrate)−1
This was validated by detection of sulfide during this interval (Table 4.6). It
should be noted that both olfactory and photometric methods detected sulfide.
During a period of sulfide production, I aseptically removed biomass from the
bioreactor for 16S rRNA sequencing. Results of this analysis revealed significant
taxonomic changes to the community compared to the inoculant (Table 4.5). The
overwhelming dominance of Desulfovibrio is consistent with previous bioreactor
experiments amended with acetate whereby the addition of acetate to reactors promoted
chemoheterotrophic growth (See Chapter 3).
Indeed, Desulfovibrio is a motile, heterotrophic, sulfur-reducing microorganism
capable of growth on a variety of sulfur substrates, including S2O3
2-
and SO4
2−
(Cypionka,
2000; Liu & Peck, 1981). If the metabolism of members of this genus went unchecked,
the resulting pH increase might lead calcite precipitation. However, sequencing also
revealed the minor presence of SOB (8.1%) in this community. The presence of SOB
here, but not in the community attached to limestone in the acetate-amended reactor from
Chapter 3 is likely due to frequent changes in geochemical conditions within these
reactors from autotrophic to heterotrophic.](https://image.slidesharecdn.com/e7dfd69b-aed2-40be-a698-a68cb2702da4-160817180109/85/JONES-DISSERTATION-2015-168-320.jpg)
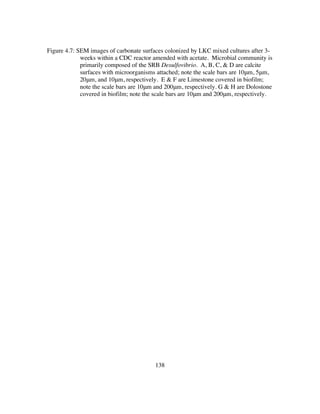
![148
passive mineralization where the mineral surface serves as the template for crystal
nucleation (Dupraz et al, 2009; Perry et al, 2007). The spherical microbialite structures
that are present on Madison Limestone and Madison Dolostone (Figure 4.7F&H) are
consistent with calcium carbonate structures resulting directly from concentrated
microbial metabolism due to high biomass concentration; whereby the significant EPS
and organic matrix serves as the template for crystal morphologies (Dupraz et al, 2009).
Limestone dissolution rates were highest during intervals when acetate was not
supplied (Table 4.4; Figure 4.9C&D). Geochemical trends during these intervals
suggested autotrophy to be dominant (Figure 4.9C&D). In both of these intervals δ13
CCO2
became heavier, [CO2] increased, pH dropped, and [Ca2+
] increased (Figure 4.4 & Figure
4.5). These trends suggest the following reactions to be dominant:
6CO2 + 3S2O3
2–
+ 9H2O à C6H12O6 + 6SO4
2–
+ 6H+
(10)
ΔGo
= -738.7kJ•(mol S-substrate)−1
when S2O3
2-
was supplied and:
6CO2 + 4S° + 10H2O à C6H12O6 + 4SO4
2-
+8H+
(11)
ΔGo
= -507.4kJ•(mol S-substrate)−1
if neither S2O3
2-
nor acetate were supplied (Kelly, 1999).
Stoichiometrically, reaction (11) produces more acidity and lead to greater
dissolution rates. Indeed, when S2O3
2-
is supplied, limestone dissolution takes place at
nearly half the rate as when none is supplied (Table 4.4, Figure 4.9C&D). Additionally,
sulfide and sulfate were both produced, indicating minor heterotrophy taking place within](https://image.slidesharecdn.com/e7dfd69b-aed2-40be-a698-a68cb2702da4-160817180109/85/JONES-DISSERTATION-2015-170-320.jpg)
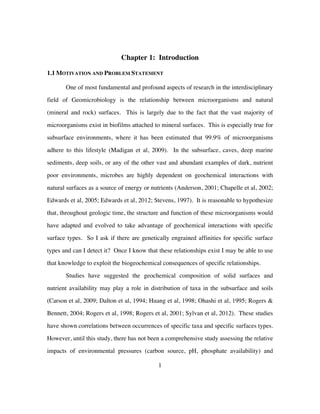
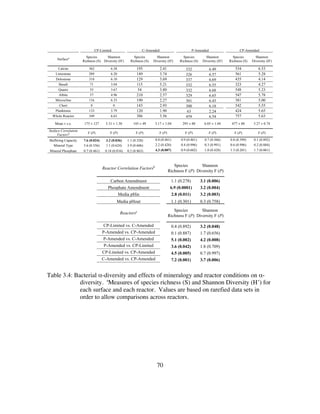
![150
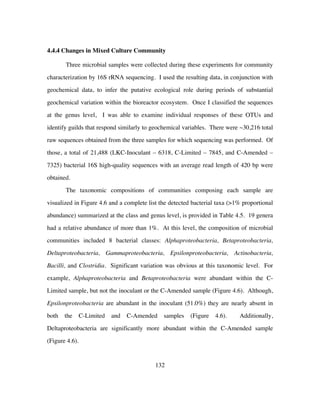
Figure 4.9: Limestone dissolution is the result of both autotrophy and heterotrophy in the
LKC Mixed culture reactor. For each of the specified intervals: Gray is the
δ13
CCaCO3, yellow is δ13
CAcetate, green isδ13
CCO2 of the ambient air entering the
reactor, orange is the δ13
CCO2 of the headspace under abiotic conditions, blue
is the mean δ13
CCO2 of the biotic reactor, red (-) are the lowest biotic δ13
CCO2,
black (+) are the highest biotic δ13
CCO2. Note that there is no δ13
CCO2 for the
ambient air entering this reactor. A. Heterotrophy when acetate and
thiosulfate are supplied. B. Heterotrophy when acetate is supplied and
thiosulfate withheld. C. Autotrophy when thiosulfate is supplied and acetate
is withheld. D. Autotrophy when both acetate and thiosulfate are withheld.
Acetate +
Thiosulfate
Acetate
Thiosulfate
Neither
0 +5-5-10-15-20-25-30-35-40
δ13CCO2 (‰ PDB)
Δ[CO2]
0
LS Dis. Rate
Biotic/Abiotic
0 2.5 5 7.5 10
2CH3COO− + S2O3
2− + O2 + 2H+ à So + SO3
2− + 4CO2 + 4H2O
Δδ13CCO2= -21.0‰
A
CH3COO− + SO4
2− à HS− + 2CO2 + 2OH−
Δδ13CCO2= -11.2‰
B
6CO2 + 3S2O3
2– + 9H2O à C6H12O6 + 6SO4
2– + 6H+
Δδ13CCO2= +1.6‰
C
6CO2 + 4S0 + 10H2O à C6H12O6 + 4SO4
2- + 8H+
Δδ13CCO2= +1.0‰
D
Air In Biotic MeanAcetateLimestone Abiotic Biotic HighBiotic Low
Δδ13CCO2= -23.5‰
Δδ13CCO2= +10.8‰
Δδ13CCO2= +11.9‰
Δδ13CCO2= -21.9‰](https://image.slidesharecdn.com/e7dfd69b-aed2-40be-a698-a68cb2702da4-160817180109/85/JONES-DISSERTATION-2015-172-320.jpg)
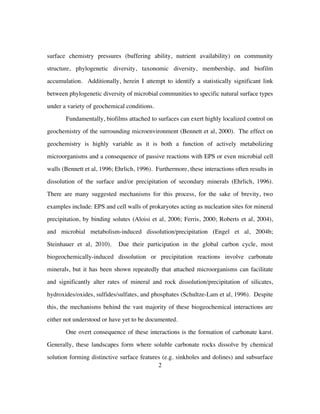
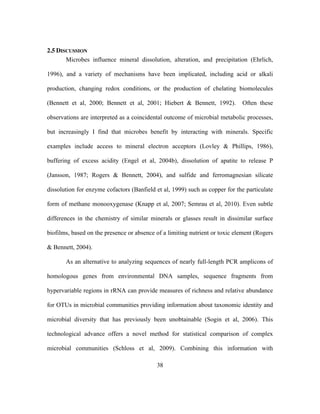
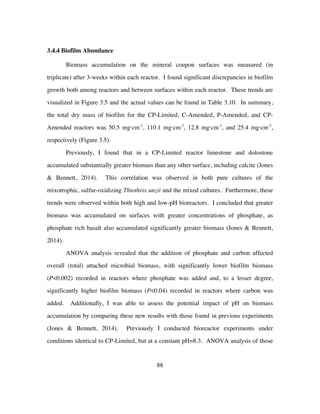
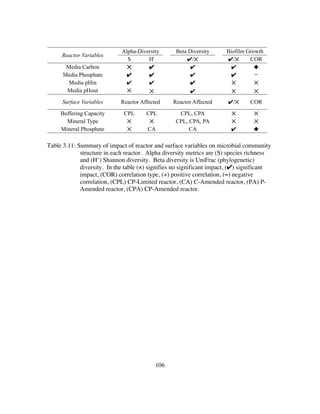
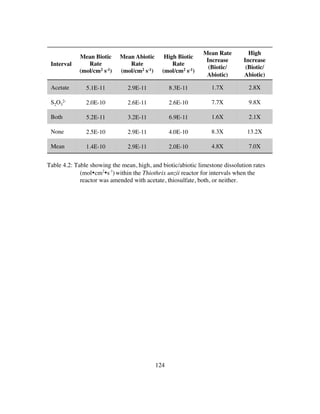
![151
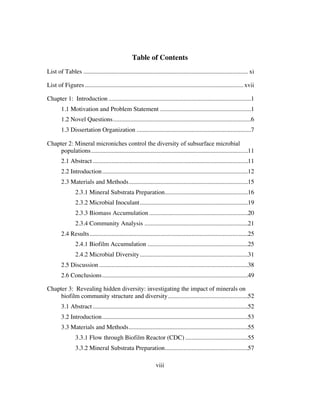
Table 4.6: Summary of mean Δ [Sulfur] (mM) of various sulfur species during specific
periods and overall summary of findings from this study. When S2O3
2-
in is
0.89mM, Acetate in is 2mM, SO4
2-
in from MgSO4 is 0.94mM.
S2O3
2-
(Yes/No)
Acetate
(Yes/No)
Δ13CHS
Mean
Δ[CO2]
Dominant Reaction Pathway
Dominant Metabolism
ΔS2O3
2-
(mM)
ΔSO4
2-
(mM)
ΔH2S
(mM)
LS Dis. Rate
Mean: High
(Biotic/Abiotic)
T.Unzii
Yes Yes ~0 ~0
2CH3COO− + S2O3
2− + O2 + 2H+ à So + SO3
2− + 4CO2 + 4H2O
Heterotrophic
-0.77 ~0 0 1.6X : 2.1X
No Yes Lighter ~0
2So + 2CH3COO− + 7O2 à 2SO4
2− + 4CO2 + 2H+ + 2H2O
Heterotrophic
N/A 0.08 0 1.7X : 2.8X
Yes No Heavier Increase
6CO2 + 3S2O3
2– + 9H2O à C6H12O6 + 6SO4
2– + 6H+
Autotrophic
-0.89 +1.10 0 7.7X : 9.8X
No No Heavier Increase
6CO2 + 4S0 + 10H2O à C6H12O6 + 4SO4
2- + 8H+
Autotrophic
N/A +1.90 0 8.3 : 13.2X
LKCMixedCulture
Yes Yes Lighter Increase
2CH3COO− + S2O3
2− + O2 + 2H+ à So + SO3
2− + 4CO2 + 4H2O
Heterotrophic
-0.89 +0.28 0 2.2X : 2.8X
No Yes Lighter Increase
CH3COO− + SO4
2− à HS− + 2CO2 + 2OH−
Heterotrophic
N/A +0.01 +0.22 0.8X : 1.1X
Yes No Heavier Decrease
6CO2 + 3S2O3
2– + 9H2O à C6H12O6 + 6SO4
2– + 6H+
Autotrophic
-0.89 +0.52 +0.17 3.8X : 4.2X
No No Heavier Decrease
6CO2 + 4S0 + 10H2O à C6H12O6 + 4SO4
2- + 8H+
Autotrophic
N/A +1.63 +0.04 4.9X : 8.8X](https://image.slidesharecdn.com/e7dfd69b-aed2-40be-a698-a68cb2702da4-160817180109/85/JONES-DISSERTATION-2015-173-320.jpg)
![152
4.6 CONCLUSIONS
Through these experiments, unique patterns emerged allowing me to link
geochemical trends to community structure and function. δ13
CCO2 of headspace gas can
be used in a bioreactor to distinguish between heterotrophic and autotrophic contribution
to CO2 efflux. However, this method may be limited to an experimental system
composed of metabolically sensitive peripheral geochemical indicators of metabolic
shifts. An ideal system would contain minerals near equilibrium conditions with the
liquid media and diverse functional communities able to metabolize under a wide range
of geochemical conditions. Herein, a laboratory reactor synthetic sulfuric acid carbonate
karst system met these criteria. Furthermore, the sensitivity and responsiveness of the
reaction kinetics of the carbonate system when exposed metabolic byproducts provided
insight into the constraints on biogenesis of sulfuric acid caves. By simultaneously
measuring and logging (δ13
CCO2, [CO2], Ca2+
, and pH), I showed increased calcite
dissolution rates up to ~13X abiotic rates under autotrophic conditions and limited
dissolution under heterotrophic conditions. Additionally, I observed complete shift of
metabolic function of the microbial communities and taxonomic composition within a
matter of hours. Community composition shifted from a SOB dominated inoculant, to
SRB dominated when supplied acetate, and finally back to SOB dominated when acetate
was withheld. These changes initiated within minutes of changing geochemical input.
Additionally, the methodology for monitoring changes laid out here is minimally invasive
to the community function, resulting in low experimental bias.
It is important to note that the goal was not to absolutely quantify an effect, but to
gain further insight into the nature of these interactions. Additional trends may be
observed through a more critical analysis of this substantial data set. Although it was
outside of the scope of this investigation, a mass balance of carbon concentrations and](https://image.slidesharecdn.com/e7dfd69b-aed2-40be-a698-a68cb2702da4-160817180109/85/JONES-DISSERTATION-2015-174-320.jpg)
![163
Dulov LE, Lein AY, Dubinina GA, Pimenov NV. (1991). Microbial Processes at the Lost
City vent field, mide-atlantic ridge. Microbiology 74: 97-103.
Dupraz C, Reid RP, Braissant O, Decho AW, Norman RS, Visscher PT. (2009).
Processes of carbonate precipitation in modern microbial mats. Earth-Science Reviews
96: 141-162.
Eaton AD, Clesceri LS, Rice EW, Greenberg AE. (2005). Standard Methods for the
Examination of Water and Wastewater, 21 edn. Washington, DC: American Public
Health Association, American Water Works Association, Water Environment Federation.
Eboigbodin KE, Ojeda JJ, Biggs CA. (2007). Investigating the Surface Properties of
Escherichia coli under Glucose Controlled Conditions and Its Effect on Aggregation.
Langmuir 23: 6691-6697.
Edwards KJ, Bach W, McCollom TM. (2005). Geomicrobiology in oceanography:
microbe–mineral interactions at and below the seafloor. Trends Microbiol 13: 449-456.
Edwards KJ, Becker K, Colwell F. (2012). The Deep, Dark Energy Biosphere:
Intraterrestrial Life on Earth. Annual Review of Earth and Planetary Sciences 40: 551-
568.
Egemeier SJ. (1981). Cavern development by thermal waters. National Speleological
Society Bulletin 43: 31-51.
Eguchi M, Nishikawa T, MacDonald K, Cavicchioli R, Gottschal JC, Kjelleberg S.
(1996). Responses to Stress and Nutrient Availability by the Marine Ultramicrobacterium
Sphingomonas sp. Strain RB2256. Appl Environ Microbiol 62: 1287-1294.
Ehrlich HL. (1996). How microbes influence mineral growth and dissolution. Chemical
Geology 132: 5-9.
Ellwood DC, Keevil CW, Marsh PD, Brown CM, Wardell JN, Roux NL. (1982).
Surface-Associated Growth [and Discussion]. Philosophical Transactions of the Royal
Society of London B, Biological Sciences 297: 517-532.
Engel AS. (2004). Geomicrobiology of sulfuric acid speleogenesis; microbial diversity,
nutrient cycling, and controls on cave formation. University of Texas, Austin, Austin,
TX.
Engel AS, Lee N, Porter ML, Stern LA, Bennett PC, Wagner M. (2003). Filamentous
“Epsilonproteobacteria” Dominate Microbial Mats from Sulfidic Cave Springs Appl
Environ Microbiol 69 5503-5511.](https://image.slidesharecdn.com/e7dfd69b-aed2-40be-a698-a68cb2702da4-160817180109/85/JONES-DISSERTATION-2015-185-320.jpg)