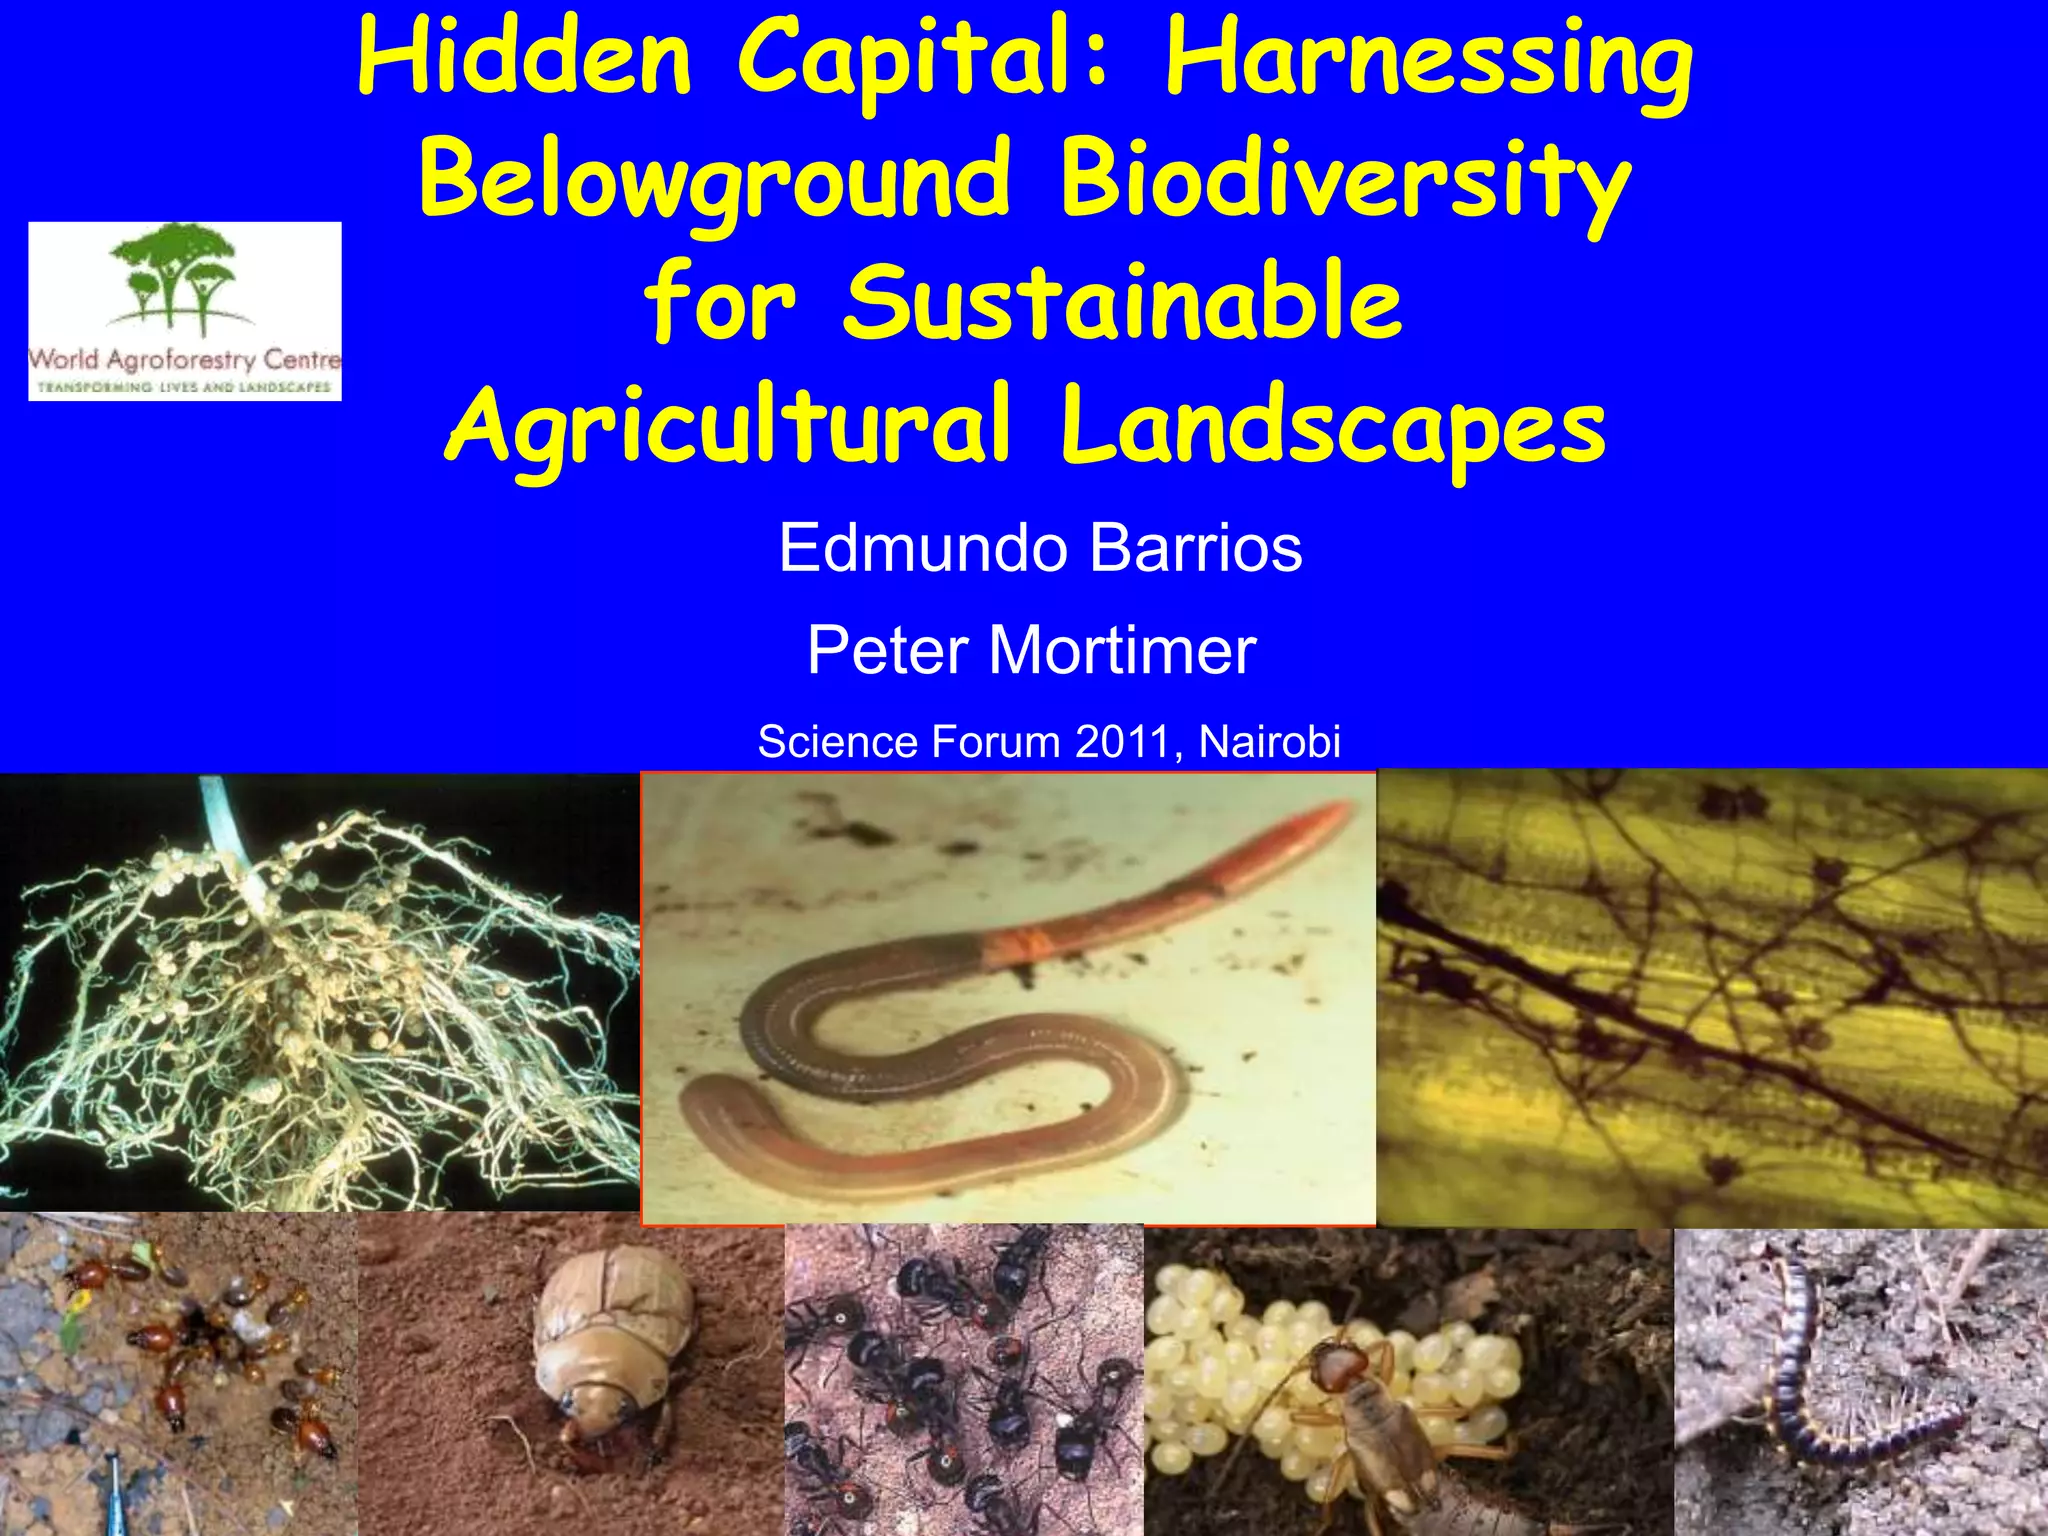
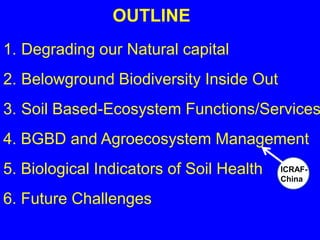
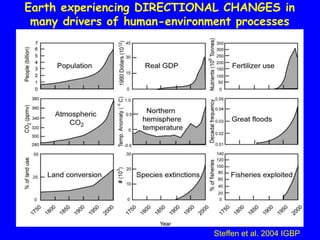
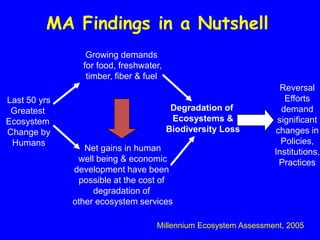
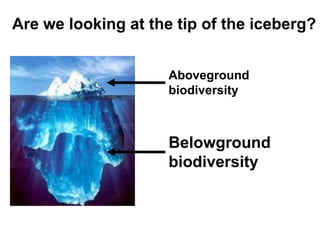
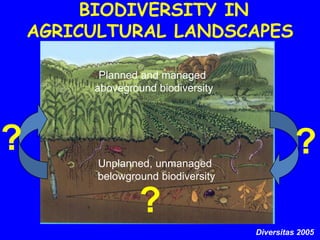
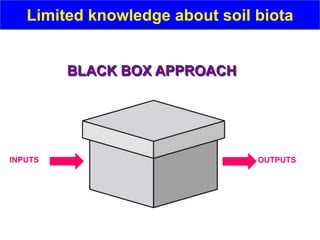
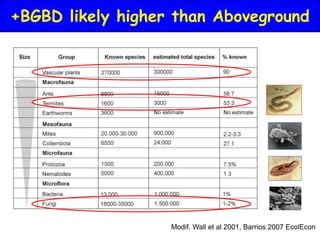
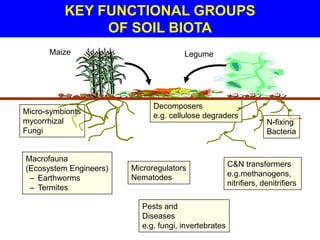
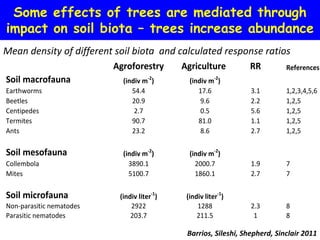
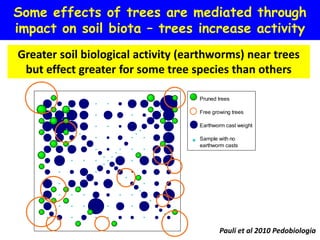
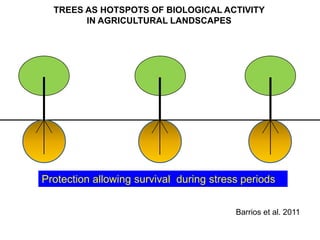
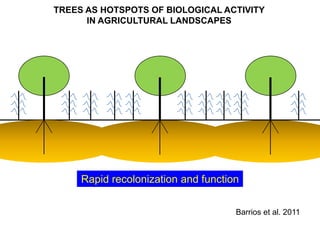
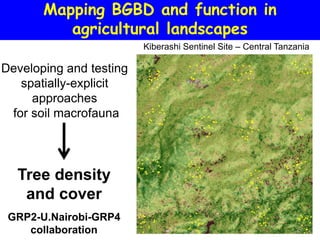
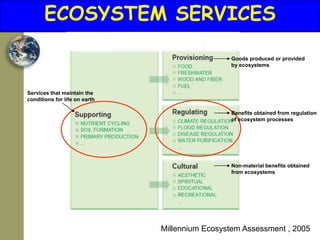
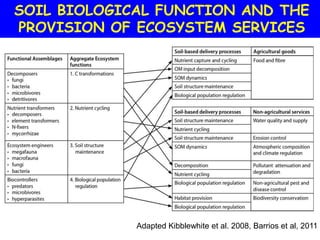
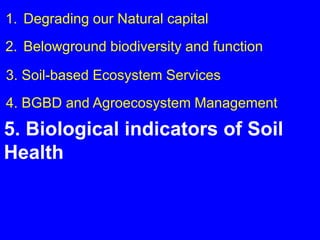
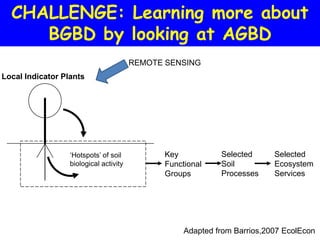
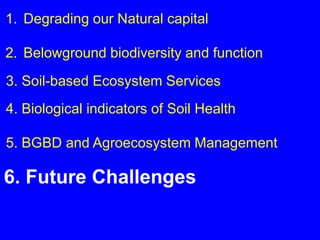
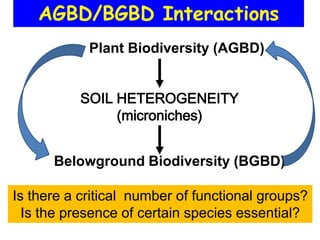
Hidden capital: harnessing belowground biodiversity for sustainable agricultural landscapes
1. Hidden Capital: Harnessing
Belowground Biodiversity
for Sustainable
Agricultural Landscapes
Edmundo Barrios
Peter Mortimer
Science Forum 2011, Nairobi
2. OUTLINE
1. Degrading our Natural capital
2. Belowground Biodiversity Inside Out
3. Soil Based-Ecosystem Functions/Services
4. BGBD and Agroecosystem Management
5. Biological Indicators of Soil Health ICRAF-
china
China
6. Future Challenges
5. MA Findings in a Nutshell
Growing demands
for food, freshwater,
timber, fiber & fuel
Reversal
Last 50 yrs Efforts
Greatest Degradation of demand
Ecosystem Ecosystems & significant
Change by Biodiversity Loss changes in
Humans Policies,
Net gains in human Institutions,
well being & economic Practices
development have been
possible at the cost of
degradation of
other ecosystem services
Millennium Ecosystem Assessment, 2005
6. DEFORESTATION AND BIODIVERSITY LOSS
BRAZILIAN AMAZON (1988-2008)
3.5
Million ha deforested per year
3.0
2.5
2.0
1.5
1.0
0.5
0
Nepstad, 2007 WWF-UNFCC
7. Are we looking at the tip of the iceberg?
Aboveground
biodiversity
Belowground
biodiversity
8. 1. Degrading our Natural capital
2. Belowground Biodiversity and
Function
13. Soil biota must be selectively
studied because:
• There is no single method for
studying soil biodiversity
• It is not possible to study all groups
simultaneously
14. Internationally accepted standard
methods for the inventory of BGBD
Handbook with methods for the
inventory of BGBD
• General guidelines and
principles
• Sampling strategies
• Major functional groups of soil
organisms
• Land use
Moreira et al., 2008
15. KEY FUNCTIONAL GROUPS
OF SOIL BIOTA
Maize Legume
Decomposers
Micro-symbionts
e.g. cellulose degraders
mycorrhizal N-fixing
Fungi Bacteria
Macrofauna
Microregulators C&N transformers
(Ecosystem Engineers)
e.g.methanogens,
– Earthworms Nematodes
nitrifiers, denitrifiers
– Termites
Pests and
Diseases
e.g. fungi, invertebrates
16. BACTERIAL DIVERSITY IN SOIL
100 g Soil
5 x 10¹¹ Colonies DNA Extraction
on Agar Plates
200 Isolates
66 Cultured Species 13,000 Genetic Species
Torsvik et al., 1994
17. Molecular Approaches
ABUNDANCE RICHNESS ACTIVITY
Microscopic counts PLFA Respiration
Viable plate counts FAME C mineralization
MPN N/P mineralization
Microbial biomass Soil enzymes
ATP
FUNCTION
Soil Sample FISH
In situ PCR
RICHNESS/FUNCTION
Re-association
Hybridization Nucleic Acids
DNA RNA Cloning
RFLP
Microarrays
PCR RT-PCR
RICHNESS Excise
Screening
bands
Southern Community Fingerprinting
Oligonucleotide blot ARDRA ITS-PCR DGGE
Probes RAPD T-RFLP REP-PCR
Sequencing
Probe design Accession
PHYLOGENY
Sequence database
Thies, 2004
18. BARCODED PYROSEQUENCING
From 118 soil samples
(4 Sentinel sites in Tanzania)
27% Bacterial &
Archeal sequences
did not match public
databases and thus
likely unknown
SENTINEL SITES
Wall & Fierer, 2011
19. BUT SOIL ORGANISMS ARE NOT
EVERYWHERE
Environmental influences Disturbance Population processes
Fine-scale effects of
roots, organic Reproduction
particles, soil
aggregates and soil Mortality
micromorphology 1m Active dispersal
Competition
Plot- to field-scale
effects of burrowing Predation
animals, within-field Mutualism
moisture gradients,
individual plants and 100 m
plant communities Passive
dispersal
Landscape-scale
gradients of texture,
soil carbon,
topography and
vegetation systems 1 km
Ettema & Wardle, 2002 TrendsEcolEvol
20. Some effects of trees are mediated through
impact on soil biota – trees increase abundance
Mean density of different soil biota and calculated response ratios
Agroforestry Agriculture RR References
Soil macrofauna (indiv m-2) (indiv m-2)
Earthworms 54.4 17.6 3.1 1,2,3,4,5,6
Beetles 20.9 9.6 2.2 1,2,5
Centipedes 2.7 0.5 5.6 1,2,5
Termites 90.7 81.0 1.1 1,2,5
Ants 23.2 8.6 2.7 1,2,5
Soil mesofauna (indiv m-2) (indiv m-2)
Collembola 3890.1 2000.7 1.9 7
Mites 5100.7 1860.1 2.7 7
Soil microfauna (indiv liter-1) (indiv liter-1)
Non-parasitic nematodes 2922 1288 2.3 8
Parasitic nematodes 203.7 211.5 1 8
Barrios, Sileshi, Shepherd, Sinclair 2011
21. Some effects of trees are mediated through
impact on soil biota – trees increase activity
Greater soil biological activity (earthworms) near trees
but effect greater for some tree species than others
Pruned trees
Free growing trees
Earthworm cast weight
Sample with no
earthworm casts
Pauli et al 2010 Pedobiologia
22. TREES AS HOTSPOTS OF BIOLOGICAL ACTIVITY
IN AGRICULTURAL LANDSCAPES
Protection allowing survival during stress periods
Barrios et al. 2011
23. TREES AS HOTSPOTS OF BIOLOGICAL ACTIVITY
IN AGRICULTURAL LANDSCAPES
Rapid recolonization and function
Barrios et al. 2011
24. Mapping BGBD and function in
agricultural landscapes
Kiberashi Sentinel Site – Central Tanzania
Developing and testing
spatially-explicit
approaches
for soil macrofauna
Tree density
and cover
GRP2-U.Nairobi-GRP4
collaboration
25. 1. Degrading our Natural capital
2. Belowground biodiversity and function
3. Soil-Based Ecosystem
Functions and Services
26. ECOSYSTEM SERVICES
Goods produced or provided
by ecosystems
Services that maintain the
conditions for life on earth
Benefits obtained from regulation
of ecosystem processes
Non-material benefits obtained
from ecosystems
Millennium Ecosystem Assessment , 2005
27. SOIL BIOLOGICAL FUNCTION AND THE
PROVISION OF ECOSYSTEM SERVICES
Adapted Kibblewhite et al. 2008, Barrios et al, 2011
29. GLOBAL DECOMPOSITION EXPERIMENT
Wall et al., 2008
Soil fauna expected to enhance decomposition rates in areas
becoming hotter and wetter due to Climate Change
30. NUTRIENT CYCLING
N-fixation
Improved Fallow Agroforestry Systems
Chipata - Zambia
Barrios et al., 1997 SSSAJ
31. Plant traits impact on
soil biological processes
Parameter Mean† Difference between contrasted treatments
NAT vs. Nfix vs.
(HQ) Low L+PP/N vs. SES vs. SES vs.
Trees No Nfix
(LQ) High L+PP/N other Trees NAT
LL+LM‡
Dry wt (g kg-1 soil) 1.12 0.26** 0.09 0.10 0.38*** 0.05
Amount (mg kg-1 soil)
C 302 44.4 10.7 10.0 85.7** 27.0
N 19.0 -1.03 4.40** 2.84* 8.59*** 8.19***
P 1.00 0.30*** 0.14 0.23** 0.54*** 0.15
Soil N (mg N kg-1 soil)
N-NH4+ 5.6 -0.48 1.54* 3.69*** 3.79*** 3.64***
N-NO3- 8.7 -2.35** 6.16*** 3.38*** 7.31*** 8.45***
Inorg N 14.3 -2.83* 7.69*** 7.07*** 11.1*** 12.1***
Aerobic N min
(mg N kg-1 soil day-1) 0.37 0.08 0.11* 0.21*** 0.29*** 0.16**
Significance levels: * = 0.05, ** = 0.01, *** = 0.001.
NAT = natural uncultivated fallow, Nfix = N fixing trees, Nonfix = non N fixing trees,
L+PP/N = lignin plus polyphenols/Nitrogen, and SES = planted sesbania fallow. Barrios et al. 1997 SSSAJ
32. Soil Structure maintenance
HIERARCHICAL MODEL OF AGGREGATION
Solid
2000 m Pore
Root
Hyphae
200 m Aggregates or particles
Hyphae
20 m Bacteria
Packets of clay particles
Microbial debris (humic materials)
2 m
Clay particles
Clay plates
0.2 m
Cemment
Tisdall & Oades, 1982
34. SOIL BIOSTRUCTURE
Macroinvertebrates
ECOSYSTEM
ENGINEERS
as much as 1000 Mg/ha/yr
Blanchart et al., 1999
Mycorrhizas
GLOMALIN
>100 m / cc soil Parniske, 2008
Courtesy K.Ritz, NSRI, UK
35. GLOMALIN visualized with FITC-coupled
MAb32B11 (on 1-2 mm aggregates)
Photo: S. Wright
Courtesy S.Wright, USDA
36. SOIL STRUCTURE-SOIL BIOTA
Impact of biological activity on
soil aggregate stability
Soil Biota Soil Structure
Pore distribution influences the distribution and
activity of soil microorganisms
Young & Crawford, 2004 Science
37. SOIL STRUCTURE / WATER DYNAMICS
Changes in soil hidrofobicity
Induces soil water repellency
Influences soil water fluxes
Hallet et al. 2009, Pland &Soil
Biota Structure
Quantity and Quality of Water
38. SOIL STRUCTURE: Erosion and C storage
Increased stability of soil aggregates
to water contact
Biota Structure
Reduction in C losses
Lower soil erosion and greater
potential for soil C sequestration
Fonte et al., 2010 Geoderma
39. Spectral (NIRS) signatures
of biogenic structures
Bulk soil
PC2
Carton termite mounds
Ant deposits
Earthworm casts PC1
Termite sheathings Organo-mineral termite mounds
Hedde et al., 2005
40. Biological Population Regulation
SOIL FOOD WEBS
Hunt et al. 1987
Fatty Acid/13C signature Feeding strategies & diets in situ
Ruess & Chamberlain, 2010
41. Biological Population Regulation
…..less nematodes in prescence of earthworms
600 No worms
With worms A
Nematodes/pot
500
400
300 B
200
a
100 b
0
6 weeks 12 weeks
Lavelle et al., 2004
42. Biological Population Regulation
Direct effect of gut transit on the viability
of eggs in cysts of Heterodera sacchari
3 mm
Lavelle et al., 2004
44. Biological Population Regulation
Grown is soils infested
Inoculation with AMF
Striga hermonthica
> P availability
Reduction in number (30-50%) and
biomass (40-63%) de S.hermonthica
Lendzemo et al., 2005
45. 1. Degrading our Natural capital
2. Belowground biodiversity and function
3. Soil-based Ecosystem Services
4. BGBD and Agroecosystem
Management
46. AGROECOSYSTEM MANAGEMENT
Natural Agroecosystem
Ecosystem
Intensification
Biodiversity and
Ecological functions
Agrochemicals
Petro energy
RESULT: biological capacity for system self-regulation
Barrios, 2007 EcolEcon
47. TWO PATHWAYS FOR THE
BIOLOGICAL MANAGEMENT OF SOIL
FERTILITY
1. Direct BIOLOGICAL control by
inoculation
2. Indirect ECOLOGICAL control by
cropping system, plant, organic matter
or environmental manipulation.
49. Economic evaluation
of BGBD: BNF
Worth of N2 fixed by grain legumes in
developing countries: US$ 6.7 billion
(Hardarson et al., 2003)
Brazil, N-fertilizer saving from inoculated
soybean: US$ 2.5 billion (Alves et al. , 2003)
SSA N-fertilizer saving from promiscuous
soybean: US$ 203 million (Chianu et al., 2010)
53. Alnus nepalensis: A Green Fertilizer
N-fixing trees as shade trees
• Ecosystem cycling: simple to complex
• Multi-tiered approach
-soil community analysis
-root symbioses
-soil nutrition
-soil water
-crop productivity
Does Alnus influence soil nutrition and soil biodiversity?
56. Forest products: sustainable mushroom
harvesting
• Over harvesting-unsustainable
-Ophiocordyceps (Caterpillar fungus)
-Matsutake (50% decline in N Yunnan)
• Telephora ganbarjun:
-3-6 harvests/season
-increase 43% by harvest weight and 86% earnings
-net income from T. ganbarjun: US$2 million/year
60. Soil health is key
• Unique opportunity to study soil community
succession
• Disturbed; processed and relocated soils
• Monitor below ground activities and changes:
-Soil nutrition
-Soil communities
• Correlate above ground species with below
ground health (or vice versa?)
63. 1. Degrading our Natural capital
2. Belowground biodiversity and function
3. Soil-based Ecosystem Services
4. BGBD and Agroecosystem Management
5. Biological indicators of Soil
Health
64. PLANTS AS LOCAL INDICATORS OF SOIL
QUALITY
Common name Scientific name Botanical family Soil type
Helecho marranero Pteridium aquilinum Pteridiaceae (L)* Poor
(Mashiu) “ “ (A)
Mangaguasca Braccharis trinervis Compositae (L) Poor
(Ma-shuuti) Philippia usambaresnsis Ericaceae (A)
Escoba Lanosa Andropogon bicornis Gramineae (L) Poor
(Digitaria) Digitaria sp. “ (A)
Siempre Viva Commelina difusa Commelinaceae (L) Fertile
(Olaiteteyai) Commelina africana “ (A)
Papunga Bidens pilosa Compositae (L) Fertile
(Enderepenyi) “ “ (A)
Hierba de chivo Ageratum conyzoides Compositae (L) Fertile
(Olmalive) “ “ (A)
*(L = Latin America, A = Africa) Barrios et al., 2006 Geoderma
65. Soil food web structure - disturbance and recovery
H. Ferris ,UC Davis
69. CHALLENGE: Learning more about
BGBD by looking at AGBD
REMOTE SENSING
Local Indicator Plants
‘Hotspots’ of soil Key Selected Selected
biological activity Functional Soil Ecosystem
Groups Processes Services
Adapted from Barrios,2007 EcolEcon
70. 1. Degrading our Natural capital
2. Belowground biodiversity and function
3. Soil-based Ecosystem Services
4. Biological indicators of Soil Health
5. BGBD and Agroecosystem Management
6. Future Challenges
71. AGBD/BGBD Interactions
Plant Biodiversity (AGBD)
SOIL HETEROGENEITY
(microniches)
Belowground Biodiversity (BGBD)
Is there a critical number of functional groups?
Is the presence of certain species essential?
72. Identifying, Quantifying and Mapping
Host Spots of Biological Activity and
Ecosystem Services
Temporal and spatial dynamics as a
result of environmental factors in situ
Predictive knowledge of
Ecosystem Service Provision
73. Maintaining the right balance between
Productivity and other Ecosystem Services
PROD. ES
74. Developing Soil Health Monitoring
Systems to evaluate
Ecosystem Service provision
performance
Allow rural communities,
environmental/agricultural institutions
and local government
Prepare for negotiations related to
Payment for Ecosystem Services