Download to read offline


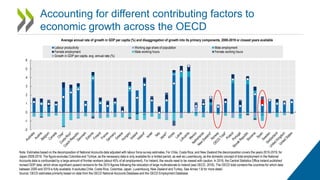


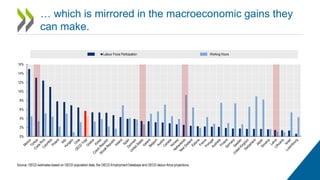


The document discusses the macroeconomic benefits of gender equality, highlighting the closing gender gaps in labor force participation while noting substantial disparities remain. It presents projections on how achieving gender equality in labor markets could impact economic growth across different scenarios from 2022 to 2060. Additionally, it emphasizes the importance of women's labor input and includes analysis based on OECD data and projections.


