Download to read offline
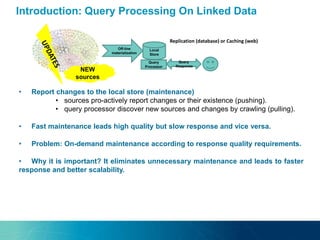
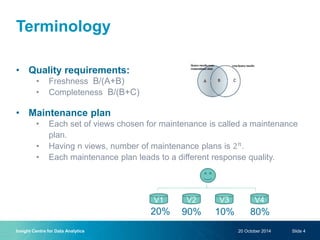
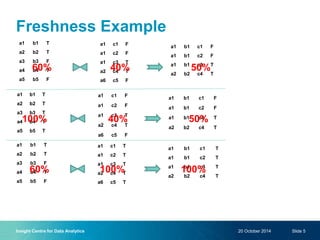

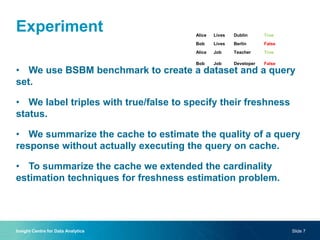
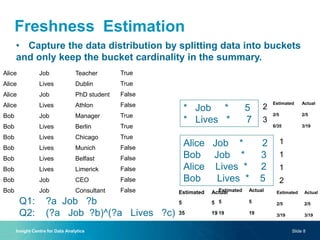


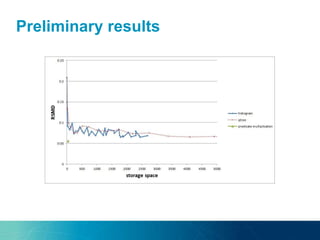


The document discusses a new approach to optimizing SPARQL query processing for dynamic and static data by focusing on maintenance plans that satisfy response quality requirements, specifically freshness and completeness. Through experiments with a dataset using the BSBM benchmark, the authors analyze the costs of maintenance plans and propose techniques for estimating data freshness using indexing and histogram methods. The research indicates a future direction involving probabilistic graphical models to further improve freshness estimation accuracy.