This document provides an introduction to simulation. It begins with an example of simulating a one-teller bank manually to illustrate modeling concepts. Key concepts discussed include the definition of simulation, modeling concepts such as systems, events, entities and attributes. The document also discusses the advantages of simulation in allowing users to ask "what if" questions and analyze system behavior without making costly changes to real systems. It notes both computer simulation and manual simulation have limitations in complexity. Overall the document provides a high-level overview of simulation methodology and concepts.
![Banks
time, Customer 3 had to wait in the queue for 1 minute for
service to begin.
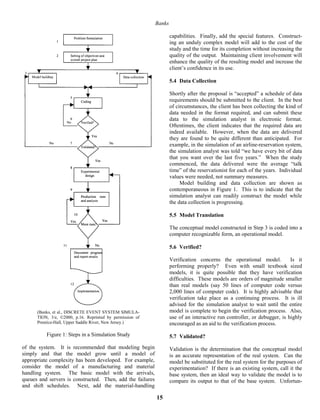
This process continues for all 20 customers, and the
totals shown in Columns 7, 8 (Idle Time), and 9 (Time in
Queue) are entered. Some performance measures can now
be calculated as follows:
• Average time in system = 79/20 = 3.95 minutes
• % idle time = [30/99]*(100) = 30%
• Average waiting time per customer = 10/20 = 0.5
minutes
• Fraction having to wait = 5/20 = 0.25
• Average waiting time of those that waited = 10/3
= 3.33 minutes.
This very limited simulation indicates that the system
is functioning well. Only 25% of the customers had to
wait. About 30% of the time the teller is idle. Whether a
slower teller should replace the current teller depends on
the cost of having to wait versus any savings from having a
slower server.
This small simulation can be accomplished by hand,
but there is a limit to the complexity of problems that can
be solved in this manner. Also, the number of customers
that must be simulated could be much larger than 20 and
the number of times that the simulation must be run for
statistical purposes could be large. Hence, using the
computer to solve real simulation problems is almost
always appropriate.
This example raises some issues that will be addressed
in the introductory tutorials at WSC. The issues include
the following:
1. How is the form of the input data determined?
2. How are random variates generated if they follow
statistical distributions other than the discrete
uniform?
3. How does the user know that the simulation
imitates reality?
4. What other kinds of problems can be solved by
simulation?
5. How long does the simulation need to run?
6. How many different simulation runs should be
conducted?
7. What statistical techniques should be used to
analyze the output?
3 MODELING CONCEPTS
There are several concepts underlying simulation. These
include system and model, events, system state variables,
entities and attributes, list processing, activities and delays,
and finally the definition of discrete-event simulation.
Additional information on these topics is available from
Banks, et al. (2000) and Law and Kelton (2000). The
discussion in this section follows that of Carson (1993).
3.1 System, Model and Events
A model is a representation of an actual system. Immedi-
ately, there is a concern about the limits or boundaries of
the model that supposedly represent the system. The
model should be complex enough to answer the questions
raised, but not too complex.
Consider an event as an occurrence that changes the
state of the system. In the example, events include the
arrival of a customer for service at the bank, the beginning
of service for a customer, and the completion of a service.
There are both internal and external events, also called
endogenous and exogenous events, respectively. For
instance, an endogenous event in the example is the
beginning of service of the customer since that is within
the system being simulated. An exogenous event is the
arrival of a customer for service since that occurrence is
Table 1: Ad Hoc Simulation
(1) (2) (3) (4) (5) (6) (7) (8) (9)
Time Time Time Time Time
between Arrival Service Service Service in Idle in
Customer Arrivals Time Time Begins Ends System Time Queue
1 - 0 2 0 2 2 0 0
2 5 5 2 5 7 2 3 0
3 1 6 6 7 13 7 0 1
.
.
.
18 4 84 5 84 89 5 0 0
19 7 91 3 91 94 3 2 0
20 7 98 1 98 99 1 4 0
79 30 10
10](https://image.slidesharecdn.com/jerrybanks-introductiontosimulation-160224000133/85/Jerry-banks-introduction-to-simulation-2-320.jpg)