Download to read offline
![PARUL INSTITUTE OF TECHNOLOGY
ELECTRONICS AND COMMUNICATION ENGINEERING DEPARTMENT
OPEN ENDED PROBLEM
Name : PATEL JAY C Subject: SSA
Class : ME SEM-II Code : 2720501
Date : Er.No. : 140870705004
Aim: Write a MATLAB code to find mean square error.
Program:
clc; % Clear the command window.
close all; % Close all figures (except those of imtool.)
clear; % Erase all existing variables.
workspace; % Make sure the workspace panel is showing.
fontSize = 22;
xCenter = 12;
yCenter = 10;
% Make a timeline of 40 seconds with samples every 0.01 second.
t = 0 : 0.01 : 40;
% Let's say that there is 8 revolutions in that time.
numberOfRevolutions = 8;
% Produce the angles. They will go from 0 to numberOfRevolutions *
2*pi.
theta = linspace(0, numberOfRevolutions * 2 * pi, length(t));
radius = 5;
x = radius * cos(theta) + xCenter;
y = radius * sin(theta) + yCenter;
subplot(1,2,1);
plot(x, y, 'LineWidth', 3);
axis square;
xlim([0 20]);
ylim([0 20]);
grid on;
title('The circlular path it revolves around', 'FontSize', fontSize);
xlabel('X', 'FontSize', fontSize);
ylabel('Y', 'FontSize', fontSize);
% m = -40;
% velocity = 0.25;
% ft = t;
% azimuth = 2 * 3.14 * ft/m;
% Plot azimuth (the y coordinate) as a function of time.
subplot(1,2,2);
plot(t, y, 'b-', 'LineWidth', 3);
grid on;
ylim([0, yCenter+radius]);
title('Height of a point as it revolves around', 'FontSize', fontSize);
xlabel('time', 'FontSize', fontSize);
ylabel('Y, or Azimuth', 'FontSize', fontSize);
% Enlarge figure to full screen.
set(gcf, 'units','normalized','outerposition',[0 0 1 1]);](https://image.slidesharecdn.com/jayssa-150508172246-lva1-app6892/85/Mean-square-error-1-320.jpg)
![PARUL INSTITUTE OF TECHNOLOGY
ELECTRONICS AND COMMUNICATION ENGINEERING DEPARTMENT
OPEN ENDED PROBLEM
Name : PATEL JAY C Subject: SSA
Class : ME SEM-II Code : 2720501
Date : Er.No. : 140870705004
Aim: Write a MATLAB code to find mean square error.
Program:
clc; % Clear the command window.
close all; % Close all figures (except those of imtool.)
clear; % Erase all existing variables.
workspace; % Make sure the workspace panel is showing.
fontSize = 22;
xCenter = 12;
yCenter = 10;
% Make a timeline of 40 seconds with samples every 0.01 second.
t = 0 : 0.01 : 40;
% Let's say that there is 8 revolutions in that time.
numberOfRevolutions = 8;
% Produce the angles. They will go from 0 to numberOfRevolutions *
2*pi.
theta = linspace(0, numberOfRevolutions * 2 * pi, length(t));
radius = 5;
x = radius * cos(theta) + xCenter;
y = radius * sin(theta) + yCenter;
subplot(1,2,1);
plot(x, y, 'LineWidth', 3);
axis square;
xlim([0 20]);
ylim([0 20]);
grid on;
title('The circlular path it revolves around', 'FontSize', fontSize);
xlabel('X', 'FontSize', fontSize);
ylabel('Y', 'FontSize', fontSize);
% m = -40;
% velocity = 0.25;
% ft = t;
% azimuth = 2 * 3.14 * ft/m;
% Plot azimuth (the y coordinate) as a function of time.
subplot(1,2,2);
plot(t, y, 'b-', 'LineWidth', 3);
grid on;
ylim([0, yCenter+radius]);
title('Height of a point as it revolves around', 'FontSize', fontSize);
xlabel('time', 'FontSize', fontSize);
ylabel('Y, or Azimuth', 'FontSize', fontSize);
% Enlarge figure to full screen.
set(gcf, 'units','normalized','outerposition',[0 0 1 1]);](https://image.slidesharecdn.com/jayssa-150508172246-lva1-app6892/75/Mean-square-error-1-2048.jpg)
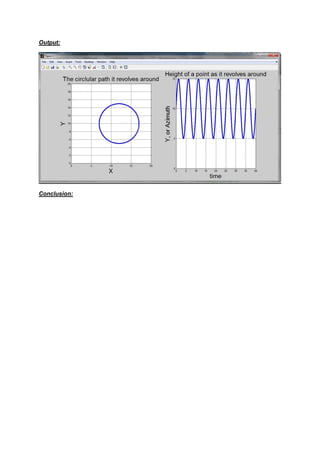

This MATLAB code generates a circular path by revolving a point around a center point 8 times over a 40 second period. It plots the x-y coordinates of the path in one subplot and the y-coordinates over time in another subplot. The code clears variables, sets font sizes, generates time and angle vectors, calculates x and y coordinates from the radius and angle, and plots the results with labels and axis properties. The overall aim is to generate and visualize a revolving circular path.