Download to read offline

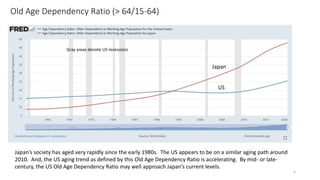
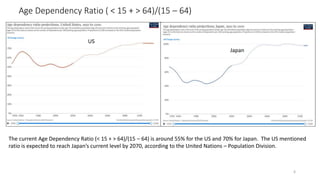
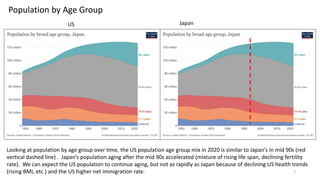
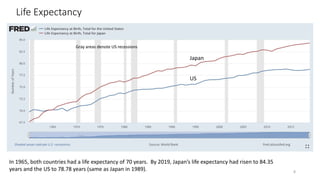

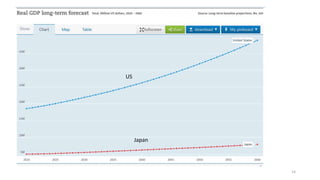
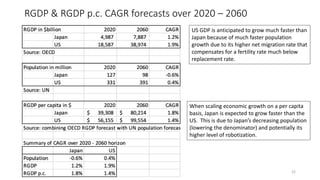

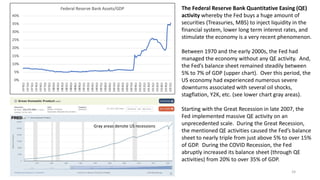
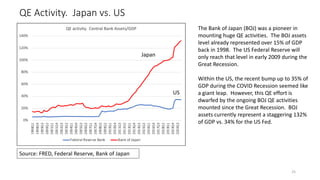
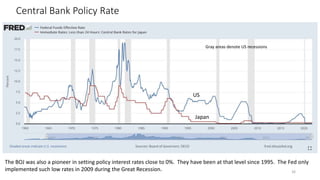


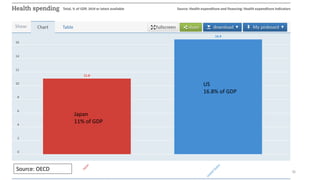
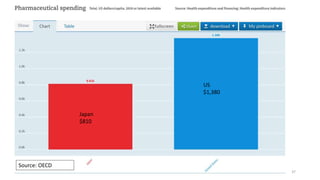
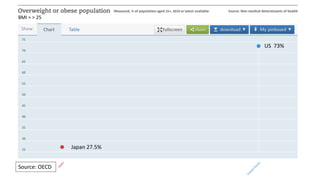
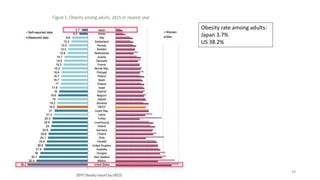
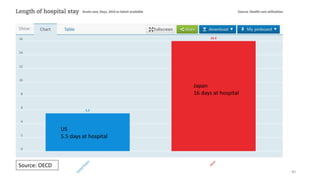
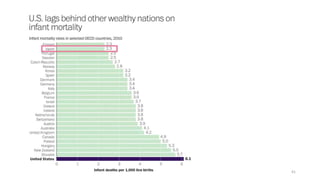
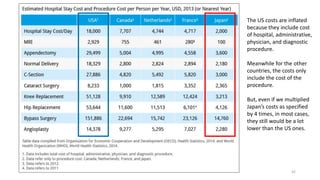
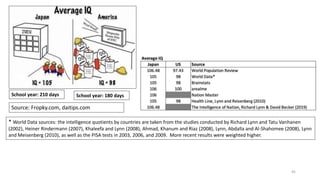


The document compares the economic, demographic, and health trends of Japan and the U.S., noting that both countries share low fertility rates but differ in population growth and aging trends. It highlights that Japan's economic growth has lagged due to an aging population and low immigration rates, while the U.S. benefits from higher net migration. Additionally, health care costs are significantly higher in the U.S., influenced by lifestyle factors and systemic issues, indicating a substantial gap in health outcomes and costs between the two nations.


