
Recommended
Recommended
More Related Content
Similar to Jackson - ICSR 2014
Similar to Jackson - ICSR 2014 (20)
Recently uploaded
Recently uploaded (20)
Jackson - ICSR 2014
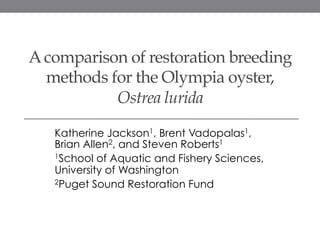
- 1. A comparison of restoration breeding methods for the Olympia oyster, Ostrea lurida Katherine Jackson1, Brent Vadopalas1, Brian Allen2, and Steven Roberts1 1School of Aquatic and Fishery Sciences, University of Washington 2Puget Sound Restoration Fund
- 2. Outline • Background • Methods • Results • Effective number of breeders (Nb) • Relatedness • Differentiation • Conclusion • Questions Marxfoods.com
- 3. Outline • Background • Methods • Results • Effective number of breeders (Nb) • Relatedness • Differentiation • Conclusion • Questions Marxfoods.com
- 4. Why are we doing this? • Native oyster to the west coast with historically high population sizes • Dramatic decrease due to over-harvestation and habitat degradation • In order to restore, hatchery supplementation is necessary • The goal is to emulate wild diversity as closely as possible
- 5. Outline • Background • Methods • Results • Relatedness • Effective number of breeders (Nb) • Differentiation • Conclusion • Questions Marxfoods.com
- 6. Methods • Analyzed 7 known microsatellite loci on: • 93 wild O. lurida • 96 restoration from PSRF • A combination of two different years and breeding methods • 93 commercial from Taylor Shellfish Cory and Catska Ench
- 7. Outline • Background • Methods • Results • Effective number of breeders (Nb) • Relatedness • Differentiation • Conclusion • Questions Marxfoods.com
- 8. Number of Effective Breeders Population Estimated number of parents Nb Wild 65 64.98 Restoration 71 70.65 Restoration 71 70.65 Commercial 63 62.98 Nb = 4Nf Nm (Nf + Nm )
- 9. Relatedness Population Individuals Full Sibling Pairs Proportion full sibs Wild 93 6 0.0014 Restoration 96 9 0.0020 Commercial 93 4 0.00094
- 10. Rarefaction 20 15 10 5 0 0 30 60 90 120 150 Average number of alleles Number of individuals • This shows the estimated number of alleles in the population • Averaged between all 7 loci Wild
- 11. Rarefaction 20 18 16 Wild Restoration Commercial 0 30 60 90 120 150 Average number of alleles Number of individuals • This shows the estimated number of alleles in the population • Averaged between all 7 loci • Commercial has significantly higher allelic richness than Wild
- 12. 0.16 0.12 0.08 0.04 0.00 Allele Frequency for Olur13 Wild Restoration Commercial 263 267 271 275 279 283 287 291 295 299 303 307 Frequency Allele • Frequency of each allele for each population • Can look at overall trends of frequency between populations • We want the wild and restoration frequencies to be as similar as possible
- 13. Genic differentiation Chi2 d f P-value Wild vs. Restoration 31.33 14 0.005 Wild vs. Commercial 15.41 14 0.35 • This is the strongest test that I have • The wild and restoration groups ARE significantly different • Wild and commercial are NOT detected to be different
- 14. Outline • Background • Methods • Results • Effective number of breeders (Nb) • Relatedness • Differentiation • Conclusion • Questions Marxfoods.com
- 15. Conclusion • The restoration population is significantly different than the wild population • Commercial is not significantly different than the wild population • How did this happen? • Biology of the animals • Numbers?....
- 16. Restoration Commercial 300 individuals 300 individuals 600 individuals • 1 breeding group is 12 individuals x 12 individuals • 50-3,600 discrete pairings 600 individuals • No breeding groups • 2-360,000 discrete pairings
- 17. Restoration Commercial 300 individuals 300 individuals 600 individuals • 1 breeding group is 12 individuals x 12 individuals • 50-3,600 discrete pairings 600 individuals
- 18. Restoration Commercial 300 individuals 300 individuals 600 individuals • 1 breeding group is 12 individuals x 12 individuals • 50-3,600 discrete pairings 600 individuals • No breeding groups • 2-360,000 discrete pairings
- 19. Restoration Commercial 300 individuals 300 individuals 600 individuals • 1 breeding group is 12 individuals x 12 individuals • 50-3,600 discrete pairings 600 individuals • No breeding groups • 2-360,000 discrete pairings
- 20. Future Work • This experiment will be repeated by PSRF next spring • Two wild populations and their offspring Pacificbio.org
- 21. Thank you!! • University of Washington • Roberts lab • Crystal Simchick – NOAA • Derek King – PSRF • Taylor Shellfish
- 22. Questions?