SlideShare a Scribd company logo
J E L L Y F I S H B L O O M S
Effects of climate warming on strobilation and ephyra
production of North Sea scyphozoan jellyfish
Sabine Holst
Published online: 9 March 2012
� Springer Science+Business Media B.V. 2012
Abstract Recent studies have correlated fluctua-
tions in jellyfish abundances with climatic changes,
leading to speculation that the warming trend in the
North Sea will affect the strobilation activity of
Scyphozoa. The present study provides long-term
data (10–22 months) on temperature effects on the
species Aurelia aurita, Cyanea capillata, Cyanea
lamarckii and Chrysaora hysoscella. Strobilation at
current winter temperature (5�C) in the German Bight
was compared to strobilation at warmer winter tem-
peratures. Simulated winter temperature of 10�C had
several positive effects on strobilation, as compared to
5�C: 1. A longer strobilation period or higher ephyra
production per polyp in A. aurita, C. lamarckii and Ch.
hysoscella; 2. Higher percentages of polyps strobilat-
ing in A. aurita and Ch. hysoscella; 3. More ephyrae
per strobila in C. capillata and C. lamarckii; 4. A
shorter strobilation duration in C. capillata and
C. lamarckii. Cold winter temperatures of 5�C
promoted strobilation in C. capillata, but inhibited
strobilation in A. aurita and reduced ephyra produc-
tion in C. lamarckii and Ch. hysoscella. These results
suggest that climate warming will benefit A. aurita,
but not cold-water C. capillata. The distributions of
C. lamarckii and Ch. hysoscella probably could
expand to the north.
Keywords Aurelia � Cyanea � Chrysaora � Polyp �
Temperature � Reproduction
Introduction
Reports of mass occurrences of large jellyfish (Scy-
phozoa) in many marine ecosystems worldwide have
increased in recent decades (Purcell et al., 2007;
Richardson et al., 2009). Negative impacts of such
medusa blooms on ecosystems, fisheries, industries
and tourism are obvious: medusae are food compet-
itors of fish and feed on fish larvae and small fish (Barz
& Hirche, 2007; Sabatés et al., 2010), the gelatinous
bodies clog fishing nets and cooling systems of coastal
industries, and jellyfish stinging swimmers have
negative effects on the tourism industry (CIESM,
2001; Purcell et al., 2007). It is possible that conse-
quences of anthropogenic activities, including overf-
ishing, eutrophication, species invasions and
especially climate change, have contributed to
increased jellyfish abundances (Purcell et al., 2007;
Richardson et al., 2009; Purcell, 2011).
Recent analyses of temperature data show a clear
warming trend in global average air and ocean
temperature (IPCC, 2007). A pronounced winter
Guest editors: J. E. Purcell, H. Mianzan & J. R. Frost / Jellyfish
Blooms: Interactions with Humans and Fisheries
S. Holst (&)
Senckenberg am Meer, German Center for Marine
Biodiversity Research, c/o Biozentrum Grindel und
Zoologisches Museum, Martin-Luther-King-Platz 3,
20146 Hamburg, Germany
e-mail: [email protected]
123
Hydrobiologia (2012) 690:127–140
DOI 10.1007/s10750-012-1043-y
warming trend has been observed in the North and
Baltic seas, which is predicted to continue in the future
(HELCOM, 2007; Belkin, 2009). Recent rapid climate
change has changed the abundances, population
structures and biographical ranges of benthic and
planktonic North Sea species (Mieszkowska et al.,
2006; Wiltshire et al., 2010). Climate regime shifts
also affect jellyfish populations. Changes in temper-
ature, salinity, currents, predator–prey interactions
and competition have measurable effects on jellyfish
abundance and distribution (Purcell, 2005, 2009;
Molinero et al., 2008; Lynam et al., 2010). These
environmental changes will affect both the pelagic and
the benthic stages of metagenetic medusae; however,
the role of the polyps has been neglected in most
analyses and models because of the lack of data on
polyp ecology (Lynam et al., 2010).
The medusae of four semaeostome scyphozoans,
Aurelia aurita (Linneaus, 1758), Cyanea capillata
(Linneaus, 1758), Cyanea lamarckii Péron and Lesu-
eur, 1809 and Chrysaora hysoscella (Linneaus, 1766),
occur in the German Bight during the summer months,
and mass occurrences have been documented in some
years (Russell, 1970; Möller, 1980a; Hay et al., 1990;
Barz & Hirche, 2007). Like most scyphozoans, the life
cycle of these species includes planktonic medusa and
benthic polyp generations. After settlement and
metamorphosis of the planula larvae, the polyp
populations increase by asexual reproduction. Each
polyp seasonally produces one to several young
medusae (ephyrae) in a process of transversal fission
called strobilation. This process contributes to the
development of jellyfish blooms because polydisc
strobilation allows single polyps to produce many
ephyrae (Boero et al., 2008).
Information on the environmental factors and
stressors that determine the induction, timing and
magnitude of the strobilation process is limited to a few
species (e.g. Aurelia spp., reviewed in Purcell et al.,
2012). Moreover, the benthic stage is completely
undiscovered or undescribed for most scyphozoans
(Tronolone et al., 2002; Jarms, 2010). Although many
laboratory investigations on scyphopolyps have shown
that temperature significantly affects the asexual polyp
reproduction and strobilation (e.g. Holst et al., 2007;
Purcell, 2007; Willcox et al., 2007; You et al., 2008;
Liu et al., 2009), most of these studies were restricted to
short periods of a few weeks and polyps were often
exposed to extreme, abrupt changes, whereas changes
in situ would be less severe (Purcell, 2005). Long-time
investigations on the effects of natural seasonal
temperature cycles on polyp ecology are unavailable
for most species (but see Gröndahl, 1988; Brewer &
Feingold, 1991; Miyake et al., 2002; Purcell et al.,
2009; Di Camillo et al., 2010; Ishii & Katsukoshi,
2010). In the present study, I compare the long-term
(10–22 months) effects of different temperature con-
ditions on strobilation and ephyra production of four
semaeostome jellyfish species from the North Sea to
show the possible effects of increasing winter temper-
atures on the strobilation activity of Scyphozoa in the
North Sea. Strobilation at temperature conditions
similar to the current temperatures in the German
Bight was compared to that at warmer winter temper-
atures. Additional experiments without a temperature
change were conducted to determine the importance of
temperature changes as inducers of strobilation in
scyphozoan polyps. I tested the null hypotheses to
ascertain whether the percentages of polyps strobilat-
ing and the numbers of ephyrae produced per strobila
were independent of temperature; second, whether the
percentages of strobilating polyps and the number of
ephyrae produced per strobila were independent of
polyp age; and third, whether the duration of strobi-
lation was independent of the number of ephyrae per
strobila and of temperature.
Materials and methods
Polyps of the species A. aurita, C. capillata, C. lama-
rckii and Ch. hysoscella were reared from planulae
collected from female medusae in the summer periods
of 2003 and 2004 around the island of Helgoland
(details in Holst & Jarms, 2007, 2010). Watch glasses
or polyethylene plates (for C. lamarckii) colonized by
polyps in the laboratories of the Biologische Anstalt
Helgoland were transported to the Zoological Institute
of the University of Hamburg (Biocenter Grindel)
1–2 weeks after planula settlement. The substrates
were transferred into 150-ml glass bowls filled with
filtered North Sea water (salinity 35 ± 2). The bowls
were kept in incubators at 15�C in darkness before
the experiments. Only well-developed polyps with
extended tentacles were used for the experiments,
whereas small or contracted polyps were carefully
removed from the substrates with a needle. Polyps
were fed nauplii of Artemia salina for 1–2 h every
128 Hydrobiologia (2012) 690:127–140
123
7–10 days, after which the seawater in the bowls was
replaced with fresh filtered seawater of the same
temperature. During strobilation, only half of the water
was changed carefully, and uneaten food was removed
from the bowls with a pipette to avoid disturbing the
strobilation process. Polyps of each species were
cultured in three different temperature groups
(Table 1). In the 15�C group, the temperature was
constant 15�C throughout the year. In the groups
15–10–15�C and 15–05–15�C, the temperature was
15�C until mid-October and lowered to 10�C in autumn
and 5�C in winter, respectively. The temperatures were
decreased in steps of 2.5�C per month (Fig. 1), and all
cultures were kept in incubators in darkness. Polyps
were monitored for 12 months (A. aurita from 15
September, and C. capillata from 15 October) or
10 months (C. lamarckii and Ch. hysoscella from 15
October) in the first year after settlement. Additional
10-month-long experiments (from 15 October) were
conducted in the second year after settlement with
A. aurita and C. capillata polyps. The polyps were
counted monthly in all replicates, and all cultures were
checked weekly to detect beginning strobilations.
When strobilation appeared in the cultures, each
strobila was monitored individually. The developing
ephyrae in each strobila and the released ephyrae in the
cultures were counted at least twice per week.
Calculations and statistics
The numbers of ephyrae produced monthly in each
temperature group were summed and divided by the
number of polyps to calculate ephyra production for
each month. To account for production and mortality of
polyps, the mean numbers of polyps (counted monthly)
were calculated over the duration of the experiment
(Table 1) and used in calculations and statistics. The
total numbers of ephyrae produced per mean polyp
numbers were calculated for each temperature group.
The percentages of strobilating polyps in the first year
were calculated for each replicate from the total
numbers of strobilae divided by the mean numbers of
polyps in each replicate. Percentages were arcsine
square root transformed before statistical analysis to
test the first null hypothesis, H01: the percentages of
polyps strobilating were independent of the tempera-
ture treatments. In C. lamarckii, all polyps strobilated
once in all temperature groups, therefore the percent-
ages of polyps that strobilated twice were compared to
test H01. Individually monitored strobilations in the
first year were used to calculate the mean numbers of
ephyrae per strobila to test H02: the numbers of ephyrae
produced per strobila were independent of the temper-
ature treatments. Strobilations from replicates 1–3
were used for analysis in all species and temperature
groups; additional strobilations were included
from replicates 4–6 in A. aurita 15�C, C. capillata
15–10–15�C, C. capillata 15–05–15�C and Ch. hysos-
cella 15–05–15�C. For H01 and H02, data with normal
distributions were tested by one-way analysis of
variance (ANOVA) followed by a Fisher’s least
significance difference (LSD) post-hoc test. Data not
normally distributed were tested by a Kruskal–Wallis
ANOVA on ranks and a Student–Newman–Keuls post-
hoc test. Two experimental groups were compared
with a Mann–Whitney Rank Sum Test.
Table 1 Replicates (n) in temperature groups used for analyses
of strobilation in first year (1y) and second year (2y) after
planula
settlement in four species of scyphozoans
Species Year n 15�C 15–10–15�C 15–05–15�C
Start Mean Start Mean Start Mean
A. aurita 1y 6 79 87.3 ± 4.9 78 102.6 ± 19.9 81 114.7 ± 32.5
1y 3 29 37.1 ± 4.8 32 46.3 ± 11.9 36 54.0 ± 16.3
2y 3 33 46.3 ± 15.2 32 47.2 ± 21.8 35 49.7 ± 22.0
C. capillata 1y 6 71 73.7 ± 4.0 75 86.3 ± 11.2 81 96.6 ± 17.3
1y 3 25 26.0 ± 2.9 25 26.0 ± 2.9 26 28.0 ± 6.4
2y 3 11 18.2 ± 8.3 20 28.9 ± 10.1 24 39.1 ± 13.2
C. lamarckii 1y 6 86 76.3 ± 7.4 86 64.5 ± 14.1 85 60.5 ± 17.0
Ch. hysoscella 1y 7 108 85.0 ± 22.3 108 92.9 ± 15.7 113 81.9 ±
28.8
The total polyp numbers at the beginning of the experiments
(Start) and numbers of polyps in monthly counts (mean ±
standard
deviation) in different temperature groups (see Fig. 1) are listed
Hydrobiologia (2012) 690:127–140 129
123
A. aurita
1st year
1 5 °C
1 5 - 1 0 - 1 5 °C
1 5 - 0 5 - 1 5 °C T
e
m
p
e
ra
tu
re
c
o
n
d
it
io
n
s
(
°C
) 15Oct-
15Nov
15Nov-
15Dec
15Dec-
15Jan
15Jan-
15Feb
15Feb-
15Mar
15Mar-
15Apr
15Apr-
15May
15May-
15Jun
15Jun-
15Jul
15Jul-
15Aug
Temperature
groups
0
1
2
1 5 - 0 5 - 1 5 °C
1 .0
1 5 - 1 0 - 1 5 °C
2 .1
1 5 °C
0 .2
1 5 - 0 5 - 1 5 °C
1 .7 1 5 - 1 0 - 1 5 °C
2 .7
1 5 °C
0 .3
0
1
2 A. aurita
2nd year
0
1
2 C. capillata
1st year
E
p
h
y
ra
e
p
e
r
p
o
ly
p
1 5 - 1 0 - 1 5 °C
0 .9
1 5 - 0 5 - 1 5 °C
1 .4
0
1
2 C. capillata
2nd year
0
1
2 C. lamarckii
1st year
1 5 - 1 0 - 1 5 °C
3 .2
1 5 - 0 5 - 1 5 °C
3 .0
1 5 - 0 5 - 1 5 °C
3 .7
1 5 - 1 0 - 1 5 °C
5 .4
1 5 °C
7.9
0
1
2 Ch. hysoscella
1st year
15 15 15 15 15 15 15
12.5 10 10 10 10 10 12.5 15
12.5
1 5 15 15
10 10
10 7.5 5 5 5 7.5 1 0 12.5 15
1 5 - 0 5 - 1 5 °C
0 .1
1 5 - 1 0 - 1 5 °C
0 .8
1 5 °C
0 .4
Ephyrae per polyp in 10 monthsEphyrae per polyp monthly
130 Hydrobiologia (2012) 690:127–140
123
For comparisons among strobilations 1 and 2 years
after settlement, the same three replicates of each
temperature group of A. aurita and C. capillata polyps
were used in both years (Table 1). The same 10-month
period (15 October–15 August) were analysed in both
years. The percentages of strobilating polyps and the
numbers of ephyrae produced per strobila were calcu-
lated for both years, as described above, and compared
by a Mann–Whitney Rank Sum Test. Two null
hypotheses were tested, H03: The percentages of
strobilating polyps were independent of polyp age
and H04: The number of ephyrae produced per strobila
was independent of the polyp age.
The durations of strobilations (days) were deter-
mined from the number of days between the start of the
strobilation, when first constrictions of the polyp body
appeared, until the end the strobilation, when the last
ephyra detached from the strobila. Only strobilations
that began and ended at the same temperature were used
in the analysis. Strobilae in the first year after polyp
settlement were analysed in C. lamarckii and Ch.
hysoscella, and in the first and second years combined in
A. aurita and C. capillata. Strobilations were analysed at
15, 10 and 5�C culture temperatures. Two null hypoth-
eses were tested by analysis of covariance (ANCOVA),
H05: The duration of strobilation was independent of the
number of ephyrae per strobila and H06: The duration of
strobilation was independent of the temperature treat-
ments. ANCOVA-tests were conducted separately for
each species. In all tests, duration was the dependent
variable; the number of ephyrae per strobila and the
culture temperature were covariates.
Results
Ephyra production and strobilation rates
A. aurita
The first A. aurita strobilations occurred in autumn in
all temperature groups in the first and second years
after polyp settlement. Ephyra were produced until
next May in both years in the 15–10–15�C group,
whereas ephyra production stopped after a tempera-
ture decrease to 5�C in January in the 15–05–15�C
groups (Fig. 1, left side). Few ephyrae per polyp were
produced in the temperature group with constant 15�C
and the most ephyrae per polyp were produced in the
15–10–15�C group in the first and in the second year
after settlement (Fig. 1, right side). Significantly
higher percentages of A. aurita polyps strobilated
after a temperature decrease in autumn than at
constant 15�C, and H01 was rejected for both years
(Figs. 2, 3; Table 2). The numbers of ephyrae pro-
duced per strobila did not differ significantly among
the temperature groups in the first year or in the second
year and H02 was not rejected (Fig. 2; Table 2). The
percentages of strobilating polyps were higher in the
second than in the first year, but the differences were
not significant, and H03 was not rejected (Fig. 3;
Table 3). Although the maximum numbers of ephyrae
per strobila were higher in the second year than in the
first, the means differed only slightly among groups,
and H04 was not rejected (Fig. 3; Table 3).
C. capillata
C. capillata polyps never strobilated in constant 15�C
during 22 months of observation. The first ephyra
appeared in February–March at the cold winter
temperature (5�C) in both years, whereas the first
ephyra appeared at least 1 month later at the 10�C
winter temperature (Fig. 1, left side). Ephyra produc-
tion continued until the beginning (second year) or end
of May (first year). In the first year, production of
ephyrae per polyp was higher in 5�C winter temper-
ature, whereas it was slightly higher in 10�C winter
temperature in the second year (Fig. 1, right side). In
the first year, the percentages of polyps strobilating
were significantly higher in the 15–05–15�C group
than in the 15–10–15�C and 15�C groups and H01 was
rejected (Fig. 2; Table 2). Although the percentages of
polyps strobilating differed only slightly for the
15–10–15�C and the 15–05–15�C groups, no strobi-
lation occurred at 15�C and H01 was rejected in the
second year as well (Fig. 3; Table 2). The numbers of
ephyrae per strobila were lower in groups with 5�C
than in those with 10�C winter temperature, but
differences were only significant in the first year (H02
Fig. 1 Numbers of ephyrae per polyp produced monthly (left
side) and total numbers of ephyrae produced per mean numbers
of
polyps counted monthly during 10 months of observation (15
Oct–15 Aug, right side) in different temperature groups of A.
aurita, C. capillata, C. lamarckii and Ch. hysoscella polyps. The
culture temperature was constant 15�C from 15th July to 15th
October in all temperature groups (not shown in the figure).
Polyp
numbers in different temperature groups are shown in Table 1
b
Hydrobiologia (2012) 690:127–140 131
123
rejected, Fig. 2; Table 2). The percentages of strobi-
lating polyps did not differ significantly in polyps of
different ages and H03 was not rejected (Fig. 3;
Table 3); however, the mean numbers of ephyrae per
strobila were significantly higher in the second year in
the 15–10–15�C group and the 15–05–15�C group
(H04 rejected, Fig. 3; Table 3).
C. lamarckii
In C. lamarckii cultures, the first ephyra appeared after
a temperature decrease to 10�C in groups 15–10–15�C
and 15–05–15�C; however, the most ephyrae per polyp
were produced in the constant 15�C group, whereas the
fewest were in the coldest winter temperature (5�C;
C. lamarckii
0
2
4
6
8
10
12
A. aurita
0
20
40
60
80
100
C. capillata
0
20
40
60
80
100
S
tr
o
b
il
a
ti
n
g
p
o
ly
p
s
(
%
)
0
20
40
60
80
100
Ch. hysoscella
0
20
40
60
80
100
15°C 15-10-15°C 15-05-15°C
Temperature group
C. lamarckii
1 5 °C 1 5 - 1 0 - 1 5 °C 1 5 - 0 5 - 1 5 °C
Temperature group
n = 6
n = 6
n = 6
n = 7
0
2
4
6
8
10
12
E
p
h
y
ra
e
p
e
r
s
tr
o
b
il
a
14184
A. aurita
C. capillata
0
2
4
6
8
10
12
28 79
0545 51
Ch. hysoscella
0
2
4
6
8
10
12
17 29 7
Fig. 2 Strobilating polyps (mean % ± SD) (left side) and
ephyrae produced per strobila (mean number ± SD) (right side)
in the first year after polyp settlement in different temperature
groups of A. aurita, C. capillata, C. lamarckii and Ch.
hysoscella polyps; n number of replicates (numbers of polyps
as shown in Table 1). The numbers of analysed strobilae appear
inside the bars. Diamond maximal number of ephyrae produced
by one strobila. The observation time was 12 months for A.
aurita (15 Sep–15 Sep) and C. capillata (15 Oct–15 Oct) and
10 months for C. lamarckii and Ch. hysoscella (15 Oct–15
Aug). Test statistics are shown in Table 2
132 Hydrobiologia (2012) 690:127–140
123
Fig. 1). All C. lamarckii polyps strobilated at least
once in all temperature groups ([100%). The percent-
ages of polyps strobilating twice were the highest in the
15–10–15�C groups, but the differences were not
significant, and H01 was not rejected (Fig. 2; Table 2).
The number of ephyrae produced per strobila, how-
ever, was significantly higher at constant 15�C than in
treatments with temperature decreases, and H02 was
rejected (Fig. 2; Table 2).
Ch. hysoscella
The monthly ephyra production per polyp was rela-
tively low in Ch. hysoscella (Fig. 1, left side). The
most ephyrae per polyp were in the 15–10–15�C
group, and the fewest ephyrae per polyp were
produced in the 15–05–15�C group (Fig. 1, right
side). The percentages of strobilating polyps were
significantly higher in the 15–10–15�C group than in
the other groups, and H01 was rejected (Fig. 2;
Table 2). In the 15�C and 15–05–15�C groups,
maxima of three ephyrae were produced per strobila,
whereas as many as six ephyrae per strobila were
produced in the 15–10–15�C group (Fig. 2); however,
the production of more then three ephyrae occurred
only in 7% of analysed strobilae. Consequently,
differences in ephyra production per strobila were
not significant among temperature groups and H02 was
not rejected (Fig. 2; Table 2).
Temperature change as a strobilation inducer
or inhibitor
Small percentages of polyps strobilated at constant
15�C in A. aurita, demonstrating that temperature
decrease was an important strobilation inducer; how-
ever, ephyra production stopped after temperature
decreased further to 5�C in winter. This result
demonstrated that a low winter temperature of 5�C
inhibited strobilation activity from February on
whereas a higher winter temperature of 10�C lead to
a longer strobilation period until spring (Fig. 1).
Temperature increases from 5 to 10�C in spring and
then to 15�C in summer did not induce strobilation in
A. aurita (Fig. 1).
Strobilation never occurred at constant 15�C in
C. capillata and ephyra production was lower when
temperature rose in spring and summer following
strobilation at 5 or 10�C winter temperatures (Fig. 1).
No ephyra was produced at temperatures exceeding
A. aurita
0
20
40
60
80
100
S
tr
o
b
il
a
ti
n
g
p
o
ly
p
s
(
%
)
1st year
2nd year
0
20
40
60
80
100
Temperature group
C. capillata
0
2
4
6
8
10
12
E
p
h
y
ra
e
p
e
r
s
tr
o
b
il
a
C. capillata
15°C 15-10-15°C 15-05-15°C 15°C 15-10-15°C 15-05-15°C
Temperature group
A. aurita
0
2
4
6
8
10
12
18 2815 19
18 26 1914
n = 3
n = 3
31
1st year
2nd year
Fig. 3 Strobilating polyps (mean % ± SD) (left side) and
ephyrae produced per strobila (mean number ± SD) (right side)
in the first year and in the second year after polyp settlement
in different temperature groups of A. aurita, C. capillata,
C. lamarckii and Ch. hysoscella polyps, n number of replicates
(numbers of polyps are shown in Table 1). The numbers of
analysed strobilae appear inside the bars. Diamond maximal
number of ephyrae produced by one strobila. In both analyses,
the observation time was 10 months (15 Oct–15 Aug) in both
years. Test statistics are shown in Table 3
Hydrobiologia (2012) 690:127–140 133
123
10�C in summer, suggesting strobilation inhibition at
warmer temperatures in C. capillata. In C. lamarckii,
ephyra production started earlier after a temperature
decrease to 10�C than at constant 15�C (Fig. 1),
showing a positive effect of temperature decrease on
strobilation induction, although the total ephyra pro-
duction was the highest at constant 15�C. In Ch.
hysoscella, strobilation activity was low in all tem-
perature treatments without clear responses to tem-
perature changes (Fig. 1).
Temperature effects on strobilation duration
and ephyrae per strobila
A significant effect of the number of ephyrae per
strobila on the strobilation duration was shown by
ANCOVA for all tested species (Fig. 4), and H05 was
rejected. Correlations among temperature treatments
and strobilation duration were not possible for A.
aurita because strobilation occurred mostly at 10�C;
thus, data at other temperatures were insufficient. In all
other tested species, the ANCOVA confirmed a
significant effect of temperature treatment on the
strobilation duration (Fig. 4), and H06 was rejected.
Discussion
Scyphopolyps are difficult to find and investigate in
the field because of their small sizes and their
preferences of colonizing the undersides of substrates
and concealed habitats (Pierce, 2009; Di Camillo
Table 2 Test statistics on the effects of temperature treatments
on the percentages of strobilating polyps (H01) and ephyrae
produced
per strobila (H02) in four species of scyphozoans
Species Null hypothesis Polyp age Test statistic P
A. aurita H01 1y F2,15 = 16.936 0.001
2y F2,6 = 14.779 0.005
H02 1y H2 = 0.573 0.751
2y H2 = 0.315 0.854
C. capillata H01 1y H2 = 13.940 0.001
2y H2 = 6.161 0.025
H02 1y T28,79 = 1936.000 0.003
2y T18,28 = 482.000 0.182
C. lamarckii H01 1y F2,15 = 1.224 0.322
H02 1y H2 = 40.367 0.001
Ch. hysoscella H01 1y F2,18 = 9.486 0.002
H02 1y H2 = 0.477 0.788
The temperature groups, numbers of replicates, mean values and
observation times are shown in Figs. 2 and 3. Strobilations in
the
first year after polyp settlement (1y) were analysed in all
species. Strobilations in the second year (2y) were analysed in
A. aurita and
C. capillata
Table 3 Test statistics of comparisons on strobilations in the
first and second year after polyp settlement in two scyphozoan
species
Species Null hypothesis 15�C 15-10-15�C 15-5-15�C
Test statistics P Test statistics P Test statistics P
A. aurita H03 T3,3 = 9.0 0.700 T3,3 = 7.0 0.200 T3,3 = 7.0
0.200
H04 No test, n  3 T18,26 = 424.5 0.645 T14,19 = 259.5 0.439
C. capillata H03 No strobilae T3,3 = 8.0 0.400 T3,3 = 8.5 0.400
H04 No strobilae T15,18 = 169.0 0.002 T19,28 = 292.5 0.001
Percentages of strobilating polyps (H03) and ephyrae produced
per strobila (H04) in different temperature treatments were
analysed.
Replicates, mean values and observation times are shown in Fig.
3
134 Hydrobiologia (2012) 690:127–140
123
et al., 2010). Laboratory investigations allow quanti-
fication of polyp survival and reproduction and are
therefore an important source of data (e.g. Purcell,
2007; Willcox et al., 2007; Liu et al., 2009; Sötje &
Jarms, 2009; Holst & Jarms, 2010). Although the
results from field observations may differ form
laboratory experiments (Purcell et al., 2009), the
results of this study demonstrated that simulation of
natural temperature cycles in the laboratory can be
used to test the effects of seasonal temperature
changes on strobilation. The strobilation activity
documented in two consecutive years in two species
(A. aurita and C. capillata) showed that repeated
temperature cycles in the laboratory experiments
caused very similar responses of the polyps. The
temperature cycles in the present experiments with
15�C maximum summer temperature and 5�C mini-
mum winter temperature differed from the natural
annual temperature cycles because of 2.5�C temper-
ature changes per month. Nevertheless, the laboratory
temperature conditions were similar to temperatures
found recently in the German Bight (Wiltshire &
Manly, 2004; www.bsh.de/en/Marine_data). The par-
allel experiments with warmer winter temperatures
(10�C) indicated how warmer winter temperatures, as
observed and predicted to progress in the North Sea
(Belkin, 2009), could affect the strobilation activity of
scyphopolyps in situ. In these experiments, warmer
winter temperature (10�C in comparison to 5�C) pos-
itively affected strobilation in several ways: 1. A
longer strobilation period or higher ephyra production
per polyp (in A. aurita, C. lamarckii and Ch. hysos-
cella; Fig. 1); 2. Higher percentages of polyp strobi-
lation (in A. aurita and Ch. hysoscella; Fig. 2); 3.
More ephyrae per strobila (in C. capillata, C. lama-
rckii, see Fig. 2); 4. A shorter strobilation duration (in
C. capillata and C. lamarcki, see Fig. 4). Many of the
changes in species abundances, population structure
and biogeographical ranges occur as a result of
increased reproductive output and juvenile survival in
response to increased warming (Mieszkowska et al.,
2006). The results of this study suggest that this could
also be true for the North Sea scyphozoans
investigated.
In A. aurita, the experiments showed significantly
higher percentages of strobilations after a temperature
decrease in autumn compared to constant 15�C dem-
onstrating the importance of a temperature decrease for
strobilation induction in this species. Spring strobila-
tion only occurred in experiments with 10�C winter
C. lamarckii
0
10
20
30
0 2 4 6 8 10 12
S
tr
o
b
il
a
ti
o
n
d
u
ra
ti
o
n
(
d
)
15°C 10°C
Ephyrae per strobila
A. aurita
0
10
20
30
10°C
C. capillata
0
10
20
30
40
50
0 2 4 6 8 10 12 0 2 4 6 8 10 12
10°C
Ch. hysoscella
0
10
20
30
0 2 4 6 8 10 12
15°C5°C
e
t
e
t
F =12.492, p = 0 .00 1e e
F =72.285, p <0 .00 1
F =76.459, p <0 .00 1
e
t
e
t
F =10.567, p = 0 .00 2
F =6.735 , p = 0 .0 13
e
t
e
t
n=141 n=126
n=46
F =41 .720 , p <0 .00 1
F =24 .735 , p <0 .00 1
n=127 10°C
5°C
Fig. 4 Strobilation
durations (mean
days ± SD) in individually-
monitored strobilae at
different constant
temperatures in relation to
ephyrae numbers produced
in the strobilae of A. aurita,
C. capillata, C. lamarckii
and Ch. hysoscella. The
effect of ephyra numbers
produced per strobila (e) on
the strobilation duration and
the effect of the temperature
treatment (t) on the
strobilation duration were
tested by ANCOVA.
n number of analysed
strobilae. df = 1 for all
performed tests. F and
P values are shown in the
figures
Hydrobiologia (2012) 690:127–140 135
123
http://www.bsh.de/en/Marine_data
temperature, but did not occur with rising temperature
in spring after a cold winter period of 5�C. Perhaps
under natural conditions, autumn strobilation in A.
aurita polyps can happen only if the temperature
decreases slowly and the period of moderate temper-
ature of about 10�C lasts for several weeks, whereas a
rapid temperature decrease may lead to inhibition of
strobilation in autumn. In agreement with this idea, in
situ autumn strobilations of A. aurita were observed in
areas with moderate winter temperatures, such as in
Sylt, German Bight (Thiel, 1938), Osterschelde,
Netherlands (Korringa, 1953), and Gullmarfjord,
western Sweden (Hernroth & Gröndahl, 1985, Grön-
dahl, 1988); however, in areas with a rapid temperature
decrease in autumn, such as in several Baltic Sea areas,
a later start of the strobilation activity in A. aurita was
documented, and strobilation occurred mainly in
winter and spring (Palmén, 1954; Kändler, 1961;
Thiel, 1962; Rasmussen, 1973; Möller, 1980b). The
ephyrae may survive the cold winter periods in deep
water layers without further development, which could
explain the main time of ephyra abundance in the
plankton in autumn and spring (Rasmussen, 1973;
Hernroth & Gröndahl, 1985; Gröndahl, 1988). In
Southampton Water and Horsea Lake in southern
England, ephyra production begins in December and
lasts 7 months (Lucas, 1996; Lucas et al., 1997),
confirming the results of this study of an extended
strobilation phase in A. aurita at warmer winter
temperatures (Fig. 1). Recent molecular genetic study
detected that A. aurita is not a single species, but
includes members of several molecular species (Daw-
son, 2003). A. aurita populations occurring in the
North Atlantic and adjacent seas are probably adapted
to the temperature regime in these areas (Dawson,
2003), and therefore, our results reflect the strobilation
behaviour of polyps from this temperature regime only.
The tests of this study showed shorter strobilation
duration and higher ephyra production per strobila of
C. capillata polyps at warmer temperatures. On the
other hand, cold winter temperatures had positive
effects on strobilation in C. capillata polyps; strobi-
lation started earlier at colder temperatures, and unlike
A. aurita, ephyra production was not inhibited by the
cold winter temperature (5�C). In these experiments,
C. capillata was the only species without any strobi-
lation during 22 months at the warm temperature of
15�C. Strobilation induction of C. capillata may
strictly depend on a temperature decrease, which
may explain why the distribution of the species is
limited to northern boreal areas (Russell, 1970),
whereas Cyanea medusae from the warmer U.S.
Atlantic, the Gulf of Mexico and Australian waters
may represent other species of Cyanea (Bayha, 2005;
Dawson, 2005). In the North Sea, C. capillata
medusae are rare in the southern part and do not
appear in the English Channel. In the Irish Sea, their
occurrence also is limited to the northern part (Russell,
1970; Hay et al., 1990; Doyle et al., 2007). The
simulated annual seasons in present experiments
induced ephyra production from February until June,
which matched field observations on C. capillata
strobilation and occurence of the ephyrae in areas with
a similar temperature regime (Hartlaub, 1894; Ver-
wey, 1942; Gröndahl, 1988). Although the polyps are
obviously adapted to cold temperature conditions,
they have not been reported from the southern or
eastern Baltic Sea, where the C. capillata medusae
appear each summer (Möller, 1980a; Barz et al. 2006).
Recent studies demonstrated that C. capillata polyps
are able to strobilate at a low salinity of 12 and may be
more widespread in the Baltic Sea than previously
thought (Holst & Jarms, 2010). In accordance with
previous studies (Gröndahl, 1988), the results of this
study confirm that C. capillata polyps are tolerant of
cold temperatures, indicating that the low Baltic Sea
winter temperatures probably do not limit their
distribution. I therefore believe that the only reason
why the polyps have not been found in this area to date
is that there were too few efforts undertaken to find
them.
The medusae of C. lamarckii have a more southern
distribution in the North and Irish seas than do C.
capillata medusae (Russell, 1970; Hay et al., 1990;
Doyle et al., 2007). In the Baltic Sea, C. lamarckii
medusae appear rarely in Danish waters (Rasmussen,
1973), whereas they occur periodically from March
until June off the Swedish west coast (Gröndahl, 1988).
C. lamarckii ephyrae were not found in 4 years of
plankton sampling on the Swedish west coast and no
strobilation was observed on settling plates in the field,
leading to the conclusion that C. lamarckii polyps do
not strobilate there (Gröndahl, 1988). C. lamarckii
polyps have not yet been described in their natural
habitat, but present laboratory studies indicate positive
effects of warm temperature on strobilation: higher
production of ephyrae per strobila and shorter strobi-
lation duration. This may enable their distribution to
136 Hydrobiologia (2012) 690:127–140
123
expand to the northern North Sea with rising winter
temperatures due to climate changes. From there, the
polyps may also extend into the Baltic Sea because of
their high tolerance of low salinity (Holst & Jarms,
2010). The present experiments demonstrated a long
strobilation phase of C. lamarckii polyps from winter
until the next summer in agreement with observations
of abundant C. lamarckii medusae of various sizes and
different developmental stages from spring until late
summer in the German Bight and off the Dutch coast
(Verwey, 1942; Künne, 1952).
Ch. hysoscella medusae also are distributed mainly
in the southern North and Irish seas (Russell, 1970;
Hay et al., 1990; Doyle et al., 2007). Verwey (1942),
suggested strobilation of Ch. hysoscella with increas-
ing temperature in spring and summer, but the polyps
have not yet been found in their natural habitat in the
North Sea. A mild winter in 1988 in the German Bight
was followed by early appearance and high abundance
of Ch. hysoscella medusae in the summer, leading to
the conclusion that polyp’s survival during the winter
was higher at warm temperatures (Merck, 1990).
These observations agree with experimental results of
this study showing very low ephyra production at cold
winter temperatures and shorter strobilation duration
at warmer temperatures. Ch. hysoscella planulae are
able to settle at salinities at least as low as 20 (Holst &
Jarms, 2010), and thus Ch. hysoscella medusae and
polyps may be able to spread from the North Sea into
the Baltic Sea with continued climate warming.
The number of ephyrae produced by each strobila is
affected by temperature, other abiotic factors, food
supply and polyp size (Russell, 1970; Purcell et al.,
1999). The results of this study agree with those of
previous laboratory experiments on polyp cultures
demonstrating that warm temperatures increase the
strobilation rates of polyps and ephyra production,
except at very high temperatures (Purcell et al., 1999,
2012; Purcell, 2007; Liu et al., 2009). The number of
ephyrae in the strobila increases with polyp’s size
(Russell, 1970). This may explain why the C. capillata
polyps in the present experiments were able to produce
more ephyrae by the second year when they grew to a
larger size. Salinity also is known to affect strobilation
rates of North Sea Scyphozoa (Holst & Jarms, 2010)
and other species (reviewed in Purcell et al., 2009).
Purcell et al. (2009) concluded that the combined
effects of temperature, salinity, light and food deter-
mined the amount and time of strobilation in situ.
Only a few recent studies have monitored polyps in
situ (see Purcell et al., 2009; Di Camillo et al., 2010;
Ishii & Katsukoshi, 2010). Climatic changes in the
North Sea related to the North Atlantic Oscillation
(NAO) affect jellyfish abundances and may also affect
the strobilation of the benthic polyps in this area
(Lynam et al., 2010); however, the effects of the NAO
depends on the depth that macrozoobenthos animals
occur, and therefore, the estimation of the NAO’s
effect on strobilation is not possible without knowing
the locations and depths of polyp habitats (Lynam
et al., 2005). The effect of the NAO on North Sea
polyps is likely to be high because strobilation occurs
mainly in winter and spring when the NAO’s influence
is the greatest in the North Sea (Lynam et al., 2010).
The results of the present study support the idea that
variable winter temperatures affect the strobilation
activity of North Sea Scyphozoa.
Increasing winter temperature probably will affect
the abundances and distributions of scyphozoan
jellyfish species in the North Sea. The more southerly
species, C. lamarckii and Ch. hysoscella could expand
to the northern parts of the North Sea and possibly into
the Baltic Sea. The adaptable species A. aurita
presumably will benefit from warmer temperatures,
having longer strobilation periods (present study),
faster growth due to higher feeding rates (Hansson,
1997; Widmer, 2005) and higher reproduction rates of
medusae (Ishii & Takagi, 2003). The cold water C.
capillata might be the only North Sea scyphozoan that
could suffer from warmer temperatures; however, C.
capillata ephyra production also occurred at the warm
winter temperature of 10�C (Fig. 1). In general, I
assume that the abundances of scyphozoan jellyfish in
the North and Baltic seas will increase in future years
if the water temperatures continue to increase as
predicted (Belkin, 2009). This assessment agrees with
the opinion of other authors suggesting an increase of
gelatinous predators (scyphomedusae, hydromedusae,
siphonophores and ctenophores) in the North Sea due
to climate changes, including increasing temperatures,
the reduction of the ocean pH and probably, the
increasing Atlantic inflow into the North Sea (Attrill
et al., 2007; Boersma et al., 2007; Doyle et al., 2008;
Lilley et al., 2009; Licandro et al., 2010). The results
of this study and previous studies clearly show the
linkage between physical environmental factors and
ephyra production and thus forecasts of the abundance
and distribution of scyphomedusae might be possible
Hydrobiologia (2012) 690:127–140 137
123
by circulation models in future (Johnson et al., 2001,
2005; Barz et al., 2006). More knowledge on the
locations of polyp habitats and on the reproduction
cycles of the benthic polyp stage in the field is
necessary for successful monitoring and understand-
ing the population dynamics in scyphozoan jellyfish.
Acknowledgments I thank PD Dr. Gerhard Jarms for his
support, for imparting his knowledge on polyp culturing and for
providing the research facilities. I am grateful to the
Biologische
Anstalt Helgoland (Alfred Wegener Institute) for providing the
guest laboratory and I am thankful for the assistance of students
and technicians of the Biocenter Grindel. I thank Drs. Ilka
Sötje,
Jennifer Purcell, and the reviewers for their helpful comments
on the manuscript, and Dr. Caroline Stolter for her help in
the statistics. This study is part of a Ph. D. thesis conducted at
the Biocenter Grindel and Zoological Museum in Hamburg
supported by EUROGEL (EUROpean GELatinous Zoo-
plankton, European Commission Contract no. EVK-CT-2002-
00074).
References
Attrill, M. J., J. Wright & M. Edwards, 2007. Climate-related
increases in jellyfish frequency suggest a more gelatinous
future for the North Sea. Limnology and Oceanography 52:
480–485.
Barz, K. & H.-J. Hirche, 2007. Abundance, distribution and
prey
composition of scyphomedusae in the southern North Sea.
Marine Biology 151: 1021–1033.
Barz, K., H.-H. Hinrichsen & H.-J. Hirche, 2006. Scyphozoa in
the Bornholm Basin (central Baltic Sea) - the role of
advection. Journal of Marine Systems 60: 167–176.
Bayha, K. M., 2005. The molecular systematics and population
genetics of four coastal ctenophores and scyphozoan jel-
lyfish of the United States Atlantic and Gulf of Mexico.
Dissertation, University of Delaware: 283 pp.
Belkin, I. M., 2009. Rapid warming of large marine ecosystems.
Progress in Oceanography 81: 207–213.
Boero, F., J. Boullion, C. Gravilli, M. P. Miglietta, T. Parsons
&
S. Piraino, 2008. Gelatinous plankton: irregularities rule
the world (sometimes). Marine Ecology Progress Series
356: 299–310.
Boersma, M., A. M. Malzahn, W. Greve & J. Javidpour, 2007.
The first occurrence of the ctenophore Mnemiopsis leidyi in
the North Sea. Helgoland Marine Research 61: 153–155.
Brewer, R. H. & J. S. Feingold, 1991. The effect of temperature
on the benthic stages of Cyanea (Cnidaria: Scyphozoa),
and their seasonal distribution in the Niantic River estuary,
Connecticut. Journal of Experimental Marine Biology and
Ecology 152: 49–60.
CIESM, 2001. Gelatinous zooplankton outbreaks: theory and
practice. CIESM Workshop Series 14: 112 pp.
Dawson, M. N., 2003. Macro-morphological variation among
cryptic species of the moon jellyfish, Aurelia (Cnidaria:
Scyphozoa). Marine Biology 143: 369–379.
Dawson, M. N., 2005. Cyanea capillata is not a cosmopolitan
jellyfish: morphological and molecular evidence for C.
annaskala and C. rosea (Scyphozoa: Semaeostomeae:
Cyaneidae) in south-eastern Australia. Invertebrate Sys-
tematics 19: 361–370.
Di Camillo, C. G., F. Betti, M. Bo, M. Martinelli, S. Puce & G.
Bavestrello, 2010. Contribution to the understanding of
seasonal cycle of Aurelia aurita (Cnidaria: Scyphozoa)
scyphopolyps in the northern Adriatic Sea. Journal of the
Marine Biological Association of the United Kingdom 90:
1105–1110.
Doyle, T. K., J. D. R. Houghton, S. M. Buckley, G. C. Hays &
J.
Davenport, 2007. The broad-scale distribution of five jel-
lyfish species across a temperate coastal environment.
Hydrobiologia 579: 29–39.
Doyle, T. K., H. De Haas, D. Cotton, B. Dorschel, V. Cummins,
J. D. R. Houghton, J. Davenport & G. C. Hays, 2008.
Widespread occurrence of the jellyfish Pelagia noctiluca in
Irish coastal and shelf waters. Journal of Plankton Research
30: 963–968.
Gröndahl, F., 1988. A comparative ecological study on the
scyphozoans Aurelia aurita, Cyanea capillata and Cyanea
lamarckii in the Gullmar Fjord, western Sweden. Marine
Biology 97: 541–550.
Hansson, L. J., 1997. Effect of temperature on growth rate of
Aurelia aurita (Cnidaria, Scyphozoa) from Gullmarsfjor-
den, Sweden. Marine Ecology Progress Series 161:
145–153.
Hartlaub, C., 1894. Die Coelenteraten Helgolands. Wissens-
chaftliche Meeresuntersuchungen Helgoland Neue Folge
1: 161–206.
Hay, S. J., J. R. G. Hislop & A. M. Shanks, 1990. North Sea
scyphomedusae; summer distribution, estimated biomass
and significance particularly for 0-Group gadoid fish.
Netherlands Journal of Sea Research 25: 113–130.
HELCOM, 2007. Climate change in the Baltic Sea Area –
HELCOM thematic assessment in 2007. Baltic Sea Envi-
ronment Proceedings 111: 1–49.
Hernroth, L. & F. Gröndahl, 1985. On the biology of Aurelia
aurita (L.): 2. Major factors regulating the occurrence of
ephyrae and young medusae in the Gullmar Fjord, western
Sweden. Bulletin of Marine Science 37: 567–576.
Holst, S. & G. Jarms, 2007. Substrate choice and settlement
preferences of planula larvae of five Scyphozoa (Cnidaria)
from German Bight, North Sea. Marine Biology 151:
863–871.
Holst, S. & G. Jarms, 2010. Effects of low salinity on
settlement
and strobilation of Scyphozoa (Cnidaria): is the lion’s
mane Cyanea capillata (L.) able to reproduce in the
brackish Baltic Sea? Hydrobiologia 645: 53–68.
Holst, S., I. Sötje, H. Tieman & G. Jarms, 2007. Life cycle of
the
rhizostome jellyfish Rhizostoma octopus (L.) (Scyphozoa,
Rhizostomeae), with studies on cnidocysts and statoliths.
Marine Biology 151: 1695–1710.
IPCC, 2007. Summary for policymakers. In Solomon, S., D.
Qin, M. Manning, Z. Chen, M. Marquis, K. B. Averyt, M.
Tignor & H. L. Miller (eds), Climate Change 2007: The
Physical Science Basis. Contribution of Working Group I
to the Fourth Asessment Report of the Intergovernmental
Panel on Climate Change. Cambridge University Press,
Cambridge.
138 Hydrobiologia (2012) 690:127–140
123
Ishii, H. & K. Katsukoshi, 2010. Seasonal and vertical distri-
bution of Aurelia aurita polyps on a pylon in the innermost
part of Tokyo Bay. Journal of Oceanography 66: 329–336.
Ishii, H. & A. Takagi, 2003. Development time of planula
larvae
on the oral arms of the scyphomedusa Aurelia aurita.
Journal of Plankton Research 25: 1447–1450.
Jarms, G., 2010. The early life history of Scyphozoa with
emphasis on Coronatae a review with a list of described life
cycles. Verhandlungen des Naturwissenschaftlichen Ve-
reins Hamburg 45: 17–31.
Johnson, D. R., H. M. Perry & W. D. Burke, 2001. Developing
jellyfish strategy hypotheses using circulation models.
Hydrobiologia 451: 213–221.
Johnson, D. R., H. M. Perry & W. M. Graham, 2005. Using
nowcast model currents to explore transport of non-indig-
enous jellyfish into the Gulf of Mexico. Marine Ecology
Progress Series 305: 139–146.
Kändler, R., 1961. Über das Vorkommen von Fischbrut, De-
capodenlarven und Medusen in der Kieler Förde. Kieler
Meeresforschung 17: 48–65.
Korringa, P., 1953. The shell of Ostrea edulis as a habitat.
Archives Neerlandaises de Zoologie 10: 32–59.
Künne, C., 1952. Untersuchungen über das Großplankton in der
Deutschen Bucht und im Nordsylter Wattenmeer. Hel-
goländer Wissenschaftliche Meeresuntersuchungen 4: 1–54.
Licandro, P., D. V. P. Conway, M. N. Daly Yahia, M. L. Fer-
nandez De Puelles, S. Gasparini, J. H. Hecq, P. Tranter &
R. R. Kirby, 2010. A blooming jellyfish in the northeast
Atlantic and Mediterranean. Biology Letters 6: 688–691.
Lilley, M. K. S., J. D. R. Houghton & G. C. Hays, 2009. Dis-
tribution, extent of inter-annual variability and diet of the
bloom-forming jellyfish Rhizostoma in European waters.
Journal of the Marine Biological Association of the United
Kingdom 89: 39–48.
Liu, W.-C., W.-T. Lo, J. E. Purcell & H.-H. Chang, 2009.
Effects of temperature and light intensity on asexual
reproduction of the scyphozoan, Aurelia aurita (L.) in
Taiwan. Hydrobiologia 616: 247–258.
Lucas, C. H., 1996. Population dynamics of Aurelia aurita
(Scyphozoa) from an isolated brackish lake, with particular
reference to sexual reproduction. Journal of Plankton
Research 18: 987–1007.
Lucas, C. H., A. G. Hirst & J. A. Williams, 1997. Plankton
dynamics and Aurelia aurita production in two contrasting
ecosystems: comparison and consequences. Estuarine,
Coastal and Shelf Science 45: 209–219.
Lynam, C. P., S. J. Hay & A. S. Brierley, 2005. Jellyfish
abundance and climatic variation: contrasting responses in
oceanographically distinct regions of the North Sea, and
possible implications for fisheries. Journal of the Marine
Biological Association of the United Kingdom 85:
435–450.
Lynam, C. P., M. J. Attrill & M. D. Skogen, 2010. Climatic and
oceanic influences on the abundance of gelatinous zoo-
plankton in the North Sea. Journal of the Marine Biological
Association of the United Kingdom 90: 1153–1159.
Merck, T., 1990. Untersuchungen zur ökologischen Nische von
Chrysaora hysoscella. Jahresbericht der Biologischen
Anstalt Helgoland 1989: 53–54.
Mieszkowska, N., R. Leaper, P. Moore, M. A. Kendall, M.
T. Burrows, D. Lear, E. Poloczanska, K. Hiscock, P.
S. Moschella, R. C. Thompson, R. J. Herbert, D. Lafolley,
J. Baxter, A. J. Southward & S. J. Hawkins, 2006. Marine
biodiversity and climate change. Assessing and predicting
the influence of climate change using intertidal rocky shore
biota. Final report for United Kingdom funders. Marine
Biological Association Occasional Publications 20: 1–53.
Miyake, H., M. Terazaki & Y. Kakinuma, 2002. On the polyps
of the common jellyfish Aurelia aurita in Kagoshima Bay.
Journal of Oceanography 58: 451–459.
Molinero, J. C., M. Casini & E. Buecher, 2008. The influence of
the Atlantic and regional climate variability on the long-
term changes in gelatinous carnivore populations in the
northwestern Mediterranean. Limnology and Oceanogra-
phy 53: 1456–1467.
Möller, H., 1980a. A summer survey of large zooplankton,
particularly scyphomedusae, in North Sea and Baltic.
Meeresforschung 28: 61–68.
Möller, H., 1980b. Population dynamics of Aurelia aurita
medusae in Kiel Bight, Germany (FRG). Marine Biology
60: 123–128.
Palmén, E., 1954. Seasonal occurrence of ephyrae and sub-
sequent instars of Aurelia aurita (L.) in the shallow waters
of Tvärminne, S. Finland. Archivum Societatis Zoologicae
Botanicae Fennicae Vanamo 8: 122–138.
Pierce, J., 2009. Prediction, location, collection and transport of
jellyfish (Cnidaria) and their polyps. Zoo Biology 28:
163–176.
Purcell, J. E., 2005. Climate effects on formation of jellyfish
and
ctenophore blooms: a review. Journal of the Marine Bio-
logical Association of the United Kingdom 85: 461–476.
Purcell, J. E., 2007. Environmental effects on asexual repro-
duction rates of the scyphozoan Aurelia labiata. Marine
Ecology Progress Series 348: 183–196.
Purcell, J. E., 2009. Extension of methods for jellyfish and
ctenophore trophic ecology to large-scale research. Hyd-
robiologia 616: 23–50.
Purcell, J. E., 2011. Jellyfish and ctenophore blooms coincide
with human proliferations and environmental perturba-
tions. Annual Review of Marine Science. doi:10.1146/
annurev-marine-120709-142751.
Purcell, J. E., J. R. White, D. A. Nemazie & D. A. Wright,
1999.
Temperature, salinity and food effects on asexual repro-
duction and abundance of the scyphozoan Chrysaora
quinquecirrha. Marine Ecology Progress Series 180:
486–487.
Purcell, J. E., S.-I. Uye & W.-T. Lo, 2007. Anthropogenic
causes of jellyfish blooms and their direct consequences for
humans: a review. Marine Ecology Progress Series 350:
153–174.
Purcell, J. E., R. A. Hoover & N. T. Schwarck, 2009.
Interannual
variation of strobilation by the scyphozoan Aurelia labiata
in relation to polyp density, temperature, salinity, and light
conditions in situ. Marine Ecology Progress Series 375:
139–149.
Purcell, J. E., D. Atienza, V. Fuentes, A. Olariaga, U. Tilves, C.
Colahan, J.-M. Gili, 2012. Temperature effects on asexual
reproduction rates of scyphozoan polyps from the north-
west Mediterranean Sea. Hydrobiologia, this issue.
doi:10.1007/s10750-012-1047-7.
Rasmussen, E., 1973. Systematic and ecology of the Isefjord
marine fauna (Denmark). Ophelia 11: 1–507.
Hydrobiologia (2012) 690:127–140 139
123
http://dx.doi.org/10.1146/annurev-marine-120709-142751
http://10.1007/s10750-012-1047-7
Richardson, A. J., A. Bakun, G. C. Hays & M. J. Gibbons, 2009.
The jellyfish joyride: causes, consequences and manage-
ment responses to a more gelatinous future. Trends in
Ecology & Evolution 24: 312–322.
Russell, F. S., 1970. The medusae of the British Isles II. Pelagic
Scyphozoa with a supplement to the first volume on
hydromedusae. Cambridge University Press, Cambridge.
Sabatés, A., F. Pagès, D. Atienza, V. Fuentes, J. E. Purcell & J.-
M. Gili, 2010. Planktonic cnidarian distribution and feed-
ing of Pelagia noctiluca in the NW Mediterranean Sea.
Hydrobiologia 645: 153–165.
Sötje, I. & G. Jarms, 2009. Derivation of the reduced life cycle
of Thecoscyphus zibrowii Werner, 1984 (Cnidaria, Scy-
phozoa). Marine Biology 156: 2331–2341.
Thiel, M. E., 1938. Scyphomedusae. In Bronn, H. G. (ed.), Dr.
H. G. Bronns Klassen und Ordnungen des Tierreichs.
Akademische Verlagsgesellschaft, Leipzig.
Thiel, H., 1962. Untersuchungen über die Strobilisation von
Aurelia aurita LAM. an einer Population der Kieler Förde.
Kieler Meeresforschungen 18: 198–230.
Tronolone, V. B., A. C. Morandini & A. E. Bigotto, 2002. On
the
occurrence of scyphozoan ephyrae (Cnidaria, Scyphozoa,
Semaestomeae and Rhizostomeae) in the southeastern
Brazilian coast. Biota Neotropica 2: 1–18.
Verwey, J., 1942. Die Periodizität im Auftreten und die aktiven
und passiven Bewegungen der Quallen. Archives Neer-
landaises de Zoologie 6: 363–468.
Widmer, C. L., 2005. Effects of temperature on growth of north-
east Pacific moon jellyfish ephyrae, Aurelia labiata (Cni-
daria: Scyphozoa). Journal of the Marine Biological
Association of the United Kingdom 85: 569–573.
Willcox, S., N. Moltschaniwskyj & C. Crawford, 2007. Asexual
reproduction in scyphistomae of Aurelia sp.: effects of
temperature and salinity in an experimental study. Journal
of Experimental Marine Biology and Ecology 353:
107–114.
Wiltshire, K. H. & B. F. J. Manly, 2004. The warming trend at
Helgoland Roads, North Sea: Phytoplankton response.
Helgoland Marine Research 58: 269–273.
Wiltshire, K. H., A. Kraberg, I. Bartsch, M. Boersma, H.-D.
Franke, J. Freud, C. Gebühr, G. Gerdts, K. Stockmann & A.
Wichels, 2010. Helgoland Roads, North Sea: 45 years of
change. Estuaries and Coasts 33: 295–310.
You, K., C. Ma, H. Gao, G. Li, M. Zhang, B. Wang & R. Wei,
2008. The effects of temperature decrease on the scyphis-
tomae strobilation of Jellyfish, Rhopilema esculentum
Kishinouye. Journal of the World Aquaculture Society 39:
706–711.
140 Hydrobiologia (2012) 690:127–140
123
Scientific Article Discussions
It is important for scientists to be able to read, analyze, and
synthesize scientific journal articles in order to answer
questions and determine the current state of knowledge on a
topic. We will have seven paper discussions over the course of
the semester, six led by pairs of students. Each student is
required to co-lead one discussion.
The discussion leaders are required to:
1. Examine the list of questions provided below for their
assigned article discussion (#2-7) and choose a question (or
come up with your own) that you would like to address with the
literature discussion.
2. Findone scientific article that you think addresses that topic.
(You will probably need to search through several papers to
find one that actually address the question or are interesting to
you).
3. Meet with me at least two weeks before the discussion day to
look over your topic and journal article. Be sure you read the
article before you meet with me!You need to send me the
articles you propose to use at least two days in advance of our
meeting.
4. On the day of discussion, give a 5-10 minute mini-lesson
reiterating what the foundational question was addressed by the
paperand thenproviding background context for the paper and
summarizing the key question(s), methods, results, and
conclusions. This should incorporate a PowerPoint presentation
with the most pertinent (not necessarily all) information and
figures…just hit the most relevant items. Try not to provide
critique or opinions about the paper during the summary.
5. Facilitate discussion about the paper. Here are some tips (in
no particular order) of things you might want to include in your
discussion:
a. Try not to let your opinion of the paper dominate the
discussion. Encourage everyone to contribute his or her
thoughts.
b. Solicit people’s opinions of what they found to be the
strongest or weakest parts of the paper. You can ask for
everyone to respond, or specific individuals (but spread the love
a little).
c. Ask for people to share what confusions they had, or what
they thought was unclear.
d. Discuss whether the authors achieved what they set out to do
and whether their conclusions were meaningful, reasonably
“within the bounds of their data”, and/or important or
generalizable to other topics.
e. You can ask people what they would have done differently
for this study, or helpful follow-up studies that could be
pursued.
f. Ask the group what research questions arose in their minds
while reading the article(s).
g. Try to conclude with a brief summary of what
ideas/conclusions were produced/shared during the article
discussion you just led.
The rest of the class is required to:
1. Read the paper.
2. Write a summary of the key points of each paper and how
they relate to larger question being addressed or the course
content. This summary must include at least one idea or
question for discussion (see the list of discussion tips above and
consider making notes about those while reading). The summary
should be short (approximately ½-page single-spaced), typed,
and brought to the discussion.
3. Participate in the discussion during class. Active
participation is essential for discussion and relies on having
read the papers. (Your written summary and active participation
in discussions accounts for 7.5% of your course grade.)
Article Discussion Possible Questions: Other questions are
possible, so if you have a question that is somewhat related to
what we have discussed in class, then suggest that.
Article Discussion #1: (Instructor-led)
How should scientists approach the study of the natural world?
Article Discussion #2:
What environmental traits determine the geographic range of a
species?
How to species respond to climate change?
Are native or invasive species better able to adapt to
environmental change?
How do animals (or plants) live in the desert with such little
water?
Why can some fish live in freshwater, some in salt water, and
some can live in either?
How do plants maintain homeostasis of energy production under
various environmental conditions?
How do organisms optimize their time when obtaining energy?
Article Discussion #3:
What are the costs and benefits of direct versus indirect
development?
What environmental conditions cause variation in modes of
reproduction? (between species or within one species)
Why do some organisms produce few offspring while other
produce many?
What factors determine when an organism begins to reproduce?
What is better for a larvae to do, develop fast an metamorphose
when small or develop more slowly and metamorphose when
large?
How do different dispersal methods affect population
connectivity?
What factors influence the magnitude of population dispersal?
Are (or when are) some methods of measuring abundance
better/worse than others?
How does [insert some aspect of population demographics]
influence change in population growth?
What ecological circumstances lead to different types of
survival curves (or reproductive timing) in a species (or
different species)?
What exerts more influence on populations of [insert species],
density-dependent or density independent processes?
How to population outbreaks affect an ecosystem (or
community)?
Can population cycles be predicted? How? (Or what factors
determine population cycles?)
How impact does the allee have on a population?
More to come for the later discussions…
BIO317 Spring 2018
J E L L Y F I S H B L O O M SEffects of climate warming on.docx

More Related Content

Similar to J E L L Y F I S H B L O O M SEffects of climate warming on.docx

Evidence for impacts by jellyfish on north sea
Evidence for impacts by jellyfish on north seaEvidence for impacts by jellyfish on north sea
Evidence for impacts by jellyfish on north sea
ratupura
 
Experiments with duckweed–moth systems suggest thatglobal wa.docx
Experiments with duckweed–moth systems suggest thatglobal wa.docxExperiments with duckweed–moth systems suggest thatglobal wa.docx
Experiments with duckweed–moth systems suggest thatglobal wa.docx
elbanglis
 
Blubber thickness variation in Grey, Harbour & Ringed seals_korrigerade energ...
Blubber thickness variation in Grey, Harbour & Ringed seals_korrigerade energ...Blubber thickness variation in Grey, Harbour & Ringed seals_korrigerade energ...
Blubber thickness variation in Grey, Harbour & Ringed seals_korrigerade energ...
Andre Hermansson
 
Eelgrass Poster-Amber
Eelgrass Poster-AmberEelgrass Poster-Amber
Eelgrass Poster-Amber
Amber Wolf
 
Conley&Gartner_MyctoGrowth
Conley&Gartner_MyctoGrowthConley&Gartner_MyctoGrowth
Conley&Gartner_MyctoGrowth
Walter Conley
 
Running Head CRITIQUE OF OCEAN TEMPERATURES IN CORAL REEFSCRIT.docx
Running Head  CRITIQUE OF OCEAN TEMPERATURES IN CORAL REEFSCRIT.docxRunning Head  CRITIQUE OF OCEAN TEMPERATURES IN CORAL REEFSCRIT.docx
Running Head CRITIQUE OF OCEAN TEMPERATURES IN CORAL REEFSCRIT.docx
healdkathaleen
 
Annotated Bibliography The following information will help yo.docx
Annotated Bibliography The following  information will help yo.docxAnnotated Bibliography The following  information will help yo.docx
Annotated Bibliography The following information will help yo.docx
durantheseldine
 

Similar to J E L L Y F I S H B L O O M SEffects of climate warming on.docx (20)

The influence of environmental factors on pond activity of aquatic red spotte...
The influence of environmental factors on pond activity of aquatic red spotte...The influence of environmental factors on pond activity of aquatic red spotte...
The influence of environmental factors on pond activity of aquatic red spotte...
 
Scientific talk on effects of climate variation and young fish
Scientific talk on effects of climate variation and young fishScientific talk on effects of climate variation and young fish
Scientific talk on effects of climate variation and young fish
 
ECP-1400.doc
ECP-1400.docECP-1400.doc
ECP-1400.doc
 
(Artigo 4) mol biol evol 2011-wägele-699-706
(Artigo 4) mol biol evol 2011-wägele-699-706(Artigo 4) mol biol evol 2011-wägele-699-706
(Artigo 4) mol biol evol 2011-wägele-699-706
 
Evidence for impacts by jellyfish on north sea
Evidence for impacts by jellyfish on north seaEvidence for impacts by jellyfish on north sea
Evidence for impacts by jellyfish on north sea
 
Aquatic ecosystems
Aquatic ecosystemsAquatic ecosystems
Aquatic ecosystems
 
Experiments with duckweed–moth systems suggest thatglobal wa.docx
Experiments with duckweed–moth systems suggest thatglobal wa.docxExperiments with duckweed–moth systems suggest thatglobal wa.docx
Experiments with duckweed–moth systems suggest thatglobal wa.docx
 
Analysis of some aspect of physico chemical parameters of river
Analysis of some aspect of physico chemical parameters of riverAnalysis of some aspect of physico chemical parameters of river
Analysis of some aspect of physico chemical parameters of river
 
Blubber thickness variation in Grey, Harbour & Ringed seals_korrigerade energ...
Blubber thickness variation in Grey, Harbour & Ringed seals_korrigerade energ...Blubber thickness variation in Grey, Harbour & Ringed seals_korrigerade energ...
Blubber thickness variation in Grey, Harbour & Ringed seals_korrigerade energ...
 
FUNIBER. Estudio de Erik Simões sobre el impacto de las mareas rojas.
FUNIBER.  Estudio de Erik Simões sobre el impacto de las mareas rojas. FUNIBER.  Estudio de Erik Simões sobre el impacto de las mareas rojas.
FUNIBER. Estudio de Erik Simões sobre el impacto de las mareas rojas.
 
Diversity of halophilic mycoflora habitat in saltpans of Tuticorin and Marakk...
Diversity of halophilic mycoflora habitat in saltpans of Tuticorin and Marakk...Diversity of halophilic mycoflora habitat in saltpans of Tuticorin and Marakk...
Diversity of halophilic mycoflora habitat in saltpans of Tuticorin and Marakk...
 
Eelgrass Poster-Amber
Eelgrass Poster-AmberEelgrass Poster-Amber
Eelgrass Poster-Amber
 
Conley&Gartner_MyctoGrowth
Conley&Gartner_MyctoGrowthConley&Gartner_MyctoGrowth
Conley&Gartner_MyctoGrowth
 
Ferrer et al. 2015
Ferrer et al. 2015Ferrer et al. 2015
Ferrer et al. 2015
 
Running Head CRITIQUE OF OCEAN TEMPERATURES IN CORAL REEFSCRIT.docx
Running Head  CRITIQUE OF OCEAN TEMPERATURES IN CORAL REEFSCRIT.docxRunning Head  CRITIQUE OF OCEAN TEMPERATURES IN CORAL REEFSCRIT.docx
Running Head CRITIQUE OF OCEAN TEMPERATURES IN CORAL REEFSCRIT.docx
 
2009 assessment effects of cage culture on nitrogen
2009 assessment effects of cage culture on nitrogen2009 assessment effects of cage culture on nitrogen
2009 assessment effects of cage culture on nitrogen
 
Robbart et al. 2004
Robbart et al. 2004Robbart et al. 2004
Robbart et al. 2004
 
arctic seabirds
arctic seabirdsarctic seabirds
arctic seabirds
 
사3
사3사3
사3
 
Annotated Bibliography The following information will help yo.docx
Annotated Bibliography The following  information will help yo.docxAnnotated Bibliography The following  information will help yo.docx
Annotated Bibliography The following information will help yo.docx
 

More from christiandean12115

10.11771066480704270150THE FAMILY JOURNAL COUNSELING AND THE.docx
10.11771066480704270150THE FAMILY JOURNAL COUNSELING AND THE.docx10.11771066480704270150THE FAMILY JOURNAL COUNSELING AND THE.docx
10.11771066480704270150THE FAMILY JOURNAL COUNSELING AND THE.docx
christiandean12115
 
10.11771066480703252339 ARTICLETHE FAMILY JOURNAL COUNSELING.docx
10.11771066480703252339 ARTICLETHE FAMILY JOURNAL COUNSELING.docx10.11771066480703252339 ARTICLETHE FAMILY JOURNAL COUNSELING.docx
10.11771066480703252339 ARTICLETHE FAMILY JOURNAL COUNSELING.docx
christiandean12115
 
10.11770022427803260263ARTICLEJOURNAL OF RESEARCH IN CRIME AN.docx
10.11770022427803260263ARTICLEJOURNAL OF RESEARCH IN CRIME AN.docx10.11770022427803260263ARTICLEJOURNAL OF RESEARCH IN CRIME AN.docx
10.11770022427803260263ARTICLEJOURNAL OF RESEARCH IN CRIME AN.docx
christiandean12115
 
10.11770022487105285962Journal of Teacher Education, Vol. 57,.docx
10.11770022487105285962Journal of Teacher Education, Vol. 57,.docx10.11770022487105285962Journal of Teacher Education, Vol. 57,.docx
10.11770022487105285962Journal of Teacher Education, Vol. 57,.docx
christiandean12115
 
10.11770011000002250638ARTICLETHE COUNSELING PSYCHOLOGIST M.docx
10.11770011000002250638ARTICLETHE COUNSELING PSYCHOLOGIST  M.docx10.11770011000002250638ARTICLETHE COUNSELING PSYCHOLOGIST  M.docx
10.11770011000002250638ARTICLETHE COUNSELING PSYCHOLOGIST M.docx
christiandean12115
 
10.0 ptsPresentation of information was exceptional and included.docx
10.0 ptsPresentation of information was exceptional and included.docx10.0 ptsPresentation of information was exceptional and included.docx
10.0 ptsPresentation of information was exceptional and included.docx
christiandean12115
 
10-K1f12312012-10k.htm10-KUNITED STATESSECURIT.docx
10-K1f12312012-10k.htm10-KUNITED STATESSECURIT.docx10-K1f12312012-10k.htm10-KUNITED STATESSECURIT.docx
10-K1f12312012-10k.htm10-KUNITED STATESSECURIT.docx
christiandean12115
 
10-K 1 f12312012-10k.htm 10-K UNITED STATESSECURITIES AN.docx
10-K 1 f12312012-10k.htm 10-K UNITED STATESSECURITIES AN.docx10-K 1 f12312012-10k.htm 10-K UNITED STATESSECURITIES AN.docx
10-K 1 f12312012-10k.htm 10-K UNITED STATESSECURITIES AN.docx
christiandean12115
 
10 What does a golfer, tennis player or cricketer (or any othe.docx
10 What does a golfer, tennis player or cricketer (or any othe.docx10 What does a golfer, tennis player or cricketer (or any othe.docx
10 What does a golfer, tennis player or cricketer (or any othe.docx
christiandean12115
 
10 September 2018· Watch video· Take notes withfor students.docx
10 September 2018· Watch video· Take notes withfor students.docx10 September 2018· Watch video· Take notes withfor students.docx
10 September 2018· Watch video· Take notes withfor students.docx
christiandean12115
 
10 Research-Based Tips for Enhancing Literacy Instruct.docx
10 Research-Based Tips for Enhancing Literacy Instruct.docx10 Research-Based Tips for Enhancing Literacy Instruct.docx
10 Research-Based Tips for Enhancing Literacy Instruct.docx
christiandean12115
 
10 Strategic Points for the Prospectus, Proposal, and Direct Pract.docx
10 Strategic Points for the Prospectus, Proposal, and Direct Pract.docx10 Strategic Points for the Prospectus, Proposal, and Direct Pract.docx
10 Strategic Points for the Prospectus, Proposal, and Direct Pract.docx
christiandean12115
 
10 Most Common Err.docx
10 Most Common Err.docx10 Most Common Err.docx
10 Most Common Err.docx
christiandean12115
 
10 Introduction Ask any IT manager about the chall.docx
10 Introduction Ask any IT manager about the chall.docx10 Introduction Ask any IT manager about the chall.docx
10 Introduction Ask any IT manager about the chall.docx
christiandean12115
 
10 Customer Acquisition and Relationship ManagementDmitry .docx
10 Customer Acquisition and Relationship ManagementDmitry .docx10 Customer Acquisition and Relationship ManagementDmitry .docx
10 Customer Acquisition and Relationship ManagementDmitry .docx
christiandean12115
 
10 ELEMENTS OF LITERATURE (FROM A TO Z)   1  ​PLOT​ (seri.docx
10 ELEMENTS OF LITERATURE (FROM A TO Z)   1  ​PLOT​  (seri.docx10 ELEMENTS OF LITERATURE (FROM A TO Z)   1  ​PLOT​  (seri.docx
10 ELEMENTS OF LITERATURE (FROM A TO Z)   1  ​PLOT​ (seri.docx
christiandean12115
 
10 ers. Although one can learn definitions favor- able to .docx
10 ers. Although one can learn definitions favor- able to .docx10 ers. Although one can learn definitions favor- able to .docx
10 ers. Although one can learn definitions favor- able to .docx
christiandean12115
 

More from christiandean12115 (20)

100 Original WorkZero PlagiarismGraduate Level Writing Required.docx
100 Original WorkZero PlagiarismGraduate Level Writing Required.docx100 Original WorkZero PlagiarismGraduate Level Writing Required.docx
100 Original WorkZero PlagiarismGraduate Level Writing Required.docx
 
10.11771066480704270150THE FAMILY JOURNAL COUNSELING AND THE.docx
10.11771066480704270150THE FAMILY JOURNAL COUNSELING AND THE.docx10.11771066480704270150THE FAMILY JOURNAL COUNSELING AND THE.docx
10.11771066480704270150THE FAMILY JOURNAL COUNSELING AND THE.docx
 
10.11771066480703252339 ARTICLETHE FAMILY JOURNAL COUNSELING.docx
10.11771066480703252339 ARTICLETHE FAMILY JOURNAL COUNSELING.docx10.11771066480703252339 ARTICLETHE FAMILY JOURNAL COUNSELING.docx
10.11771066480703252339 ARTICLETHE FAMILY JOURNAL COUNSELING.docx
 
10.11770022427803260263ARTICLEJOURNAL OF RESEARCH IN CRIME AN.docx
10.11770022427803260263ARTICLEJOURNAL OF RESEARCH IN CRIME AN.docx10.11770022427803260263ARTICLEJOURNAL OF RESEARCH IN CRIME AN.docx
10.11770022427803260263ARTICLEJOURNAL OF RESEARCH IN CRIME AN.docx
 
10.11770022487105285962Journal of Teacher Education, Vol. 57,.docx
10.11770022487105285962Journal of Teacher Education, Vol. 57,.docx10.11770022487105285962Journal of Teacher Education, Vol. 57,.docx
10.11770022487105285962Journal of Teacher Education, Vol. 57,.docx
 
10.11770011000002250638ARTICLETHE COUNSELING PSYCHOLOGIST M.docx
10.11770011000002250638ARTICLETHE COUNSELING PSYCHOLOGIST  M.docx10.11770011000002250638ARTICLETHE COUNSELING PSYCHOLOGIST  M.docx
10.11770011000002250638ARTICLETHE COUNSELING PSYCHOLOGIST M.docx
 
10.1 What are three broad mechanisms that malware can use to propa.docx
10.1 What are three broad mechanisms that malware can use to propa.docx10.1 What are three broad mechanisms that malware can use to propa.docx
10.1 What are three broad mechanisms that malware can use to propa.docx
 
10.0 ptsPresentation of information was exceptional and included.docx
10.0 ptsPresentation of information was exceptional and included.docx10.0 ptsPresentation of information was exceptional and included.docx
10.0 ptsPresentation of information was exceptional and included.docx
 
10-K1f12312012-10k.htm10-KUNITED STATESSECURIT.docx
10-K1f12312012-10k.htm10-KUNITED STATESSECURIT.docx10-K1f12312012-10k.htm10-KUNITED STATESSECURIT.docx
10-K1f12312012-10k.htm10-KUNITED STATESSECURIT.docx
 
10-K 1 f12312012-10k.htm 10-K UNITED STATESSECURITIES AN.docx
10-K 1 f12312012-10k.htm 10-K UNITED STATESSECURITIES AN.docx10-K 1 f12312012-10k.htm 10-K UNITED STATESSECURITIES AN.docx
10-K 1 f12312012-10k.htm 10-K UNITED STATESSECURITIES AN.docx
 
10 What does a golfer, tennis player or cricketer (or any othe.docx
10 What does a golfer, tennis player or cricketer (or any othe.docx10 What does a golfer, tennis player or cricketer (or any othe.docx
10 What does a golfer, tennis player or cricketer (or any othe.docx
 
10 September 2018· Watch video· Take notes withfor students.docx
10 September 2018· Watch video· Take notes withfor students.docx10 September 2018· Watch video· Take notes withfor students.docx
10 September 2018· Watch video· Take notes withfor students.docx
 
10 Research-Based Tips for Enhancing Literacy Instruct.docx
10 Research-Based Tips for Enhancing Literacy Instruct.docx10 Research-Based Tips for Enhancing Literacy Instruct.docx
10 Research-Based Tips for Enhancing Literacy Instruct.docx
 
10 Strategic Points for the Prospectus, Proposal, and Direct Pract.docx
10 Strategic Points for the Prospectus, Proposal, and Direct Pract.docx10 Strategic Points for the Prospectus, Proposal, and Direct Pract.docx
10 Strategic Points for the Prospectus, Proposal, and Direct Pract.docx
 
10 Most Common Err.docx
10 Most Common Err.docx10 Most Common Err.docx
10 Most Common Err.docx
 
10 Introduction Ask any IT manager about the chall.docx
10 Introduction Ask any IT manager about the chall.docx10 Introduction Ask any IT manager about the chall.docx
10 Introduction Ask any IT manager about the chall.docx
 
10 Customer Acquisition and Relationship ManagementDmitry .docx
10 Customer Acquisition and Relationship ManagementDmitry .docx10 Customer Acquisition and Relationship ManagementDmitry .docx
10 Customer Acquisition and Relationship ManagementDmitry .docx
 
10 ELEMENTS OF LITERATURE (FROM A TO Z)   1  ​PLOT​ (seri.docx
10 ELEMENTS OF LITERATURE (FROM A TO Z)   1  ​PLOT​  (seri.docx10 ELEMENTS OF LITERATURE (FROM A TO Z)   1  ​PLOT​  (seri.docx
10 ELEMENTS OF LITERATURE (FROM A TO Z)   1  ​PLOT​ (seri.docx
 
10 ers. Although one can learn definitions favor- able to .docx
10 ers. Although one can learn definitions favor- able to .docx10 ers. Although one can learn definitions favor- able to .docx
10 ers. Although one can learn definitions favor- able to .docx
 
10 academic sources about the topic (Why is America so violent).docx
10 academic sources about the topic (Why is America so violent).docx10 academic sources about the topic (Why is America so violent).docx
10 academic sources about the topic (Why is America so violent).docx
 

Recently uploaded

The Roman Empire A Historical Colossus.pdf
The Roman Empire A Historical Colossus.pdfThe Roman Empire A Historical Colossus.pdf
The Roman Empire A Historical Colossus.pdf
kaushalkr1407
 
Additional Benefits for Employee Website.pdf
Additional Benefits for Employee Website.pdfAdditional Benefits for Employee Website.pdf
Additional Benefits for Employee Website.pdf
joachimlavalley1
 

Recently uploaded (20)

How to Create Map Views in the Odoo 17 ERP
How to Create Map Views in the Odoo 17 ERPHow to Create Map Views in the Odoo 17 ERP
How to Create Map Views in the Odoo 17 ERP
 
The Art Pastor's Guide to Sabbath | Steve Thomason
The Art Pastor's Guide to Sabbath | Steve ThomasonThe Art Pastor's Guide to Sabbath | Steve Thomason
The Art Pastor's Guide to Sabbath | Steve Thomason
 
The Roman Empire A Historical Colossus.pdf
The Roman Empire A Historical Colossus.pdfThe Roman Empire A Historical Colossus.pdf
The Roman Empire A Historical Colossus.pdf
 
Additional Benefits for Employee Website.pdf
Additional Benefits for Employee Website.pdfAdditional Benefits for Employee Website.pdf
Additional Benefits for Employee Website.pdf
 
UNIT – IV_PCI Complaints: Complaints and evaluation of complaints, Handling o...
UNIT – IV_PCI Complaints: Complaints and evaluation of complaints, Handling o...UNIT – IV_PCI Complaints: Complaints and evaluation of complaints, Handling o...
UNIT – IV_PCI Complaints: Complaints and evaluation of complaints, Handling o...
 
Sectors of the Indian Economy - Class 10 Study Notes pdf
Sectors of the Indian Economy - Class 10 Study Notes pdfSectors of the Indian Economy - Class 10 Study Notes pdf
Sectors of the Indian Economy - Class 10 Study Notes pdf
 
How libraries can support authors with open access requirements for UKRI fund...
How libraries can support authors with open access requirements for UKRI fund...How libraries can support authors with open access requirements for UKRI fund...
How libraries can support authors with open access requirements for UKRI fund...
 
Template Jadual Bertugas Kelas (Boleh Edit)
Template Jadual Bertugas Kelas (Boleh Edit)Template Jadual Bertugas Kelas (Boleh Edit)
Template Jadual Bertugas Kelas (Boleh Edit)
 
Basic_QTL_Marker-assisted_Selection_Sourabh.ppt
Basic_QTL_Marker-assisted_Selection_Sourabh.pptBasic_QTL_Marker-assisted_Selection_Sourabh.ppt
Basic_QTL_Marker-assisted_Selection_Sourabh.ppt
 
Synthetic Fiber Construction in lab .pptx
Synthetic Fiber Construction in lab .pptxSynthetic Fiber Construction in lab .pptx
Synthetic Fiber Construction in lab .pptx
 
Solid waste management & Types of Basic civil Engineering notes by DJ Sir.pptx
Solid waste management & Types of Basic civil Engineering notes by DJ Sir.pptxSolid waste management & Types of Basic civil Engineering notes by DJ Sir.pptx
Solid waste management & Types of Basic civil Engineering notes by DJ Sir.pptx
 
How to Break the cycle of negative Thoughts
How to Break the cycle of negative ThoughtsHow to Break the cycle of negative Thoughts
How to Break the cycle of negative Thoughts
 
Sha'Carri Richardson Presentation 202345
Sha'Carri Richardson Presentation 202345Sha'Carri Richardson Presentation 202345
Sha'Carri Richardson Presentation 202345
 
2024.06.01 Introducing a competency framework for languag learning materials ...
2024.06.01 Introducing a competency framework for languag learning materials ...2024.06.01 Introducing a competency framework for languag learning materials ...
2024.06.01 Introducing a competency framework for languag learning materials ...
 
Embracing GenAI - A Strategic Imperative
Embracing GenAI - A Strategic ImperativeEmbracing GenAI - A Strategic Imperative
Embracing GenAI - A Strategic Imperative
 
Jose-Rizal-and-Philippine-Nationalism-National-Symbol-2.pptx
Jose-Rizal-and-Philippine-Nationalism-National-Symbol-2.pptxJose-Rizal-and-Philippine-Nationalism-National-Symbol-2.pptx
Jose-Rizal-and-Philippine-Nationalism-National-Symbol-2.pptx
 
Introduction to Quality Improvement Essentials
Introduction to Quality Improvement EssentialsIntroduction to Quality Improvement Essentials
Introduction to Quality Improvement Essentials
 
Unit 8 - Information and Communication Technology (Paper I).pdf
Unit 8 - Information and Communication Technology (Paper I).pdfUnit 8 - Information and Communication Technology (Paper I).pdf
Unit 8 - Information and Communication Technology (Paper I).pdf
 
NLC-2024-Orientation-for-RO-SDO (1).pptx
NLC-2024-Orientation-for-RO-SDO (1).pptxNLC-2024-Orientation-for-RO-SDO (1).pptx
NLC-2024-Orientation-for-RO-SDO (1).pptx
 
special B.ed 2nd year old paper_20240531.pdf
special B.ed 2nd year old paper_20240531.pdfspecial B.ed 2nd year old paper_20240531.pdf
special B.ed 2nd year old paper_20240531.pdf
 

J E L L Y F I S H B L O O M SEffects of climate warming on.docx

  • 1. J E L L Y F I S H B L O O M S Effects of climate warming on strobilation and ephyra production of North Sea scyphozoan jellyfish Sabine Holst Published online: 9 March 2012 � Springer Science+Business Media B.V. 2012 Abstract Recent studies have correlated fluctua- tions in jellyfish abundances with climatic changes, leading to speculation that the warming trend in the North Sea will affect the strobilation activity of Scyphozoa. The present study provides long-term data (10–22 months) on temperature effects on the species Aurelia aurita, Cyanea capillata, Cyanea lamarckii and Chrysaora hysoscella. Strobilation at current winter temperature (5�C) in the German Bight was compared to strobilation at warmer winter tem- peratures. Simulated winter temperature of 10�C had several positive effects on strobilation, as compared to
  • 2. 5�C: 1. A longer strobilation period or higher ephyra production per polyp in A. aurita, C. lamarckii and Ch. hysoscella; 2. Higher percentages of polyps strobilat- ing in A. aurita and Ch. hysoscella; 3. More ephyrae per strobila in C. capillata and C. lamarckii; 4. A shorter strobilation duration in C. capillata and C. lamarckii. Cold winter temperatures of 5�C promoted strobilation in C. capillata, but inhibited strobilation in A. aurita and reduced ephyra produc- tion in C. lamarckii and Ch. hysoscella. These results suggest that climate warming will benefit A. aurita, but not cold-water C. capillata. The distributions of C. lamarckii and Ch. hysoscella probably could expand to the north. Keywords Aurelia � Cyanea � Chrysaora � Polyp � Temperature � Reproduction Introduction Reports of mass occurrences of large jellyfish (Scy- phozoa) in many marine ecosystems worldwide have
  • 3. increased in recent decades (Purcell et al., 2007; Richardson et al., 2009). Negative impacts of such medusa blooms on ecosystems, fisheries, industries and tourism are obvious: medusae are food compet- itors of fish and feed on fish larvae and small fish (Barz & Hirche, 2007; Sabatés et al., 2010), the gelatinous bodies clog fishing nets and cooling systems of coastal industries, and jellyfish stinging swimmers have negative effects on the tourism industry (CIESM, 2001; Purcell et al., 2007). It is possible that conse- quences of anthropogenic activities, including overf- ishing, eutrophication, species invasions and especially climate change, have contributed to increased jellyfish abundances (Purcell et al., 2007; Richardson et al., 2009; Purcell, 2011). Recent analyses of temperature data show a clear warming trend in global average air and ocean temperature (IPCC, 2007). A pronounced winter
  • 4. Guest editors: J. E. Purcell, H. Mianzan & J. R. Frost / Jellyfish Blooms: Interactions with Humans and Fisheries S. Holst (&) Senckenberg am Meer, German Center for Marine Biodiversity Research, c/o Biozentrum Grindel und Zoologisches Museum, Martin-Luther-King-Platz 3, 20146 Hamburg, Germany e-mail: [email protected] 123 Hydrobiologia (2012) 690:127–140 DOI 10.1007/s10750-012-1043-y warming trend has been observed in the North and Baltic seas, which is predicted to continue in the future (HELCOM, 2007; Belkin, 2009). Recent rapid climate change has changed the abundances, population structures and biographical ranges of benthic and planktonic North Sea species (Mieszkowska et al., 2006; Wiltshire et al., 2010). Climate regime shifts
  • 5. also affect jellyfish populations. Changes in temper- ature, salinity, currents, predator–prey interactions and competition have measurable effects on jellyfish abundance and distribution (Purcell, 2005, 2009; Molinero et al., 2008; Lynam et al., 2010). These environmental changes will affect both the pelagic and the benthic stages of metagenetic medusae; however, the role of the polyps has been neglected in most analyses and models because of the lack of data on polyp ecology (Lynam et al., 2010). The medusae of four semaeostome scyphozoans, Aurelia aurita (Linneaus, 1758), Cyanea capillata (Linneaus, 1758), Cyanea lamarckii Péron and Lesu- eur, 1809 and Chrysaora hysoscella (Linneaus, 1766), occur in the German Bight during the summer months, and mass occurrences have been documented in some years (Russell, 1970; Möller, 1980a; Hay et al., 1990; Barz & Hirche, 2007). Like most scyphozoans, the life
  • 6. cycle of these species includes planktonic medusa and benthic polyp generations. After settlement and metamorphosis of the planula larvae, the polyp populations increase by asexual reproduction. Each polyp seasonally produces one to several young medusae (ephyrae) in a process of transversal fission called strobilation. This process contributes to the development of jellyfish blooms because polydisc strobilation allows single polyps to produce many ephyrae (Boero et al., 2008). Information on the environmental factors and stressors that determine the induction, timing and magnitude of the strobilation process is limited to a few species (e.g. Aurelia spp., reviewed in Purcell et al., 2012). Moreover, the benthic stage is completely undiscovered or undescribed for most scyphozoans (Tronolone et al., 2002; Jarms, 2010). Although many laboratory investigations on scyphopolyps have shown
  • 7. that temperature significantly affects the asexual polyp reproduction and strobilation (e.g. Holst et al., 2007; Purcell, 2007; Willcox et al., 2007; You et al., 2008; Liu et al., 2009), most of these studies were restricted to short periods of a few weeks and polyps were often exposed to extreme, abrupt changes, whereas changes in situ would be less severe (Purcell, 2005). Long-time investigations on the effects of natural seasonal temperature cycles on polyp ecology are unavailable for most species (but see Gröndahl, 1988; Brewer & Feingold, 1991; Miyake et al., 2002; Purcell et al., 2009; Di Camillo et al., 2010; Ishii & Katsukoshi, 2010). In the present study, I compare the long-term (10–22 months) effects of different temperature con- ditions on strobilation and ephyra production of four semaeostome jellyfish species from the North Sea to show the possible effects of increasing winter temper- atures on the strobilation activity of Scyphozoa in the
  • 8. North Sea. Strobilation at temperature conditions similar to the current temperatures in the German Bight was compared to that at warmer winter temper- atures. Additional experiments without a temperature change were conducted to determine the importance of temperature changes as inducers of strobilation in scyphozoan polyps. I tested the null hypotheses to ascertain whether the percentages of polyps strobilat- ing and the numbers of ephyrae produced per strobila were independent of temperature; second, whether the percentages of strobilating polyps and the number of ephyrae produced per strobila were independent of polyp age; and third, whether the duration of strobi- lation was independent of the number of ephyrae per strobila and of temperature. Materials and methods Polyps of the species A. aurita, C. capillata, C. lama- rckii and Ch. hysoscella were reared from planulae
  • 9. collected from female medusae in the summer periods of 2003 and 2004 around the island of Helgoland (details in Holst & Jarms, 2007, 2010). Watch glasses or polyethylene plates (for C. lamarckii) colonized by polyps in the laboratories of the Biologische Anstalt Helgoland were transported to the Zoological Institute of the University of Hamburg (Biocenter Grindel) 1–2 weeks after planula settlement. The substrates were transferred into 150-ml glass bowls filled with filtered North Sea water (salinity 35 ± 2). The bowls were kept in incubators at 15�C in darkness before the experiments. Only well-developed polyps with extended tentacles were used for the experiments, whereas small or contracted polyps were carefully removed from the substrates with a needle. Polyps were fed nauplii of Artemia salina for 1–2 h every 128 Hydrobiologia (2012) 690:127–140 123
  • 10. 7–10 days, after which the seawater in the bowls was replaced with fresh filtered seawater of the same temperature. During strobilation, only half of the water was changed carefully, and uneaten food was removed from the bowls with a pipette to avoid disturbing the strobilation process. Polyps of each species were cultured in three different temperature groups (Table 1). In the 15�C group, the temperature was constant 15�C throughout the year. In the groups 15–10–15�C and 15–05–15�C, the temperature was 15�C until mid-October and lowered to 10�C in autumn and 5�C in winter, respectively. The temperatures were decreased in steps of 2.5�C per month (Fig. 1), and all cultures were kept in incubators in darkness. Polyps were monitored for 12 months (A. aurita from 15 September, and C. capillata from 15 October) or 10 months (C. lamarckii and Ch. hysoscella from 15 October) in the first year after settlement. Additional 10-month-long experiments (from 15 October) were conducted in the second year after settlement with A. aurita and C. capillata polyps. The polyps were
  • 11. counted monthly in all replicates, and all cultures were checked weekly to detect beginning strobilations. When strobilation appeared in the cultures, each strobila was monitored individually. The developing ephyrae in each strobila and the released ephyrae in the cultures were counted at least twice per week. Calculations and statistics The numbers of ephyrae produced monthly in each temperature group were summed and divided by the number of polyps to calculate ephyra production for each month. To account for production and mortality of polyps, the mean numbers of polyps (counted monthly) were calculated over the duration of the experiment (Table 1) and used in calculations and statistics. The total numbers of ephyrae produced per mean polyp numbers were calculated for each temperature group. The percentages of strobilating polyps in the first year were calculated for each replicate from the total
  • 12. numbers of strobilae divided by the mean numbers of polyps in each replicate. Percentages were arcsine square root transformed before statistical analysis to test the first null hypothesis, H01: the percentages of polyps strobilating were independent of the tempera- ture treatments. In C. lamarckii, all polyps strobilated once in all temperature groups, therefore the percent- ages of polyps that strobilated twice were compared to test H01. Individually monitored strobilations in the first year were used to calculate the mean numbers of ephyrae per strobila to test H02: the numbers of ephyrae produced per strobila were independent of the temper- ature treatments. Strobilations from replicates 1–3 were used for analysis in all species and temperature groups; additional strobilations were included from replicates 4–6 in A. aurita 15�C, C. capillata 15–10–15�C, C. capillata 15–05–15�C and Ch. hysos- cella 15–05–15�C. For H01 and H02, data with normal distributions were tested by one-way analysis of
  • 13. variance (ANOVA) followed by a Fisher’s least significance difference (LSD) post-hoc test. Data not normally distributed were tested by a Kruskal–Wallis ANOVA on ranks and a Student–Newman–Keuls post- hoc test. Two experimental groups were compared with a Mann–Whitney Rank Sum Test. Table 1 Replicates (n) in temperature groups used for analyses of strobilation in first year (1y) and second year (2y) after planula settlement in four species of scyphozoans Species Year n 15�C 15–10–15�C 15–05–15�C Start Mean Start Mean Start Mean A. aurita 1y 6 79 87.3 ± 4.9 78 102.6 ± 19.9 81 114.7 ± 32.5 1y 3 29 37.1 ± 4.8 32 46.3 ± 11.9 36 54.0 ± 16.3 2y 3 33 46.3 ± 15.2 32 47.2 ± 21.8 35 49.7 ± 22.0 C. capillata 1y 6 71 73.7 ± 4.0 75 86.3 ± 11.2 81 96.6 ± 17.3 1y 3 25 26.0 ± 2.9 25 26.0 ± 2.9 26 28.0 ± 6.4 2y 3 11 18.2 ± 8.3 20 28.9 ± 10.1 24 39.1 ± 13.2 C. lamarckii 1y 6 86 76.3 ± 7.4 86 64.5 ± 14.1 85 60.5 ± 17.0 Ch. hysoscella 1y 7 108 85.0 ± 22.3 108 92.9 ± 15.7 113 81.9 ±
  • 14. 28.8 The total polyp numbers at the beginning of the experiments (Start) and numbers of polyps in monthly counts (mean ± standard deviation) in different temperature groups (see Fig. 1) are listed Hydrobiologia (2012) 690:127–140 129 123 A. aurita 1st year 1 5 °C 1 5 - 1 0 - 1 5 °C 1 5 - 0 5 - 1 5 °C T e m p e ra tu re c o
  • 16. 15Jun- 15Jul 15Jul- 15Aug Temperature groups 0 1 2 1 5 - 0 5 - 1 5 °C 1 .0 1 5 - 1 0 - 1 5 °C 2 .1 1 5 °C 0 .2 1 5 - 0 5 - 1 5 °C 1 .7 1 5 - 1 0 - 1 5 °C 2 .7 1 5 °C 0 .3 0 1
  • 17. 2 A. aurita 2nd year 0 1 2 C. capillata 1st year E p h y ra e p e r p o ly p 1 5 - 1 0 - 1 5 °C 0 .9 1 5 - 0 5 - 1 5 °C 1 .4 0
  • 18. 1 2 C. capillata 2nd year 0 1 2 C. lamarckii 1st year 1 5 - 1 0 - 1 5 °C 3 .2 1 5 - 0 5 - 1 5 °C 3 .0 1 5 - 0 5 - 1 5 °C 3 .7 1 5 - 1 0 - 1 5 °C 5 .4 1 5 °C 7.9 0 1 2 Ch. hysoscella 1st year
  • 19. 15 15 15 15 15 15 15 12.5 10 10 10 10 10 12.5 15 12.5 1 5 15 15 10 10 10 7.5 5 5 5 7.5 1 0 12.5 15 1 5 - 0 5 - 1 5 °C 0 .1 1 5 - 1 0 - 1 5 °C 0 .8 1 5 °C 0 .4 Ephyrae per polyp in 10 monthsEphyrae per polyp monthly 130 Hydrobiologia (2012) 690:127–140 123 For comparisons among strobilations 1 and 2 years after settlement, the same three replicates of each temperature group of A. aurita and C. capillata polyps
  • 20. were used in both years (Table 1). The same 10-month period (15 October–15 August) were analysed in both years. The percentages of strobilating polyps and the numbers of ephyrae produced per strobila were calcu- lated for both years, as described above, and compared by a Mann–Whitney Rank Sum Test. Two null hypotheses were tested, H03: The percentages of strobilating polyps were independent of polyp age and H04: The number of ephyrae produced per strobila was independent of the polyp age. The durations of strobilations (days) were deter- mined from the number of days between the start of the strobilation, when first constrictions of the polyp body appeared, until the end the strobilation, when the last ephyra detached from the strobila. Only strobilations that began and ended at the same temperature were used in the analysis. Strobilae in the first year after polyp settlement were analysed in C. lamarckii and Ch.
  • 21. hysoscella, and in the first and second years combined in A. aurita and C. capillata. Strobilations were analysed at 15, 10 and 5�C culture temperatures. Two null hypoth- eses were tested by analysis of covariance (ANCOVA), H05: The duration of strobilation was independent of the number of ephyrae per strobila and H06: The duration of strobilation was independent of the temperature treat- ments. ANCOVA-tests were conducted separately for each species. In all tests, duration was the dependent variable; the number of ephyrae per strobila and the culture temperature were covariates. Results Ephyra production and strobilation rates A. aurita The first A. aurita strobilations occurred in autumn in all temperature groups in the first and second years after polyp settlement. Ephyra were produced until next May in both years in the 15–10–15�C group, whereas ephyra production stopped after a tempera-
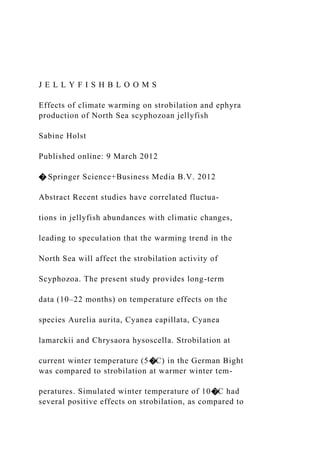
  • 22. ture decrease to 5�C in January in the 15–05–15�C groups (Fig. 1, left side). Few ephyrae per polyp were produced in the temperature group with constant 15�C and the most ephyrae per polyp were produced in the 15–10–15�C group in the first and in the second year after settlement (Fig. 1, right side). Significantly higher percentages of A. aurita polyps strobilated after a temperature decrease in autumn than at constant 15�C, and H01 was rejected for both years (Figs. 2, 3; Table 2). The numbers of ephyrae pro- duced per strobila did not differ significantly among the temperature groups in the first year or in the second year and H02 was not rejected (Fig. 2; Table 2). The percentages of strobilating polyps were higher in the second than in the first year, but the differences were not significant, and H03 was not rejected (Fig. 3; Table 3). Although the maximum numbers of ephyrae per strobila were higher in the second year than in the first, the means differed only slightly among groups, and H04 was not rejected (Fig. 3; Table 3).
  • 23. C. capillata C. capillata polyps never strobilated in constant 15�C during 22 months of observation. The first ephyra appeared in February–March at the cold winter temperature (5�C) in both years, whereas the first ephyra appeared at least 1 month later at the 10�C winter temperature (Fig. 1, left side). Ephyra produc- tion continued until the beginning (second year) or end of May (first year). In the first year, production of ephyrae per polyp was higher in 5�C winter temper- ature, whereas it was slightly higher in 10�C winter temperature in the second year (Fig. 1, right side). In the first year, the percentages of polyps strobilating were significantly higher in the 15–05–15�C group than in the 15–10–15�C and 15�C groups and H01 was rejected (Fig. 2; Table 2). Although the percentages of polyps strobilating differed only slightly for the 15–10–15�C and the 15–05–15�C groups, no strobi- lation occurred at 15�C and H01 was rejected in the second year as well (Fig. 3; Table 2). The numbers of ephyrae per strobila were lower in groups with 5�C than in those with 10�C winter temperature, but differences were only significant in the first year (H02 Fig. 1 Numbers of ephyrae per polyp produced monthly (left
  • 24. side) and total numbers of ephyrae produced per mean numbers of polyps counted monthly during 10 months of observation (15 Oct–15 Aug, right side) in different temperature groups of A. aurita, C. capillata, C. lamarckii and Ch. hysoscella polyps. The culture temperature was constant 15�C from 15th July to 15th October in all temperature groups (not shown in the figure). Polyp numbers in different temperature groups are shown in Table 1 b Hydrobiologia (2012) 690:127–140 131 123 rejected, Fig. 2; Table 2). The percentages of strobi- lating polyps did not differ significantly in polyps of different ages and H03 was not rejected (Fig. 3; Table 3); however, the mean numbers of ephyrae per strobila were significantly higher in the second year in the 15–10–15�C group and the 15–05–15�C group (H04 rejected, Fig. 3; Table 3). C. lamarckii In C. lamarckii cultures, the first ephyra appeared after
  • 25. a temperature decrease to 10�C in groups 15–10–15�C and 15–05–15�C; however, the most ephyrae per polyp were produced in the constant 15�C group, whereas the fewest were in the coldest winter temperature (5�C; C. lamarckii 0 2 4 6 8 10 12 A. aurita 0 20 40 60 80 100
  • 27. % ) 0 20 40 60 80 100 Ch. hysoscella 0 20 40 60 80 100 15°C 15-10-15°C 15-05-15°C Temperature group C. lamarckii 1 5 °C 1 5 - 1 0 - 1 5 °C 1 5 - 0 5 - 1 5 °C
  • 28. Temperature group n = 6 n = 6 n = 6 n = 7 0 2 4 6 8 10 12 E p h y ra e p e
  • 30. 0 2 4 6 8 10 12 17 29 7 Fig. 2 Strobilating polyps (mean % ± SD) (left side) and ephyrae produced per strobila (mean number ± SD) (right side) in the first year after polyp settlement in different temperature groups of A. aurita, C. capillata, C. lamarckii and Ch. hysoscella polyps; n number of replicates (numbers of polyps as shown in Table 1). The numbers of analysed strobilae appear inside the bars. Diamond maximal number of ephyrae produced by one strobila. The observation time was 12 months for A. aurita (15 Sep–15 Sep) and C. capillata (15 Oct–15 Oct) and 10 months for C. lamarckii and Ch. hysoscella (15 Oct–15 Aug). Test statistics are shown in Table 2 132 Hydrobiologia (2012) 690:127–140 123
  • 31. Fig. 1). All C. lamarckii polyps strobilated at least once in all temperature groups ([100%). The percent- ages of polyps strobilating twice were the highest in the 15–10–15�C groups, but the differences were not significant, and H01 was not rejected (Fig. 2; Table 2). The number of ephyrae produced per strobila, how- ever, was significantly higher at constant 15�C than in treatments with temperature decreases, and H02 was rejected (Fig. 2; Table 2). Ch. hysoscella The monthly ephyra production per polyp was rela- tively low in Ch. hysoscella (Fig. 1, left side). The most ephyrae per polyp were in the 15–10–15�C group, and the fewest ephyrae per polyp were produced in the 15–05–15�C group (Fig. 1, right side). The percentages of strobilating polyps were significantly higher in the 15–10–15�C group than in the other groups, and H01 was rejected (Fig. 2; Table 2). In the 15�C and 15–05–15�C groups, maxima of three ephyrae were produced per strobila, whereas as many as six ephyrae per strobila were
  • 32. produced in the 15–10–15�C group (Fig. 2); however, the production of more then three ephyrae occurred only in 7% of analysed strobilae. Consequently, differences in ephyra production per strobila were not significant among temperature groups and H02 was not rejected (Fig. 2; Table 2). Temperature change as a strobilation inducer or inhibitor Small percentages of polyps strobilated at constant 15�C in A. aurita, demonstrating that temperature decrease was an important strobilation inducer; how- ever, ephyra production stopped after temperature decreased further to 5�C in winter. This result demonstrated that a low winter temperature of 5�C inhibited strobilation activity from February on whereas a higher winter temperature of 10�C lead to a longer strobilation period until spring (Fig. 1). Temperature increases from 5 to 10�C in spring and then to 15�C in summer did not induce strobilation in A. aurita (Fig. 1). Strobilation never occurred at constant 15�C in C. capillata and ephyra production was lower when
  • 33. temperature rose in spring and summer following strobilation at 5 or 10�C winter temperatures (Fig. 1). No ephyra was produced at temperatures exceeding A. aurita 0 20 40 60 80 100 S tr o b il a ti n g p o ly
  • 35. 8 10 12 E p h y ra e p e r s tr o b il a C. capillata 15°C 15-10-15°C 15-05-15°C 15°C 15-10-15°C 15-05-15°C Temperature group A. aurita
  • 36. 0 2 4 6 8 10 12 18 2815 19 18 26 1914 n = 3 n = 3 31 1st year 2nd year Fig. 3 Strobilating polyps (mean % ± SD) (left side) and ephyrae produced per strobila (mean number ± SD) (right side) in the first year and in the second year after polyp settlement in different temperature groups of A. aurita, C. capillata, C. lamarckii and Ch. hysoscella polyps, n number of replicates (numbers of polyps are shown in Table 1). The numbers of
  • 37. analysed strobilae appear inside the bars. Diamond maximal number of ephyrae produced by one strobila. In both analyses, the observation time was 10 months (15 Oct–15 Aug) in both years. Test statistics are shown in Table 3 Hydrobiologia (2012) 690:127–140 133 123 10�C in summer, suggesting strobilation inhibition at warmer temperatures in C. capillata. In C. lamarckii, ephyra production started earlier after a temperature decrease to 10�C than at constant 15�C (Fig. 1), showing a positive effect of temperature decrease on strobilation induction, although the total ephyra pro- duction was the highest at constant 15�C. In Ch. hysoscella, strobilation activity was low in all tem- perature treatments without clear responses to tem- perature changes (Fig. 1). Temperature effects on strobilation duration and ephyrae per strobila A significant effect of the number of ephyrae per
  • 38. strobila on the strobilation duration was shown by ANCOVA for all tested species (Fig. 4), and H05 was rejected. Correlations among temperature treatments and strobilation duration were not possible for A. aurita because strobilation occurred mostly at 10�C; thus, data at other temperatures were insufficient. In all other tested species, the ANCOVA confirmed a significant effect of temperature treatment on the strobilation duration (Fig. 4), and H06 was rejected. Discussion Scyphopolyps are difficult to find and investigate in the field because of their small sizes and their preferences of colonizing the undersides of substrates and concealed habitats (Pierce, 2009; Di Camillo Table 2 Test statistics on the effects of temperature treatments on the percentages of strobilating polyps (H01) and ephyrae produced per strobila (H02) in four species of scyphozoans Species Null hypothesis Polyp age Test statistic P A. aurita H01 1y F2,15 = 16.936 0.001
  • 39. 2y F2,6 = 14.779 0.005 H02 1y H2 = 0.573 0.751 2y H2 = 0.315 0.854 C. capillata H01 1y H2 = 13.940 0.001 2y H2 = 6.161 0.025 H02 1y T28,79 = 1936.000 0.003 2y T18,28 = 482.000 0.182 C. lamarckii H01 1y F2,15 = 1.224 0.322 H02 1y H2 = 40.367 0.001 Ch. hysoscella H01 1y F2,18 = 9.486 0.002 H02 1y H2 = 0.477 0.788 The temperature groups, numbers of replicates, mean values and observation times are shown in Figs. 2 and 3. Strobilations in the first year after polyp settlement (1y) were analysed in all species. Strobilations in the second year (2y) were analysed in A. aurita and C. capillata Table 3 Test statistics of comparisons on strobilations in the first and second year after polyp settlement in two scyphozoan species Species Null hypothesis 15�C 15-10-15�C 15-5-15�C
  • 40. Test statistics P Test statistics P Test statistics P A. aurita H03 T3,3 = 9.0 0.700 T3,3 = 7.0 0.200 T3,3 = 7.0 0.200 H04 No test, n 3 T18,26 = 424.5 0.645 T14,19 = 259.5 0.439 C. capillata H03 No strobilae T3,3 = 8.0 0.400 T3,3 = 8.5 0.400 H04 No strobilae T15,18 = 169.0 0.002 T19,28 = 292.5 0.001 Percentages of strobilating polyps (H03) and ephyrae produced per strobila (H04) in different temperature treatments were analysed. Replicates, mean values and observation times are shown in Fig. 3 134 Hydrobiologia (2012) 690:127–140 123 et al., 2010). Laboratory investigations allow quanti- fication of polyp survival and reproduction and are therefore an important source of data (e.g. Purcell, 2007; Willcox et al., 2007; Liu et al., 2009; Sötje & Jarms, 2009; Holst & Jarms, 2010). Although the results from field observations may differ form laboratory experiments (Purcell et al., 2009), the
  • 41. results of this study demonstrated that simulation of natural temperature cycles in the laboratory can be used to test the effects of seasonal temperature changes on strobilation. The strobilation activity documented in two consecutive years in two species (A. aurita and C. capillata) showed that repeated temperature cycles in the laboratory experiments caused very similar responses of the polyps. The temperature cycles in the present experiments with 15�C maximum summer temperature and 5�C mini- mum winter temperature differed from the natural annual temperature cycles because of 2.5�C temper- ature changes per month. Nevertheless, the laboratory temperature conditions were similar to temperatures found recently in the German Bight (Wiltshire & Manly, 2004; www.bsh.de/en/Marine_data). The par- allel experiments with warmer winter temperatures (10�C) indicated how warmer winter temperatures, as observed and predicted to progress in the North Sea
  • 42. (Belkin, 2009), could affect the strobilation activity of scyphopolyps in situ. In these experiments, warmer winter temperature (10�C in comparison to 5�C) pos- itively affected strobilation in several ways: 1. A longer strobilation period or higher ephyra production per polyp (in A. aurita, C. lamarckii and Ch. hysos- cella; Fig. 1); 2. Higher percentages of polyp strobi- lation (in A. aurita and Ch. hysoscella; Fig. 2); 3. More ephyrae per strobila (in C. capillata, C. lama- rckii, see Fig. 2); 4. A shorter strobilation duration (in C. capillata and C. lamarcki, see Fig. 4). Many of the changes in species abundances, population structure and biogeographical ranges occur as a result of increased reproductive output and juvenile survival in response to increased warming (Mieszkowska et al., 2006). The results of this study suggest that this could also be true for the North Sea scyphozoans investigated.
  • 43. In A. aurita, the experiments showed significantly higher percentages of strobilations after a temperature decrease in autumn compared to constant 15�C dem- onstrating the importance of a temperature decrease for strobilation induction in this species. Spring strobila- tion only occurred in experiments with 10�C winter C. lamarckii 0 10 20 30 0 2 4 6 8 10 12 S tr o b il a ti o n
  • 44. d u ra ti o n ( d ) 15°C 10°C Ephyrae per strobila A. aurita 0 10 20 30 10°C C. capillata 0 10 20
  • 45. 30 40 50 0 2 4 6 8 10 12 0 2 4 6 8 10 12 10°C Ch. hysoscella 0 10 20 30 0 2 4 6 8 10 12 15°C5°C e t e t F =12.492, p = 0 .00 1e e F =72.285, p <0 .00 1 F =76.459, p <0 .00 1 e
  • 46. t e t F =10.567, p = 0 .00 2 F =6.735 , p = 0 .0 13 e t e t n=141 n=126 n=46 F =41 .720 , p <0 .00 1 F =24 .735 , p <0 .00 1 n=127 10°C 5°C Fig. 4 Strobilation durations (mean days ± SD) in individually- monitored strobilae at different constant
  • 47. temperatures in relation to ephyrae numbers produced in the strobilae of A. aurita, C. capillata, C. lamarckii and Ch. hysoscella. The effect of ephyra numbers produced per strobila (e) on the strobilation duration and the effect of the temperature treatment (t) on the strobilation duration were tested by ANCOVA. n number of analysed strobilae. df = 1 for all performed tests. F and P values are shown in the figures Hydrobiologia (2012) 690:127–140 135 123 http://www.bsh.de/en/Marine_data
  • 48. temperature, but did not occur with rising temperature in spring after a cold winter period of 5�C. Perhaps under natural conditions, autumn strobilation in A. aurita polyps can happen only if the temperature decreases slowly and the period of moderate temper- ature of about 10�C lasts for several weeks, whereas a rapid temperature decrease may lead to inhibition of strobilation in autumn. In agreement with this idea, in situ autumn strobilations of A. aurita were observed in areas with moderate winter temperatures, such as in Sylt, German Bight (Thiel, 1938), Osterschelde, Netherlands (Korringa, 1953), and Gullmarfjord, western Sweden (Hernroth & Gröndahl, 1985, Grön- dahl, 1988); however, in areas with a rapid temperature decrease in autumn, such as in several Baltic Sea areas, a later start of the strobilation activity in A. aurita was documented, and strobilation occurred mainly in winter and spring (Palmén, 1954; Kändler, 1961; Thiel, 1962; Rasmussen, 1973; Möller, 1980b). The
  • 49. ephyrae may survive the cold winter periods in deep water layers without further development, which could explain the main time of ephyra abundance in the plankton in autumn and spring (Rasmussen, 1973; Hernroth & Gröndahl, 1985; Gröndahl, 1988). In Southampton Water and Horsea Lake in southern England, ephyra production begins in December and lasts 7 months (Lucas, 1996; Lucas et al., 1997), confirming the results of this study of an extended strobilation phase in A. aurita at warmer winter temperatures (Fig. 1). Recent molecular genetic study detected that A. aurita is not a single species, but includes members of several molecular species (Daw- son, 2003). A. aurita populations occurring in the North Atlantic and adjacent seas are probably adapted to the temperature regime in these areas (Dawson, 2003), and therefore, our results reflect the strobilation behaviour of polyps from this temperature regime only.
  • 50. The tests of this study showed shorter strobilation duration and higher ephyra production per strobila of C. capillata polyps at warmer temperatures. On the other hand, cold winter temperatures had positive effects on strobilation in C. capillata polyps; strobi- lation started earlier at colder temperatures, and unlike A. aurita, ephyra production was not inhibited by the cold winter temperature (5�C). In these experiments, C. capillata was the only species without any strobi- lation during 22 months at the warm temperature of 15�C. Strobilation induction of C. capillata may strictly depend on a temperature decrease, which may explain why the distribution of the species is limited to northern boreal areas (Russell, 1970), whereas Cyanea medusae from the warmer U.S. Atlantic, the Gulf of Mexico and Australian waters may represent other species of Cyanea (Bayha, 2005; Dawson, 2005). In the North Sea, C. capillata medusae are rare in the southern part and do not
  • 51. appear in the English Channel. In the Irish Sea, their occurrence also is limited to the northern part (Russell, 1970; Hay et al., 1990; Doyle et al., 2007). The simulated annual seasons in present experiments induced ephyra production from February until June, which matched field observations on C. capillata strobilation and occurence of the ephyrae in areas with a similar temperature regime (Hartlaub, 1894; Ver- wey, 1942; Gröndahl, 1988). Although the polyps are obviously adapted to cold temperature conditions, they have not been reported from the southern or eastern Baltic Sea, where the C. capillata medusae appear each summer (Möller, 1980a; Barz et al. 2006). Recent studies demonstrated that C. capillata polyps are able to strobilate at a low salinity of 12 and may be more widespread in the Baltic Sea than previously thought (Holst & Jarms, 2010). In accordance with previous studies (Gröndahl, 1988), the results of this
  • 52. study confirm that C. capillata polyps are tolerant of cold temperatures, indicating that the low Baltic Sea winter temperatures probably do not limit their distribution. I therefore believe that the only reason why the polyps have not been found in this area to date is that there were too few efforts undertaken to find them. The medusae of C. lamarckii have a more southern distribution in the North and Irish seas than do C. capillata medusae (Russell, 1970; Hay et al., 1990; Doyle et al., 2007). In the Baltic Sea, C. lamarckii medusae appear rarely in Danish waters (Rasmussen, 1973), whereas they occur periodically from March until June off the Swedish west coast (Gröndahl, 1988). C. lamarckii ephyrae were not found in 4 years of plankton sampling on the Swedish west coast and no strobilation was observed on settling plates in the field, leading to the conclusion that C. lamarckii polyps do
  • 53. not strobilate there (Gröndahl, 1988). C. lamarckii polyps have not yet been described in their natural habitat, but present laboratory studies indicate positive effects of warm temperature on strobilation: higher production of ephyrae per strobila and shorter strobi- lation duration. This may enable their distribution to 136 Hydrobiologia (2012) 690:127–140 123 expand to the northern North Sea with rising winter temperatures due to climate changes. From there, the polyps may also extend into the Baltic Sea because of their high tolerance of low salinity (Holst & Jarms, 2010). The present experiments demonstrated a long strobilation phase of C. lamarckii polyps from winter until the next summer in agreement with observations of abundant C. lamarckii medusae of various sizes and different developmental stages from spring until late
  • 54. summer in the German Bight and off the Dutch coast (Verwey, 1942; Künne, 1952). Ch. hysoscella medusae also are distributed mainly in the southern North and Irish seas (Russell, 1970; Hay et al., 1990; Doyle et al., 2007). Verwey (1942), suggested strobilation of Ch. hysoscella with increas- ing temperature in spring and summer, but the polyps have not yet been found in their natural habitat in the North Sea. A mild winter in 1988 in the German Bight was followed by early appearance and high abundance of Ch. hysoscella medusae in the summer, leading to the conclusion that polyp’s survival during the winter was higher at warm temperatures (Merck, 1990). These observations agree with experimental results of this study showing very low ephyra production at cold winter temperatures and shorter strobilation duration at warmer temperatures. Ch. hysoscella planulae are able to settle at salinities at least as low as 20 (Holst &
  • 55. Jarms, 2010), and thus Ch. hysoscella medusae and polyps may be able to spread from the North Sea into the Baltic Sea with continued climate warming. The number of ephyrae produced by each strobila is affected by temperature, other abiotic factors, food supply and polyp size (Russell, 1970; Purcell et al., 1999). The results of this study agree with those of previous laboratory experiments on polyp cultures demonstrating that warm temperatures increase the strobilation rates of polyps and ephyra production, except at very high temperatures (Purcell et al., 1999, 2012; Purcell, 2007; Liu et al., 2009). The number of ephyrae in the strobila increases with polyp’s size (Russell, 1970). This may explain why the C. capillata polyps in the present experiments were able to produce more ephyrae by the second year when they grew to a larger size. Salinity also is known to affect strobilation rates of North Sea Scyphozoa (Holst & Jarms, 2010)
  • 56. and other species (reviewed in Purcell et al., 2009). Purcell et al. (2009) concluded that the combined effects of temperature, salinity, light and food deter- mined the amount and time of strobilation in situ. Only a few recent studies have monitored polyps in situ (see Purcell et al., 2009; Di Camillo et al., 2010; Ishii & Katsukoshi, 2010). Climatic changes in the North Sea related to the North Atlantic Oscillation (NAO) affect jellyfish abundances and may also affect the strobilation of the benthic polyps in this area (Lynam et al., 2010); however, the effects of the NAO depends on the depth that macrozoobenthos animals occur, and therefore, the estimation of the NAO’s effect on strobilation is not possible without knowing the locations and depths of polyp habitats (Lynam et al., 2005). The effect of the NAO on North Sea polyps is likely to be high because strobilation occurs mainly in winter and spring when the NAO’s influence
  • 57. is the greatest in the North Sea (Lynam et al., 2010). The results of the present study support the idea that variable winter temperatures affect the strobilation activity of North Sea Scyphozoa. Increasing winter temperature probably will affect the abundances and distributions of scyphozoan jellyfish species in the North Sea. The more southerly species, C. lamarckii and Ch. hysoscella could expand to the northern parts of the North Sea and possibly into the Baltic Sea. The adaptable species A. aurita presumably will benefit from warmer temperatures, having longer strobilation periods (present study), faster growth due to higher feeding rates (Hansson, 1997; Widmer, 2005) and higher reproduction rates of medusae (Ishii & Takagi, 2003). The cold water C. capillata might be the only North Sea scyphozoan that could suffer from warmer temperatures; however, C. capillata ephyra production also occurred at the warm
  • 58. winter temperature of 10�C (Fig. 1). In general, I assume that the abundances of scyphozoan jellyfish in the North and Baltic seas will increase in future years if the water temperatures continue to increase as predicted (Belkin, 2009). This assessment agrees with the opinion of other authors suggesting an increase of gelatinous predators (scyphomedusae, hydromedusae, siphonophores and ctenophores) in the North Sea due to climate changes, including increasing temperatures, the reduction of the ocean pH and probably, the increasing Atlantic inflow into the North Sea (Attrill et al., 2007; Boersma et al., 2007; Doyle et al., 2008; Lilley et al., 2009; Licandro et al., 2010). The results of this study and previous studies clearly show the linkage between physical environmental factors and ephyra production and thus forecasts of the abundance and distribution of scyphomedusae might be possible Hydrobiologia (2012) 690:127–140 137 123
  • 59. by circulation models in future (Johnson et al., 2001, 2005; Barz et al., 2006). More knowledge on the locations of polyp habitats and on the reproduction cycles of the benthic polyp stage in the field is necessary for successful monitoring and understand- ing the population dynamics in scyphozoan jellyfish. Acknowledgments I thank PD Dr. Gerhard Jarms for his support, for imparting his knowledge on polyp culturing and for providing the research facilities. I am grateful to the Biologische Anstalt Helgoland (Alfred Wegener Institute) for providing the guest laboratory and I am thankful for the assistance of students and technicians of the Biocenter Grindel. I thank Drs. Ilka Sötje, Jennifer Purcell, and the reviewers for their helpful comments on the manuscript, and Dr. Caroline Stolter for her help in the statistics. This study is part of a Ph. D. thesis conducted at the Biocenter Grindel and Zoological Museum in Hamburg
  • 60. supported by EUROGEL (EUROpean GELatinous Zoo- plankton, European Commission Contract no. EVK-CT-2002- 00074). References Attrill, M. J., J. Wright & M. Edwards, 2007. Climate-related increases in jellyfish frequency suggest a more gelatinous future for the North Sea. Limnology and Oceanography 52: 480–485. Barz, K. & H.-J. Hirche, 2007. Abundance, distribution and prey composition of scyphomedusae in the southern North Sea. Marine Biology 151: 1021–1033. Barz, K., H.-H. Hinrichsen & H.-J. Hirche, 2006. Scyphozoa in the Bornholm Basin (central Baltic Sea) - the role of advection. Journal of Marine Systems 60: 167–176. Bayha, K. M., 2005. The molecular systematics and population genetics of four coastal ctenophores and scyphozoan jel- lyfish of the United States Atlantic and Gulf of Mexico. Dissertation, University of Delaware: 283 pp.
  • 61. Belkin, I. M., 2009. Rapid warming of large marine ecosystems. Progress in Oceanography 81: 207–213. Boero, F., J. Boullion, C. Gravilli, M. P. Miglietta, T. Parsons & S. Piraino, 2008. Gelatinous plankton: irregularities rule the world (sometimes). Marine Ecology Progress Series 356: 299–310. Boersma, M., A. M. Malzahn, W. Greve & J. Javidpour, 2007. The first occurrence of the ctenophore Mnemiopsis leidyi in the North Sea. Helgoland Marine Research 61: 153–155. Brewer, R. H. & J. S. Feingold, 1991. The effect of temperature on the benthic stages of Cyanea (Cnidaria: Scyphozoa), and their seasonal distribution in the Niantic River estuary, Connecticut. Journal of Experimental Marine Biology and Ecology 152: 49–60. CIESM, 2001. Gelatinous zooplankton outbreaks: theory and practice. CIESM Workshop Series 14: 112 pp. Dawson, M. N., 2003. Macro-morphological variation among cryptic species of the moon jellyfish, Aurelia (Cnidaria: Scyphozoa). Marine Biology 143: 369–379.
  • 62. Dawson, M. N., 2005. Cyanea capillata is not a cosmopolitan jellyfish: morphological and molecular evidence for C. annaskala and C. rosea (Scyphozoa: Semaeostomeae: Cyaneidae) in south-eastern Australia. Invertebrate Sys- tematics 19: 361–370. Di Camillo, C. G., F. Betti, M. Bo, M. Martinelli, S. Puce & G. Bavestrello, 2010. Contribution to the understanding of seasonal cycle of Aurelia aurita (Cnidaria: Scyphozoa) scyphopolyps in the northern Adriatic Sea. Journal of the Marine Biological Association of the United Kingdom 90: 1105–1110. Doyle, T. K., J. D. R. Houghton, S. M. Buckley, G. C. Hays & J. Davenport, 2007. The broad-scale distribution of five jel- lyfish species across a temperate coastal environment. Hydrobiologia 579: 29–39. Doyle, T. K., H. De Haas, D. Cotton, B. Dorschel, V. Cummins, J. D. R. Houghton, J. Davenport & G. C. Hays, 2008. Widespread occurrence of the jellyfish Pelagia noctiluca in Irish coastal and shelf waters. Journal of Plankton Research 30: 963–968.
  • 63. Gröndahl, F., 1988. A comparative ecological study on the scyphozoans Aurelia aurita, Cyanea capillata and Cyanea lamarckii in the Gullmar Fjord, western Sweden. Marine Biology 97: 541–550. Hansson, L. J., 1997. Effect of temperature on growth rate of Aurelia aurita (Cnidaria, Scyphozoa) from Gullmarsfjor- den, Sweden. Marine Ecology Progress Series 161: 145–153. Hartlaub, C., 1894. Die Coelenteraten Helgolands. Wissens- chaftliche Meeresuntersuchungen Helgoland Neue Folge 1: 161–206. Hay, S. J., J. R. G. Hislop & A. M. Shanks, 1990. North Sea scyphomedusae; summer distribution, estimated biomass and significance particularly for 0-Group gadoid fish. Netherlands Journal of Sea Research 25: 113–130. HELCOM, 2007. Climate change in the Baltic Sea Area – HELCOM thematic assessment in 2007. Baltic Sea Envi- ronment Proceedings 111: 1–49. Hernroth, L. & F. Gröndahl, 1985. On the biology of Aurelia aurita (L.): 2. Major factors regulating the occurrence of
  • 64. ephyrae and young medusae in the Gullmar Fjord, western Sweden. Bulletin of Marine Science 37: 567–576. Holst, S. & G. Jarms, 2007. Substrate choice and settlement preferences of planula larvae of five Scyphozoa (Cnidaria) from German Bight, North Sea. Marine Biology 151: 863–871. Holst, S. & G. Jarms, 2010. Effects of low salinity on settlement and strobilation of Scyphozoa (Cnidaria): is the lion’s mane Cyanea capillata (L.) able to reproduce in the brackish Baltic Sea? Hydrobiologia 645: 53–68. Holst, S., I. Sötje, H. Tieman & G. Jarms, 2007. Life cycle of the rhizostome jellyfish Rhizostoma octopus (L.) (Scyphozoa, Rhizostomeae), with studies on cnidocysts and statoliths. Marine Biology 151: 1695–1710. IPCC, 2007. Summary for policymakers. In Solomon, S., D. Qin, M. Manning, Z. Chen, M. Marquis, K. B. Averyt, M. Tignor & H. L. Miller (eds), Climate Change 2007: The Physical Science Basis. Contribution of Working Group I
  • 65. to the Fourth Asessment Report of the Intergovernmental Panel on Climate Change. Cambridge University Press, Cambridge. 138 Hydrobiologia (2012) 690:127–140 123 Ishii, H. & K. Katsukoshi, 2010. Seasonal and vertical distri- bution of Aurelia aurita polyps on a pylon in the innermost part of Tokyo Bay. Journal of Oceanography 66: 329–336. Ishii, H. & A. Takagi, 2003. Development time of planula larvae on the oral arms of the scyphomedusa Aurelia aurita. Journal of Plankton Research 25: 1447–1450. Jarms, G., 2010. The early life history of Scyphozoa with emphasis on Coronatae a review with a list of described life cycles. Verhandlungen des Naturwissenschaftlichen Ve- reins Hamburg 45: 17–31. Johnson, D. R., H. M. Perry & W. D. Burke, 2001. Developing jellyfish strategy hypotheses using circulation models. Hydrobiologia 451: 213–221.
  • 66. Johnson, D. R., H. M. Perry & W. M. Graham, 2005. Using nowcast model currents to explore transport of non-indig- enous jellyfish into the Gulf of Mexico. Marine Ecology Progress Series 305: 139–146. Kändler, R., 1961. Über das Vorkommen von Fischbrut, De- capodenlarven und Medusen in der Kieler Förde. Kieler Meeresforschung 17: 48–65. Korringa, P., 1953. The shell of Ostrea edulis as a habitat. Archives Neerlandaises de Zoologie 10: 32–59. Künne, C., 1952. Untersuchungen über das Großplankton in der Deutschen Bucht und im Nordsylter Wattenmeer. Hel- goländer Wissenschaftliche Meeresuntersuchungen 4: 1–54. Licandro, P., D. V. P. Conway, M. N. Daly Yahia, M. L. Fer- nandez De Puelles, S. Gasparini, J. H. Hecq, P. Tranter & R. R. Kirby, 2010. A blooming jellyfish in the northeast Atlantic and Mediterranean. Biology Letters 6: 688–691. Lilley, M. K. S., J. D. R. Houghton & G. C. Hays, 2009. Dis- tribution, extent of inter-annual variability and diet of the
  • 67. bloom-forming jellyfish Rhizostoma in European waters. Journal of the Marine Biological Association of the United Kingdom 89: 39–48. Liu, W.-C., W.-T. Lo, J. E. Purcell & H.-H. Chang, 2009. Effects of temperature and light intensity on asexual reproduction of the scyphozoan, Aurelia aurita (L.) in Taiwan. Hydrobiologia 616: 247–258. Lucas, C. H., 1996. Population dynamics of Aurelia aurita (Scyphozoa) from an isolated brackish lake, with particular reference to sexual reproduction. Journal of Plankton Research 18: 987–1007. Lucas, C. H., A. G. Hirst & J. A. Williams, 1997. Plankton dynamics and Aurelia aurita production in two contrasting ecosystems: comparison and consequences. Estuarine, Coastal and Shelf Science 45: 209–219. Lynam, C. P., S. J. Hay & A. S. Brierley, 2005. Jellyfish abundance and climatic variation: contrasting responses in oceanographically distinct regions of the North Sea, and possible implications for fisheries. Journal of the Marine Biological Association of the United Kingdom 85:
  • 68. 435–450. Lynam, C. P., M. J. Attrill & M. D. Skogen, 2010. Climatic and oceanic influences on the abundance of gelatinous zoo- plankton in the North Sea. Journal of the Marine Biological Association of the United Kingdom 90: 1153–1159. Merck, T., 1990. Untersuchungen zur ökologischen Nische von Chrysaora hysoscella. Jahresbericht der Biologischen Anstalt Helgoland 1989: 53–54. Mieszkowska, N., R. Leaper, P. Moore, M. A. Kendall, M. T. Burrows, D. Lear, E. Poloczanska, K. Hiscock, P. S. Moschella, R. C. Thompson, R. J. Herbert, D. Lafolley, J. Baxter, A. J. Southward & S. J. Hawkins, 2006. Marine biodiversity and climate change. Assessing and predicting the influence of climate change using intertidal rocky shore biota. Final report for United Kingdom funders. Marine Biological Association Occasional Publications 20: 1–53. Miyake, H., M. Terazaki & Y. Kakinuma, 2002. On the polyps of the common jellyfish Aurelia aurita in Kagoshima Bay. Journal of Oceanography 58: 451–459.
  • 69. Molinero, J. C., M. Casini & E. Buecher, 2008. The influence of the Atlantic and regional climate variability on the long- term changes in gelatinous carnivore populations in the northwestern Mediterranean. Limnology and Oceanogra- phy 53: 1456–1467. Möller, H., 1980a. A summer survey of large zooplankton, particularly scyphomedusae, in North Sea and Baltic. Meeresforschung 28: 61–68. Möller, H., 1980b. Population dynamics of Aurelia aurita medusae in Kiel Bight, Germany (FRG). Marine Biology 60: 123–128. Palmén, E., 1954. Seasonal occurrence of ephyrae and sub- sequent instars of Aurelia aurita (L.) in the shallow waters of Tvärminne, S. Finland. Archivum Societatis Zoologicae Botanicae Fennicae Vanamo 8: 122–138. Pierce, J., 2009. Prediction, location, collection and transport of jellyfish (Cnidaria) and their polyps. Zoo Biology 28: 163–176. Purcell, J. E., 2005. Climate effects on formation of jellyfish and
  • 70. ctenophore blooms: a review. Journal of the Marine Bio- logical Association of the United Kingdom 85: 461–476. Purcell, J. E., 2007. Environmental effects on asexual repro- duction rates of the scyphozoan Aurelia labiata. Marine Ecology Progress Series 348: 183–196. Purcell, J. E., 2009. Extension of methods for jellyfish and ctenophore trophic ecology to large-scale research. Hyd- robiologia 616: 23–50. Purcell, J. E., 2011. Jellyfish and ctenophore blooms coincide with human proliferations and environmental perturba- tions. Annual Review of Marine Science. doi:10.1146/ annurev-marine-120709-142751. Purcell, J. E., J. R. White, D. A. Nemazie & D. A. Wright, 1999. Temperature, salinity and food effects on asexual repro- duction and abundance of the scyphozoan Chrysaora quinquecirrha. Marine Ecology Progress Series 180: 486–487. Purcell, J. E., S.-I. Uye & W.-T. Lo, 2007. Anthropogenic causes of jellyfish blooms and their direct consequences for
  • 71. humans: a review. Marine Ecology Progress Series 350: 153–174. Purcell, J. E., R. A. Hoover & N. T. Schwarck, 2009. Interannual variation of strobilation by the scyphozoan Aurelia labiata in relation to polyp density, temperature, salinity, and light conditions in situ. Marine Ecology Progress Series 375: 139–149. Purcell, J. E., D. Atienza, V. Fuentes, A. Olariaga, U. Tilves, C. Colahan, J.-M. Gili, 2012. Temperature effects on asexual reproduction rates of scyphozoan polyps from the north- west Mediterranean Sea. Hydrobiologia, this issue. doi:10.1007/s10750-012-1047-7. Rasmussen, E., 1973. Systematic and ecology of the Isefjord marine fauna (Denmark). Ophelia 11: 1–507. Hydrobiologia (2012) 690:127–140 139 123 http://dx.doi.org/10.1146/annurev-marine-120709-142751 http://dx.doi.org/10.1146/annurev-marine-120709-142751 http://10.1007/s10750-012-1047-7
  • 72. Richardson, A. J., A. Bakun, G. C. Hays & M. J. Gibbons, 2009. The jellyfish joyride: causes, consequences and manage- ment responses to a more gelatinous future. Trends in Ecology & Evolution 24: 312–322. Russell, F. S., 1970. The medusae of the British Isles II. Pelagic Scyphozoa with a supplement to the first volume on hydromedusae. Cambridge University Press, Cambridge. Sabatés, A., F. Pagès, D. Atienza, V. Fuentes, J. E. Purcell & J.- M. Gili, 2010. Planktonic cnidarian distribution and feed- ing of Pelagia noctiluca in the NW Mediterranean Sea. Hydrobiologia 645: 153–165. Sötje, I. & G. Jarms, 2009. Derivation of the reduced life cycle of Thecoscyphus zibrowii Werner, 1984 (Cnidaria, Scy- phozoa). Marine Biology 156: 2331–2341. Thiel, M. E., 1938. Scyphomedusae. In Bronn, H. G. (ed.), Dr. H. G. Bronns Klassen und Ordnungen des Tierreichs. Akademische Verlagsgesellschaft, Leipzig. Thiel, H., 1962. Untersuchungen über die Strobilisation von
  • 73. Aurelia aurita LAM. an einer Population der Kieler Förde. Kieler Meeresforschungen 18: 198–230. Tronolone, V. B., A. C. Morandini & A. E. Bigotto, 2002. On the occurrence of scyphozoan ephyrae (Cnidaria, Scyphozoa, Semaestomeae and Rhizostomeae) in the southeastern Brazilian coast. Biota Neotropica 2: 1–18. Verwey, J., 1942. Die Periodizität im Auftreten und die aktiven und passiven Bewegungen der Quallen. Archives Neer- landaises de Zoologie 6: 363–468. Widmer, C. L., 2005. Effects of temperature on growth of north- east Pacific moon jellyfish ephyrae, Aurelia labiata (Cni- daria: Scyphozoa). Journal of the Marine Biological Association of the United Kingdom 85: 569–573. Willcox, S., N. Moltschaniwskyj & C. Crawford, 2007. Asexual reproduction in scyphistomae of Aurelia sp.: effects of temperature and salinity in an experimental study. Journal of Experimental Marine Biology and Ecology 353: 107–114. Wiltshire, K. H. & B. F. J. Manly, 2004. The warming trend at
  • 74. Helgoland Roads, North Sea: Phytoplankton response. Helgoland Marine Research 58: 269–273. Wiltshire, K. H., A. Kraberg, I. Bartsch, M. Boersma, H.-D. Franke, J. Freud, C. Gebühr, G. Gerdts, K. Stockmann & A. Wichels, 2010. Helgoland Roads, North Sea: 45 years of change. Estuaries and Coasts 33: 295–310. You, K., C. Ma, H. Gao, G. Li, M. Zhang, B. Wang & R. Wei, 2008. The effects of temperature decrease on the scyphis- tomae strobilation of Jellyfish, Rhopilema esculentum Kishinouye. Journal of the World Aquaculture Society 39: 706–711. 140 Hydrobiologia (2012) 690:127–140 123 Scientific Article Discussions It is important for scientists to be able to read, analyze, and synthesize scientific journal articles in order to answer questions and determine the current state of knowledge on a topic. We will have seven paper discussions over the course of the semester, six led by pairs of students. Each student is required to co-lead one discussion. The discussion leaders are required to: 1. Examine the list of questions provided below for their assigned article discussion (#2-7) and choose a question (or
  • 75. come up with your own) that you would like to address with the literature discussion. 2. Findone scientific article that you think addresses that topic. (You will probably need to search through several papers to find one that actually address the question or are interesting to you). 3. Meet with me at least two weeks before the discussion day to look over your topic and journal article. Be sure you read the article before you meet with me!You need to send me the articles you propose to use at least two days in advance of our meeting. 4. On the day of discussion, give a 5-10 minute mini-lesson reiterating what the foundational question was addressed by the paperand thenproviding background context for the paper and summarizing the key question(s), methods, results, and conclusions. This should incorporate a PowerPoint presentation with the most pertinent (not necessarily all) information and figures…just hit the most relevant items. Try not to provide critique or opinions about the paper during the summary. 5. Facilitate discussion about the paper. Here are some tips (in no particular order) of things you might want to include in your discussion: a. Try not to let your opinion of the paper dominate the discussion. Encourage everyone to contribute his or her thoughts. b. Solicit people’s opinions of what they found to be the strongest or weakest parts of the paper. You can ask for everyone to respond, or specific individuals (but spread the love a little). c. Ask for people to share what confusions they had, or what they thought was unclear. d. Discuss whether the authors achieved what they set out to do and whether their conclusions were meaningful, reasonably “within the bounds of their data”, and/or important or generalizable to other topics. e. You can ask people what they would have done differently
  • 76. for this study, or helpful follow-up studies that could be pursued. f. Ask the group what research questions arose in their minds while reading the article(s). g. Try to conclude with a brief summary of what ideas/conclusions were produced/shared during the article discussion you just led. The rest of the class is required to: 1. Read the paper. 2. Write a summary of the key points of each paper and how they relate to larger question being addressed or the course content. This summary must include at least one idea or question for discussion (see the list of discussion tips above and consider making notes about those while reading). The summary should be short (approximately ½-page single-spaced), typed, and brought to the discussion. 3. Participate in the discussion during class. Active participation is essential for discussion and relies on having read the papers. (Your written summary and active participation in discussions accounts for 7.5% of your course grade.) Article Discussion Possible Questions: Other questions are possible, so if you have a question that is somewhat related to what we have discussed in class, then suggest that. Article Discussion #1: (Instructor-led) How should scientists approach the study of the natural world? Article Discussion #2: What environmental traits determine the geographic range of a species? How to species respond to climate change? Are native or invasive species better able to adapt to environmental change? How do animals (or plants) live in the desert with such little water? Why can some fish live in freshwater, some in salt water, and some can live in either?
  • 77. How do plants maintain homeostasis of energy production under various environmental conditions? How do organisms optimize their time when obtaining energy? Article Discussion #3: What are the costs and benefits of direct versus indirect development? What environmental conditions cause variation in modes of reproduction? (between species or within one species) Why do some organisms produce few offspring while other produce many? What factors determine when an organism begins to reproduce? What is better for a larvae to do, develop fast an metamorphose when small or develop more slowly and metamorphose when large? How do different dispersal methods affect population connectivity? What factors influence the magnitude of population dispersal? Are (or when are) some methods of measuring abundance better/worse than others? How does [insert some aspect of population demographics] influence change in population growth? What ecological circumstances lead to different types of survival curves (or reproductive timing) in a species (or different species)? What exerts more influence on populations of [insert species], density-dependent or density independent processes? How to population outbreaks affect an ecosystem (or community)? Can population cycles be predicted? How? (Or what factors determine population cycles?) How impact does the allee have on a population? More to come for the later discussions… BIO317 Spring 2018