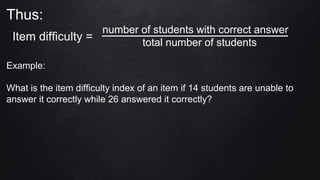
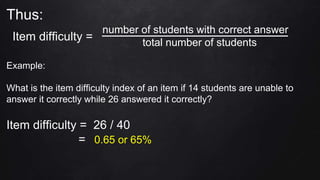
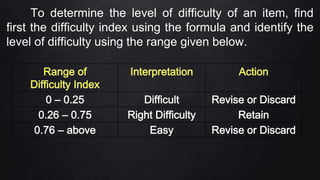
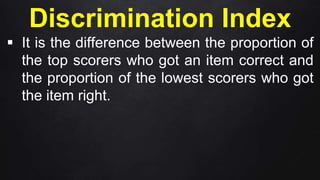
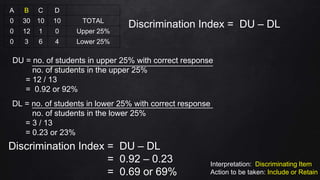
SlideShare a Scribd company logo
1 of 23
ASSESSMENT
IN LEARNING 1
PROFESSIONAL EDUCATION 7
CHAPTER I – Shift of Educational Focus from Content to Learning Outcomes
CHAPTER II – Determining the Progress Towards the Attainment
of Learning Outcomes
CHAPTER III – Program Outcomes and Student Learning Outcomes
CHAPTER IV – Assessing Student Learning Outcomes
CHAPTER V – Distinguishing and Constructing Various Paper-and-Pencil-Tests
CHAPTER VI – Item Analysis and Validation
CHAPTER VII – Measures of Central Tendency and Dispersion / Variability
CHAPTER VIII – Grading Systems and the Grading System of the
Department of Education
COURSE CONTENT
ITEM
ANALYSIS
Item Analysis is a process of examining
the students’ response to individual item in the
test. It consists of different procedures for
assessing the quality of the test items given to
the students. Through the use of item analysis,
we can identify which of the given are good
and defective test items. Good items are to be
retained and defective items are to be
improved, to be revised or to be rejected.
Types of Quantitative Item Analysis
There are three common types of
quantitative tem analysis which provide
teachers with three different types of
information about individual test items. These
are difficulty index and discrimination index.
Difficulty Index
 It is a measure of the proportion of
examinees who answered the item correctly.
 The difficulty of an item or item difficulty is
defined as the number of students who are
able to answer the item correctly divided by
the total number of students.
Thus:
number of students with correct answer
total number of students
Example:
What is the item difficulty index of an item if 14 students are unable to
answer it correctly while 26 answered it correctly?
Item difficulty =
Thus:
number of students with correct answer
total number of students
Example:
What is the item difficulty index of an item if 14 students are unable to
answer it correctly while 26 answered it correctly?
Item difficulty = 26 / 40
= 0.65 or 65%
Item difficulty =
To determine the level of difficulty of an item, find
first the difficulty index using the formula and identify the
level of difficulty using the range given below.
One problem with this type of difficulty index is
that it may not actually indicate that the item is
difficult (or easy). A student who does not know the
subject matter will naturally be unable to answer the
item correctly even if the question is easy. We are
therefore interested in deriving a measure that will
tell us whether an item can discriminate between
these two groups of students.
Discrimination Index
 It is the difference between the proportion of
the top scorers who got an item correct and
the proportion of the lowest scorers who got
the item right.
An easy way to derive such a measure is to
measure how difficult an item is with respect to
those in the upper 25% of the class and how
difficult it is with respect to those in the lower
25% of the class.
Index of discrimination = DU - DL
(DU - Upper group; DL – Lower group)
Example: Obtain the index of discrimination of an
item if the upper 25% of the class had a difficulty
index of 0.60 (i.e. 60% of the upper 25% got the
correct answer) while the lower 25% of the class
had a difficulty index of 0.20.
Here, DU = 0.60 while DL = 0.20,
thus index of discrimination = 0.60 - 0.20 = 0.40
To determine the level of discrimination of an item,
find first the discrimination index using the formula and
identify the level of it using the range given below.
Consider a multiple-choice type of test of which the following data
were obtained. A class is composed of 50 students. Use 25% to get the
upper and the lower groups. Analyze the item given the following results.
Option B is the correct answer. What will you do with the test item?
A B C D
0 30 10 10 TOTAL
0 12 1 0 Upper 25%
0 3 6 4 Lower 25%
Let us compute for
the Difficulty Index
and the
Discrimination Index
number of students with correct answer
total number of students
Difficulty Index =
A B C D
0 30 10 10 TOTAL
0 12 1 0 Upper 25%
0 3 6 4 Lower 25%
number of students with correct answer
total number of students
= 30 / 50
= 0.6 or 60%
Interpretation: Right Difficulty
Action to be taken: Retain
Difficulty Index =
A B C D
0 30 10 10 TOTAL
0 12 1 0 Upper 25%
0 3 6 4 Lower 25%
Discrimination Index = DU – DL
A B C D
0 30 10 10 TOTAL
0 12 1 0 Upper 25%
0 3 6 4 Lower 25%
DU = no. of students in upper 25% with correct response
no. of students in the upper 25%
=
=
DL = no. of students in lower 25% with correct response
no. of students in the lower 25%
=
=
Discrimination Index = DU – DL
=
=
Interpretation:
Action to be taken:
Discrimination Index = DU – DL
A B C D
0 30 10 10 TOTAL
0 12 1 0 Upper 25%
0 3 6 4 Lower 25%
DU = no. of students in upper 25% with correct response
no. of students in the upper 25%
= 12 / 13
= 0.92 or 92%
DL = no. of students in lower 25% with correct response
no. of students in the lower 25%
= 3 / 13
= 0.23 or 23%
Discrimination Index = DU – DL
= 0.92 – 0.23
= 0.69 or 69%
Interpretation: Discriminating Item
Action to be taken: Include or Retain
Validity - the extent to which a test
measures what it is intended to be
measured.
Reliability - the consistency of the scores
obtained – how consistent they are for
each individual from one administration of
an instrument to another and from one set
of items to another.
A valid test is always reliable, but a
reliable test is not always valid.
A valid test is always reliable, but a
reliable test is not always valid.
In other words, if a test is measuring
what it is supposed to measure, it will
be reliable, but a reliable test can
consistently measure the “wrong”
thing, thus making it invalid.

More Related Content

Similar to ITEM-ANALYSIS-AND-VALIDATION-in-assessment-in-learning.pptx

item analysis.pptx education pnc item analysis
item analysis.pptx education pnc item analysisitem analysis.pptx education pnc item analysis
item analysis.pptx education pnc item analysisswatisheth8
 
Item analysis in education
Item analysis  in educationItem analysis  in education
Item analysis in educationmunsif123
 
Topic 8b Item Analysis
Topic 8b Item AnalysisTopic 8b Item Analysis
Topic 8b Item AnalysisYee Bee Choo
 
Fdu item analysis (1).ppt revised by dd
Fdu item analysis (1).ppt revised by ddFdu item analysis (1).ppt revised by dd
Fdu item analysis (1).ppt revised by dddettmore
 
evaluations Item Analysis for teachers.pdf
evaluations  Item Analysis for teachers.pdfevaluations  Item Analysis for teachers.pdf
evaluations Item Analysis for teachers.pdfBatMan752678
 
Item and Distracter Analysis
Item and Distracter AnalysisItem and Distracter Analysis
Item and Distracter AnalysisSue Quirante
 
Analyzingandusingtestitemdata 101012035435-phpapp02
Analyzingandusingtestitemdata 101012035435-phpapp02Analyzingandusingtestitemdata 101012035435-phpapp02
Analyzingandusingtestitemdata 101012035435-phpapp02cezz gonzaga
 
Test Items Based on their Discrimination Power.pptx
Test Items Based on their Discrimination Power.pptxTest Items Based on their Discrimination Power.pptx
Test Items Based on their Discrimination Power.pptxShad847167
 

Similar to ITEM-ANALYSIS-AND-VALIDATION-in-assessment-in-learning.pptx (20)

item analysis.pptx education pnc item analysis
item analysis.pptx education pnc item analysisitem analysis.pptx education pnc item analysis
item analysis.pptx education pnc item analysis
 
Item analysis in education
Item analysis  in educationItem analysis  in education
Item analysis in education
 
Item
ItemItem
Item
 
Analyzing and using test item data
Analyzing and using test item dataAnalyzing and using test item data
Analyzing and using test item data
 
Analyzing and using test item data
Analyzing and using test item dataAnalyzing and using test item data
Analyzing and using test item data
 
Analyzing and using test item data
Analyzing and using test item dataAnalyzing and using test item data
Analyzing and using test item data
 
Analyzing and using test item data
Analyzing and using test item dataAnalyzing and using test item data
Analyzing and using test item data
 
Improving the test items
Improving the test itemsImproving the test items
Improving the test items
 
Topic 8b Item Analysis
Topic 8b Item AnalysisTopic 8b Item Analysis
Topic 8b Item Analysis
 
Fdu item analysis (1).ppt revised by dd
Fdu item analysis (1).ppt revised by ddFdu item analysis (1).ppt revised by dd
Fdu item analysis (1).ppt revised by dd
 
evaluations Item Analysis for teachers.pdf
evaluations  Item Analysis for teachers.pdfevaluations  Item Analysis for teachers.pdf
evaluations Item Analysis for teachers.pdf
 
Item and Distracter Analysis
Item and Distracter AnalysisItem and Distracter Analysis
Item and Distracter Analysis
 
Analyzingandusingtestitemdata 101012035435-phpapp02
Analyzingandusingtestitemdata 101012035435-phpapp02Analyzingandusingtestitemdata 101012035435-phpapp02
Analyzingandusingtestitemdata 101012035435-phpapp02
 
Item analysis2
Item analysis2Item analysis2
Item analysis2
 
Test Items Based on their Discrimination Power.pptx
Test Items Based on their Discrimination Power.pptxTest Items Based on their Discrimination Power.pptx
Test Items Based on their Discrimination Power.pptx
 
Item Analysis
Item AnalysisItem Analysis
Item Analysis
 
New item analysis
New item analysisNew item analysis
New item analysis
 
Item analysis
Item analysisItem analysis
Item analysis
 
Item analysis ppt
Item analysis pptItem analysis ppt
Item analysis ppt
 
Quantitative Item Analysis
Quantitative Item Analysis Quantitative Item Analysis
Quantitative Item Analysis
 

More from AnielofTandog

History-of-HE (1).pptx
History-of-HE (1).pptxHistory-of-HE (1).pptx
History-of-HE (1).pptxAnielofTandog
 
Formulating-Learning-Objevtives.pptx
Formulating-Learning-Objevtives.pptxFormulating-Learning-Objevtives.pptx
Formulating-Learning-Objevtives.pptxAnielofTandog
 
Developmental-Tasks-and-Education.pptx
Developmental-Tasks-and-Education.pptxDevelopmental-Tasks-and-Education.pptx
Developmental-Tasks-and-Education.pptxAnielofTandog
 

More from AnielofTandog (6)

News Literacy.pptx
News Literacy.pptxNews Literacy.pptx
News Literacy.pptx
 
Andragogyppt.pptx
Andragogyppt.pptxAndragogyppt.pptx
Andragogyppt.pptx
 
History-of-HE (1).pptx
History-of-HE (1).pptxHistory-of-HE (1).pptx
History-of-HE (1).pptx
 
Formulating-Learning-Objevtives.pptx
Formulating-Learning-Objevtives.pptxFormulating-Learning-Objevtives.pptx
Formulating-Learning-Objevtives.pptx
 
PPT-in-PE.pptx
PPT-in-PE.pptxPPT-in-PE.pptx
PPT-in-PE.pptx
 
Developmental-Tasks-and-Education.pptx
Developmental-Tasks-and-Education.pptxDevelopmental-Tasks-and-Education.pptx
Developmental-Tasks-and-Education.pptx
 

Recently uploaded

Grant Readiness 101 TechSoup and Remy Consulting
Grant Readiness 101 TechSoup and Remy ConsultingGrant Readiness 101 TechSoup and Remy Consulting
Grant Readiness 101 TechSoup and Remy ConsultingTechSoup
 
Introduction to Nonprofit Accounting: The Basics
Introduction to Nonprofit Accounting: The BasicsIntroduction to Nonprofit Accounting: The Basics
Introduction to Nonprofit Accounting: The BasicsTechSoup
 
microwave assisted reaction. General introduction
microwave assisted reaction. General introductionmicrowave assisted reaction. General introduction
microwave assisted reaction. General introductionMaksud Ahmed
 
Q4-W6-Restating Informational Text Grade 3
Q4-W6-Restating Informational Text Grade 3Q4-W6-Restating Informational Text Grade 3
Q4-W6-Restating Informational Text Grade 3JemimahLaneBuaron
 
Ecosystem Interactions Class Discussion Presentation in Blue Green Lined Styl...
Ecosystem Interactions Class Discussion Presentation in Blue Green Lined Styl...Ecosystem Interactions Class Discussion Presentation in Blue Green Lined Styl...
Ecosystem Interactions Class Discussion Presentation in Blue Green Lined Styl...fonyou31
 
Nutritional Needs Presentation - HLTH 104
Nutritional Needs Presentation - HLTH 104Nutritional Needs Presentation - HLTH 104
Nutritional Needs Presentation - HLTH 104misteraugie
 
social pharmacy d-pharm 1st year by Pragati K. Mahajan
social pharmacy d-pharm 1st year by Pragati K. Mahajansocial pharmacy d-pharm 1st year by Pragati K. Mahajan
social pharmacy d-pharm 1st year by Pragati K. Mahajanpragatimahajan3
 
Organic Name Reactions for the students and aspirants of Chemistry12th.pptx
Organic Name Reactions  for the students and aspirants of Chemistry12th.pptxOrganic Name Reactions  for the students and aspirants of Chemistry12th.pptx
Organic Name Reactions for the students and aspirants of Chemistry12th.pptxVS Mahajan Coaching Centre
 
POINT- BIOCHEMISTRY SEM 2 ENZYMES UNIT 5.pptx
POINT- BIOCHEMISTRY SEM 2 ENZYMES UNIT 5.pptxPOINT- BIOCHEMISTRY SEM 2 ENZYMES UNIT 5.pptx
POINT- BIOCHEMISTRY SEM 2 ENZYMES UNIT 5.pptxSayali Powar
 
BASLIQ CURRENT LOOKBOOK LOOKBOOK(1) (1).pdf
BASLIQ CURRENT LOOKBOOK  LOOKBOOK(1) (1).pdfBASLIQ CURRENT LOOKBOOK  LOOKBOOK(1) (1).pdf
BASLIQ CURRENT LOOKBOOK LOOKBOOK(1) (1).pdfSoniaTolstoy
 
Paris 2024 Olympic Geographies - an activity
Paris 2024 Olympic Geographies - an activityParis 2024 Olympic Geographies - an activity
Paris 2024 Olympic Geographies - an activityGeoBlogs
 
Presentation by Andreas Schleicher Tackling the School Absenteeism Crisis 30 ...
Presentation by Andreas Schleicher Tackling the School Absenteeism Crisis 30 ...Presentation by Andreas Schleicher Tackling the School Absenteeism Crisis 30 ...
Presentation by Andreas Schleicher Tackling the School Absenteeism Crisis 30 ...EduSkills OECD
 
9548086042 for call girls in Indira Nagar with room service
9548086042  for call girls in Indira Nagar  with room service9548086042  for call girls in Indira Nagar  with room service
9548086042 for call girls in Indira Nagar with room servicediscovermytutordmt
 
SOCIAL AND HISTORICAL CONTEXT - LFTVD.pptx
SOCIAL AND HISTORICAL CONTEXT - LFTVD.pptxSOCIAL AND HISTORICAL CONTEXT - LFTVD.pptx
SOCIAL AND HISTORICAL CONTEXT - LFTVD.pptxiammrhaywood
 
The basics of sentences session 2pptx copy.pptx
The basics of sentences session 2pptx copy.pptxThe basics of sentences session 2pptx copy.pptx
The basics of sentences session 2pptx copy.pptxheathfieldcps1
 
Accessible design: Minimum effort, maximum impact
Accessible design: Minimum effort, maximum impactAccessible design: Minimum effort, maximum impact
Accessible design: Minimum effort, maximum impactdawncurless
 
APM Welcome, APM North West Network Conference, Synergies Across Sectors
APM Welcome, APM North West Network Conference, Synergies Across SectorsAPM Welcome, APM North West Network Conference, Synergies Across Sectors
APM Welcome, APM North West Network Conference, Synergies Across SectorsAssociation for Project Management
 

Recently uploaded (20)

Advance Mobile Application Development class 07
Advance Mobile Application Development class 07Advance Mobile Application Development class 07
Advance Mobile Application Development class 07
 
Grant Readiness 101 TechSoup and Remy Consulting
Grant Readiness 101 TechSoup and Remy ConsultingGrant Readiness 101 TechSoup and Remy Consulting
Grant Readiness 101 TechSoup and Remy Consulting
 
Introduction to Nonprofit Accounting: The Basics
Introduction to Nonprofit Accounting: The BasicsIntroduction to Nonprofit Accounting: The Basics
Introduction to Nonprofit Accounting: The Basics
 
microwave assisted reaction. General introduction
microwave assisted reaction. General introductionmicrowave assisted reaction. General introduction
microwave assisted reaction. General introduction
 
Mattingly "AI & Prompt Design: Structured Data, Assistants, & RAG"
Mattingly "AI & Prompt Design: Structured Data, Assistants, & RAG"Mattingly "AI & Prompt Design: Structured Data, Assistants, & RAG"
Mattingly "AI & Prompt Design: Structured Data, Assistants, & RAG"
 
Q4-W6-Restating Informational Text Grade 3
Q4-W6-Restating Informational Text Grade 3Q4-W6-Restating Informational Text Grade 3
Q4-W6-Restating Informational Text Grade 3
 
Ecosystem Interactions Class Discussion Presentation in Blue Green Lined Styl...
Ecosystem Interactions Class Discussion Presentation in Blue Green Lined Styl...Ecosystem Interactions Class Discussion Presentation in Blue Green Lined Styl...
Ecosystem Interactions Class Discussion Presentation in Blue Green Lined Styl...
 
Nutritional Needs Presentation - HLTH 104
Nutritional Needs Presentation - HLTH 104Nutritional Needs Presentation - HLTH 104
Nutritional Needs Presentation - HLTH 104
 
social pharmacy d-pharm 1st year by Pragati K. Mahajan
social pharmacy d-pharm 1st year by Pragati K. Mahajansocial pharmacy d-pharm 1st year by Pragati K. Mahajan
social pharmacy d-pharm 1st year by Pragati K. Mahajan
 
Organic Name Reactions for the students and aspirants of Chemistry12th.pptx
Organic Name Reactions  for the students and aspirants of Chemistry12th.pptxOrganic Name Reactions  for the students and aspirants of Chemistry12th.pptx
Organic Name Reactions for the students and aspirants of Chemistry12th.pptx
 
POINT- BIOCHEMISTRY SEM 2 ENZYMES UNIT 5.pptx
POINT- BIOCHEMISTRY SEM 2 ENZYMES UNIT 5.pptxPOINT- BIOCHEMISTRY SEM 2 ENZYMES UNIT 5.pptx
POINT- BIOCHEMISTRY SEM 2 ENZYMES UNIT 5.pptx
 
BASLIQ CURRENT LOOKBOOK LOOKBOOK(1) (1).pdf
BASLIQ CURRENT LOOKBOOK  LOOKBOOK(1) (1).pdfBASLIQ CURRENT LOOKBOOK  LOOKBOOK(1) (1).pdf
BASLIQ CURRENT LOOKBOOK LOOKBOOK(1) (1).pdf
 
Paris 2024 Olympic Geographies - an activity
Paris 2024 Olympic Geographies - an activityParis 2024 Olympic Geographies - an activity
Paris 2024 Olympic Geographies - an activity
 
Presentation by Andreas Schleicher Tackling the School Absenteeism Crisis 30 ...
Presentation by Andreas Schleicher Tackling the School Absenteeism Crisis 30 ...Presentation by Andreas Schleicher Tackling the School Absenteeism Crisis 30 ...
Presentation by Andreas Schleicher Tackling the School Absenteeism Crisis 30 ...
 
9548086042 for call girls in Indira Nagar with room service
9548086042  for call girls in Indira Nagar  with room service9548086042  for call girls in Indira Nagar  with room service
9548086042 for call girls in Indira Nagar with room service
 
SOCIAL AND HISTORICAL CONTEXT - LFTVD.pptx
SOCIAL AND HISTORICAL CONTEXT - LFTVD.pptxSOCIAL AND HISTORICAL CONTEXT - LFTVD.pptx
SOCIAL AND HISTORICAL CONTEXT - LFTVD.pptx
 
The basics of sentences session 2pptx copy.pptx
The basics of sentences session 2pptx copy.pptxThe basics of sentences session 2pptx copy.pptx
The basics of sentences session 2pptx copy.pptx
 
Código Creativo y Arte de Software | Unidad 1
Código Creativo y Arte de Software | Unidad 1Código Creativo y Arte de Software | Unidad 1
Código Creativo y Arte de Software | Unidad 1
 
Accessible design: Minimum effort, maximum impact
Accessible design: Minimum effort, maximum impactAccessible design: Minimum effort, maximum impact
Accessible design: Minimum effort, maximum impact
 
APM Welcome, APM North West Network Conference, Synergies Across Sectors
APM Welcome, APM North West Network Conference, Synergies Across SectorsAPM Welcome, APM North West Network Conference, Synergies Across Sectors
APM Welcome, APM North West Network Conference, Synergies Across Sectors
 

ITEM-ANALYSIS-AND-VALIDATION-in-assessment-in-learning.pptx

  • 2. CHAPTER I – Shift of Educational Focus from Content to Learning Outcomes CHAPTER II – Determining the Progress Towards the Attainment of Learning Outcomes CHAPTER III – Program Outcomes and Student Learning Outcomes CHAPTER IV – Assessing Student Learning Outcomes CHAPTER V – Distinguishing and Constructing Various Paper-and-Pencil-Tests CHAPTER VI – Item Analysis and Validation CHAPTER VII – Measures of Central Tendency and Dispersion / Variability CHAPTER VIII – Grading Systems and the Grading System of the Department of Education COURSE CONTENT
  • 4. Item Analysis is a process of examining the students’ response to individual item in the test. It consists of different procedures for assessing the quality of the test items given to the students. Through the use of item analysis, we can identify which of the given are good and defective test items. Good items are to be retained and defective items are to be improved, to be revised or to be rejected.
  • 5. Types of Quantitative Item Analysis There are three common types of quantitative tem analysis which provide teachers with three different types of information about individual test items. These are difficulty index and discrimination index.
  • 6. Difficulty Index  It is a measure of the proportion of examinees who answered the item correctly.  The difficulty of an item or item difficulty is defined as the number of students who are able to answer the item correctly divided by the total number of students.
  • 7. Thus: number of students with correct answer total number of students Example: What is the item difficulty index of an item if 14 students are unable to answer it correctly while 26 answered it correctly? Item difficulty =
  • 8. Thus: number of students with correct answer total number of students Example: What is the item difficulty index of an item if 14 students are unable to answer it correctly while 26 answered it correctly? Item difficulty = 26 / 40 = 0.65 or 65% Item difficulty =
  • 9. To determine the level of difficulty of an item, find first the difficulty index using the formula and identify the level of difficulty using the range given below.
  • 10. One problem with this type of difficulty index is that it may not actually indicate that the item is difficult (or easy). A student who does not know the subject matter will naturally be unable to answer the item correctly even if the question is easy. We are therefore interested in deriving a measure that will tell us whether an item can discriminate between these two groups of students.
  • 11. Discrimination Index  It is the difference between the proportion of the top scorers who got an item correct and the proportion of the lowest scorers who got the item right.
  • 12. An easy way to derive such a measure is to measure how difficult an item is with respect to those in the upper 25% of the class and how difficult it is with respect to those in the lower 25% of the class.
  • 13. Index of discrimination = DU - DL (DU - Upper group; DL – Lower group) Example: Obtain the index of discrimination of an item if the upper 25% of the class had a difficulty index of 0.60 (i.e. 60% of the upper 25% got the correct answer) while the lower 25% of the class had a difficulty index of 0.20. Here, DU = 0.60 while DL = 0.20, thus index of discrimination = 0.60 - 0.20 = 0.40
  • 14. To determine the level of discrimination of an item, find first the discrimination index using the formula and identify the level of it using the range given below.
  • 15. Consider a multiple-choice type of test of which the following data were obtained. A class is composed of 50 students. Use 25% to get the upper and the lower groups. Analyze the item given the following results. Option B is the correct answer. What will you do with the test item? A B C D 0 30 10 10 TOTAL 0 12 1 0 Upper 25% 0 3 6 4 Lower 25%
  • 16. Let us compute for the Difficulty Index and the Discrimination Index
  • 17. number of students with correct answer total number of students Difficulty Index = A B C D 0 30 10 10 TOTAL 0 12 1 0 Upper 25% 0 3 6 4 Lower 25%
  • 18. number of students with correct answer total number of students = 30 / 50 = 0.6 or 60% Interpretation: Right Difficulty Action to be taken: Retain Difficulty Index = A B C D 0 30 10 10 TOTAL 0 12 1 0 Upper 25% 0 3 6 4 Lower 25%
  • 19. Discrimination Index = DU – DL A B C D 0 30 10 10 TOTAL 0 12 1 0 Upper 25% 0 3 6 4 Lower 25% DU = no. of students in upper 25% with correct response no. of students in the upper 25% = = DL = no. of students in lower 25% with correct response no. of students in the lower 25% = = Discrimination Index = DU – DL = = Interpretation: Action to be taken:
  • 20. Discrimination Index = DU – DL A B C D 0 30 10 10 TOTAL 0 12 1 0 Upper 25% 0 3 6 4 Lower 25% DU = no. of students in upper 25% with correct response no. of students in the upper 25% = 12 / 13 = 0.92 or 92% DL = no. of students in lower 25% with correct response no. of students in the lower 25% = 3 / 13 = 0.23 or 23% Discrimination Index = DU – DL = 0.92 – 0.23 = 0.69 or 69% Interpretation: Discriminating Item Action to be taken: Include or Retain
  • 21. Validity - the extent to which a test measures what it is intended to be measured. Reliability - the consistency of the scores obtained – how consistent they are for each individual from one administration of an instrument to another and from one set of items to another.
  • 22. A valid test is always reliable, but a reliable test is not always valid.
  • 23. A valid test is always reliable, but a reliable test is not always valid. In other words, if a test is measuring what it is supposed to measure, it will be reliable, but a reliable test can consistently measure the “wrong” thing, thus making it invalid.

Editor's Notes

  1. Let say we have 45 test takers, compute for the upper and lower 25%.
  2. Positivediscriminationhappenswhenmorestudentsintheuppegroupgotthe item correctly than those students in the lower group. Negativediscriminationoccurswhenmorestudentsinthelowergroupgotthe item correctly than the students in the upper group. Zero discrimination happens when a number of students in the upper group and lower who answer the test correctly are equal, hence, the test item cannot distinguish the students who performed in the overall test and the students whose performance are very poor.