Download to read offline


![Human resources in science and technology 4
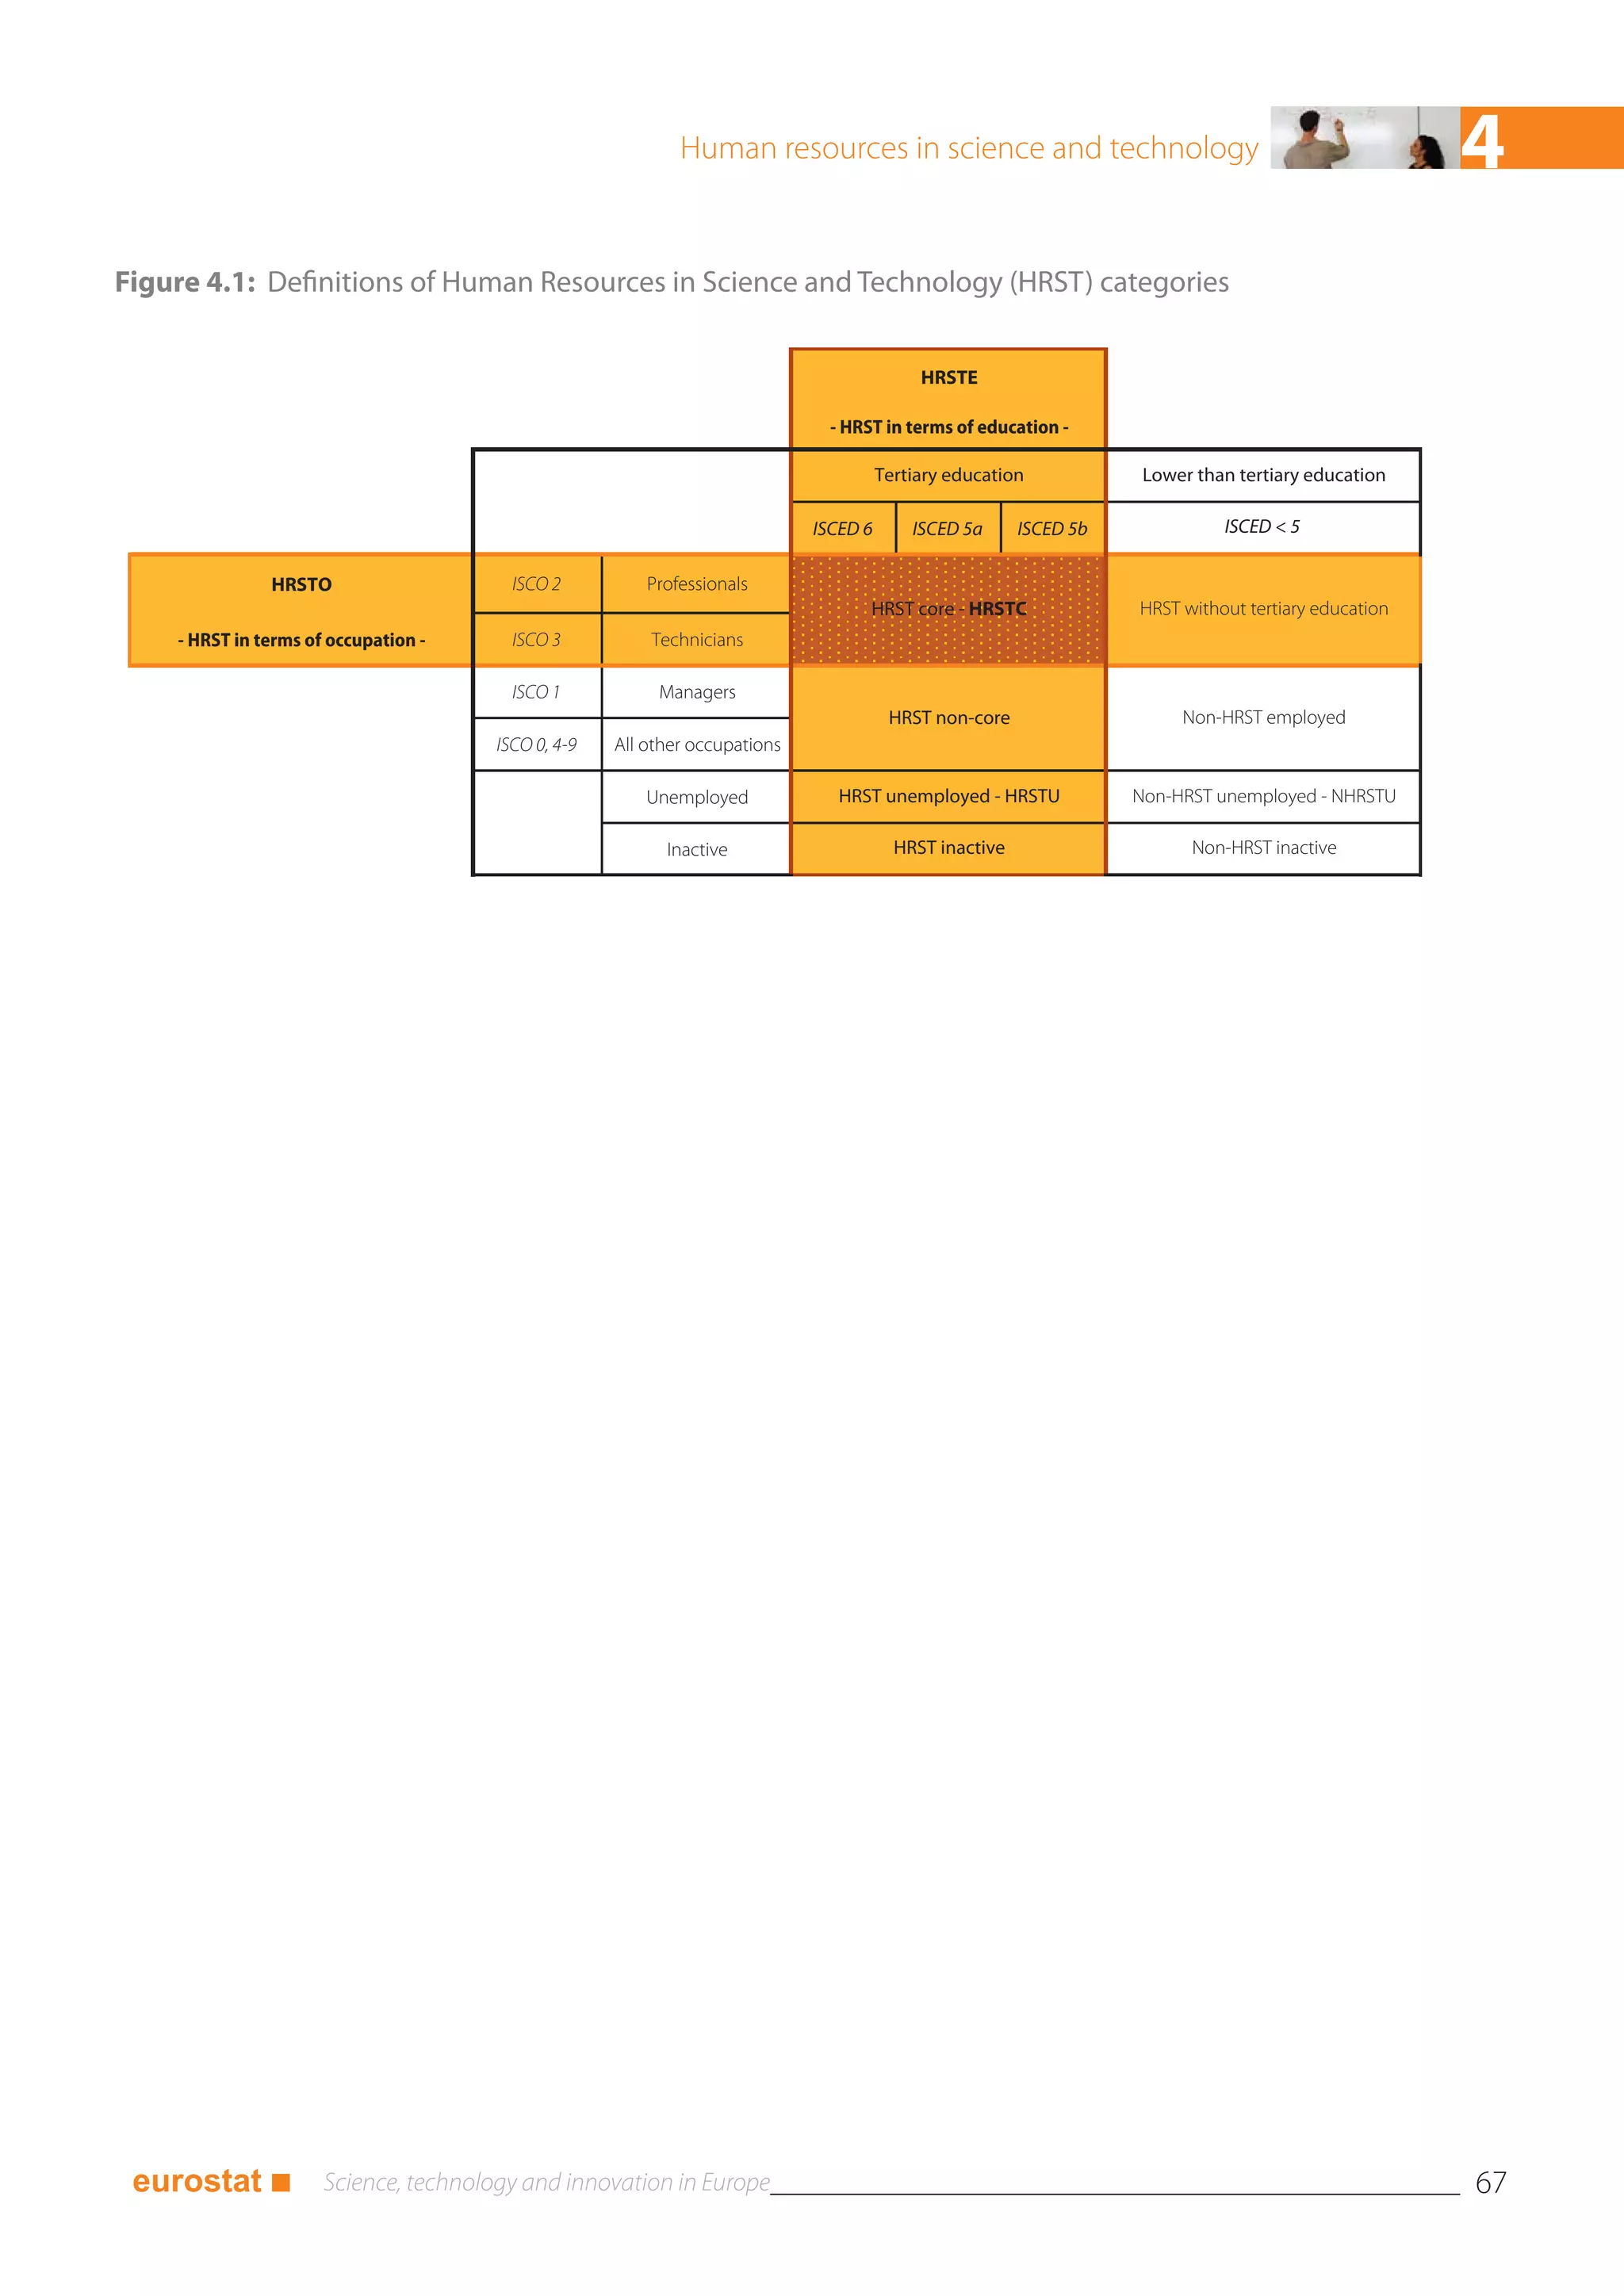
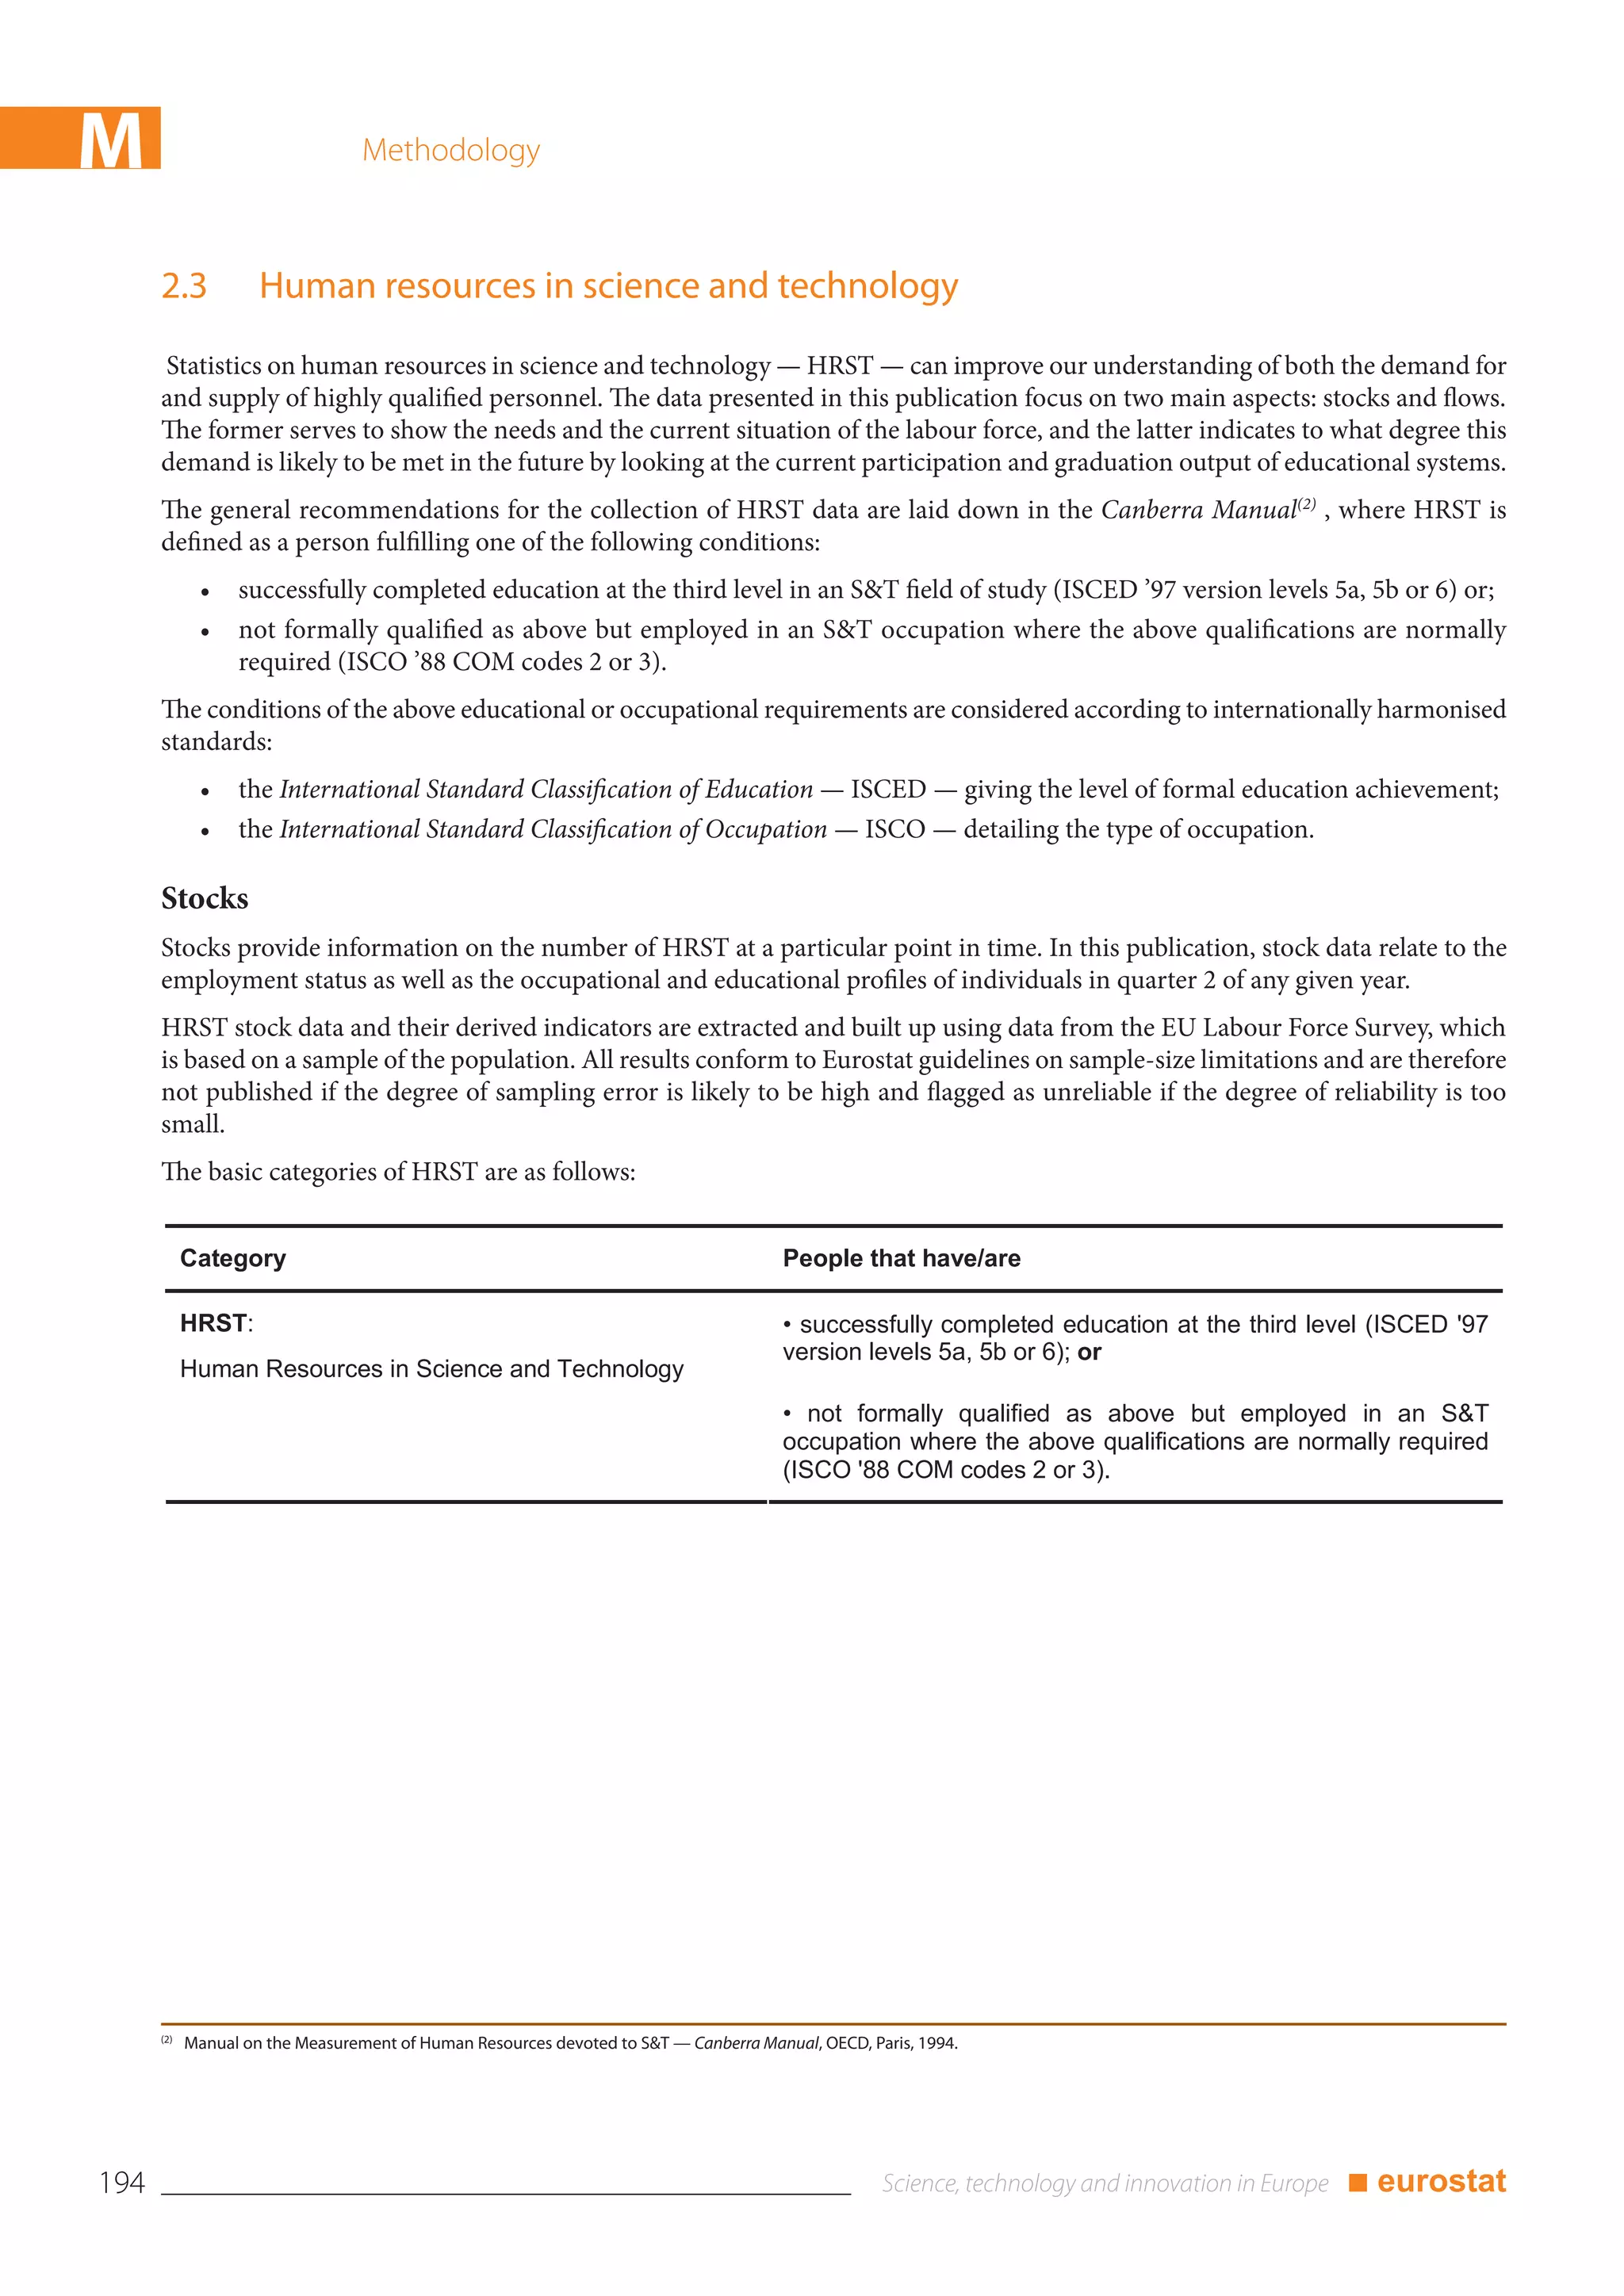
4.3 Stocks of human resources in science and technology
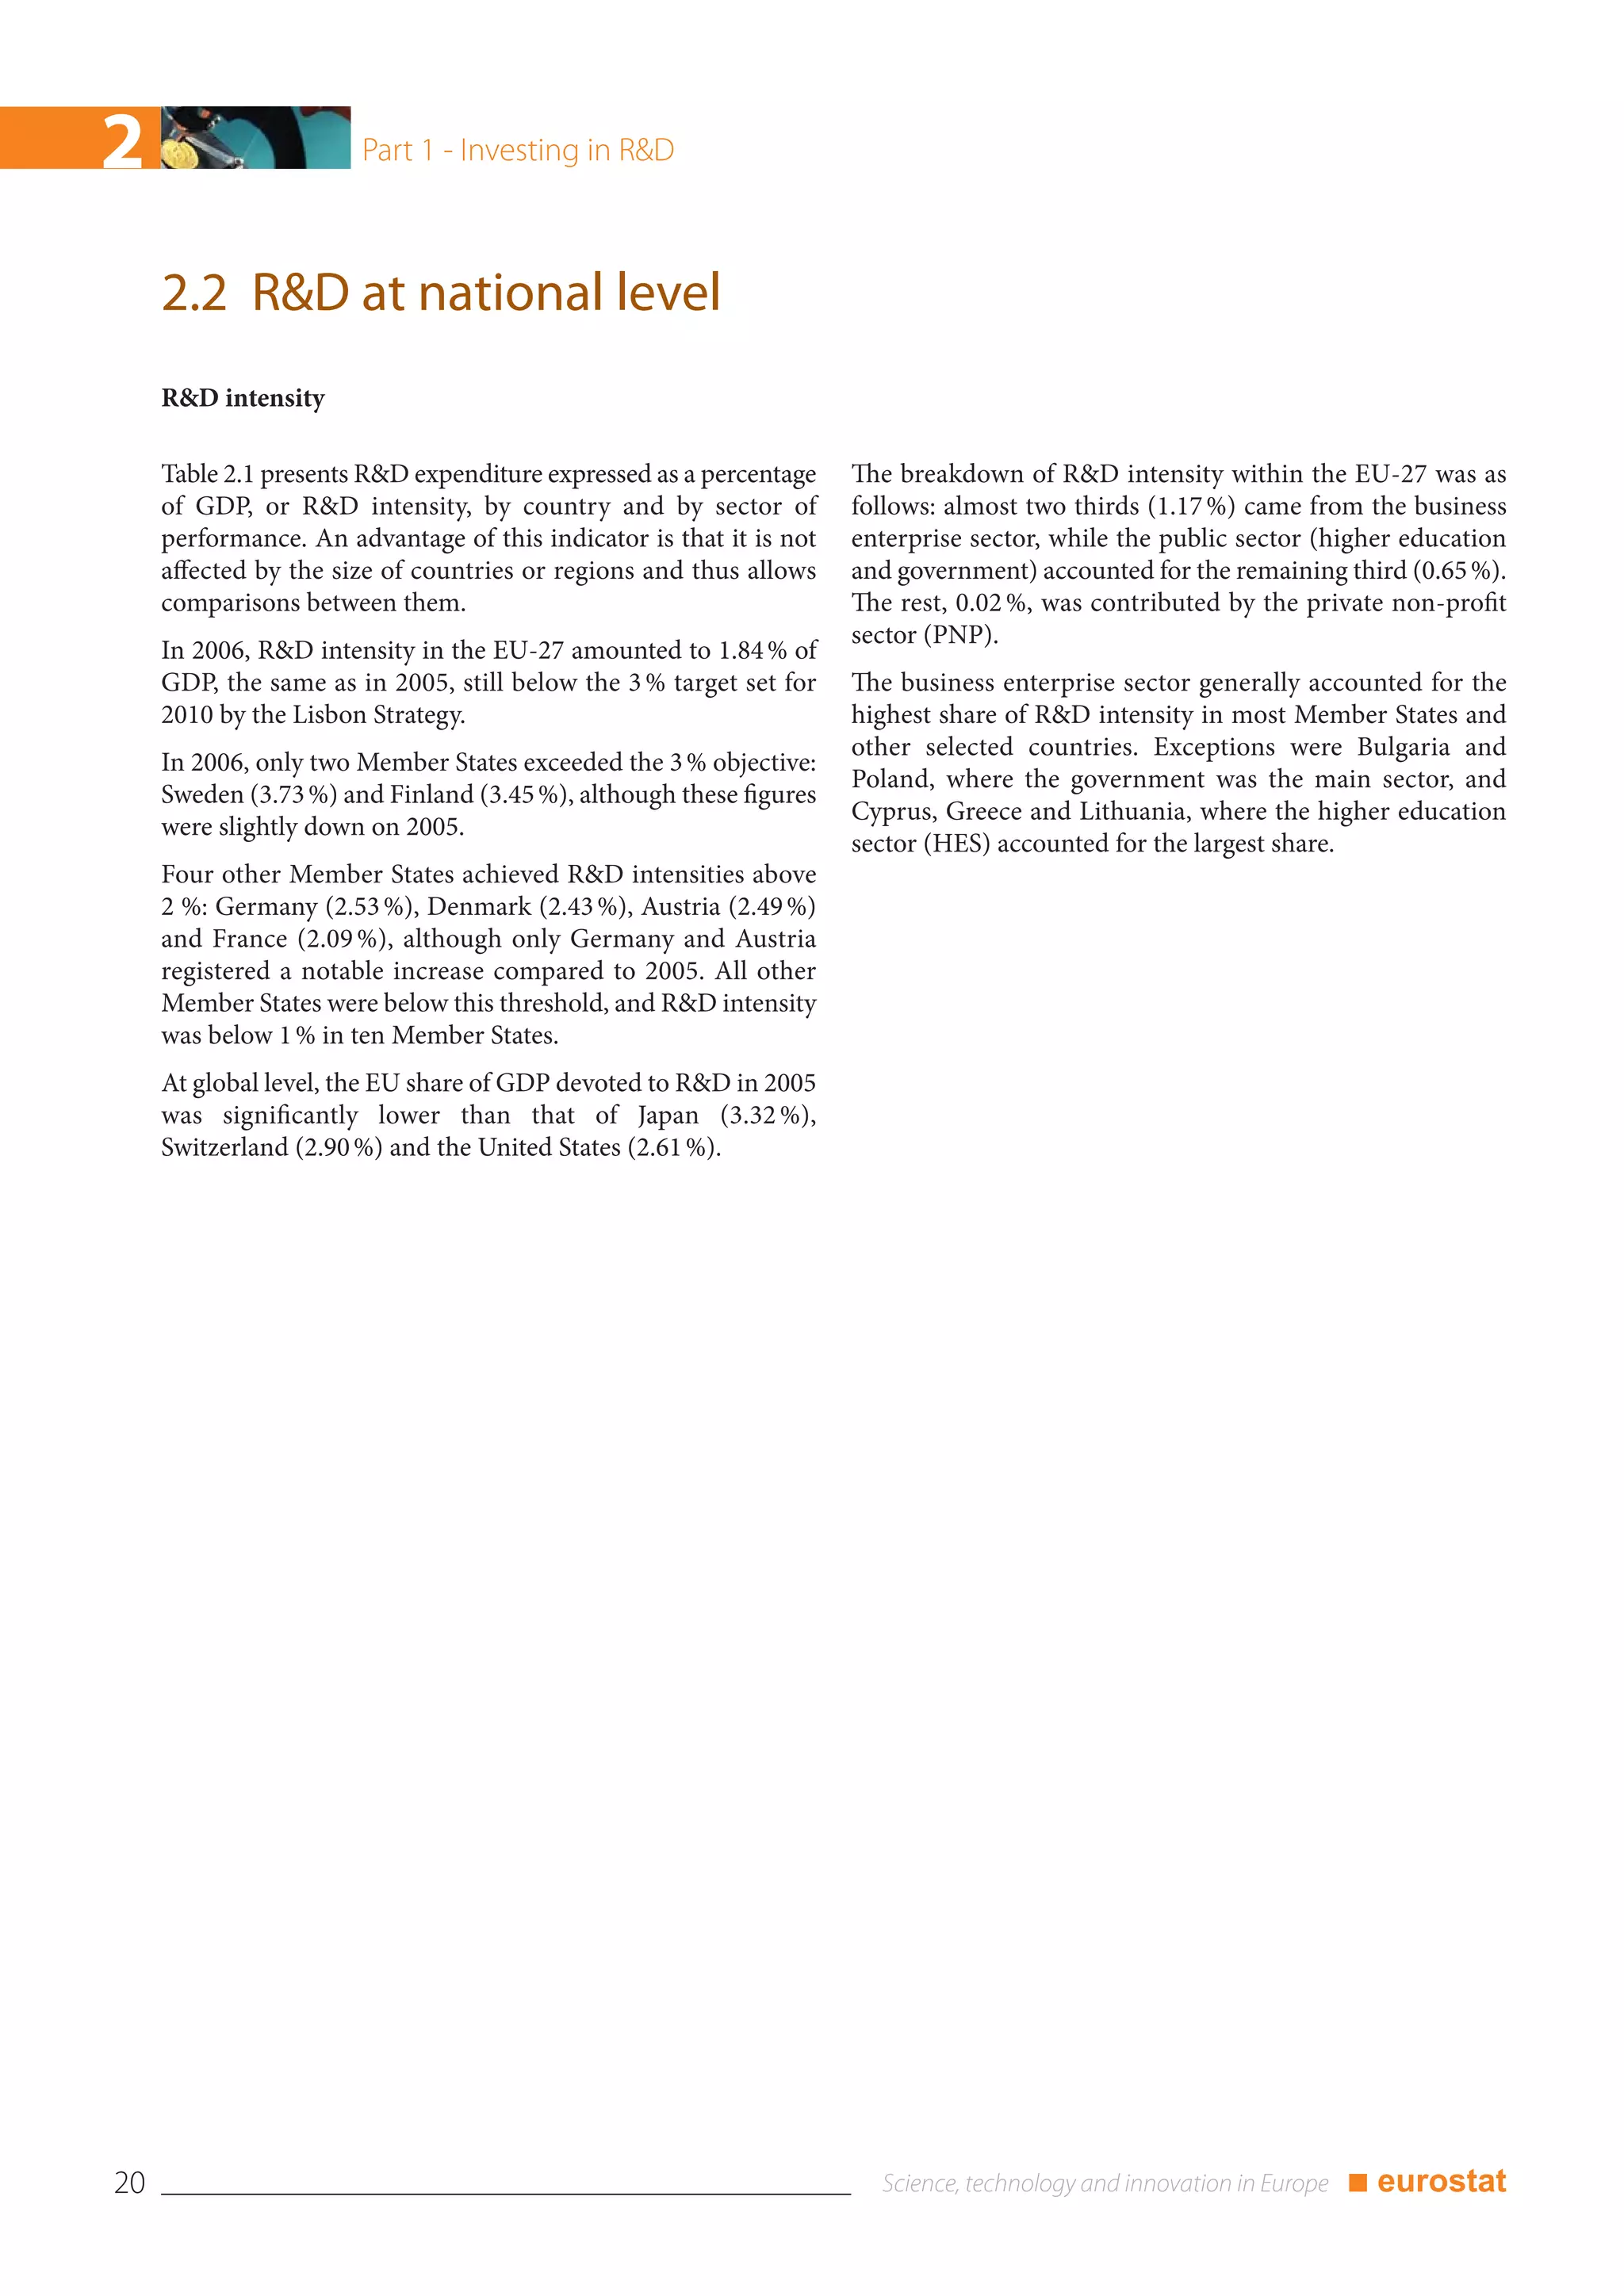
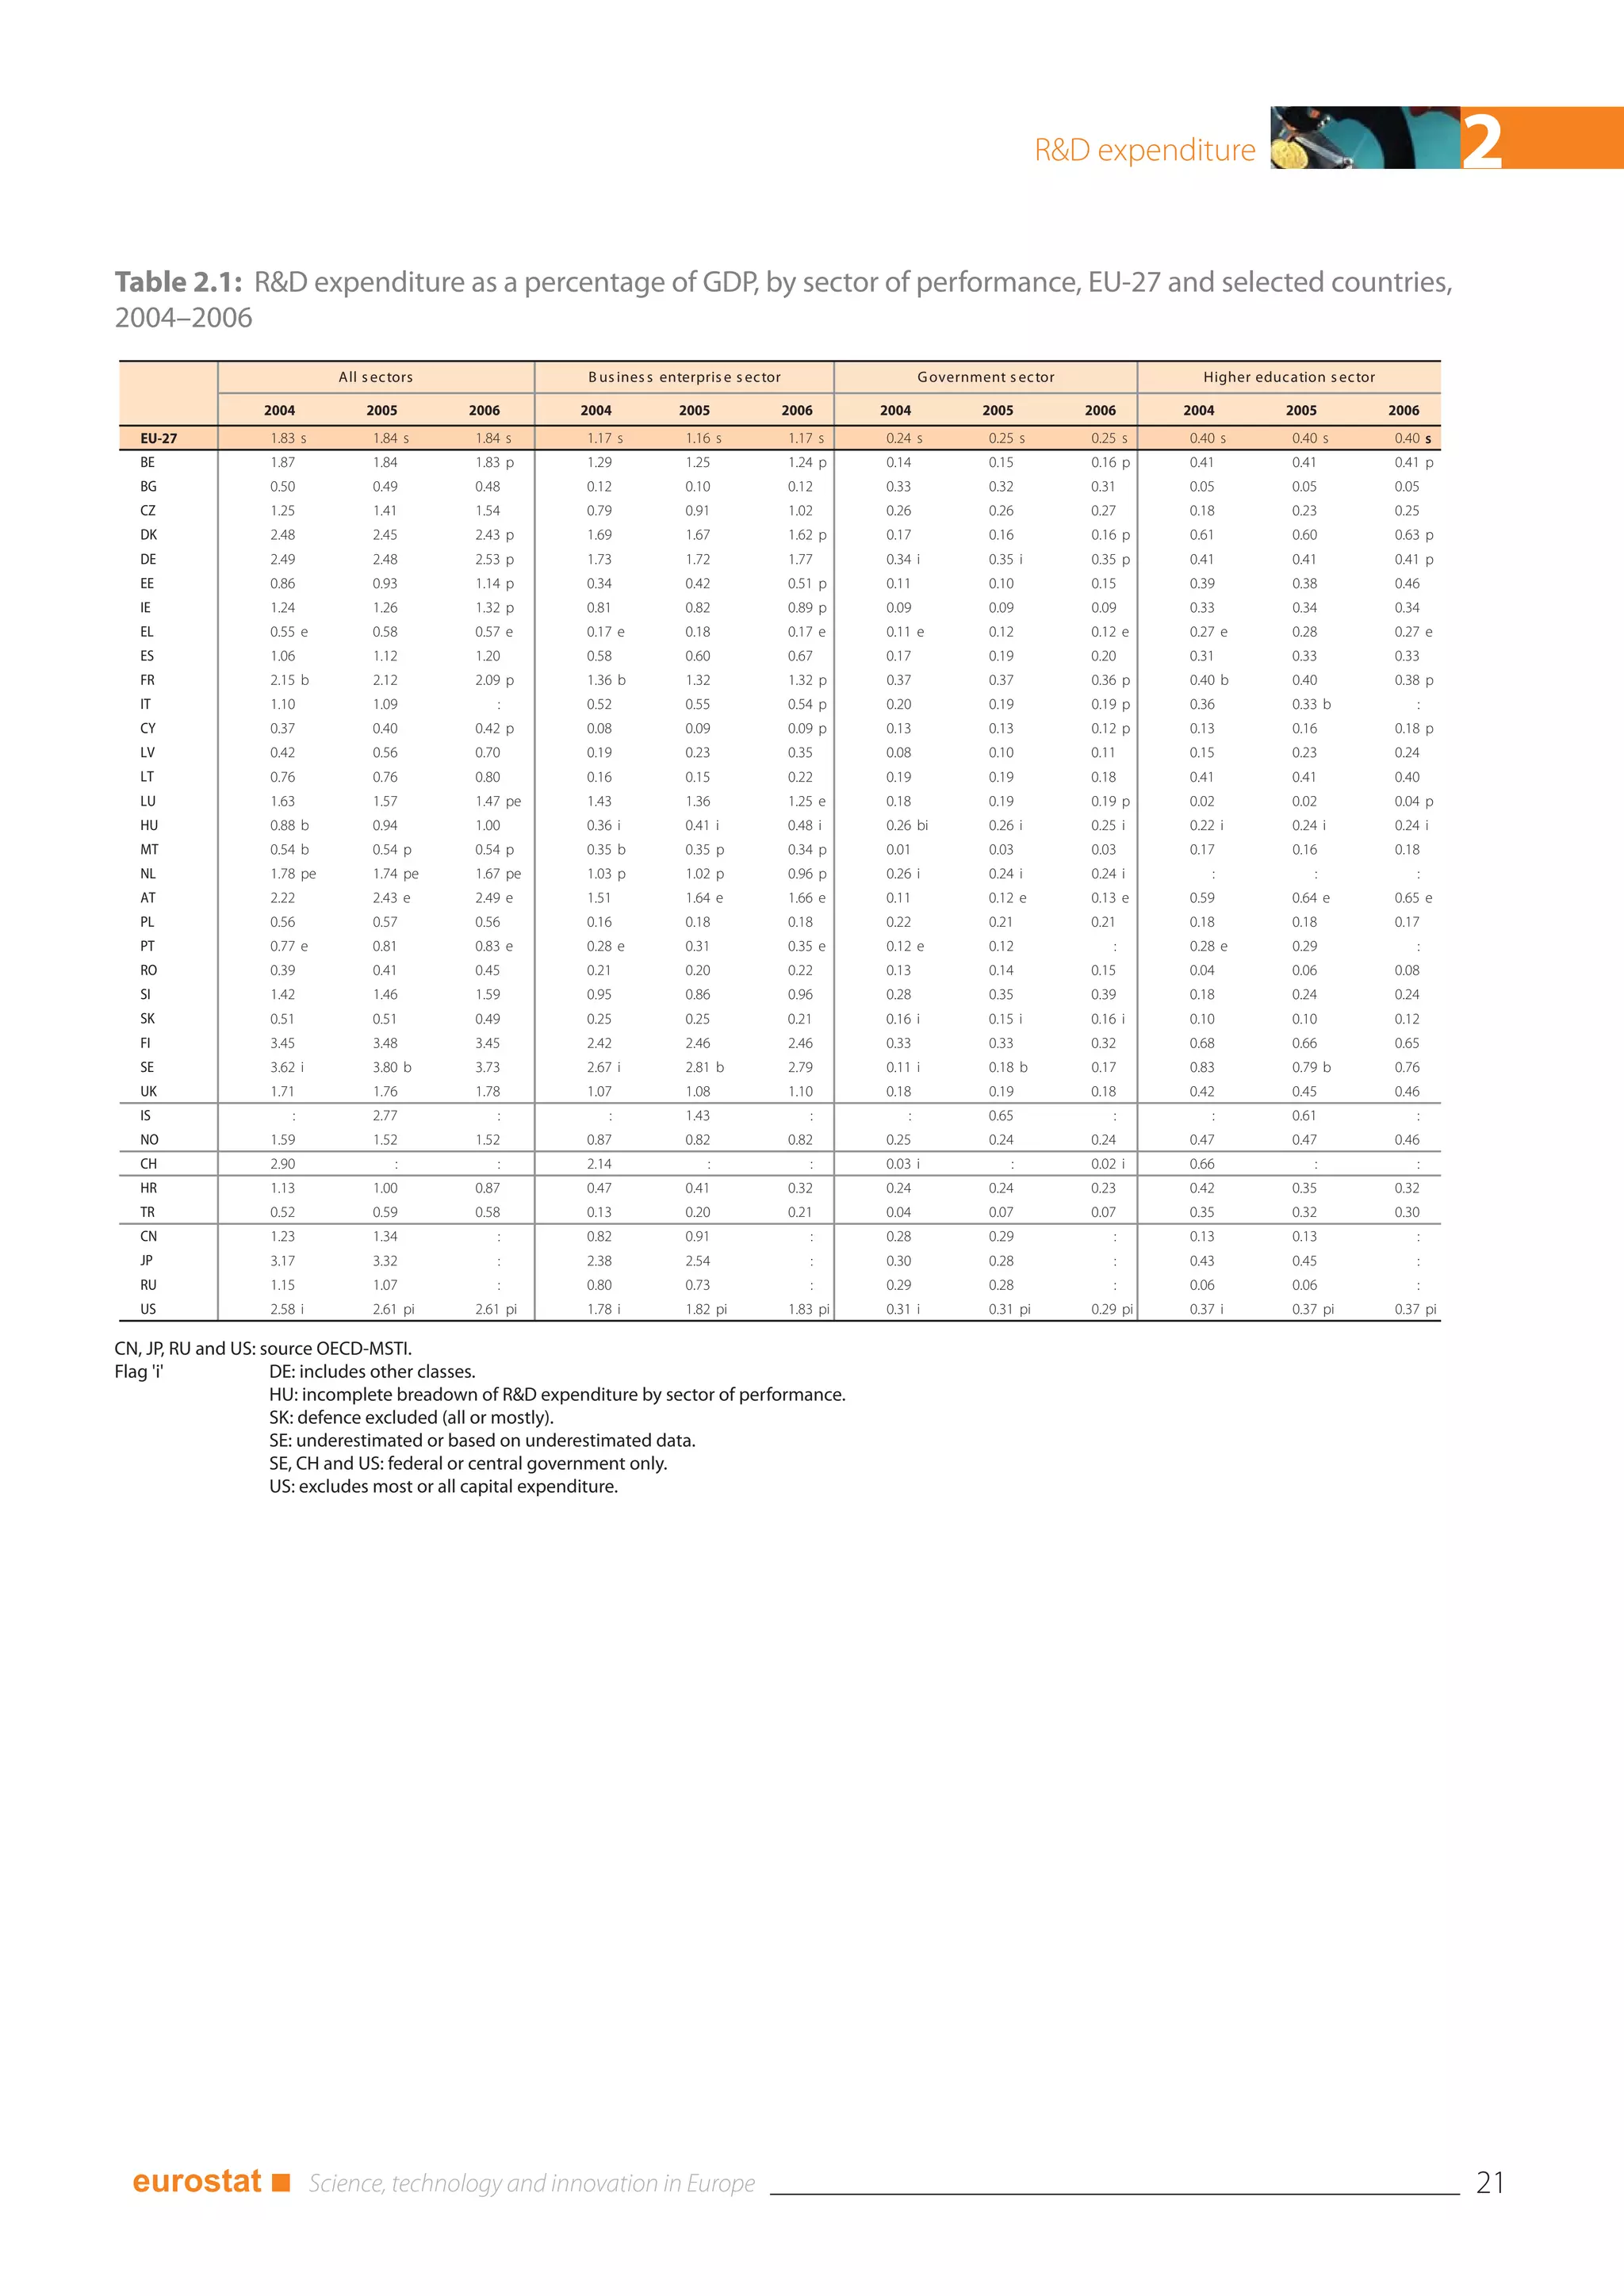
Human resources, especially in science and technology, are a requires the evaluation of existing HRST stocks, notably for
key ingredient of competitiveness and economic labour market analyses in the EU Member States.
development. Potential users of HRST data include
The measurement of HRST stocks and of the various sub-
policymakers and analysts in government departments and
categories — ‘HRST in terms of occupation’ (HRSTO), ‘HRST
related agencies, the private sector and academics.
in terms of education’ (HRSTE), ‘HRST core’ (HRSTC) and
Building on the analysis of the supply of human resources in ‘scientists and engineers’ (SE) — provides broad indicators on
science and technology in the form of tertiary education the stock of knowledge workers in European countries.
inflows, this section takes a closer look at demand for HRST.
Forecasting demand is recognised as a difficult exercise which
HRST stocks at national level
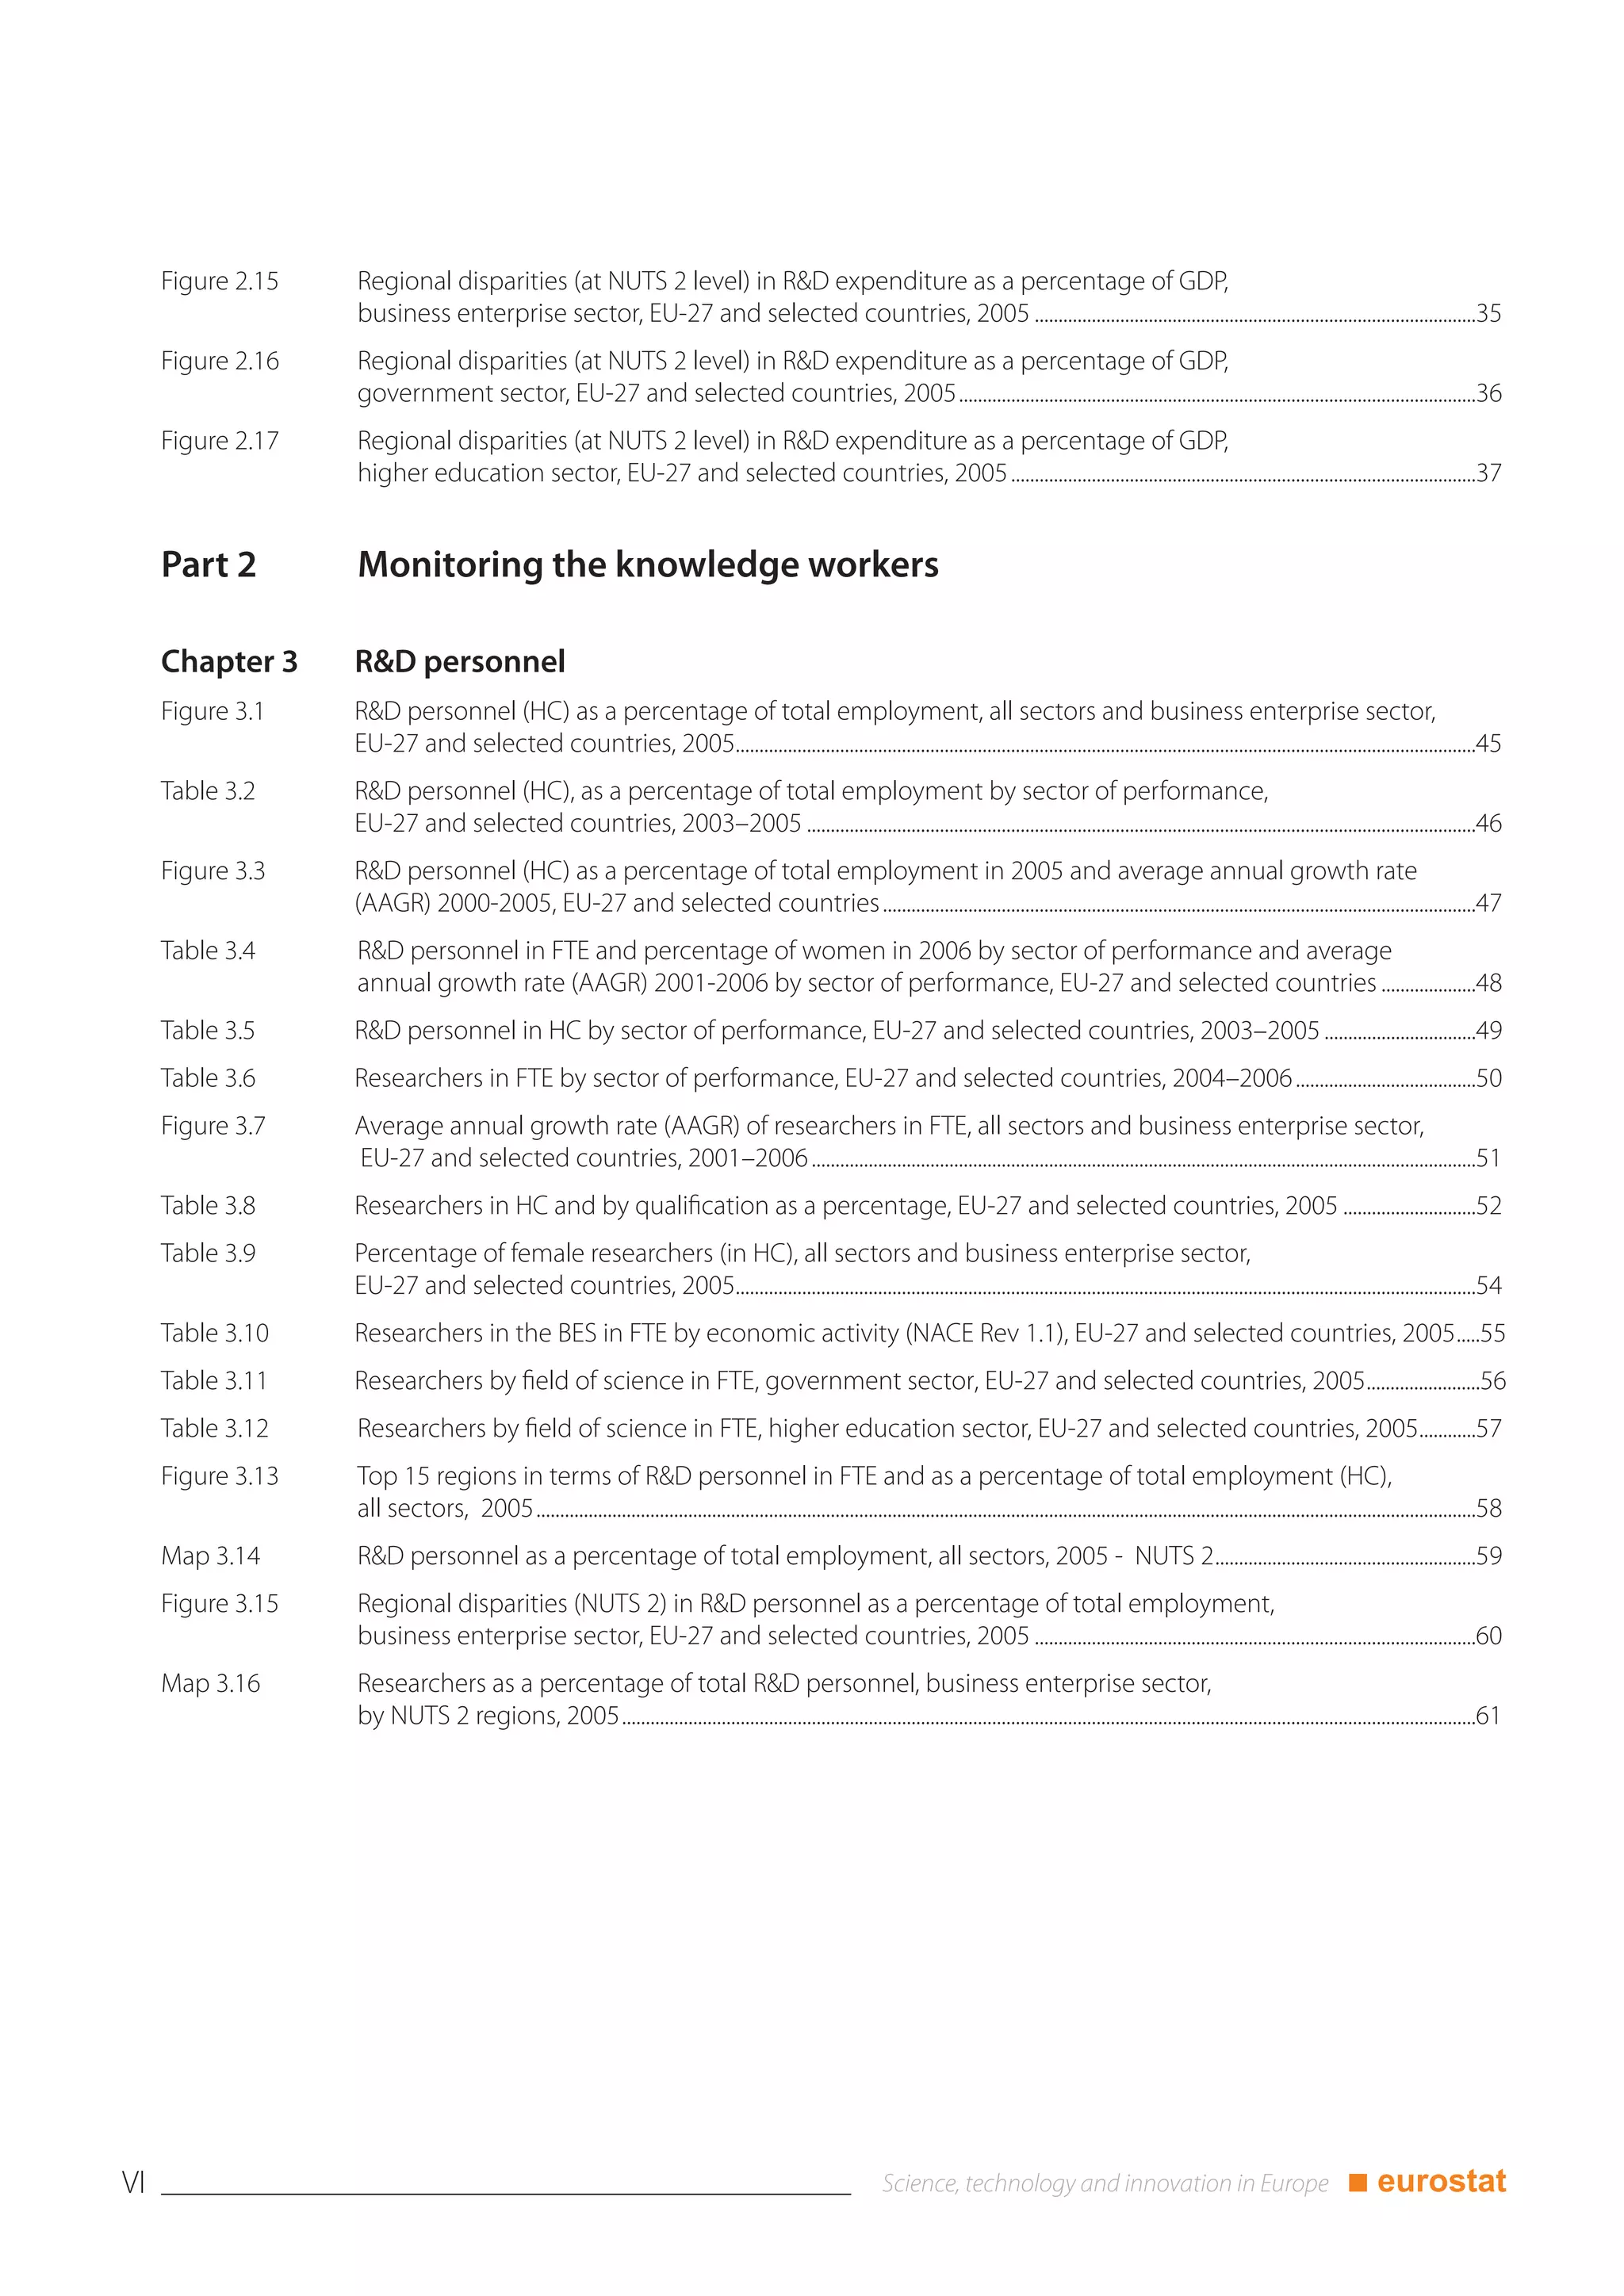
HRST stocks can be measured at many levels. Policymakers, with 62.8 %. The two other Baltic countries, Estonia and
for instance, are usually interested in national stocks. Latvia, followed close behind, each with shares over 60 %.
Conversely, this figure was only 40.9 % in Malta.
Table 4.10 shows the various sub-categories of HRST stocks in
2006 and the average growth in HRST over time. In the EU, Considering trends in HRST stocks in the EU, most EU
more than 85.4 million people were considered HRST in Member States saw their HRST population grow between
2006, of which half were concentrated in only three countries. 2001 and 2006. Ireland together with Portugal achieved the
Germany, with more than 16 million HRST, and the United highest growth rates in male HRST stocks and the strongest
Kingdom and France, with more than 11 million each, growth in female HRST (6.5 % and 8.6 % respectively). At EU
accounted for the largest HRST populations in 2006. level, the average growth rate for human resources in S&T was
2.7 % for men and 4.1 % for women. Bulgaria was a notable
A more detailed analysis of HRST sub-categories reveals that
exception as it saw a decrease in HRST both for men (-1.4 %)
in the EU-27 more than 40 % of HRST were both educated to
and women (-0.7 %). Outside the EU, a decrease in the
tertiary level and employed in S&T (HRSTC). The rest of the
number of male HRST was also observed in Norway over the
HRST population was split between persons possessing a
same period.
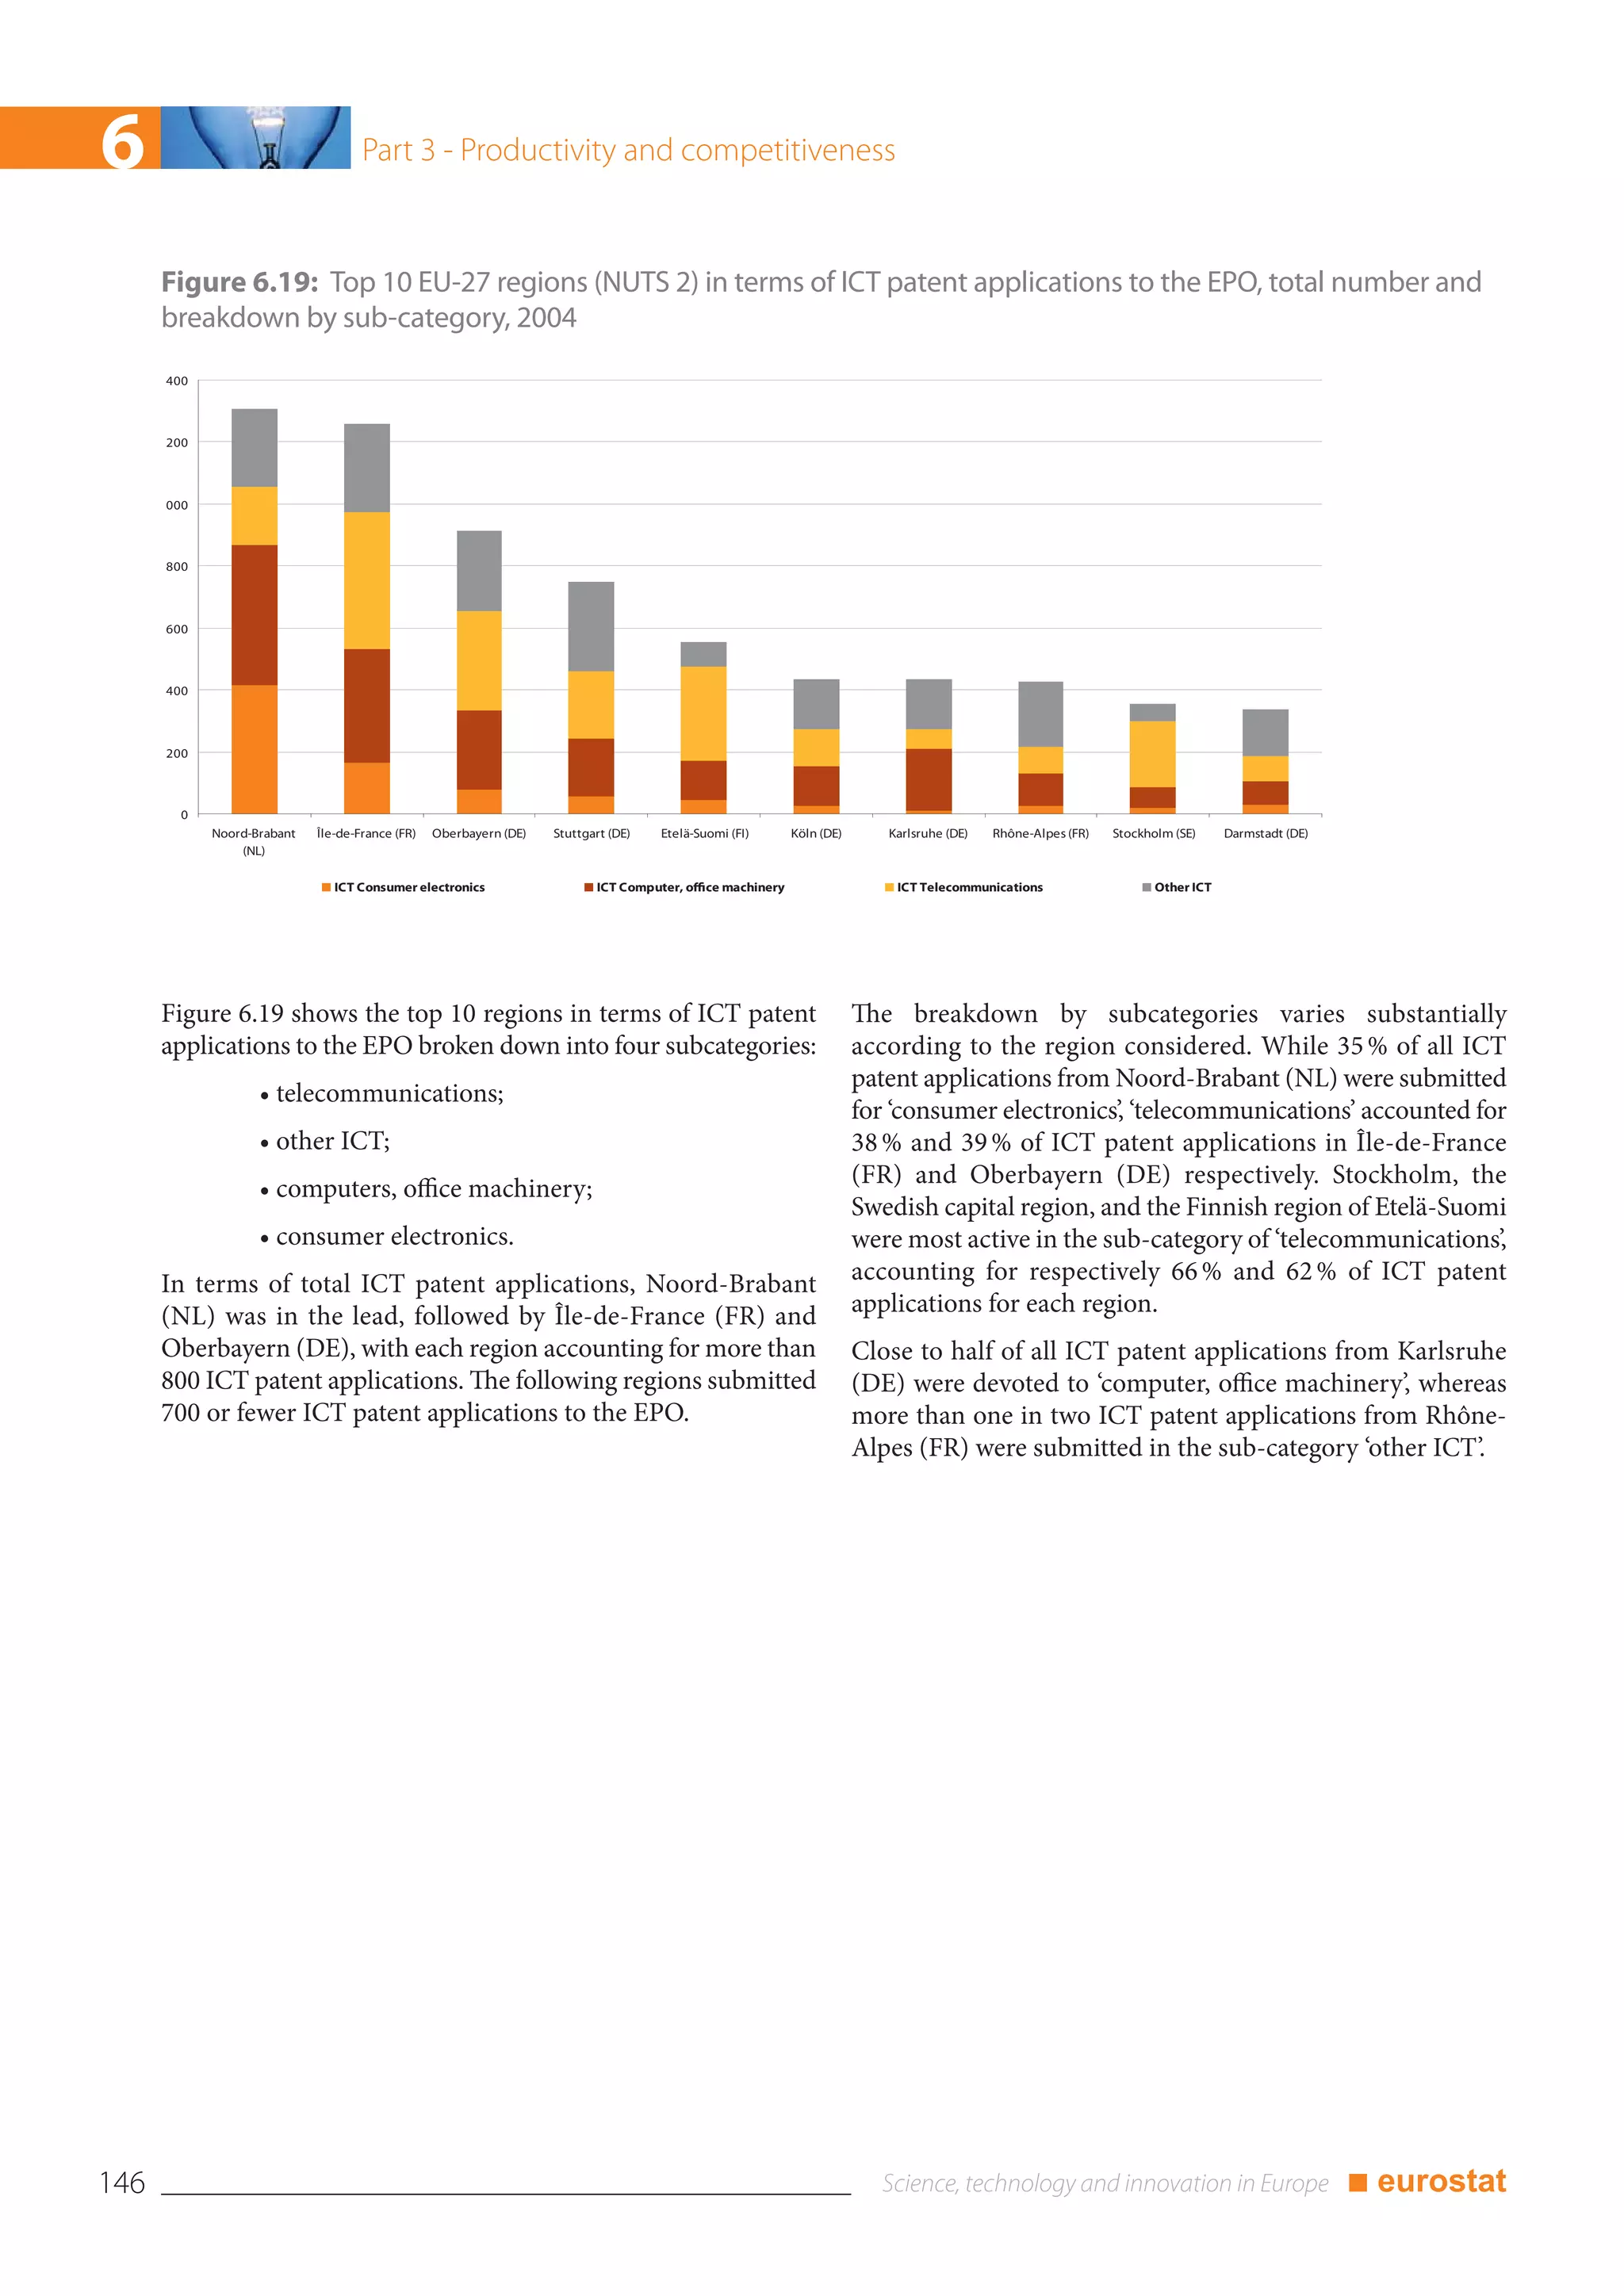
tertiary qualification but not working in S&T (31.1 %) and
those employed in S&T without having a higher education Growth in HRST stocks was stronger among women in more
degree (28.6 %). than three quarters of the EU Member States. This could be
due to the efforts made by many EU Member States to
On the gender issue, the number of women in HRST in 2006
introduce positive action and measures to support women in
was generally in balance with their male counterparts in most
science and engineering and promote gender equality.
EU Member States plus Iceland and Norway. Within the EU,
Lithuania reported the highest proportion of female HRST,
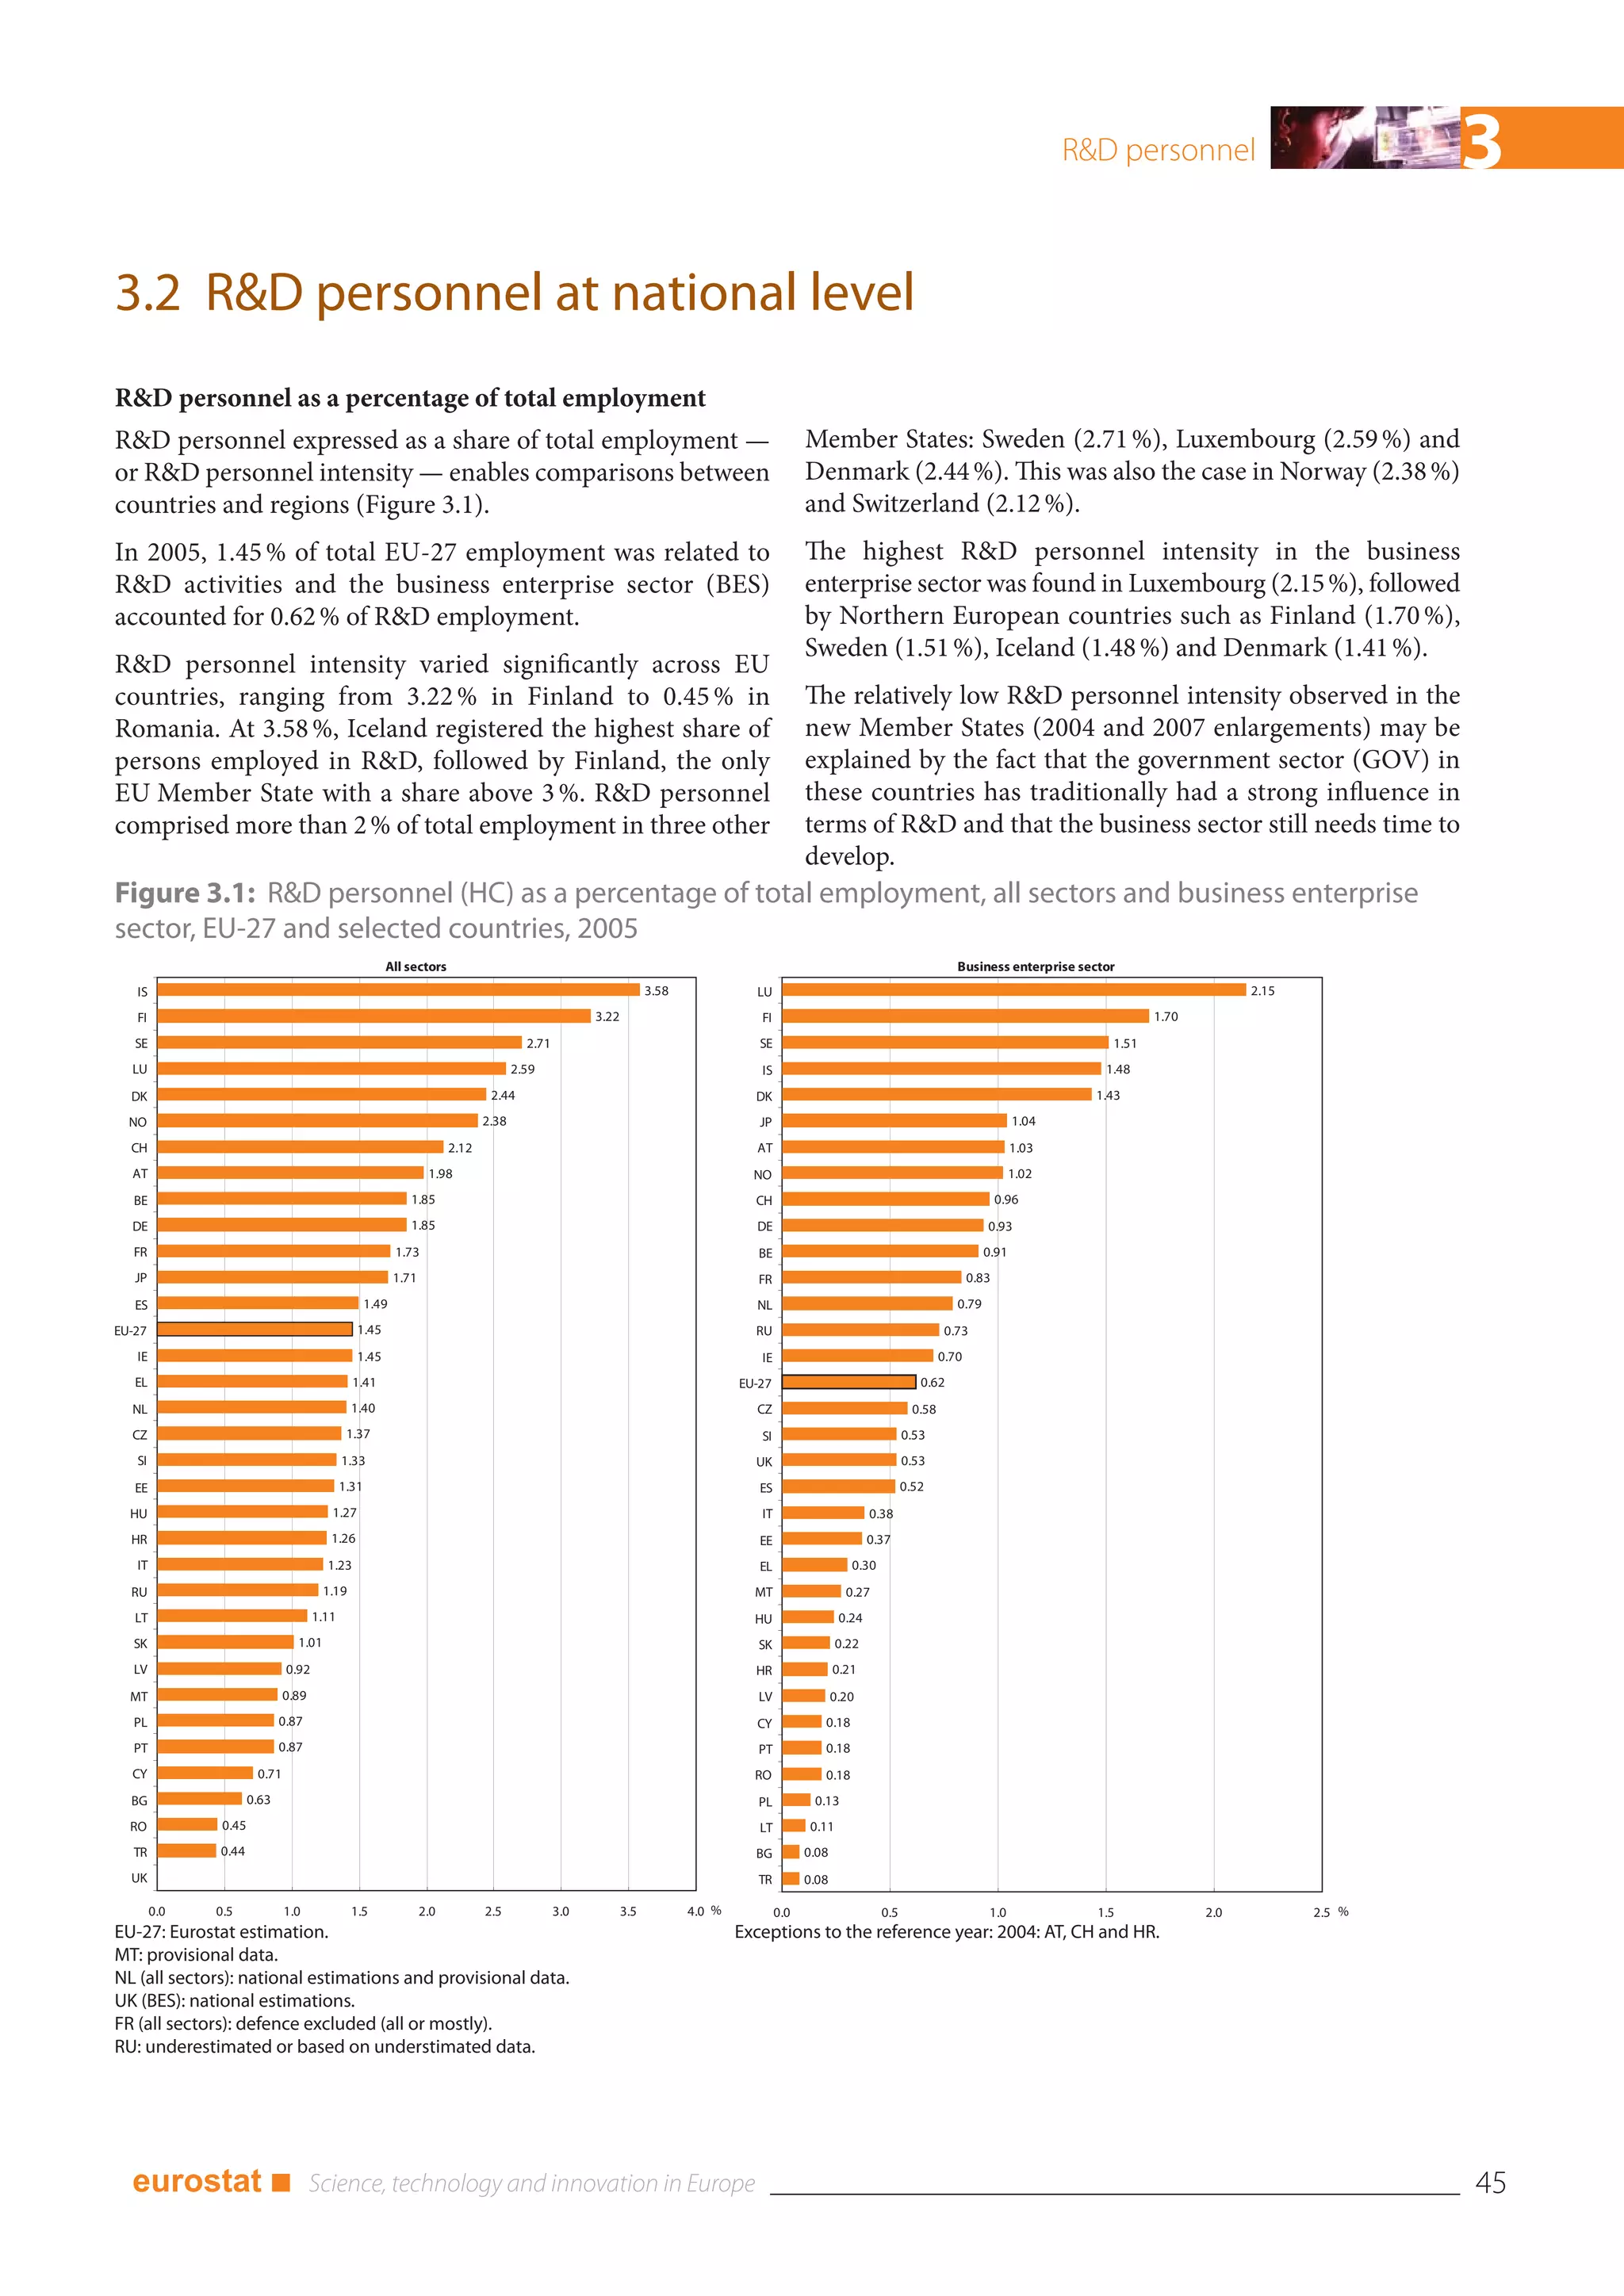
Mind the gap
Pay discrimination between male and female scientists
[…] Discrimination against female scientists has cropped up elsewhere. One study — conducted in Sweden, of all places — showed
that female medical-research scientists had to be twice as good as men to win research grants. These pieces of work, though, were
relatively small-scale. Now, a much larger study has found that discrimination plays a role in the pay gap between male and female
scientists at British universities.
Sara Connolly, a researcher at the University of East Anglia’s School of Economics, […] has been analysing the results of a survey of
over 7 000 scientists and she has just presented her findings at this year’s meeting of the British Association for the Advancement
of Science in Norwich. She found that the average pay gap between male and female academics working in science, engineering
and technology is around £1 500 ($2 850) a year.
That is not, of course, irrefutable proof of discrimination. An alternative hypothesis is that the courses of men’s and women’s lives
mean the gap is caused by something else; women taking ‘career breaks’ to have children, for example, and thus rising more slowly
through the hierarchy. Unfortunately for that idea, Dr Connolly found that men are also likely to earn more within any given grade
of the hierarchy. Male professors, for example, earn over £4 000 a year more than female ones. […]
Source: The Economist, 7 September 2006 - http://www.economist.com/science/displaystory.cfm?story_id=7880036
eurostat ■ 77](https://image.slidesharecdn.com/2009-09eurostatid27em-09-09-en-100113065936-phpapp01/75/2009-09-E-U-R-O-S-T-A-T-I-D-27-E-M-09-09-E-N-104-2048.jpg)


![4 Part 2 - Monitoring the knowledge workers
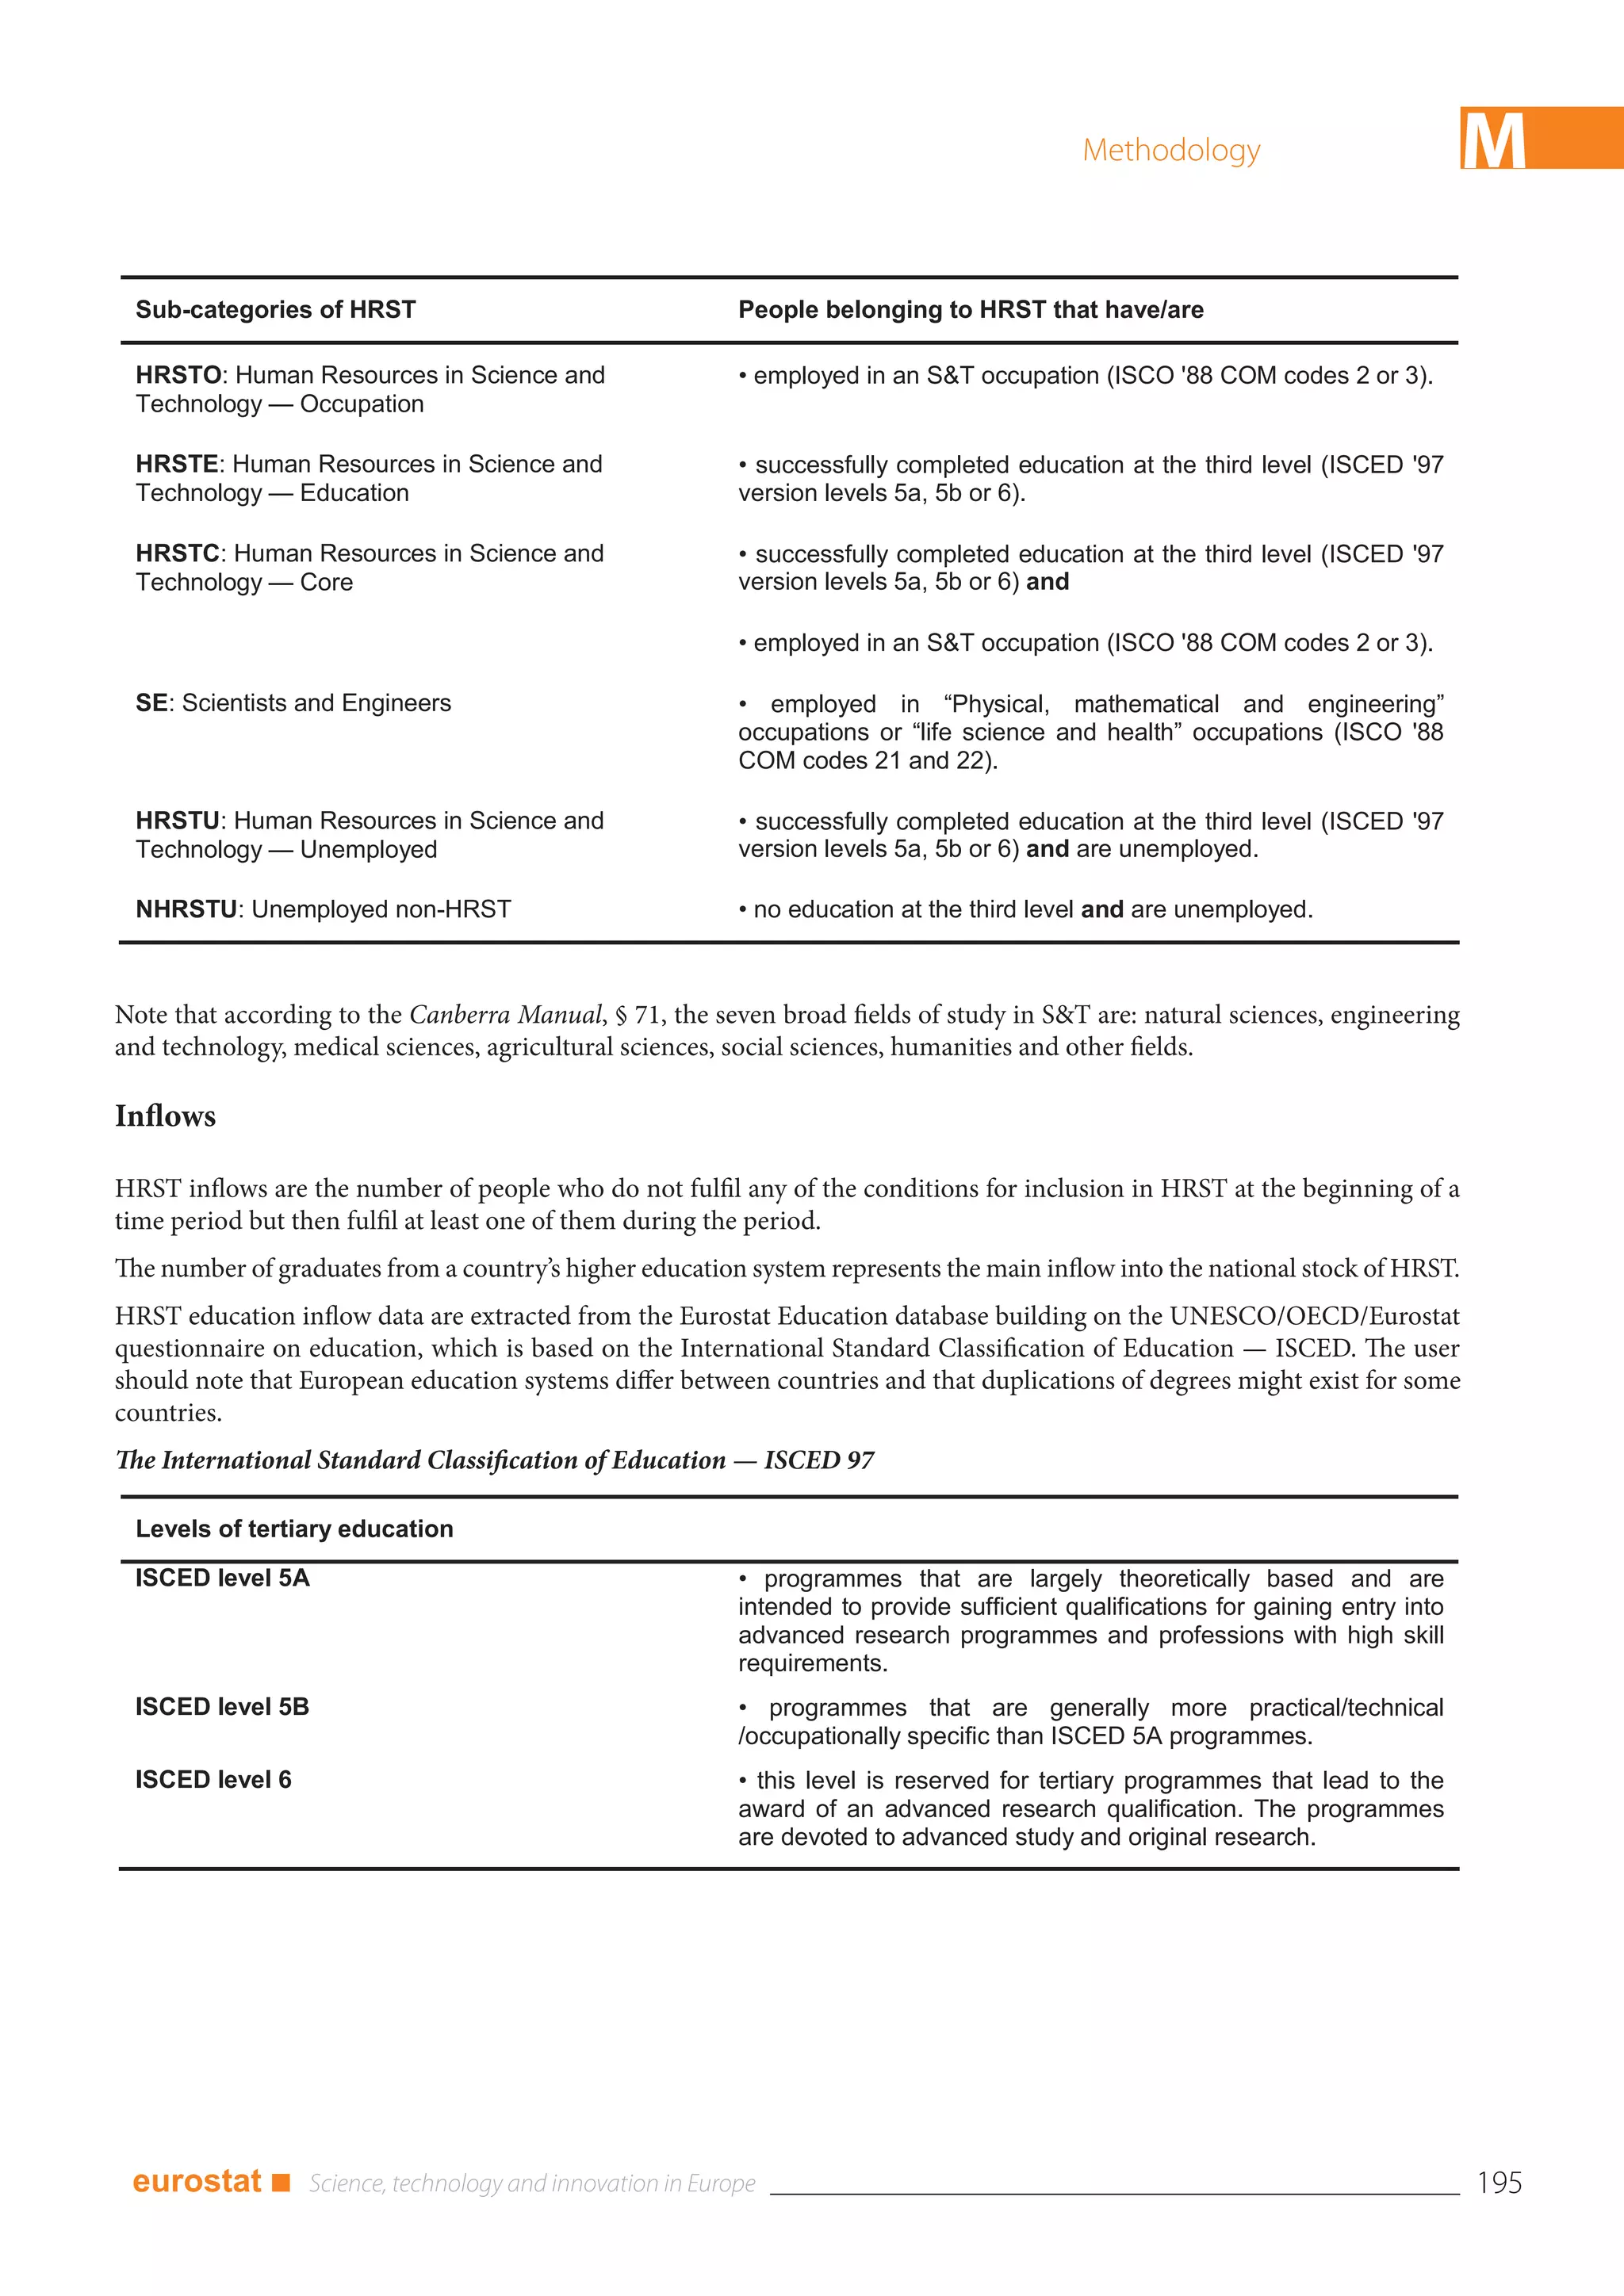
4.5 International mobility
Science for Export
Brain-drain of highly qualified individuals in Poland
‘The post-accession wave of emigration from Poland has included scientific researchers, yet a lack of statistics makes it hard to tell
just how many of them have left, or ultimately for how long. However, the scale of the phenomenon can be gauged via qualitative
studies focusing on the nature of researchers’ mobility.
As one of the central planks of the European Research Area concept, greater mobility was intended to boost the scientific potential
of the EU – which according to the European Commission requires ‘more abundant and more mobile human resources in science.’
The Commission has on the one hand concentrated on overcoming administrative and legal obstacles to researchers’ mobility
(such as by issuing the European Researchers’ Charter) and on the other launched large-scale programmes directly assisting mobility
(such as the Marie Curie programme, mobility portals and the ERA-MORE network of mobility centres).’
‘International researcher mobility is a phenomenon that starts with short, one-day or even several-hour visits paid to foreign research
establishments, and scaling up through […] several-month grants, it can lead to several-year stays and even contracts to stay abroad
permanently.’
‘The issue that concerns the general public most is whether researchers will return to their home country. According to a
questionnaire-based study, 26 % of Polish researchers currently residing in Germany and 34 % in the United Kingdom reported that
they desired or strongly desired to return and obtain research positions in Poland. A desire to remain abroad, in turn, was reported
by 27 % of Polish researchers in Germany and 14 % in the United Kingdom. It is noteworthy that the largest segment of both groups
remains undecided, responding ‘I don’t know’ when asked about their plans to return to Poland. Only a small group of those who
have gone abroad are specifically planning never to return, and so there is great potential for policies to encourage researchers to
return to Poland.
Polish researchers vary somewhat in terms of their overall plans for further mobility: 60 % of those abroad v. 54 % of those working
in Poland plan future moves for research purposes, with the most frequently mentioned target countries being the UK, the USA and
Germany. On the other hand, it is interesting that as many as one in four Polish researchers who have already worked abroad state
that they were definitely not planning any more such moves. Such mobility plans were are also correlated to researchers’ type of
employment, age and degree of professional advancement.’
Source: A. Kicinger, Academia, Research in Progress Demography, Researchers’ mobility in the enlarging EU, Central European Forum for
Migration Research, Warsaw, www.cefmr.pan.pl, 2007
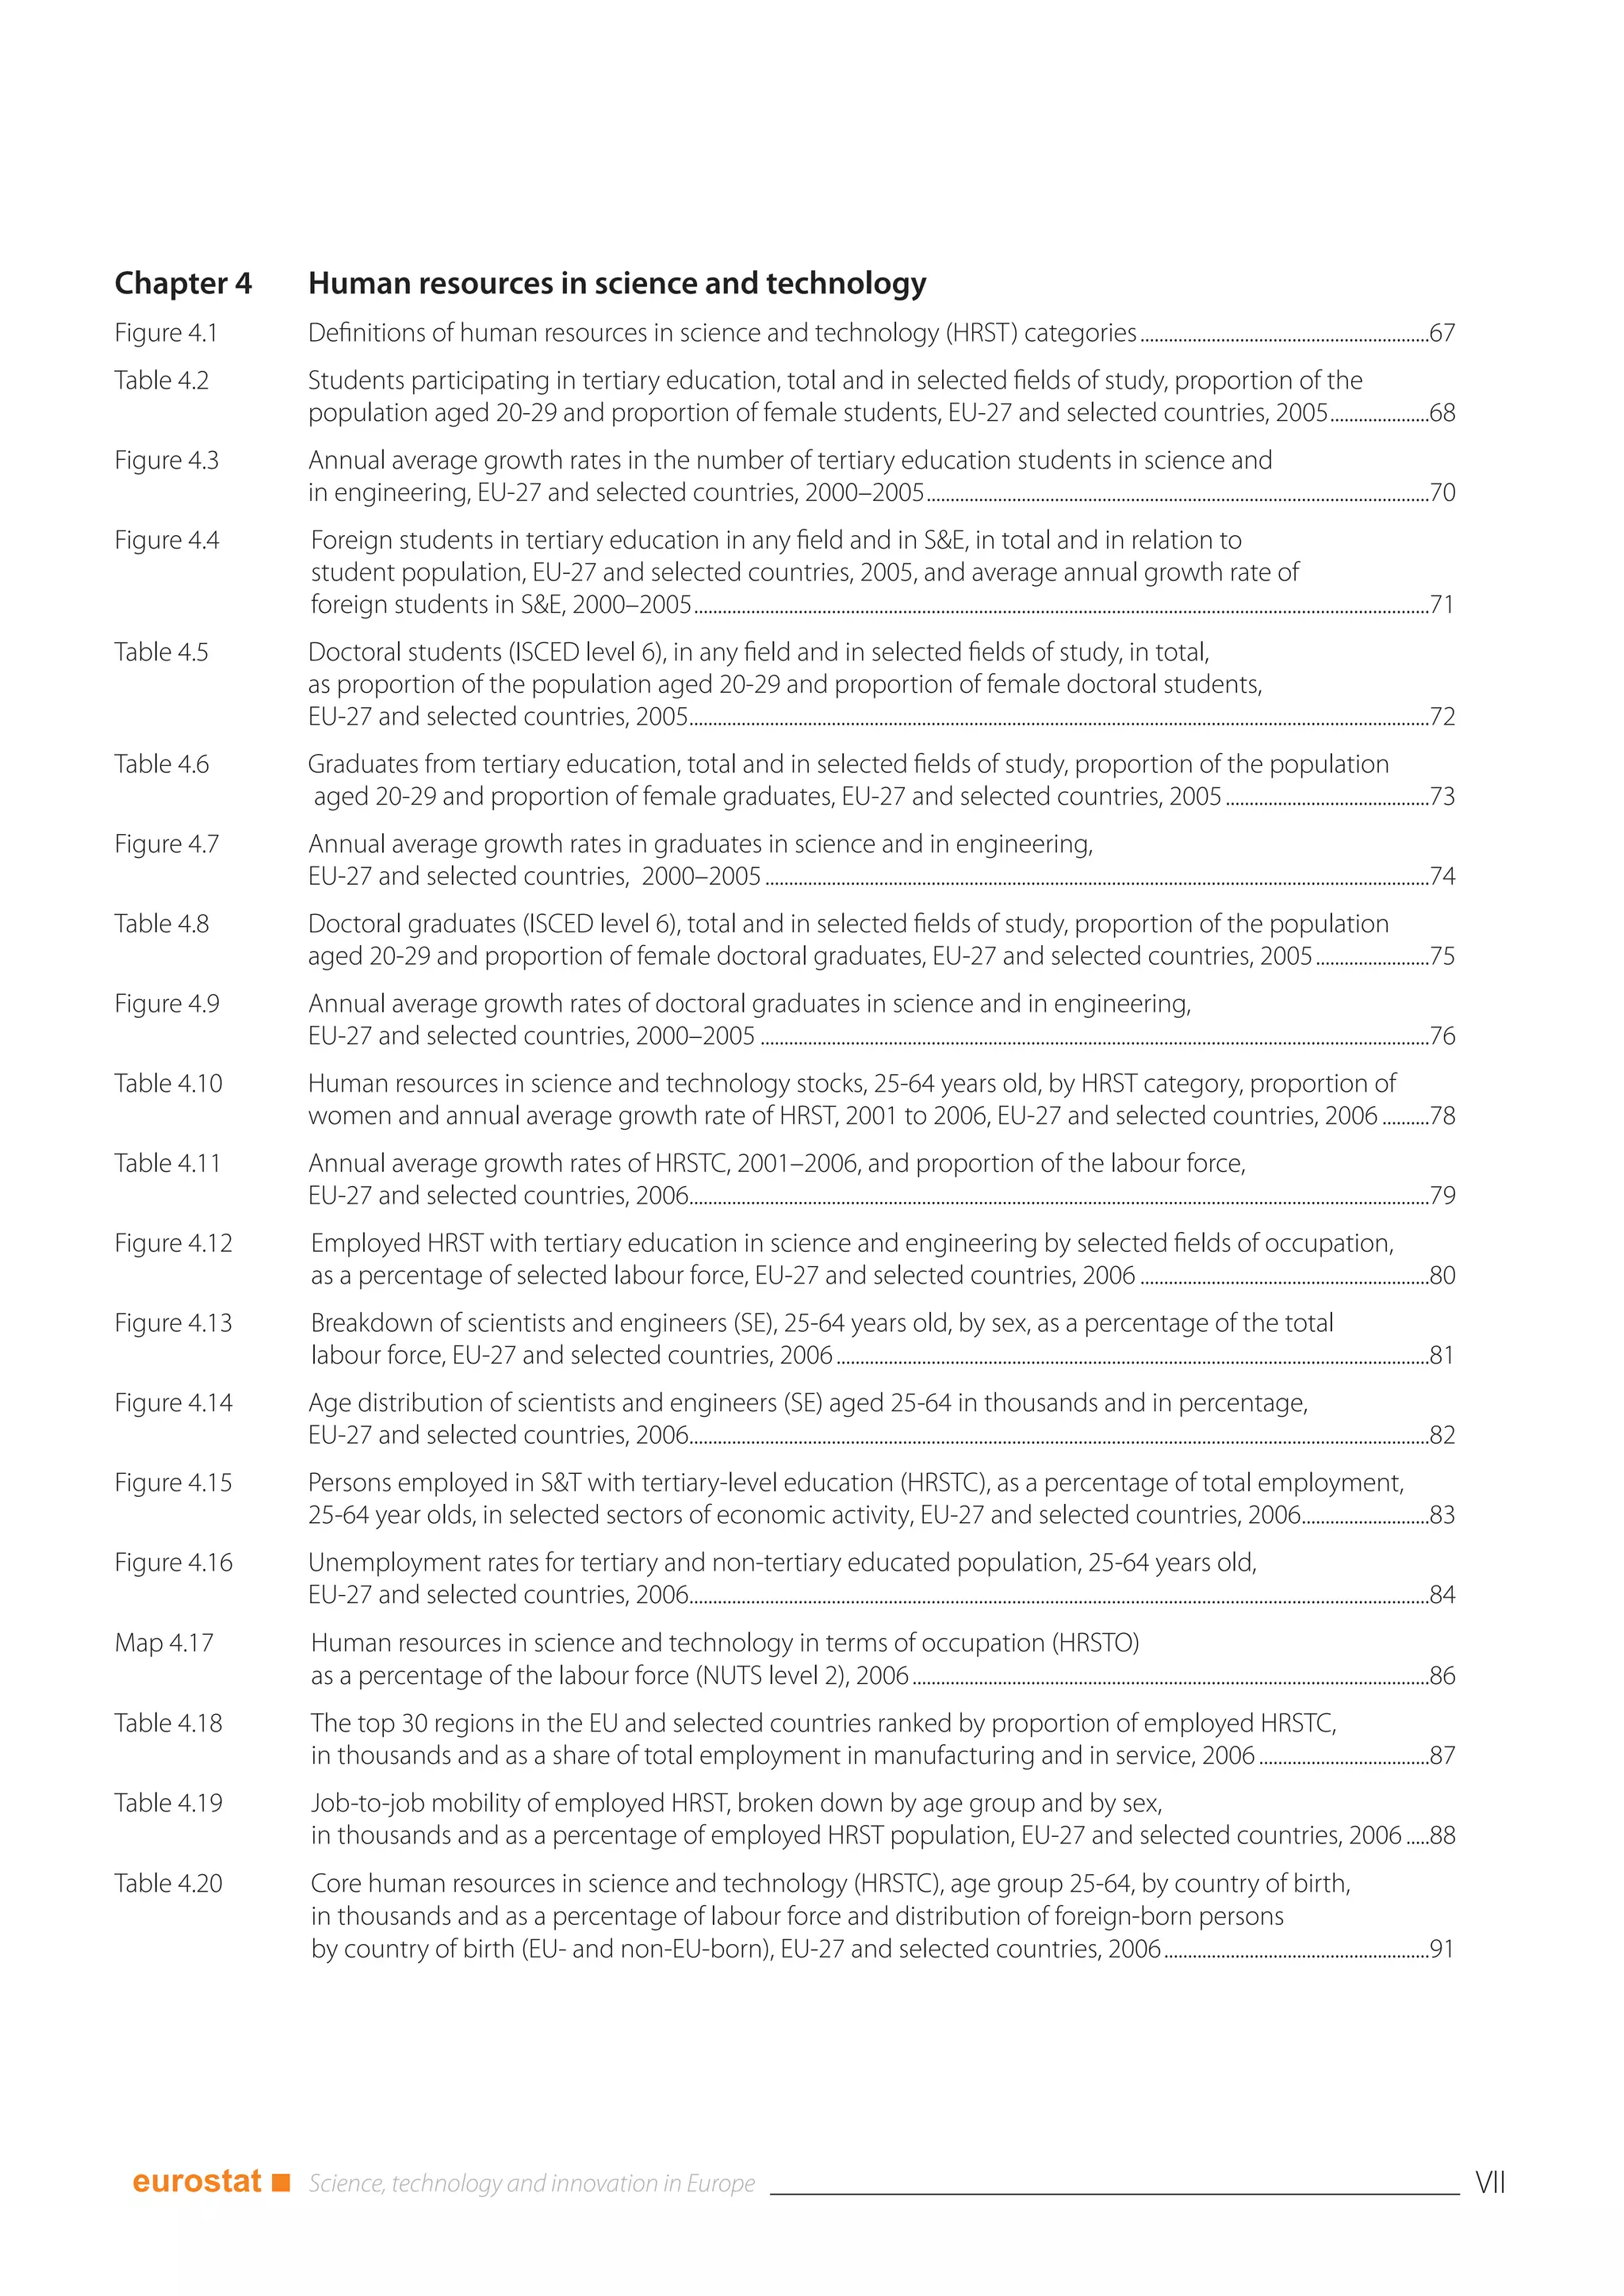
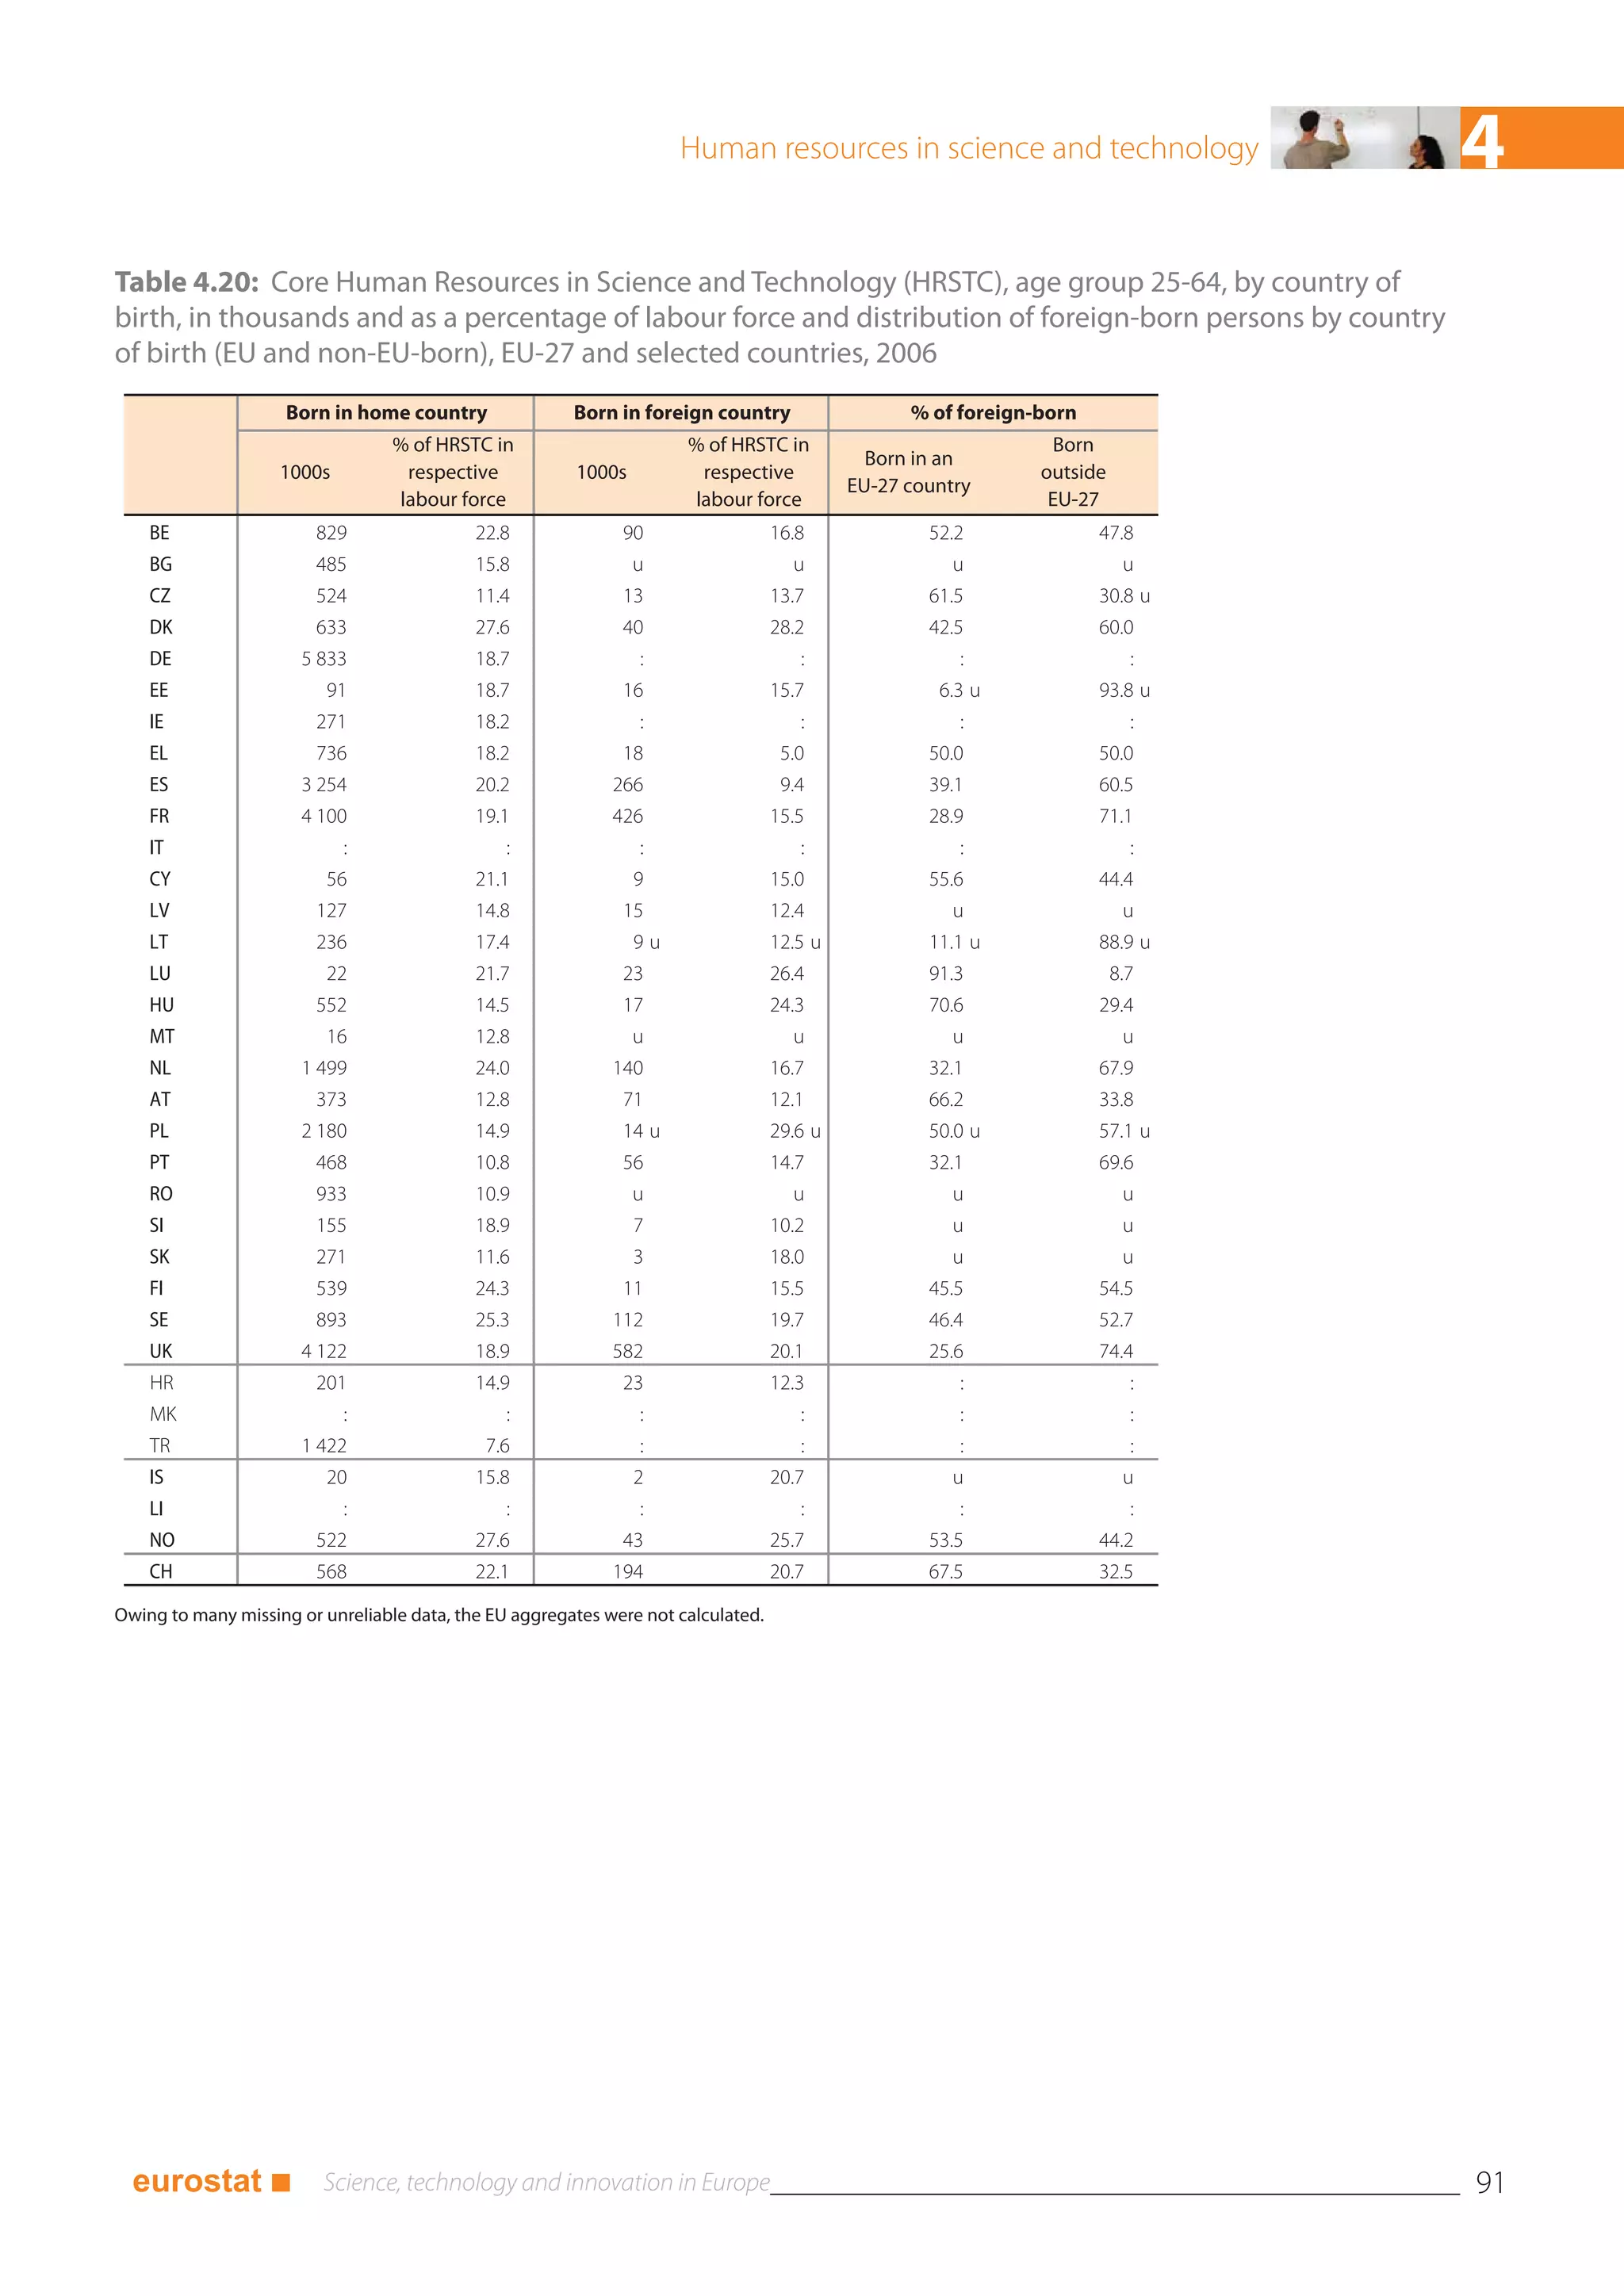
The international mobility of core human resources in science Conversely, in Estonia, 93.8 % of the foreign-born HRSTC
and technology (HRSTC) is presented in Table 4.20, which were born outside the EU. The same can be said of Latvia.
compares the HRSTC labour force born in the country of Indeed, the majority of the foreign-born populations in these
residence with the HRSTC born abroad (for more details see countries are thought to be of ethnic Russian origin. They
methodological notes). settled as internal migrants during the Soviet era and became
international migrants with the fall of the Soviet Union.
In Poland, around 30 % of the foreign-born labour force were
HRSTC, against around 15 % of the labour force born in
Poland. Denmark recorded high and evenly distributed shares
of HRSTC born in Denmark and abroad, at 27.6 % and
28.2 % respectively.
In Luxembourg, the vast majority of foreign-born HRSTC
were born within the EU-27 (91.3 %). This can partly be
explained by Luxembourg’s relatively small size, its
geographical location and the presence of EU institutions
requiring qualified human resources from the various
Member States.
90 ■ eurostat](https://image.slidesharecdn.com/2009-09eurostatid27em-09-09-en-100113065936-phpapp01/75/2009-09-E-U-R-O-S-T-A-T-I-D-27-E-M-09-09-E-N-117-2048.jpg)


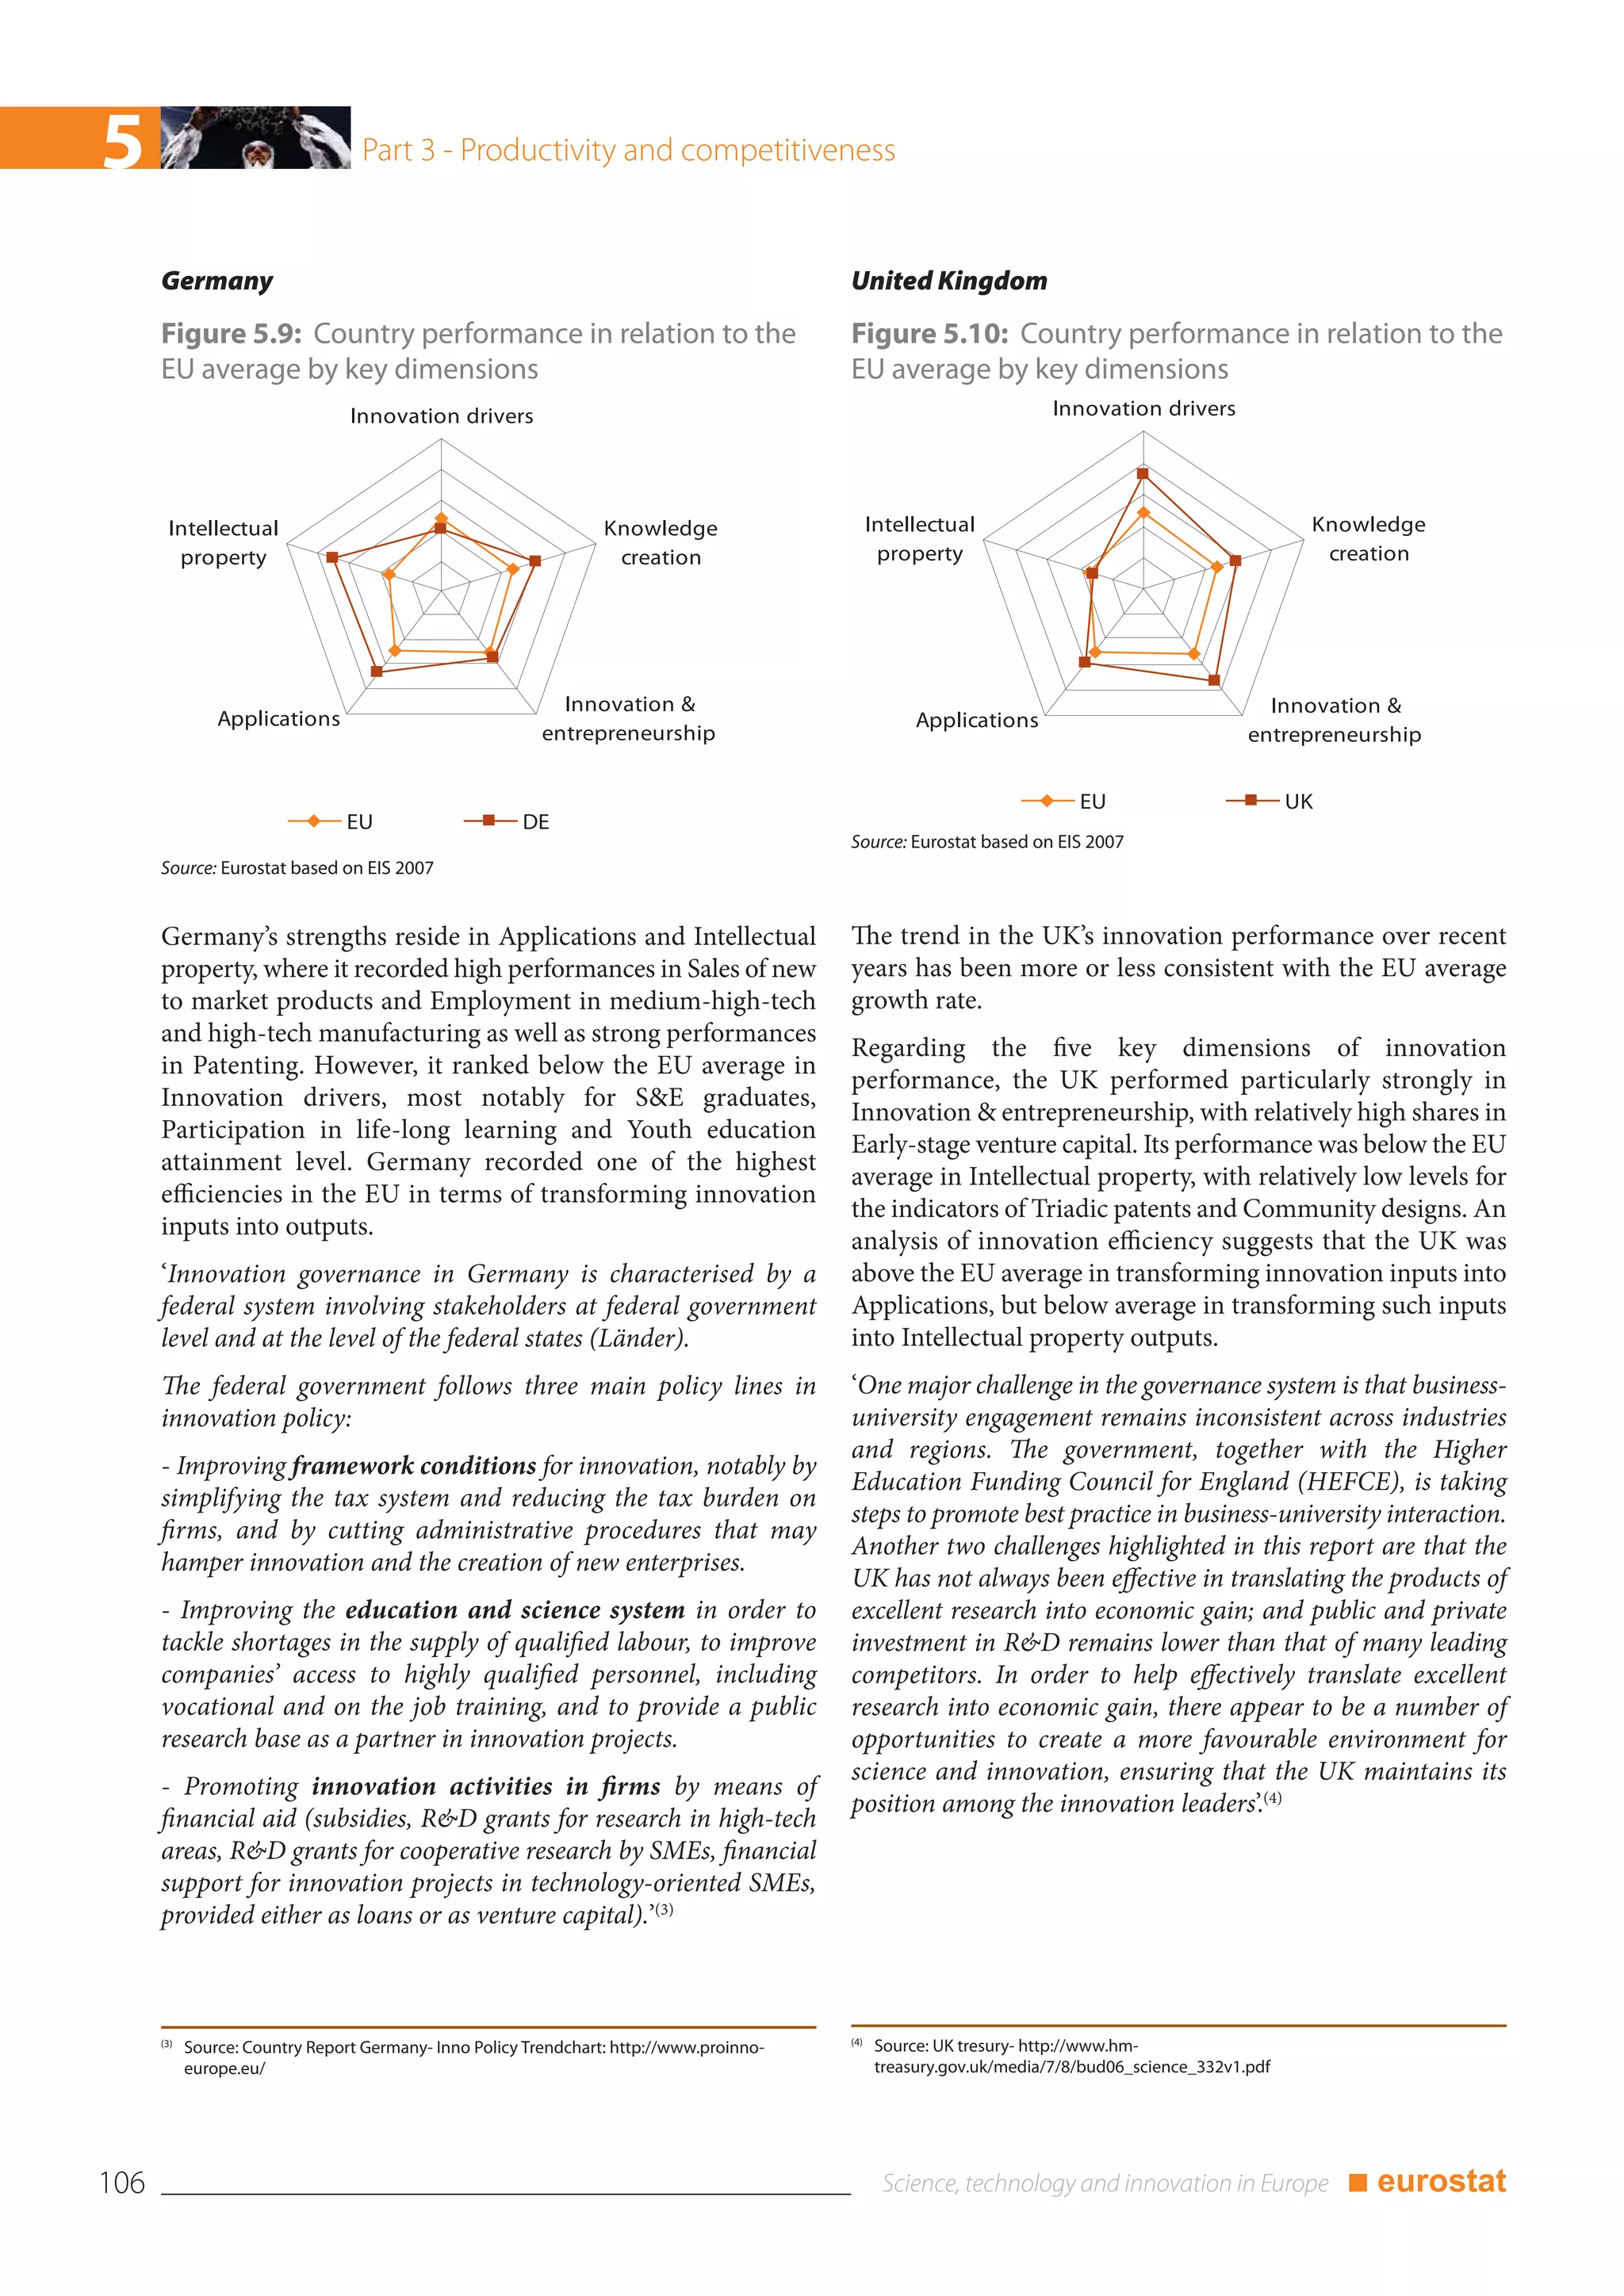
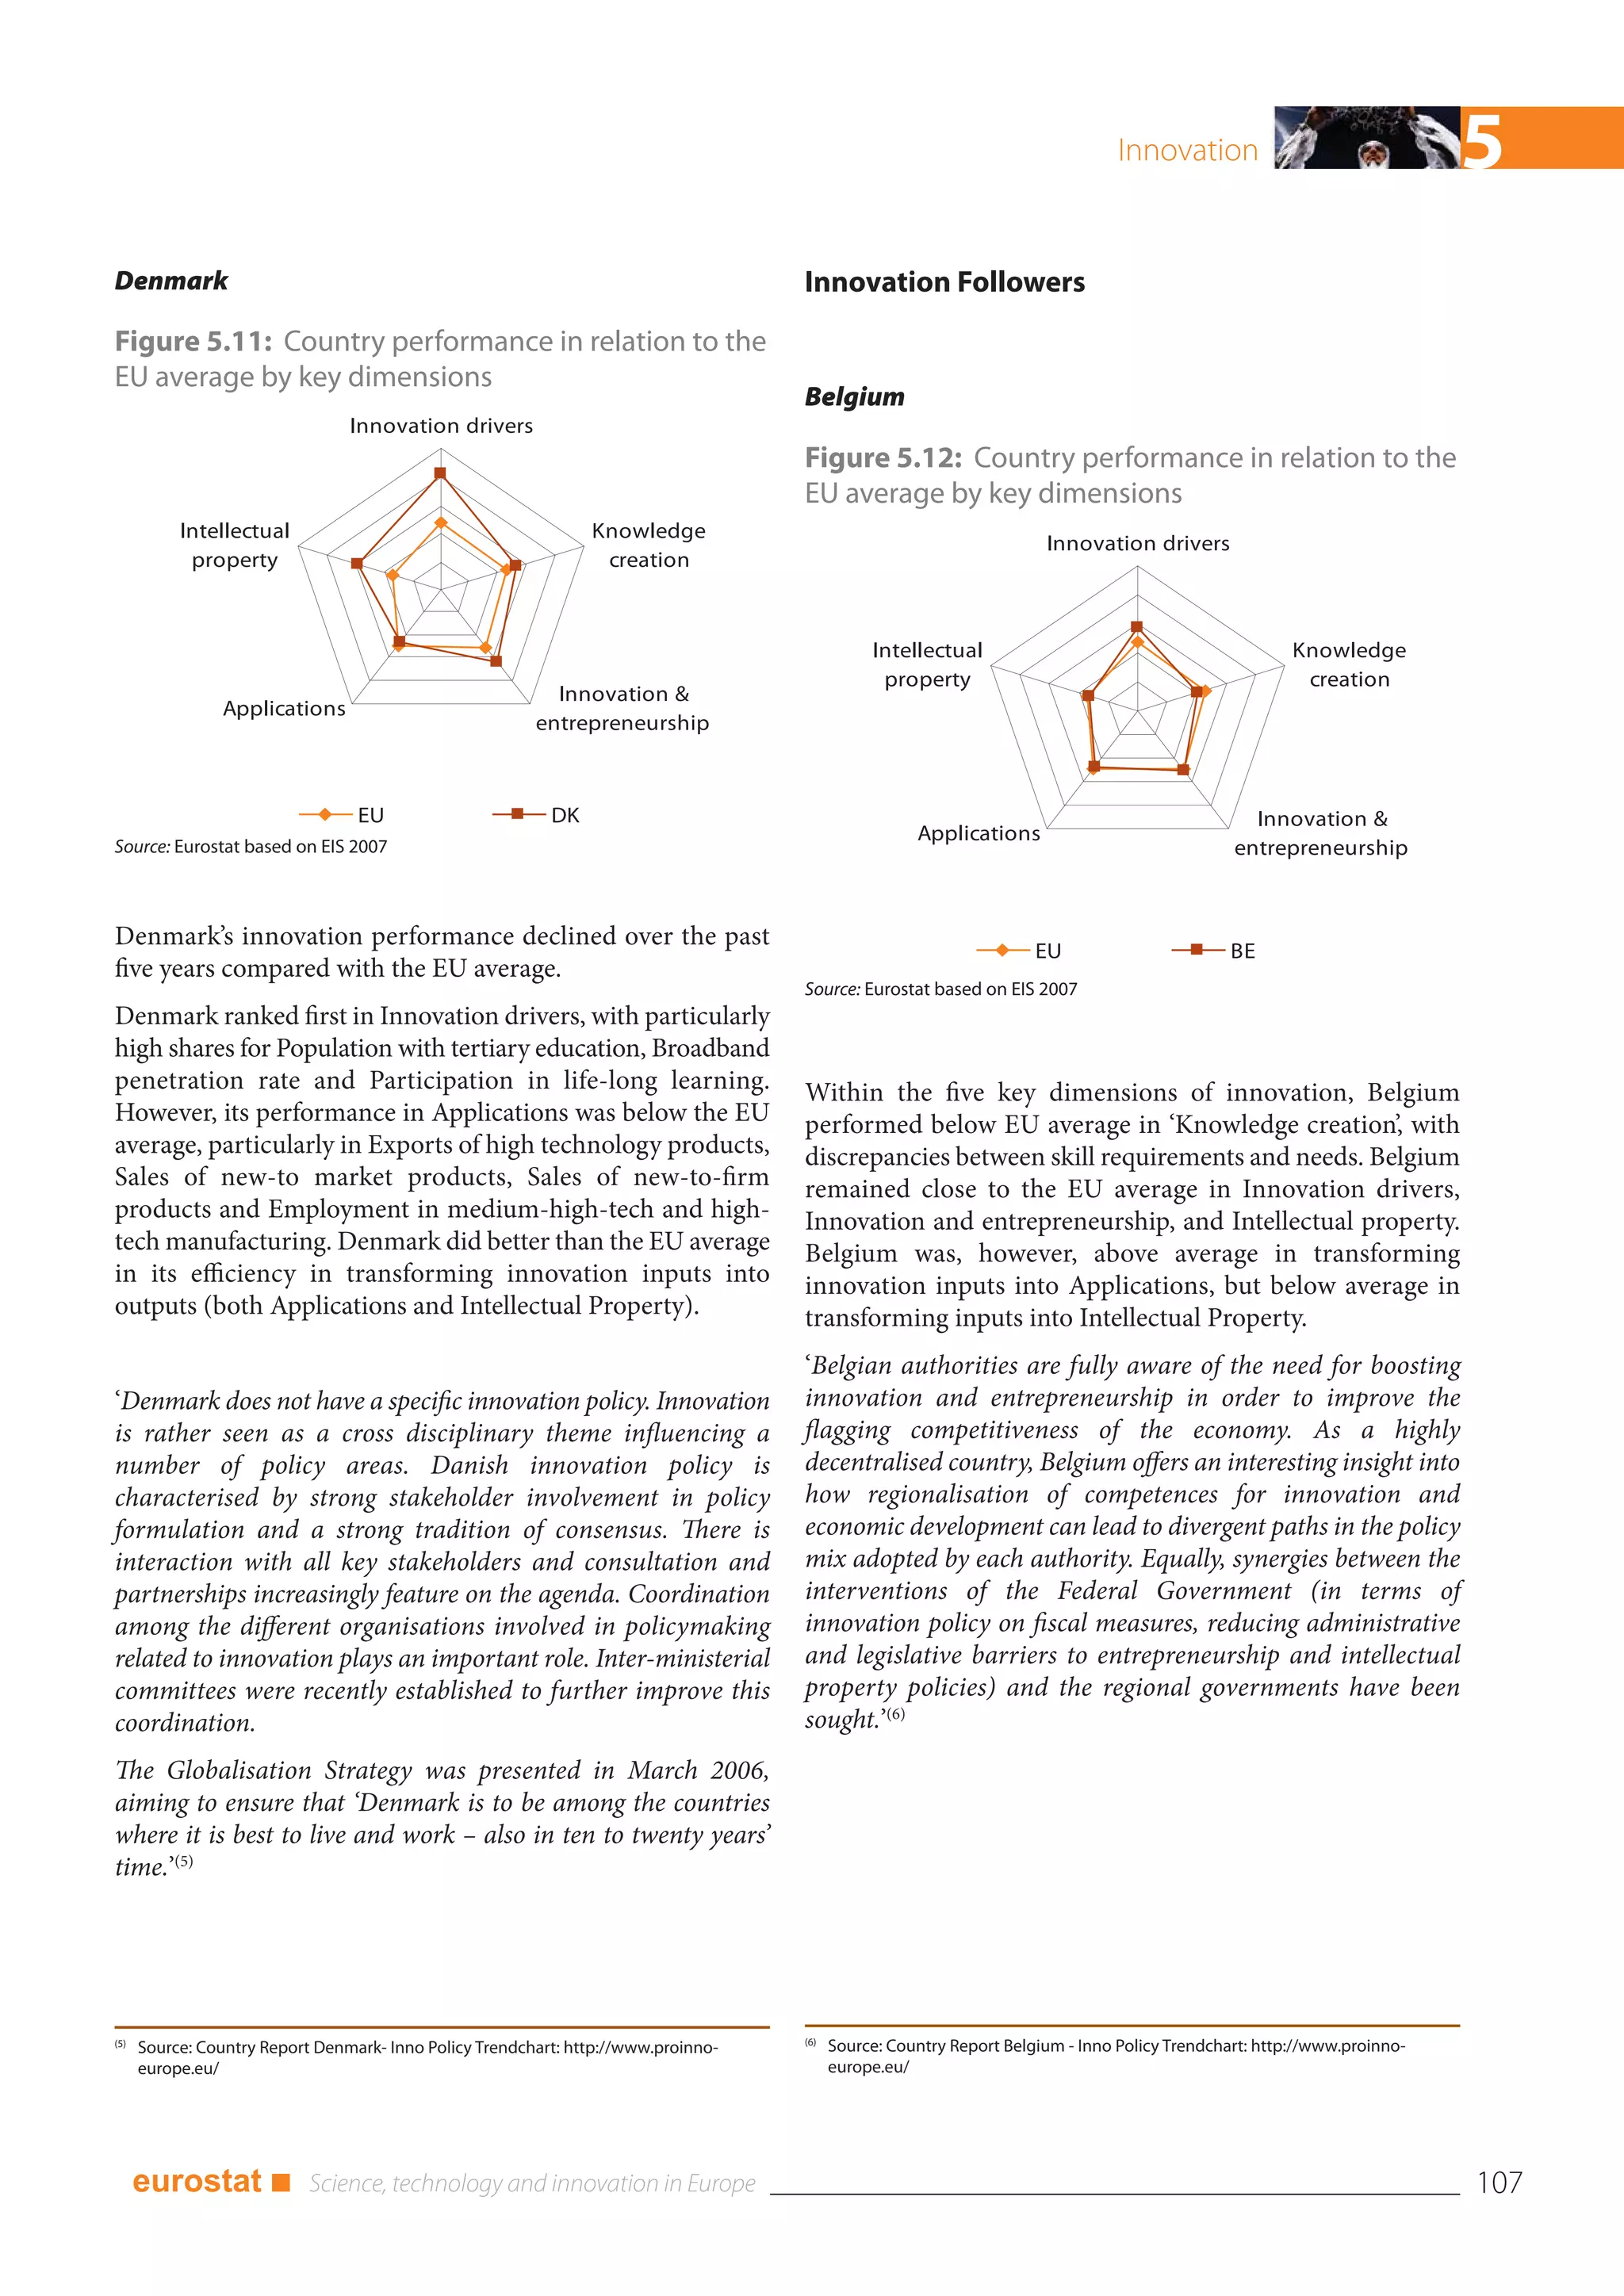
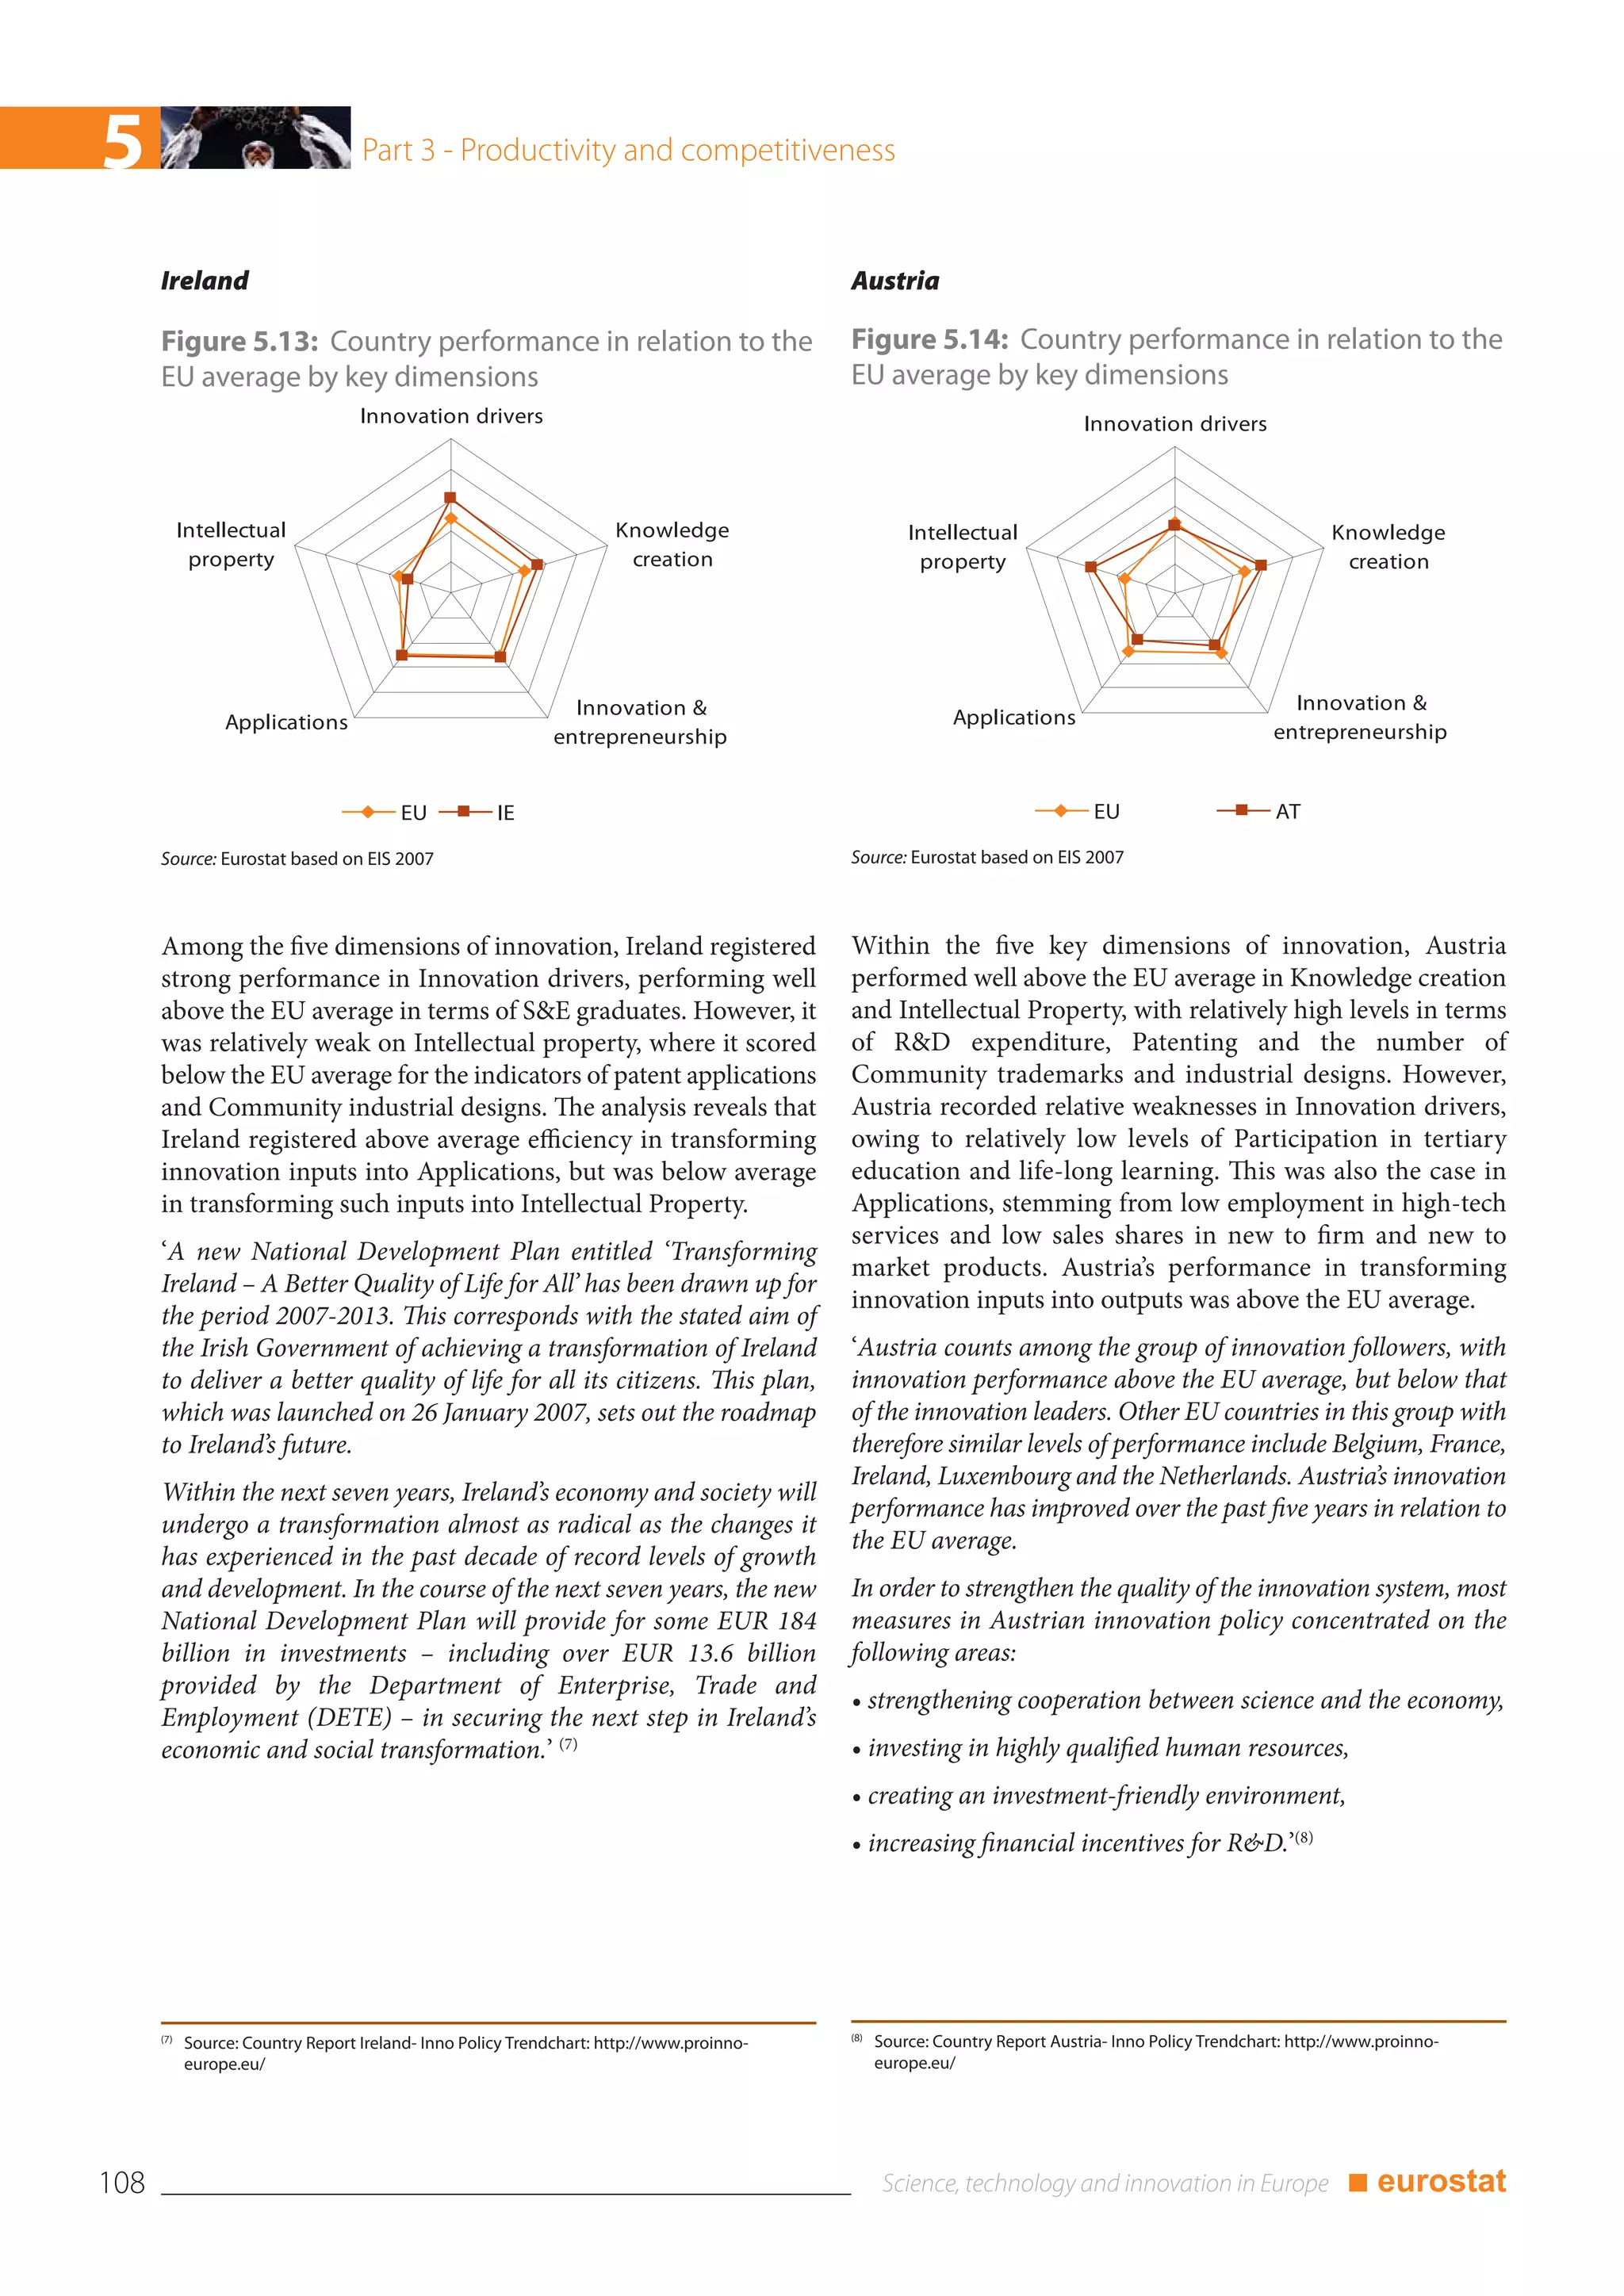
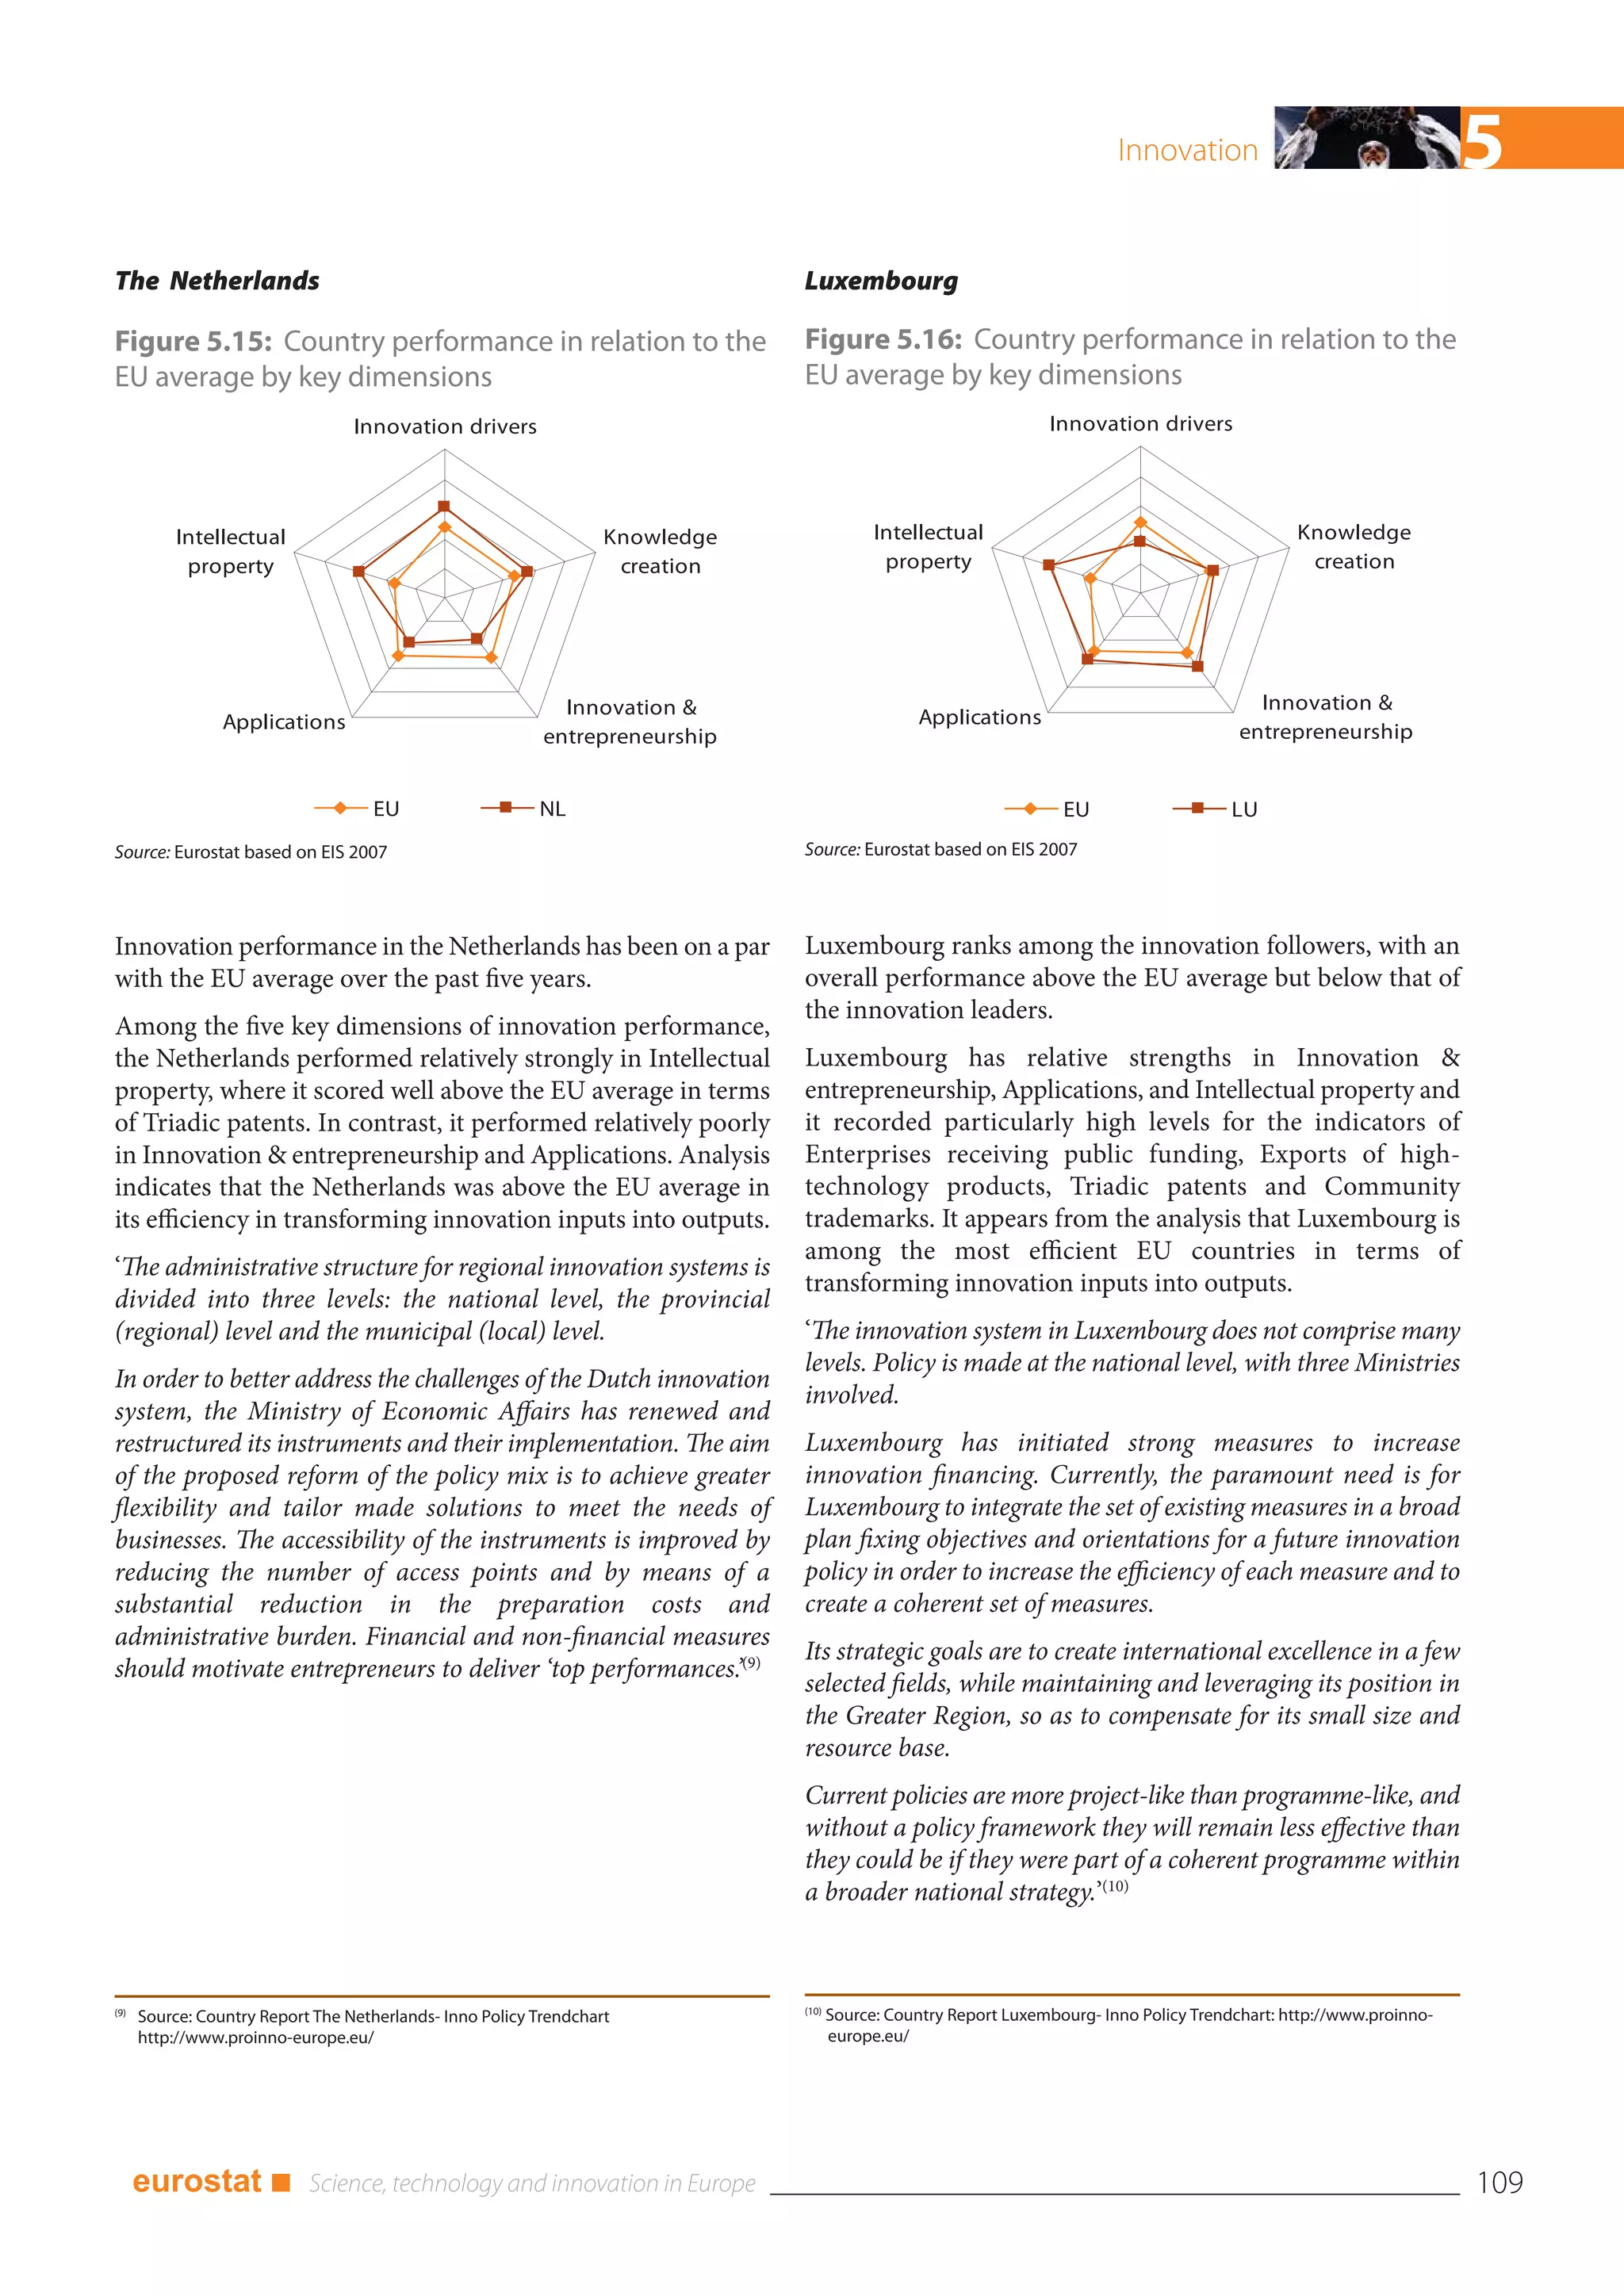
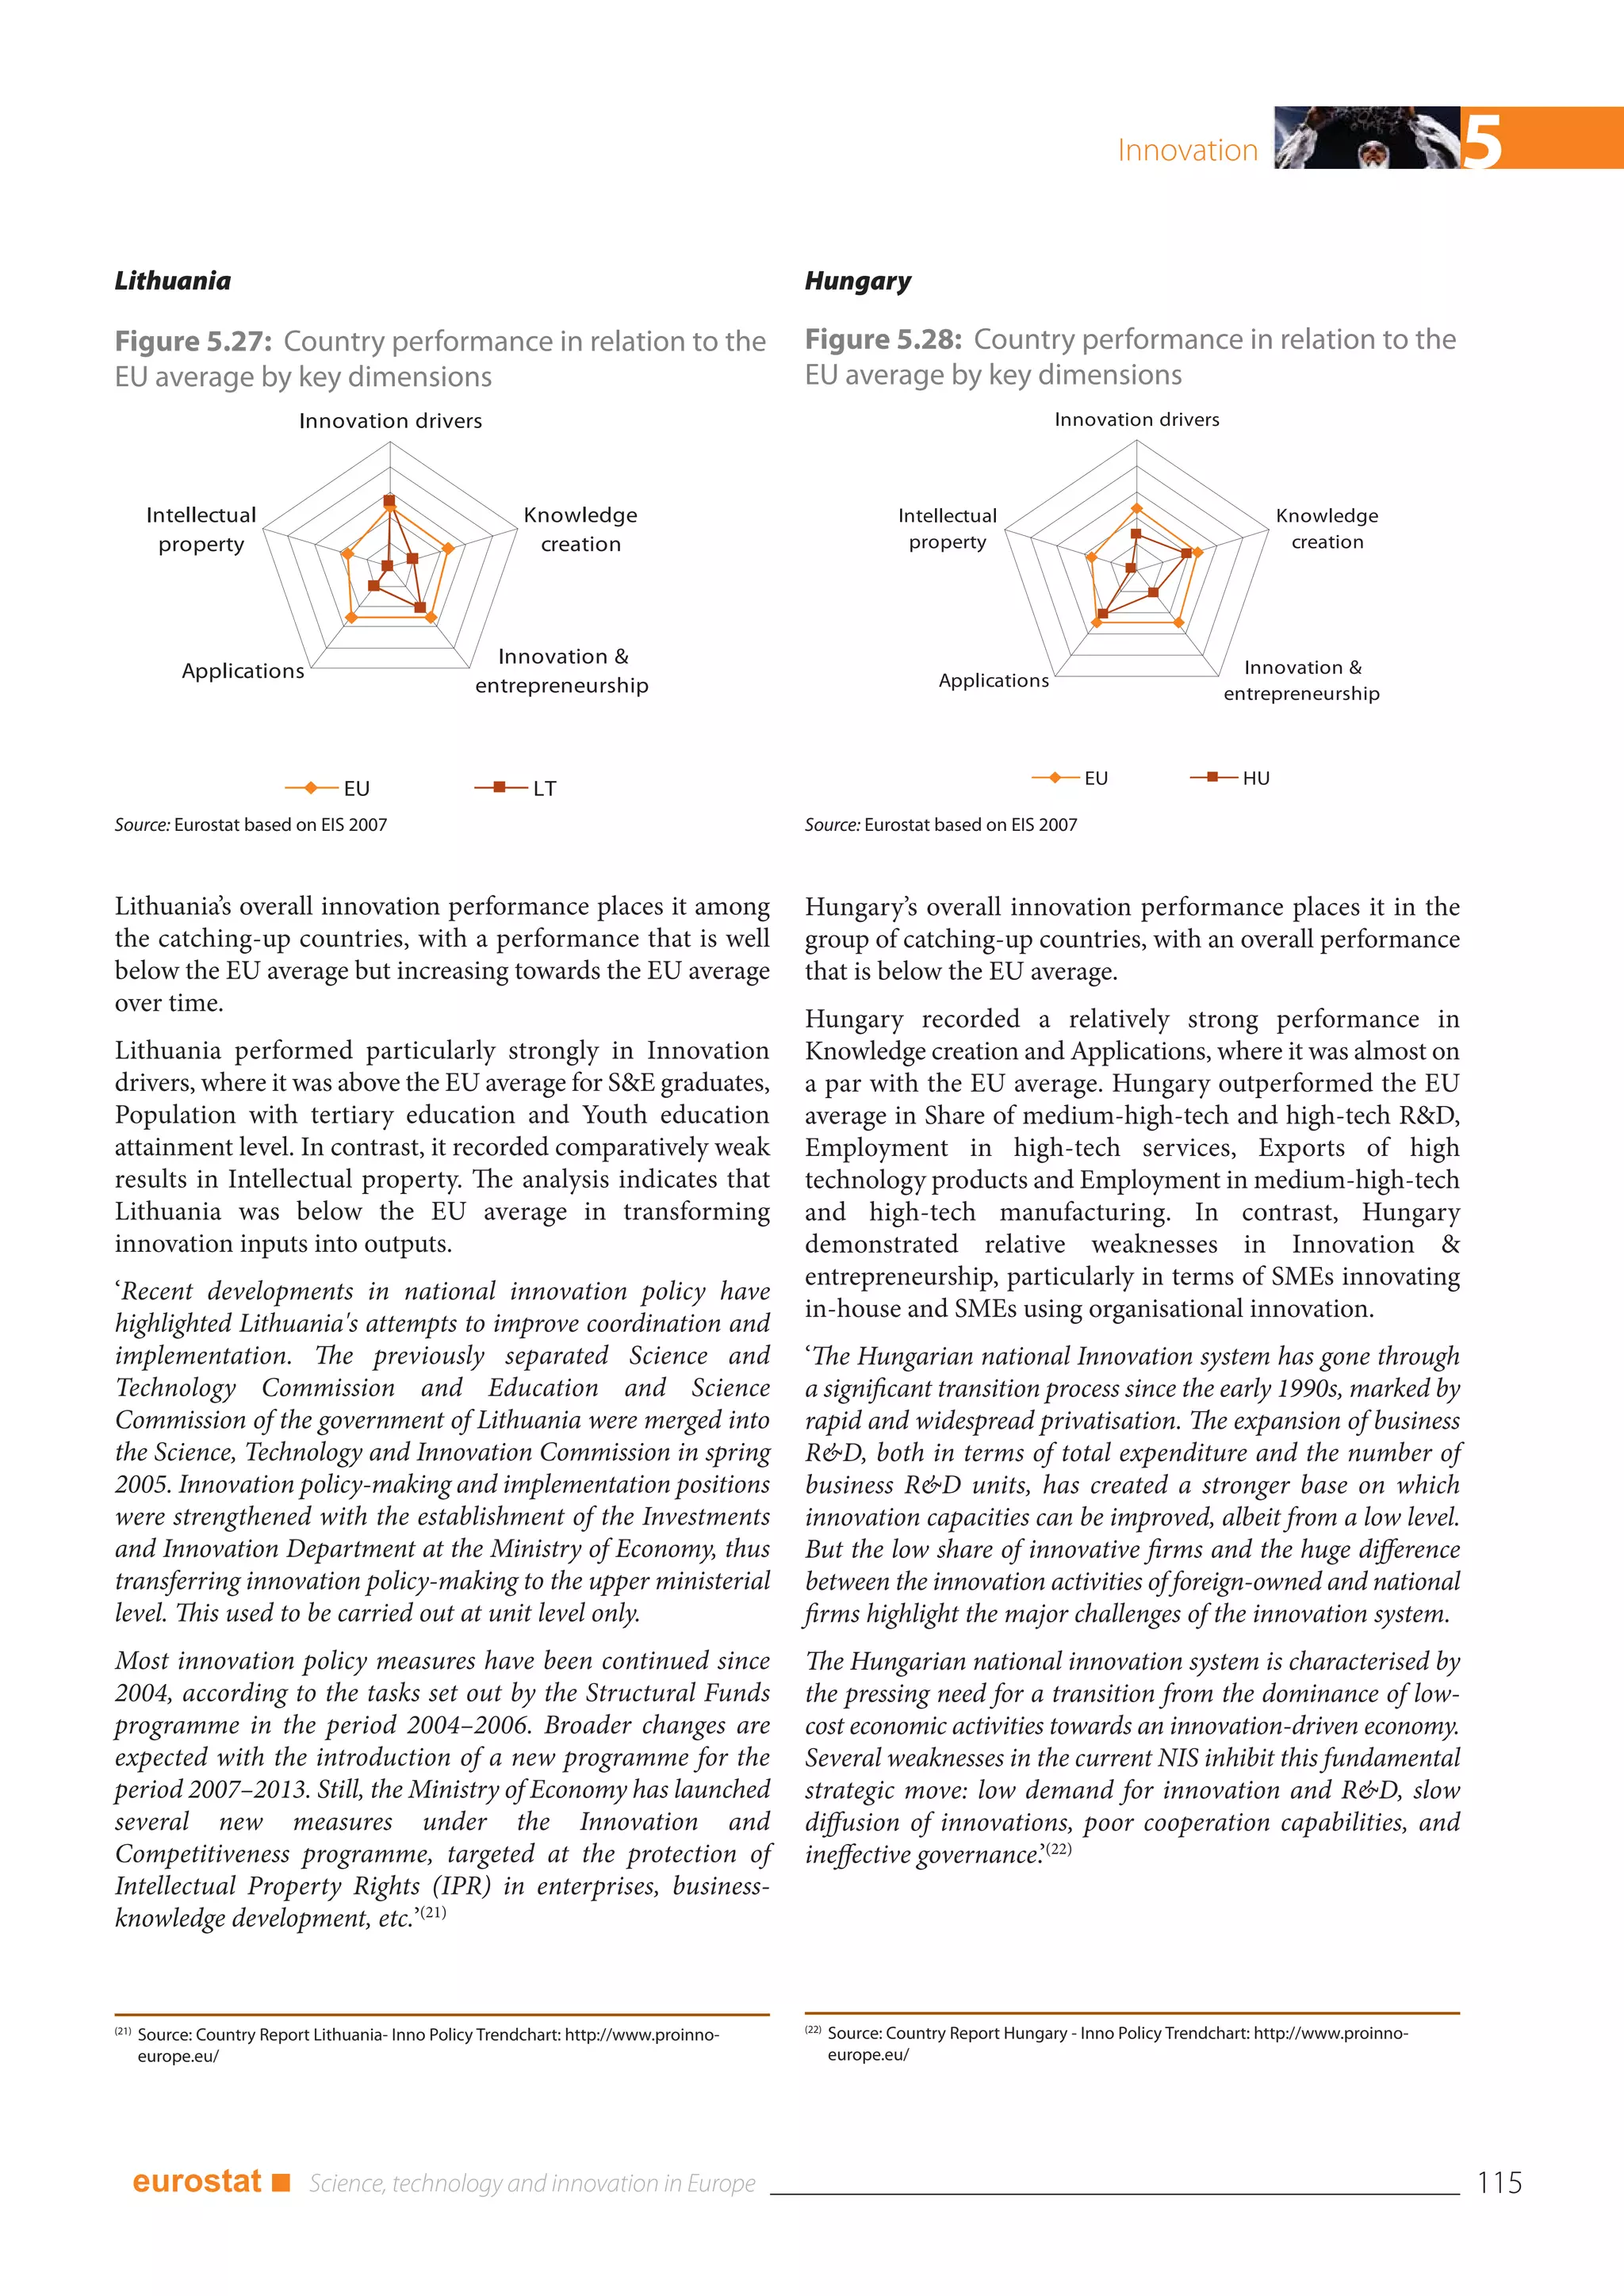
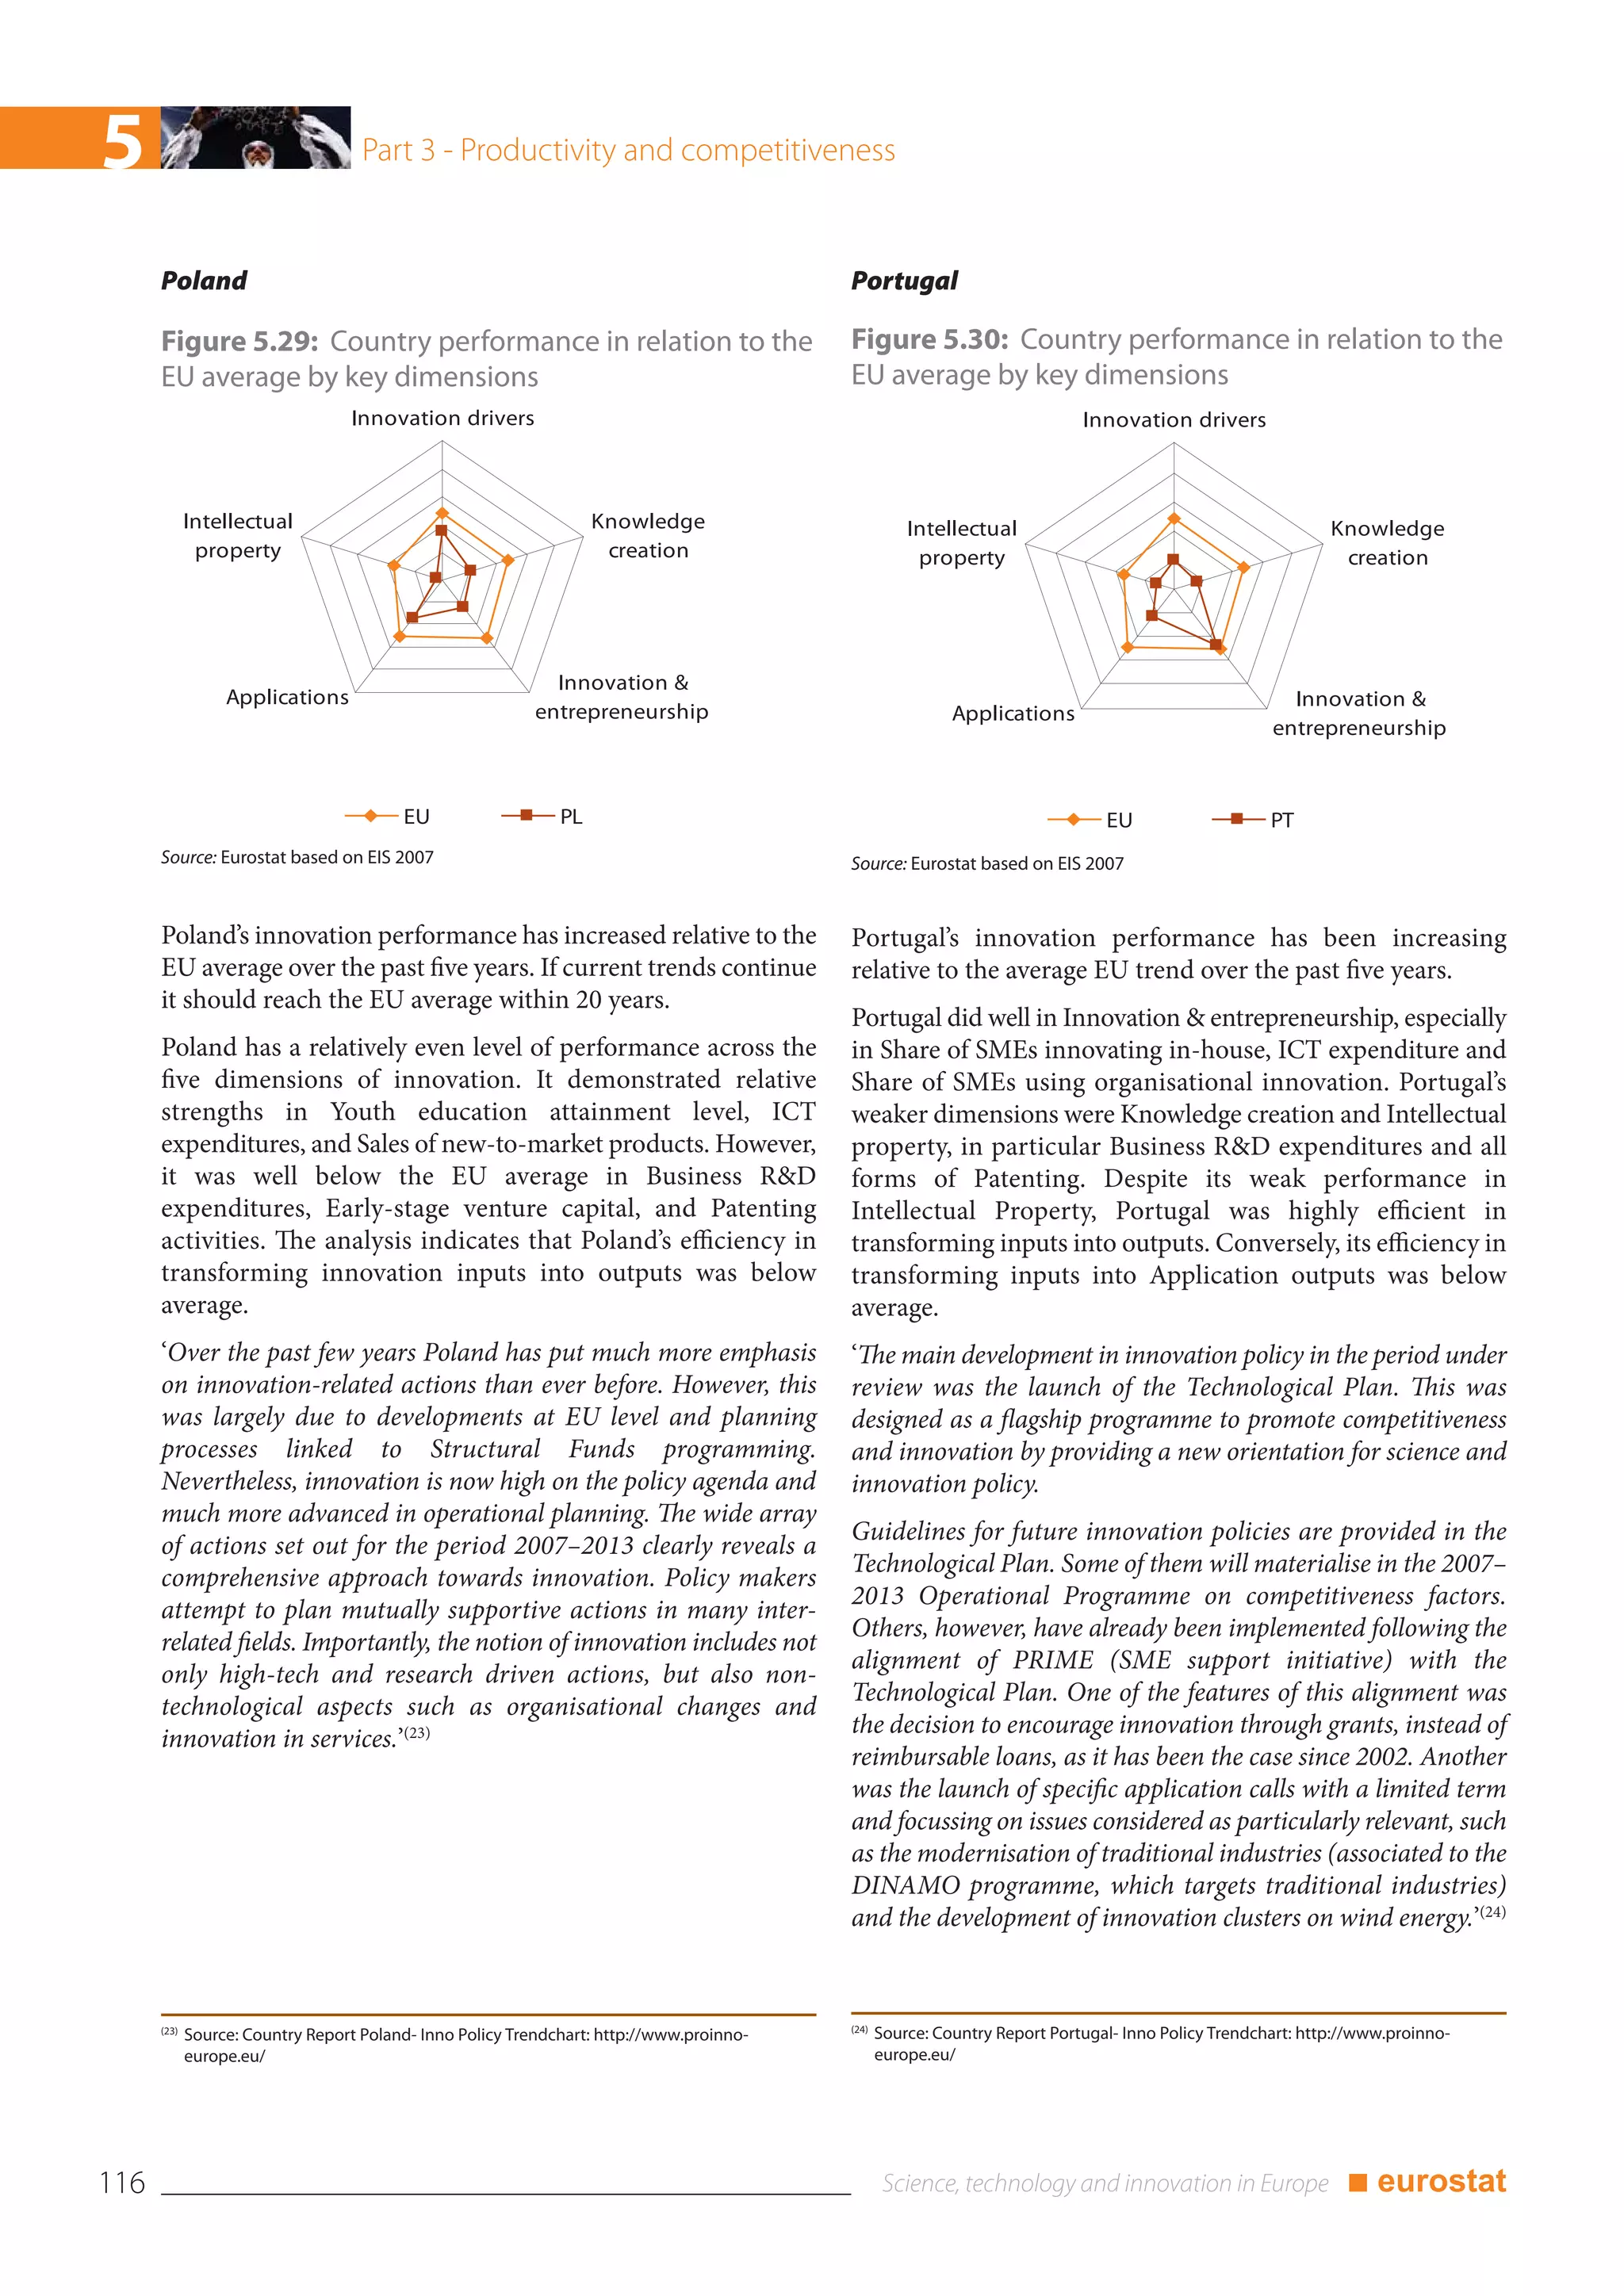
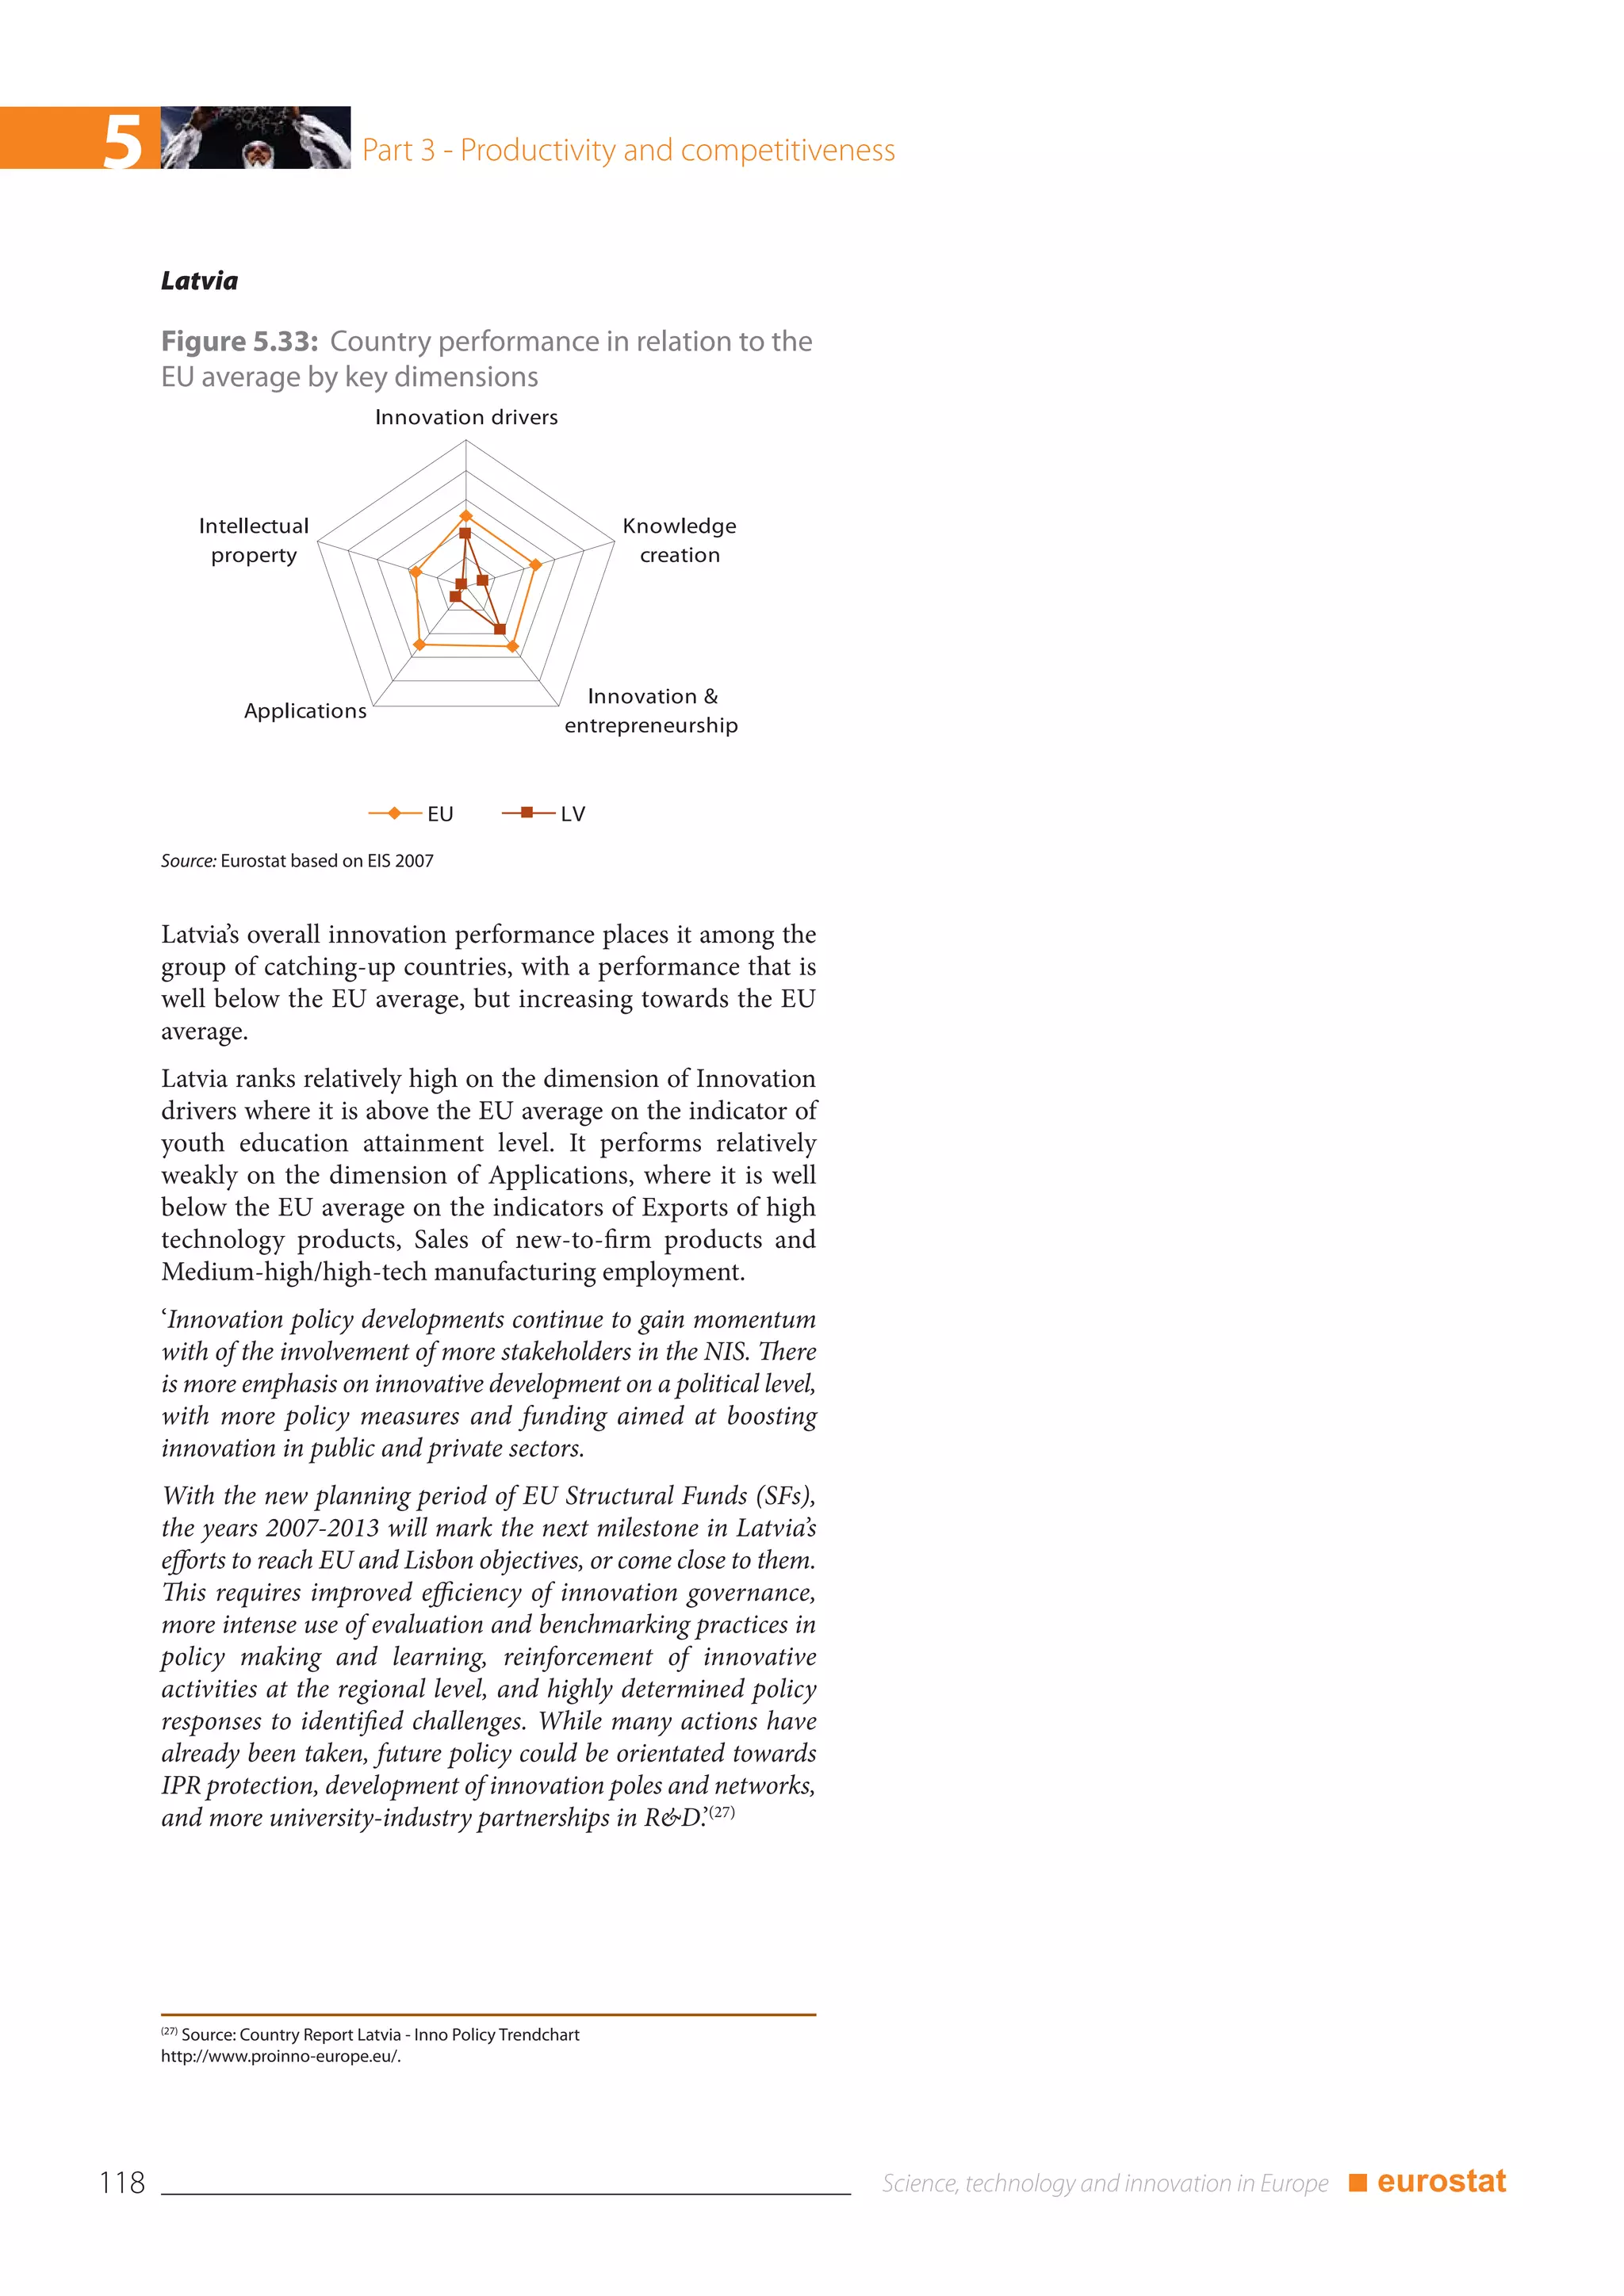
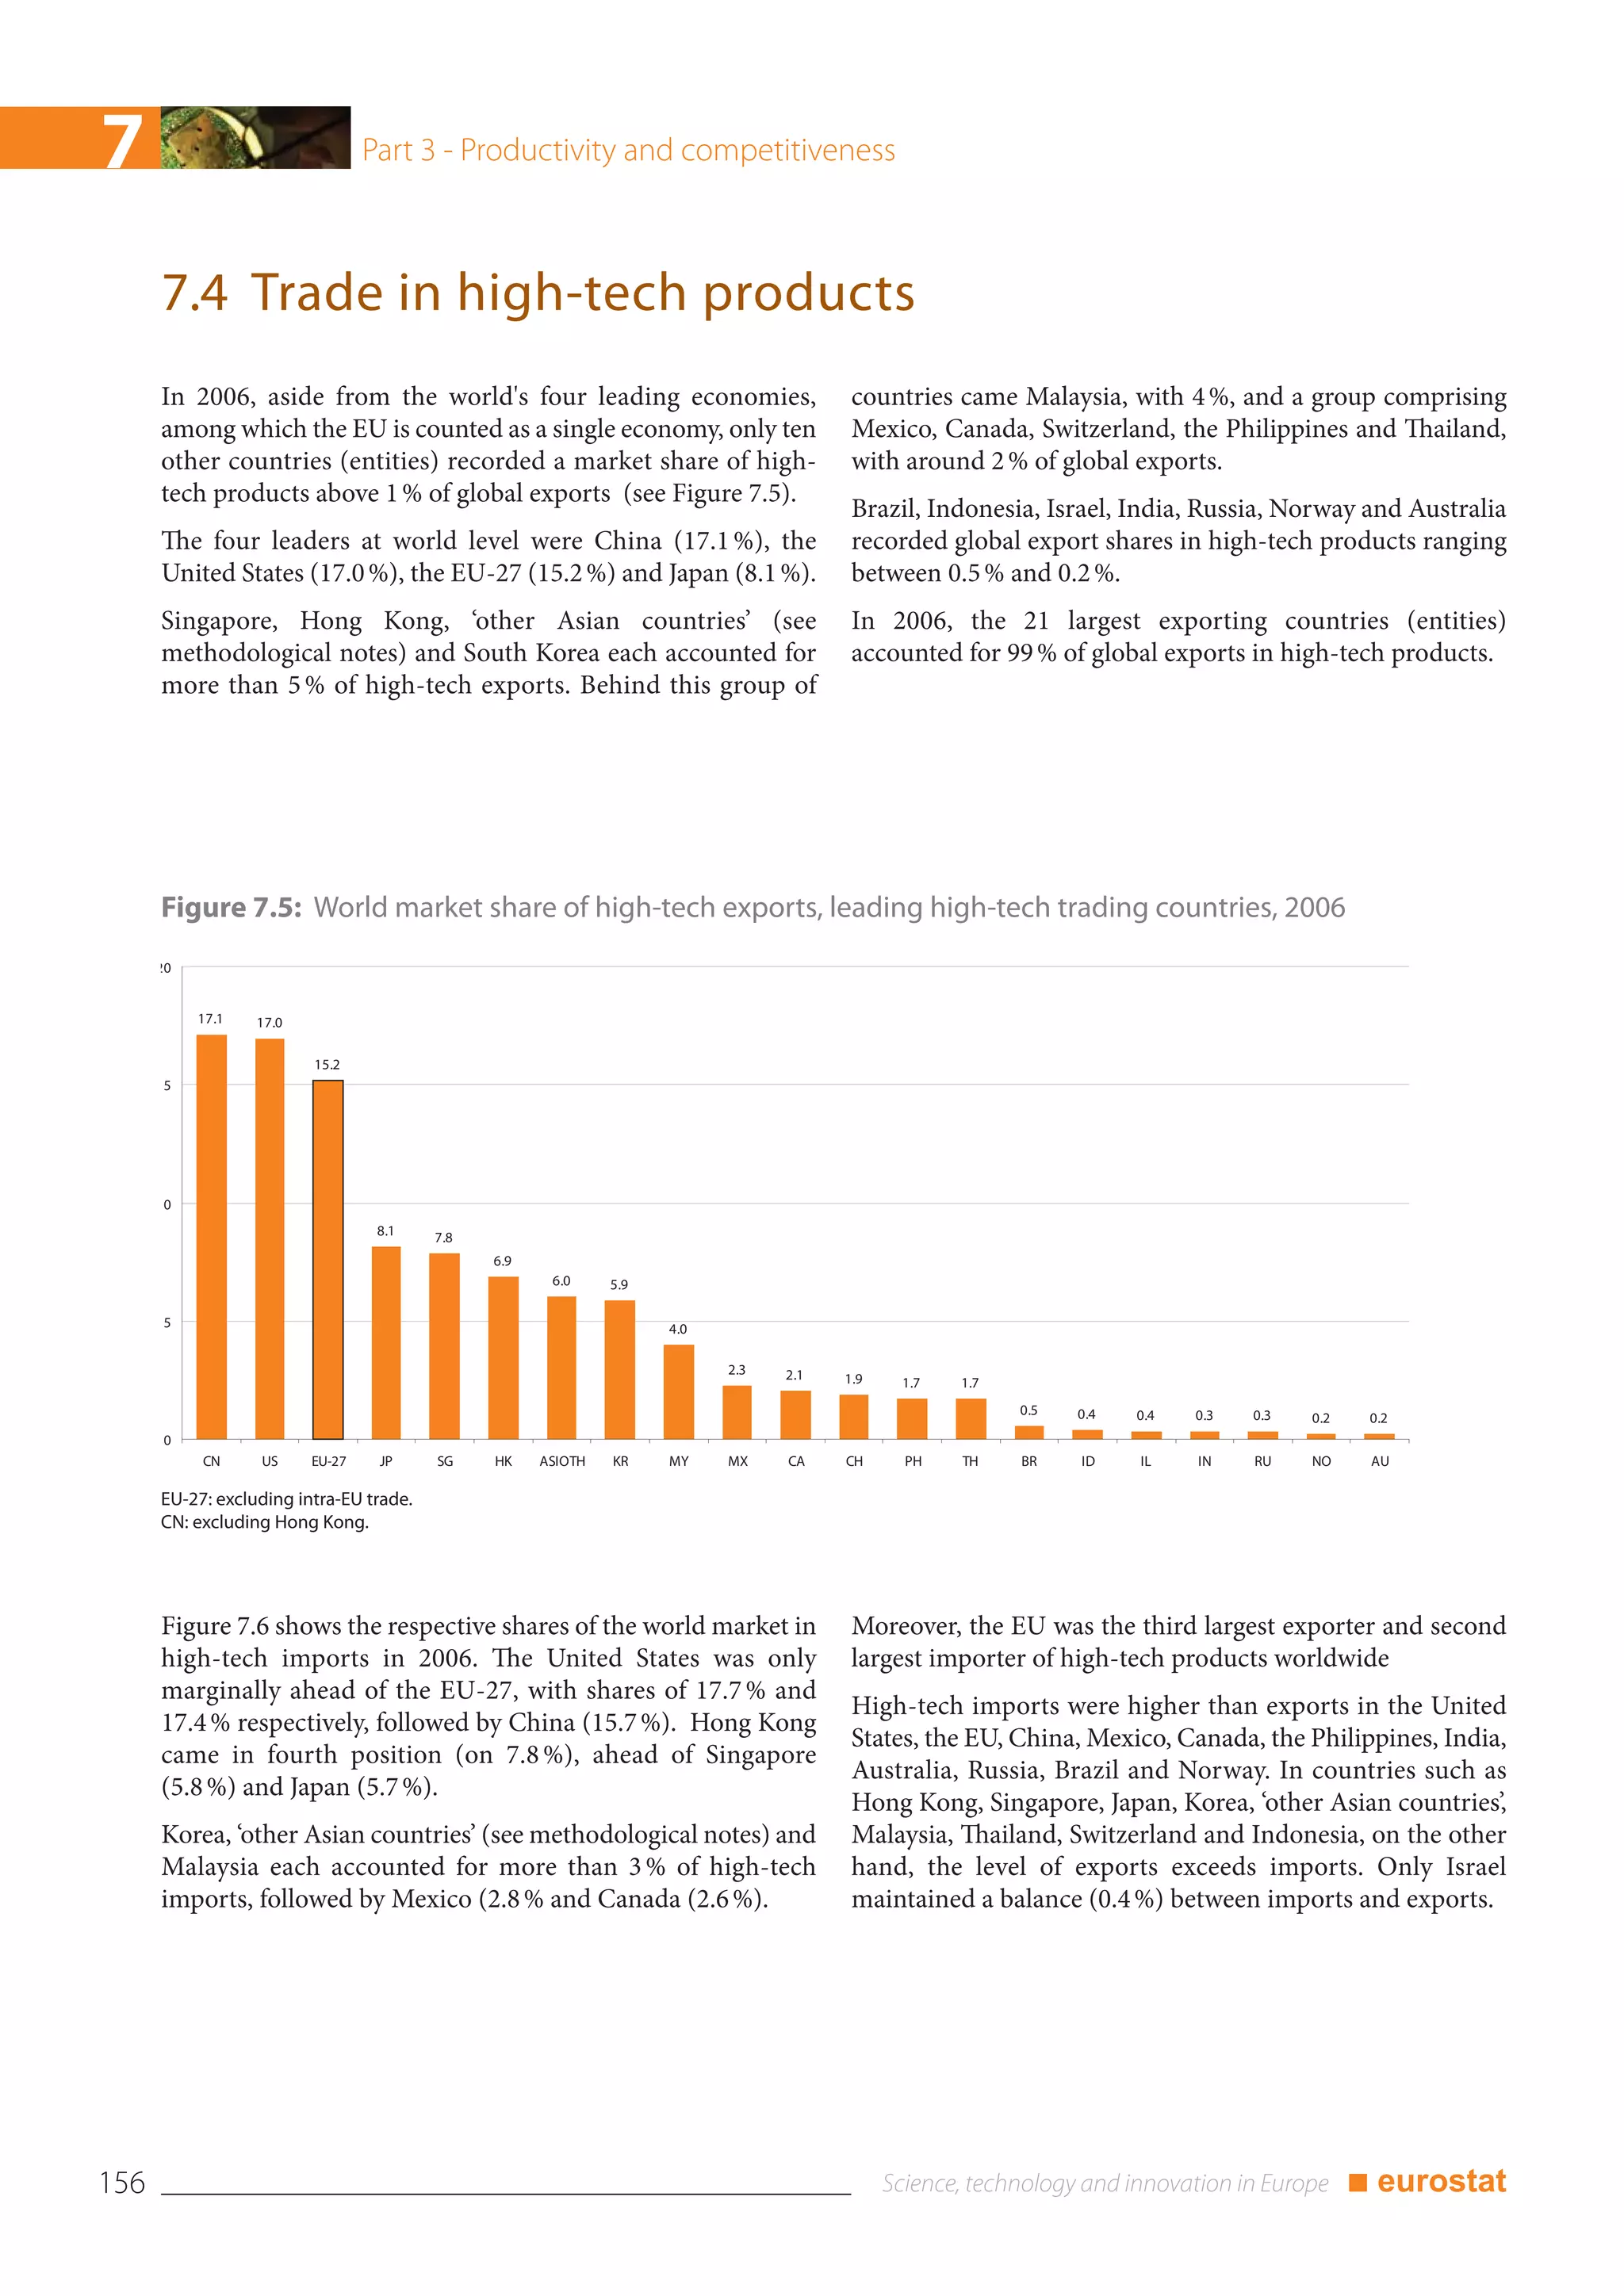
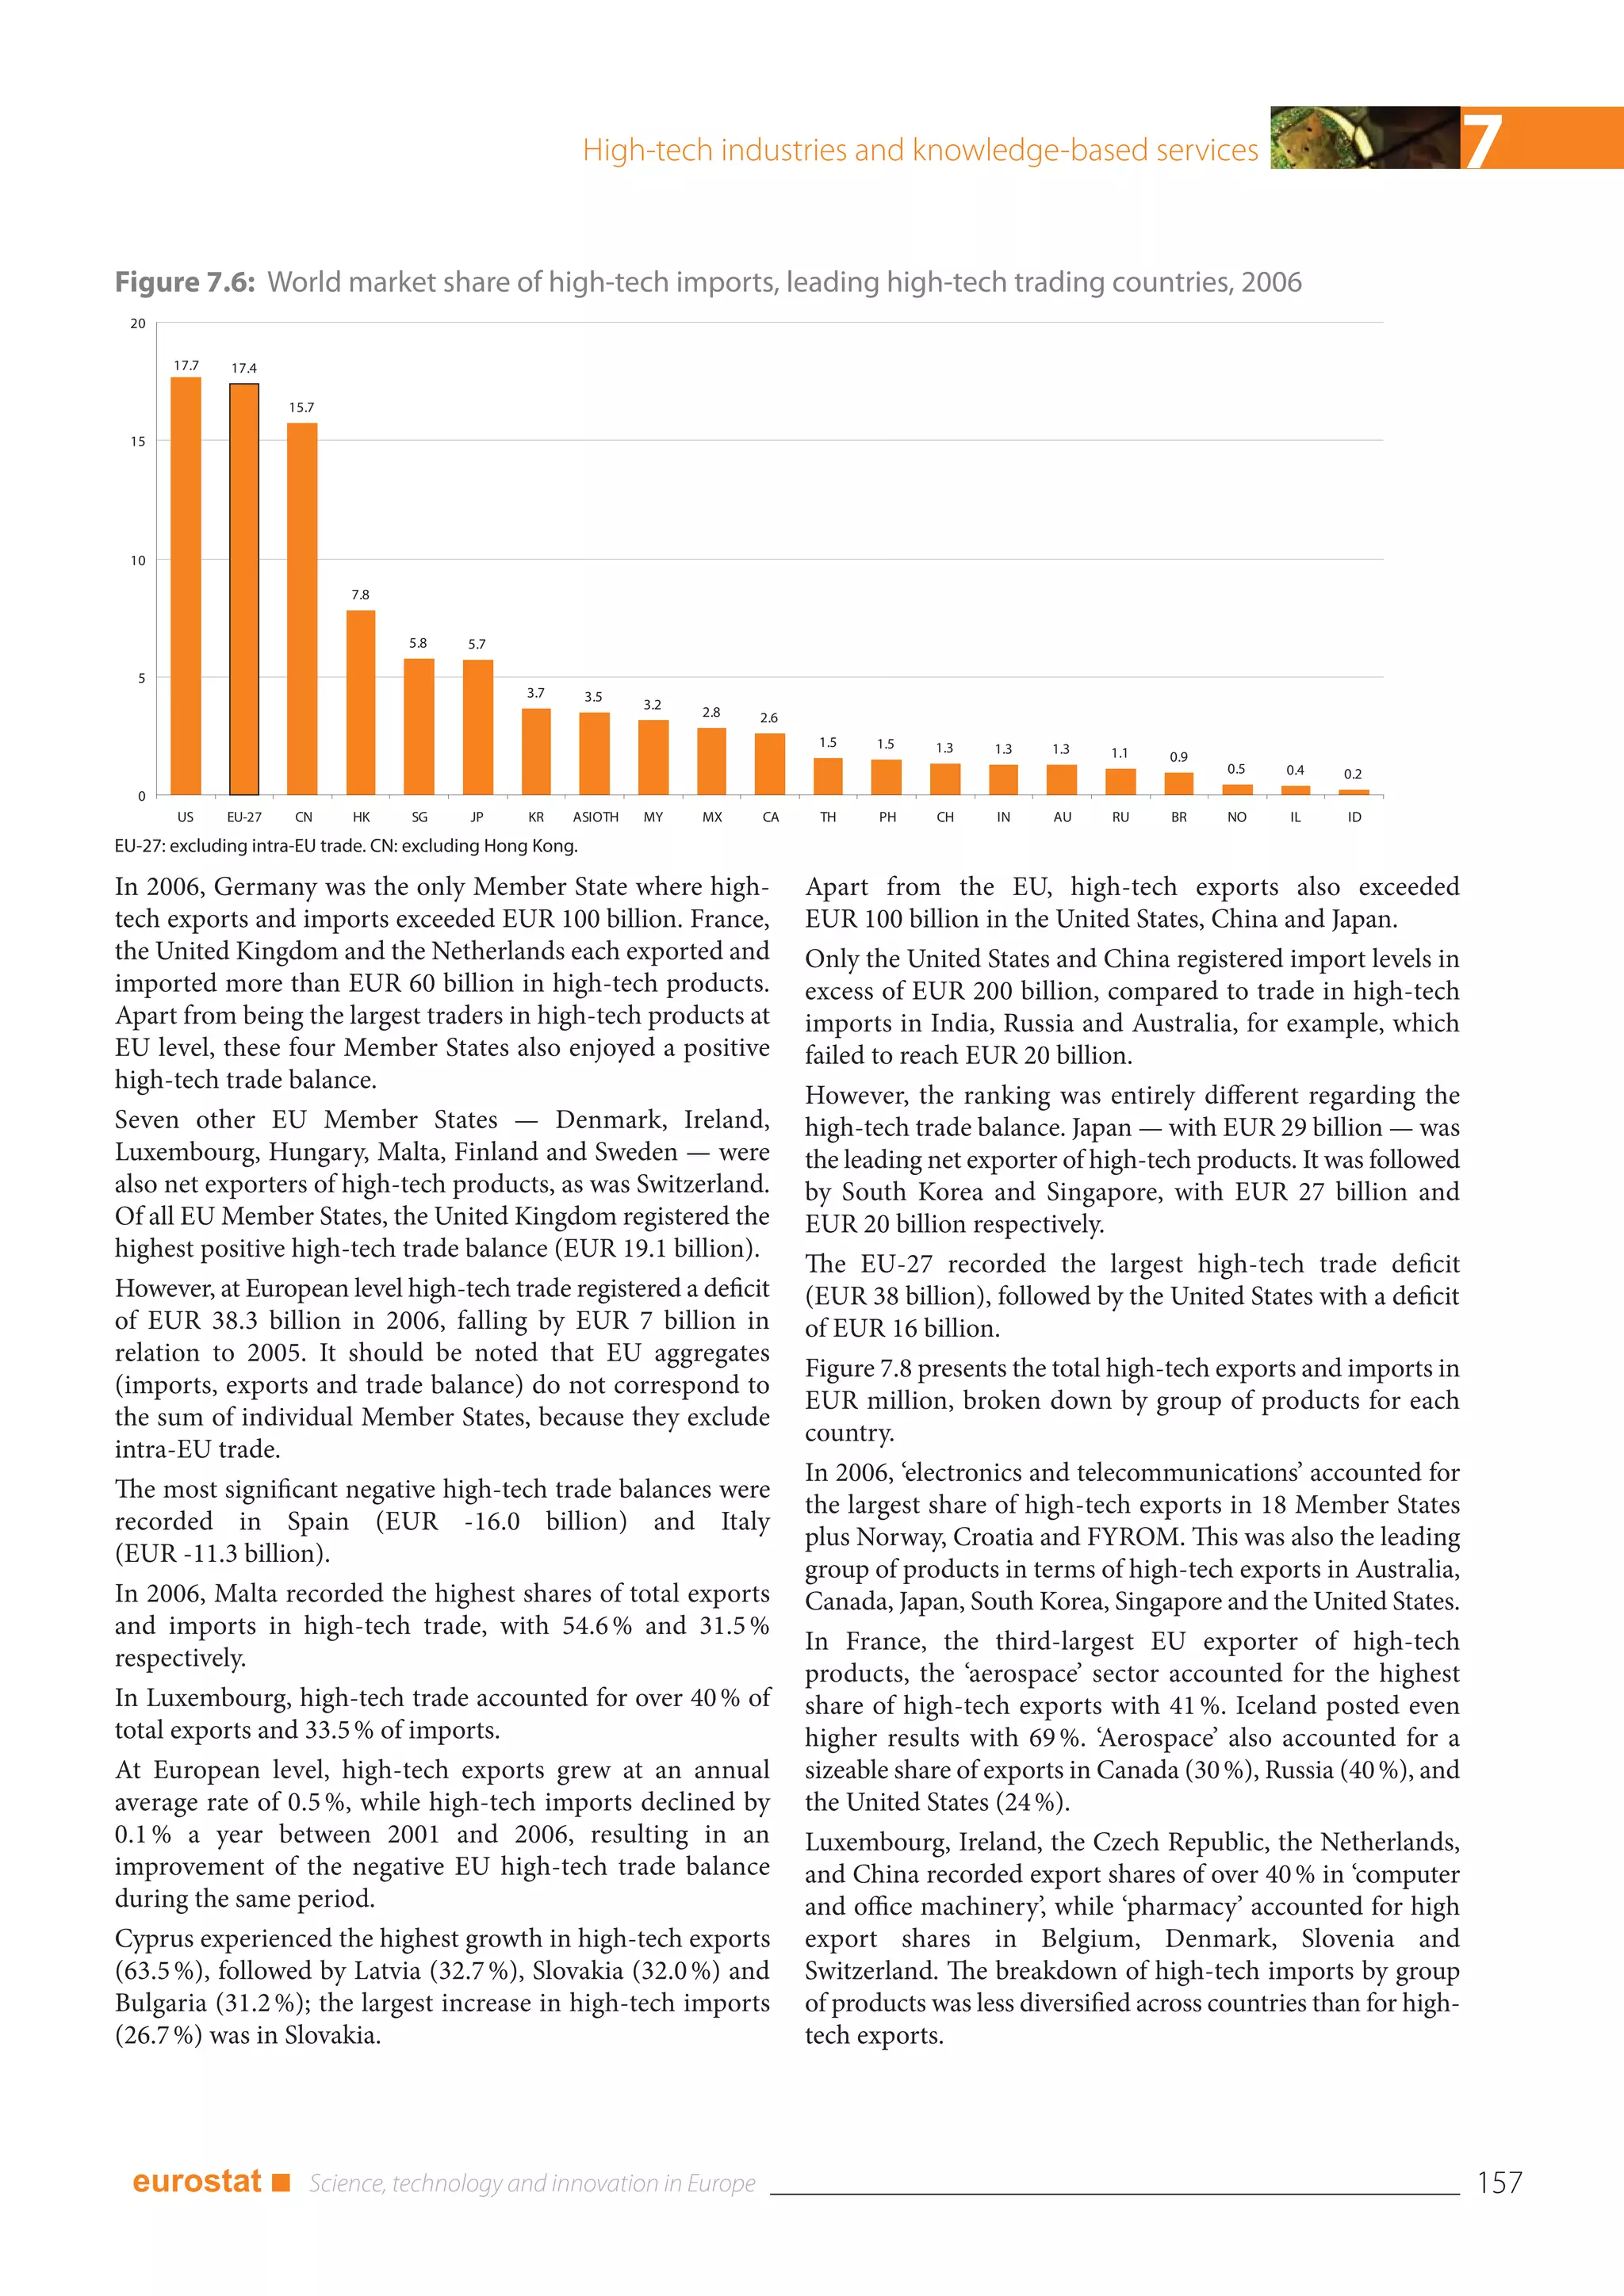
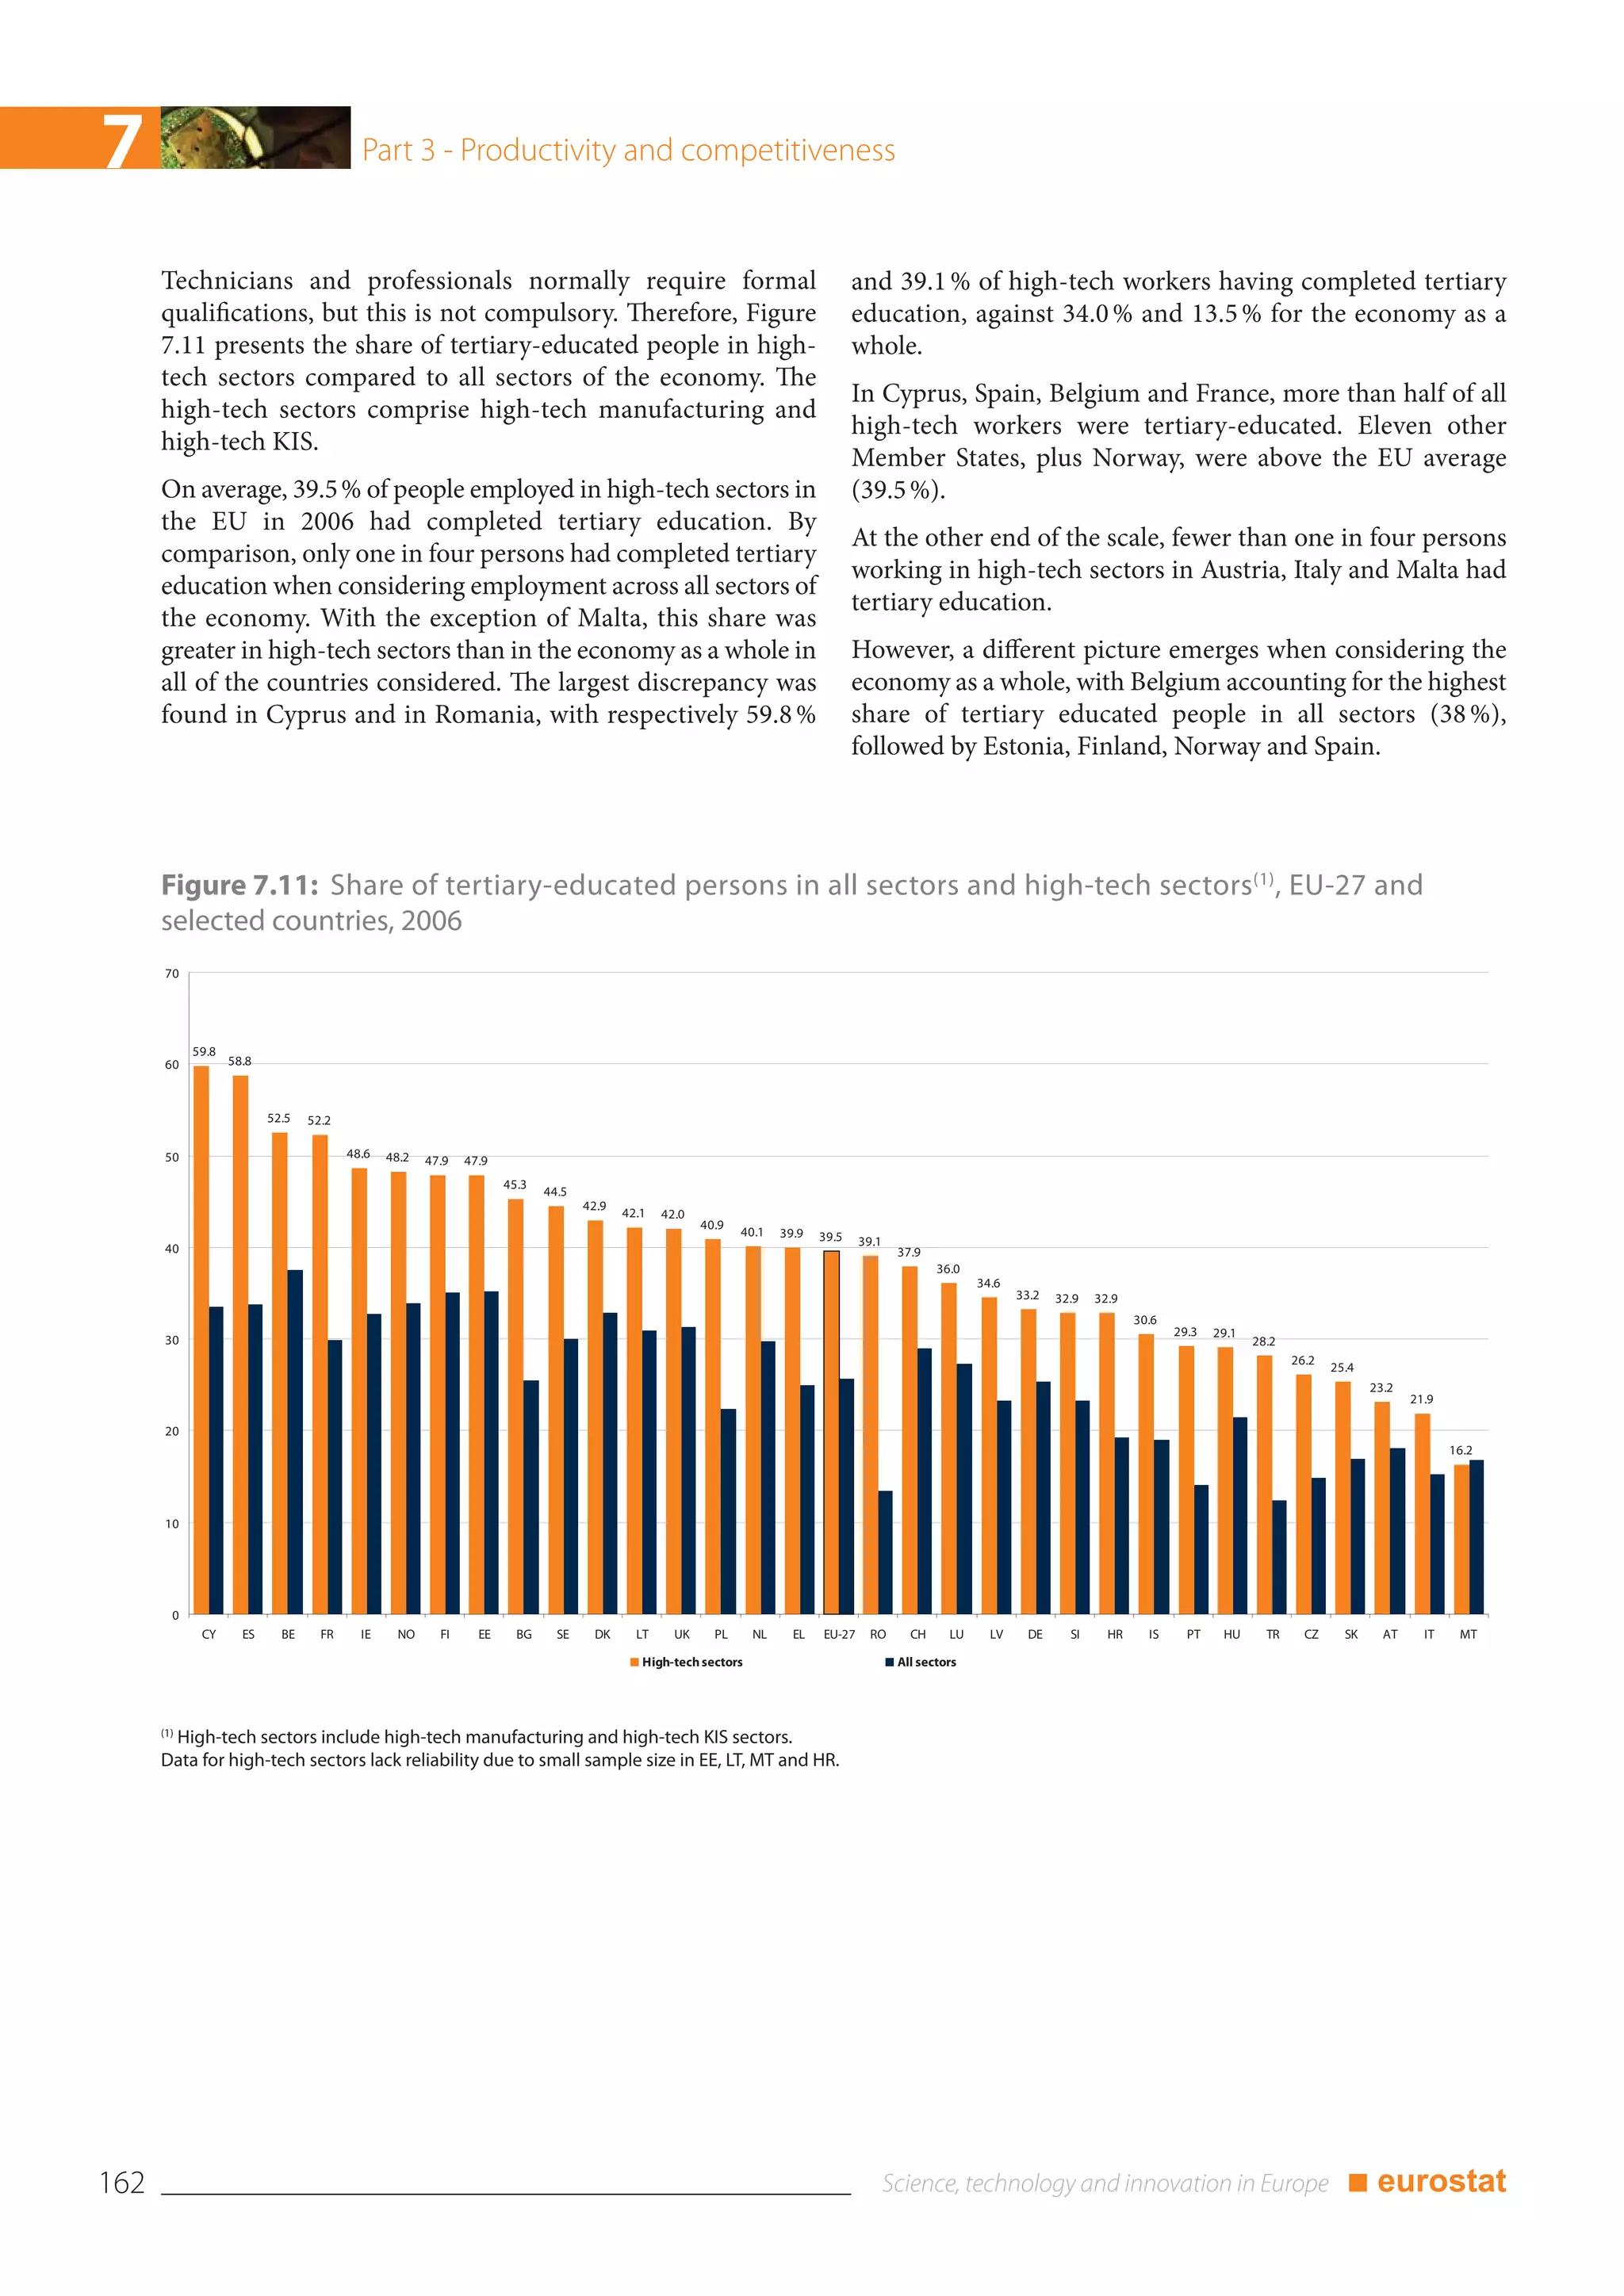
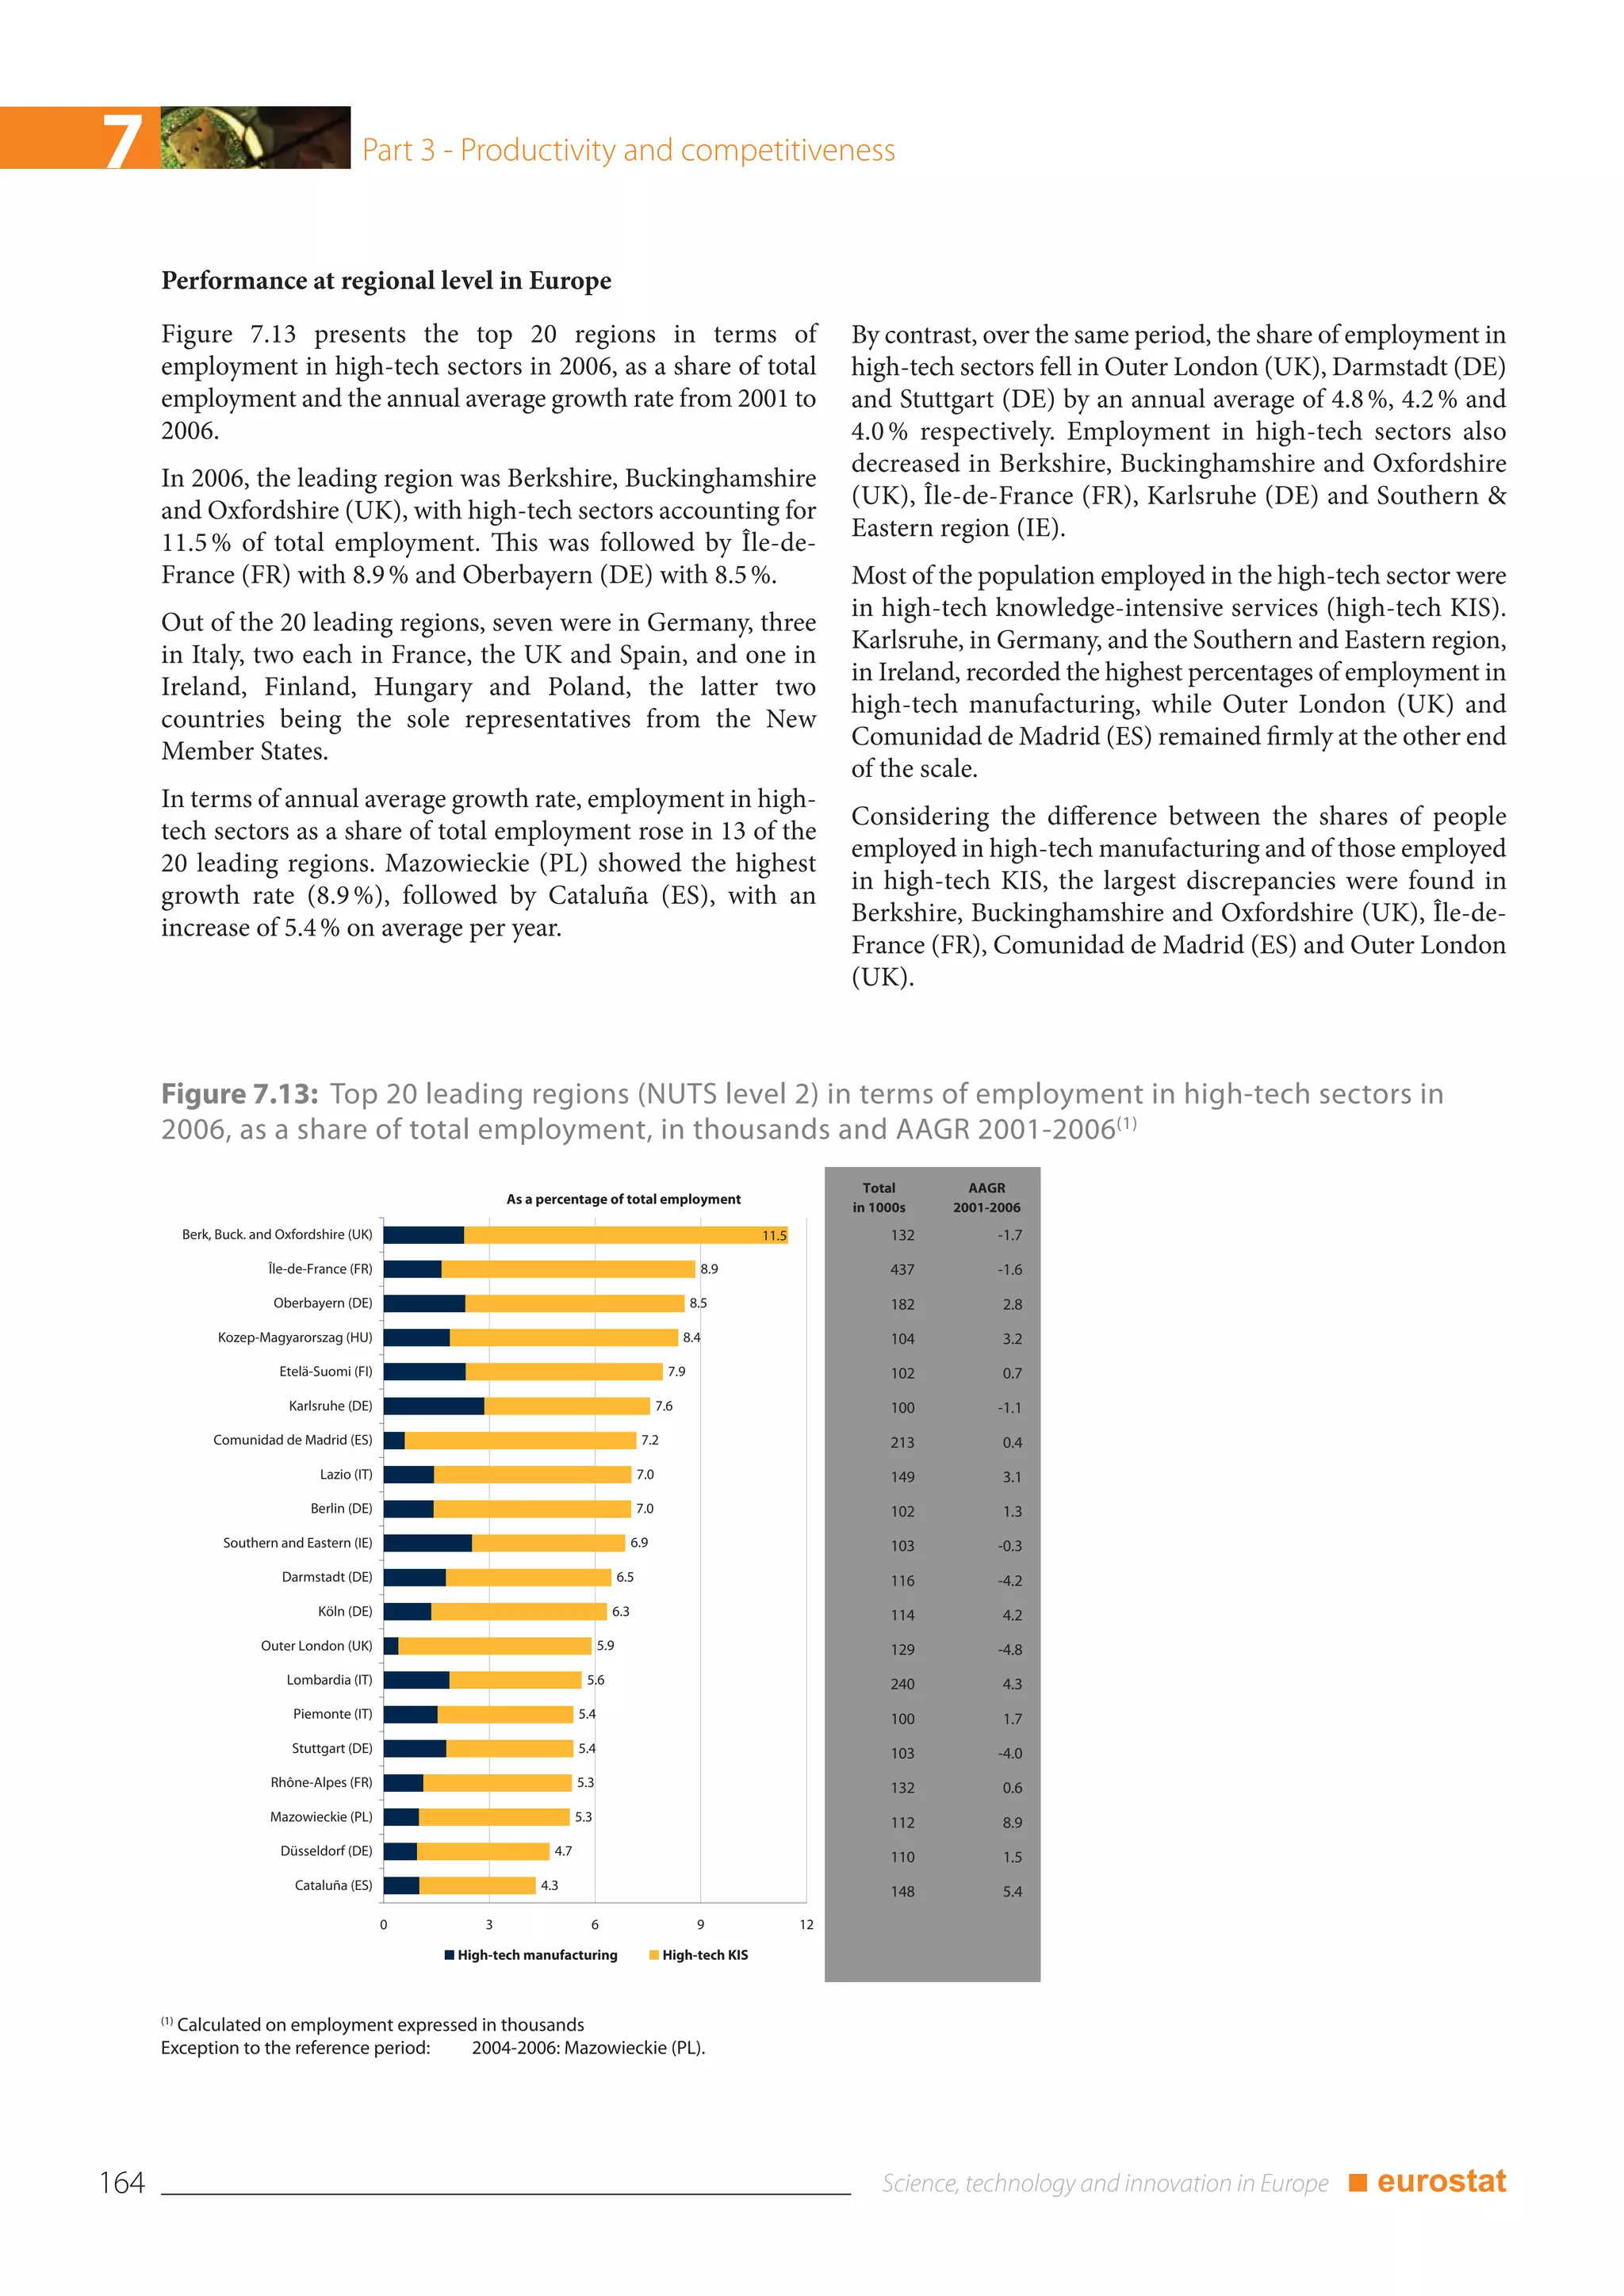
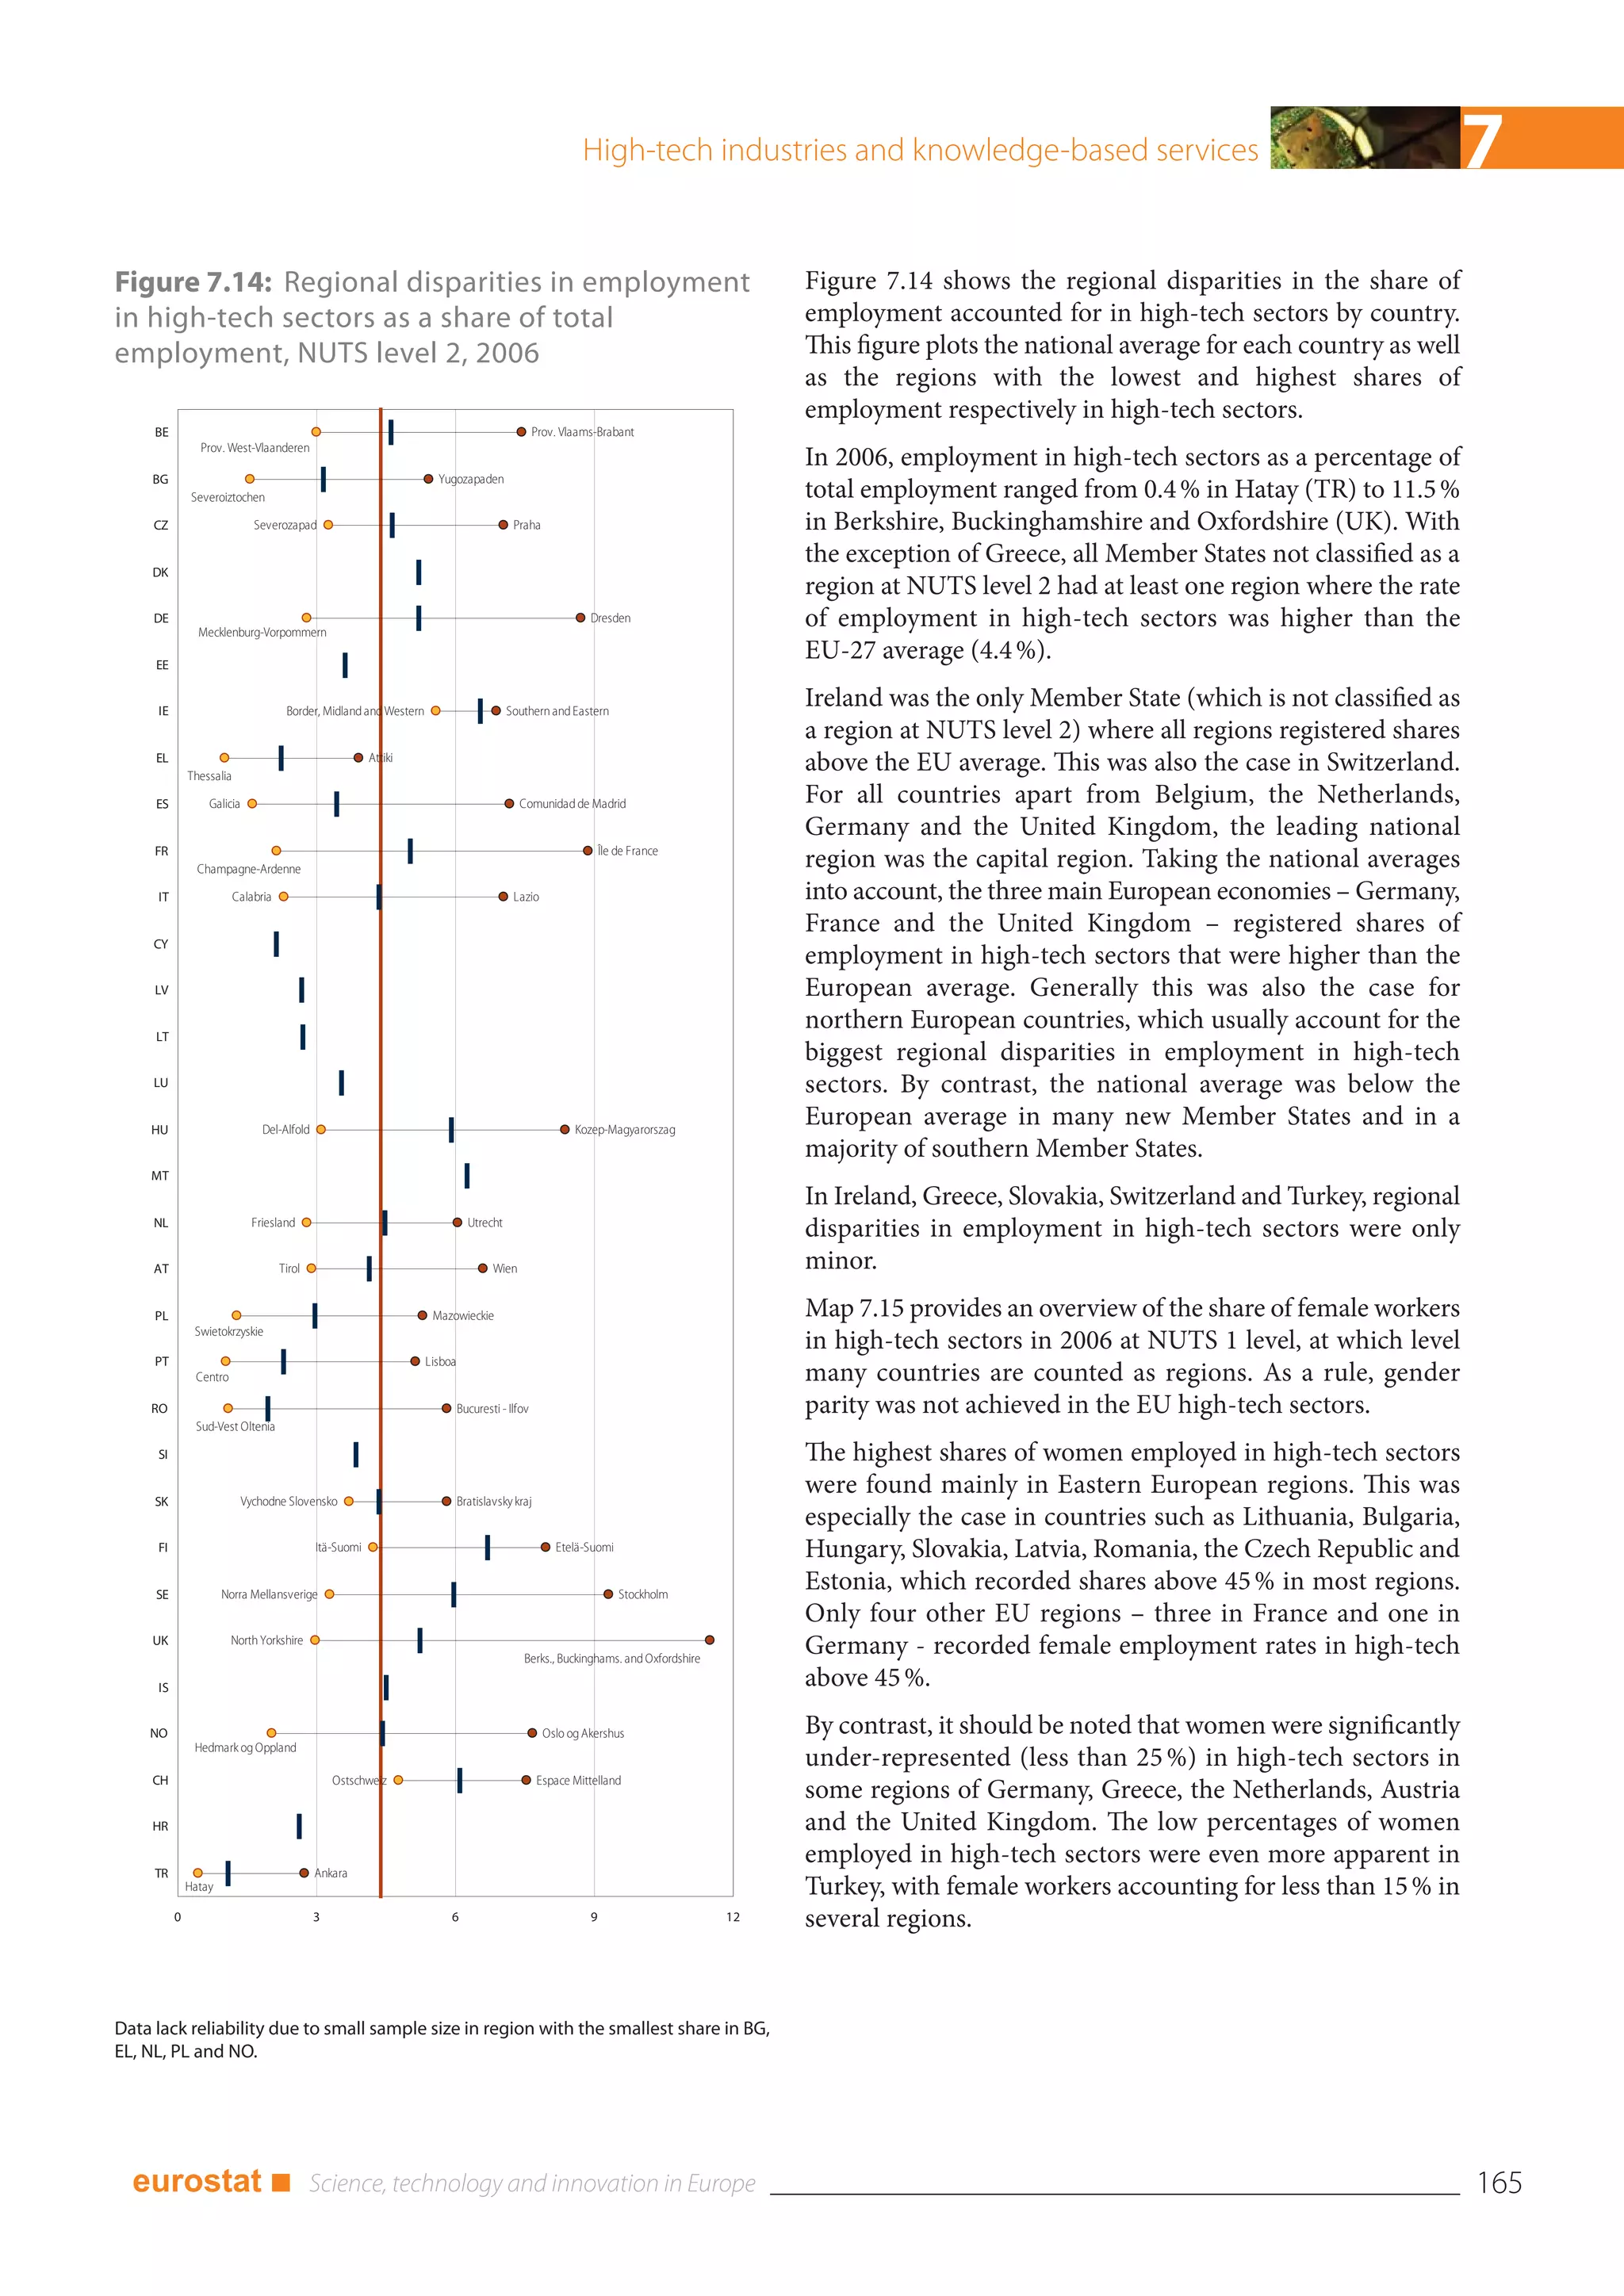
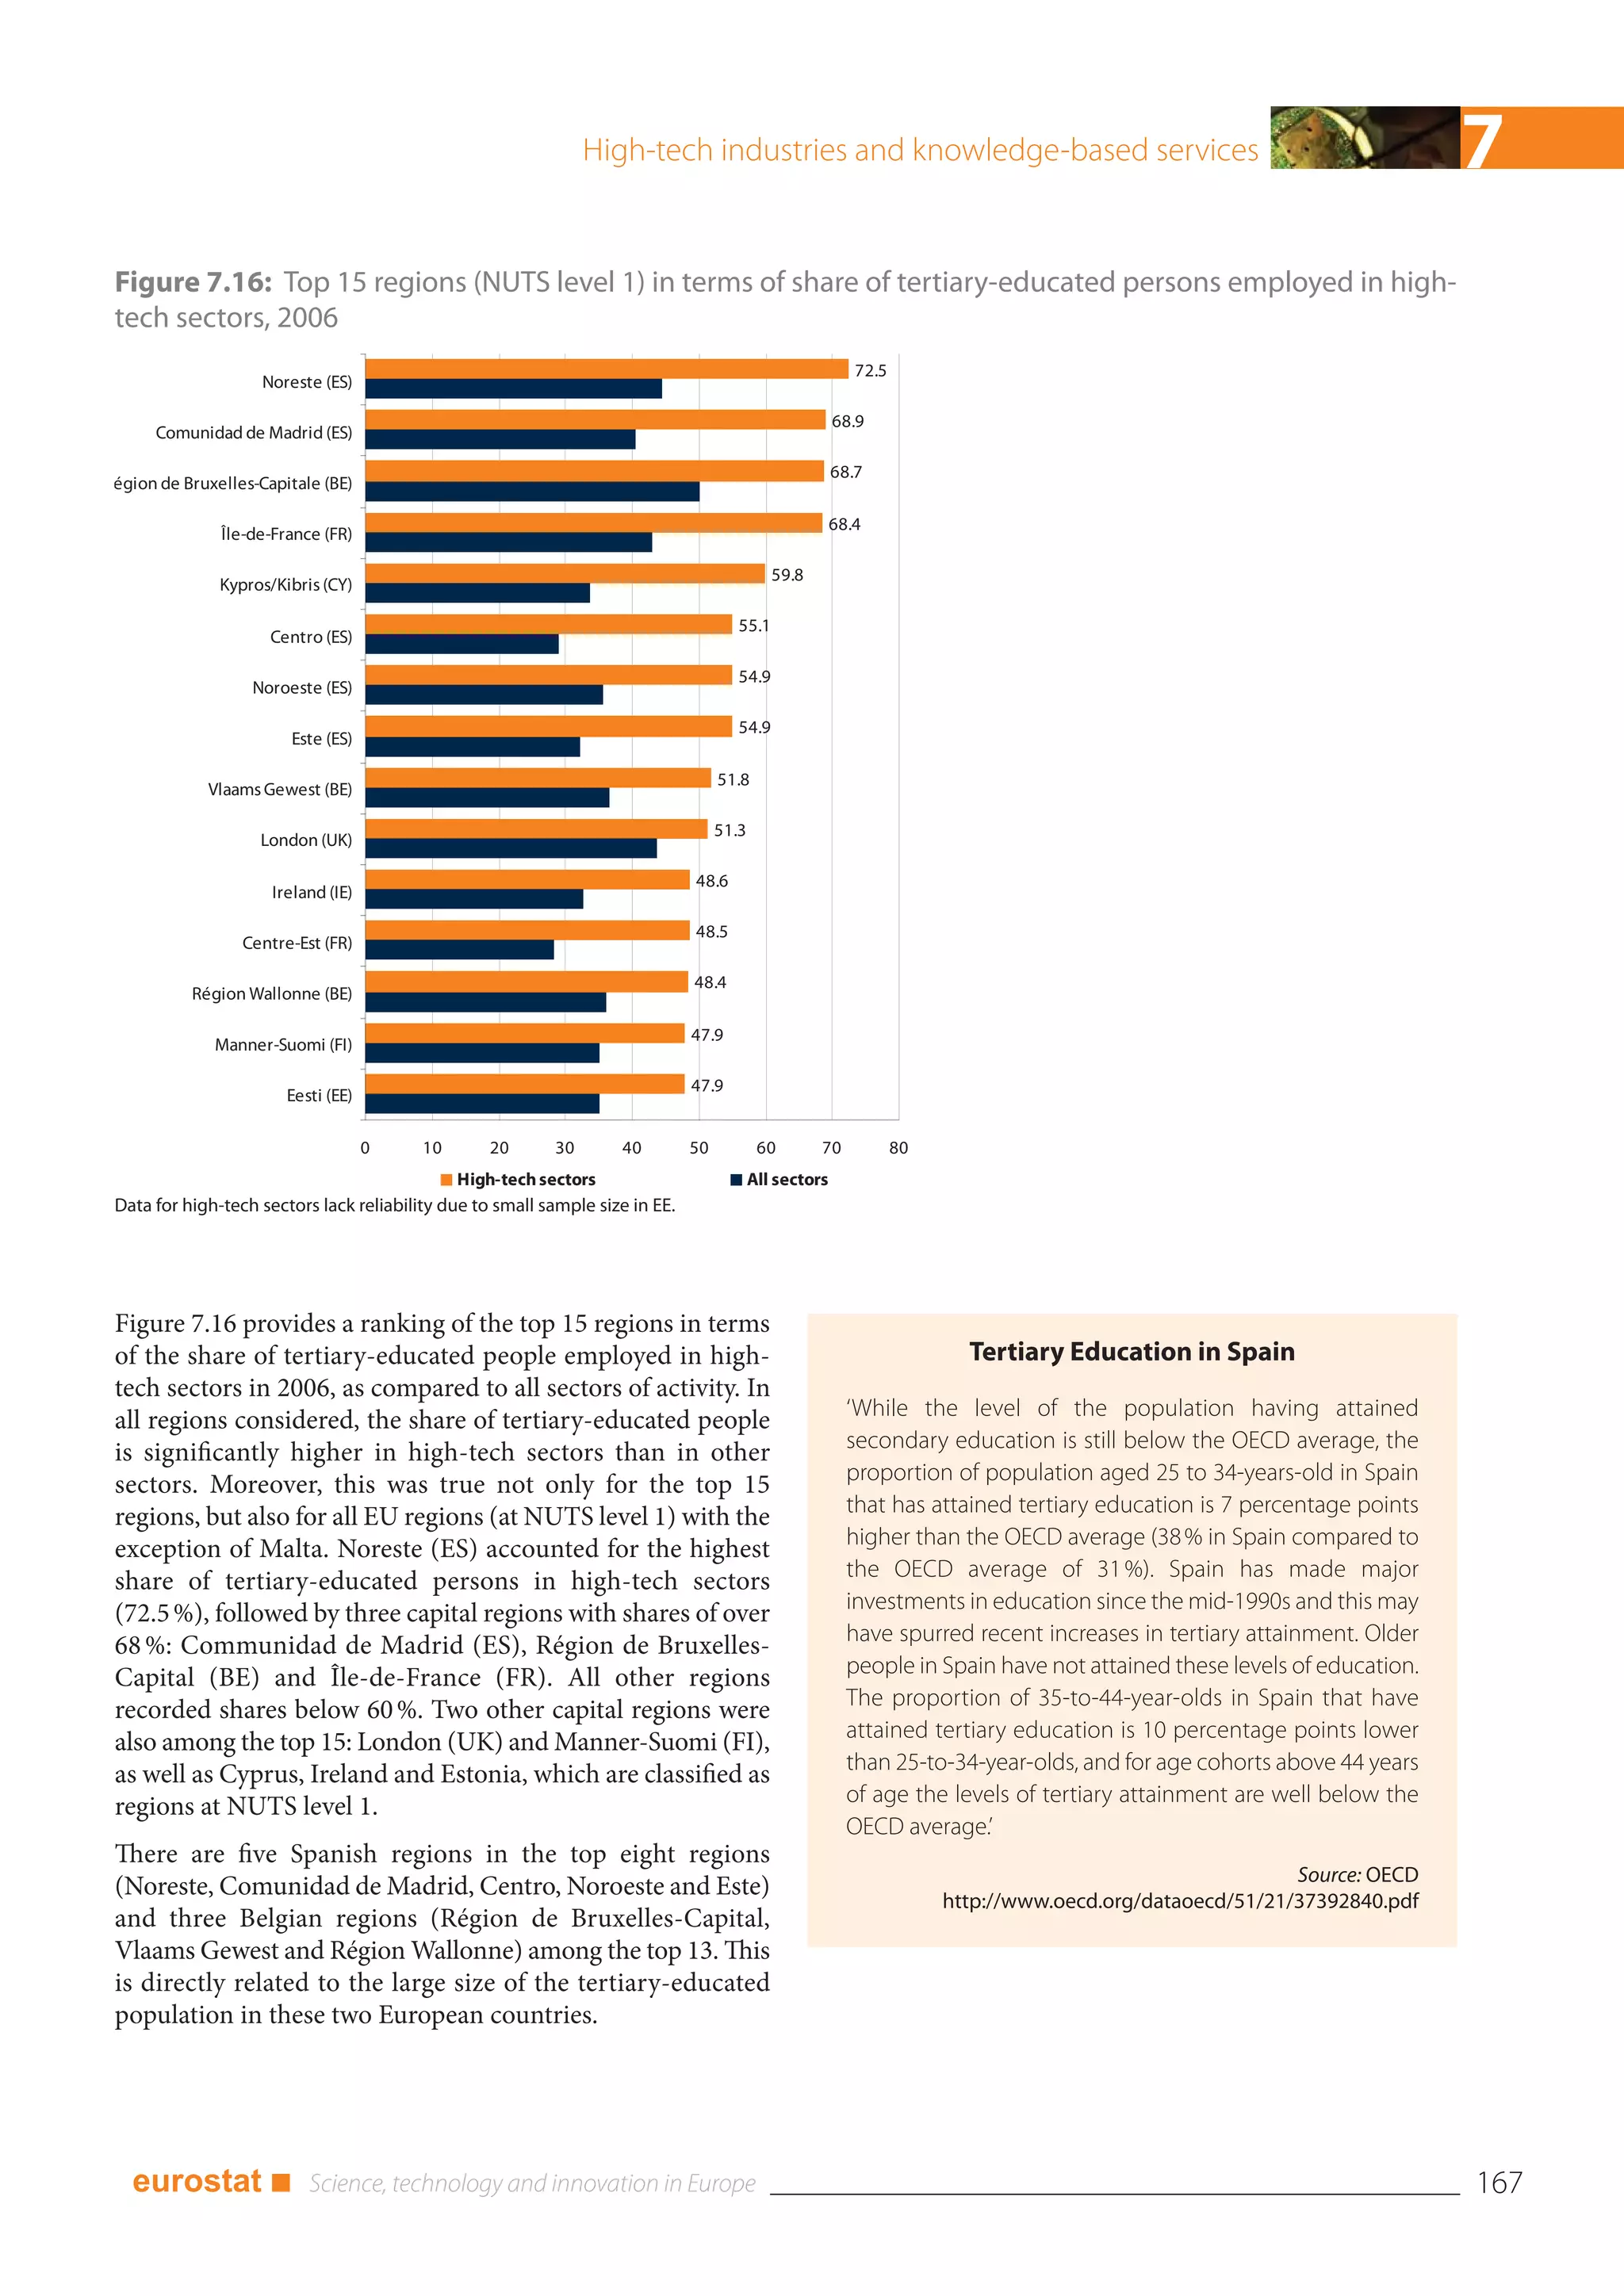
![5 Part 3 - Productivity and competitiveness
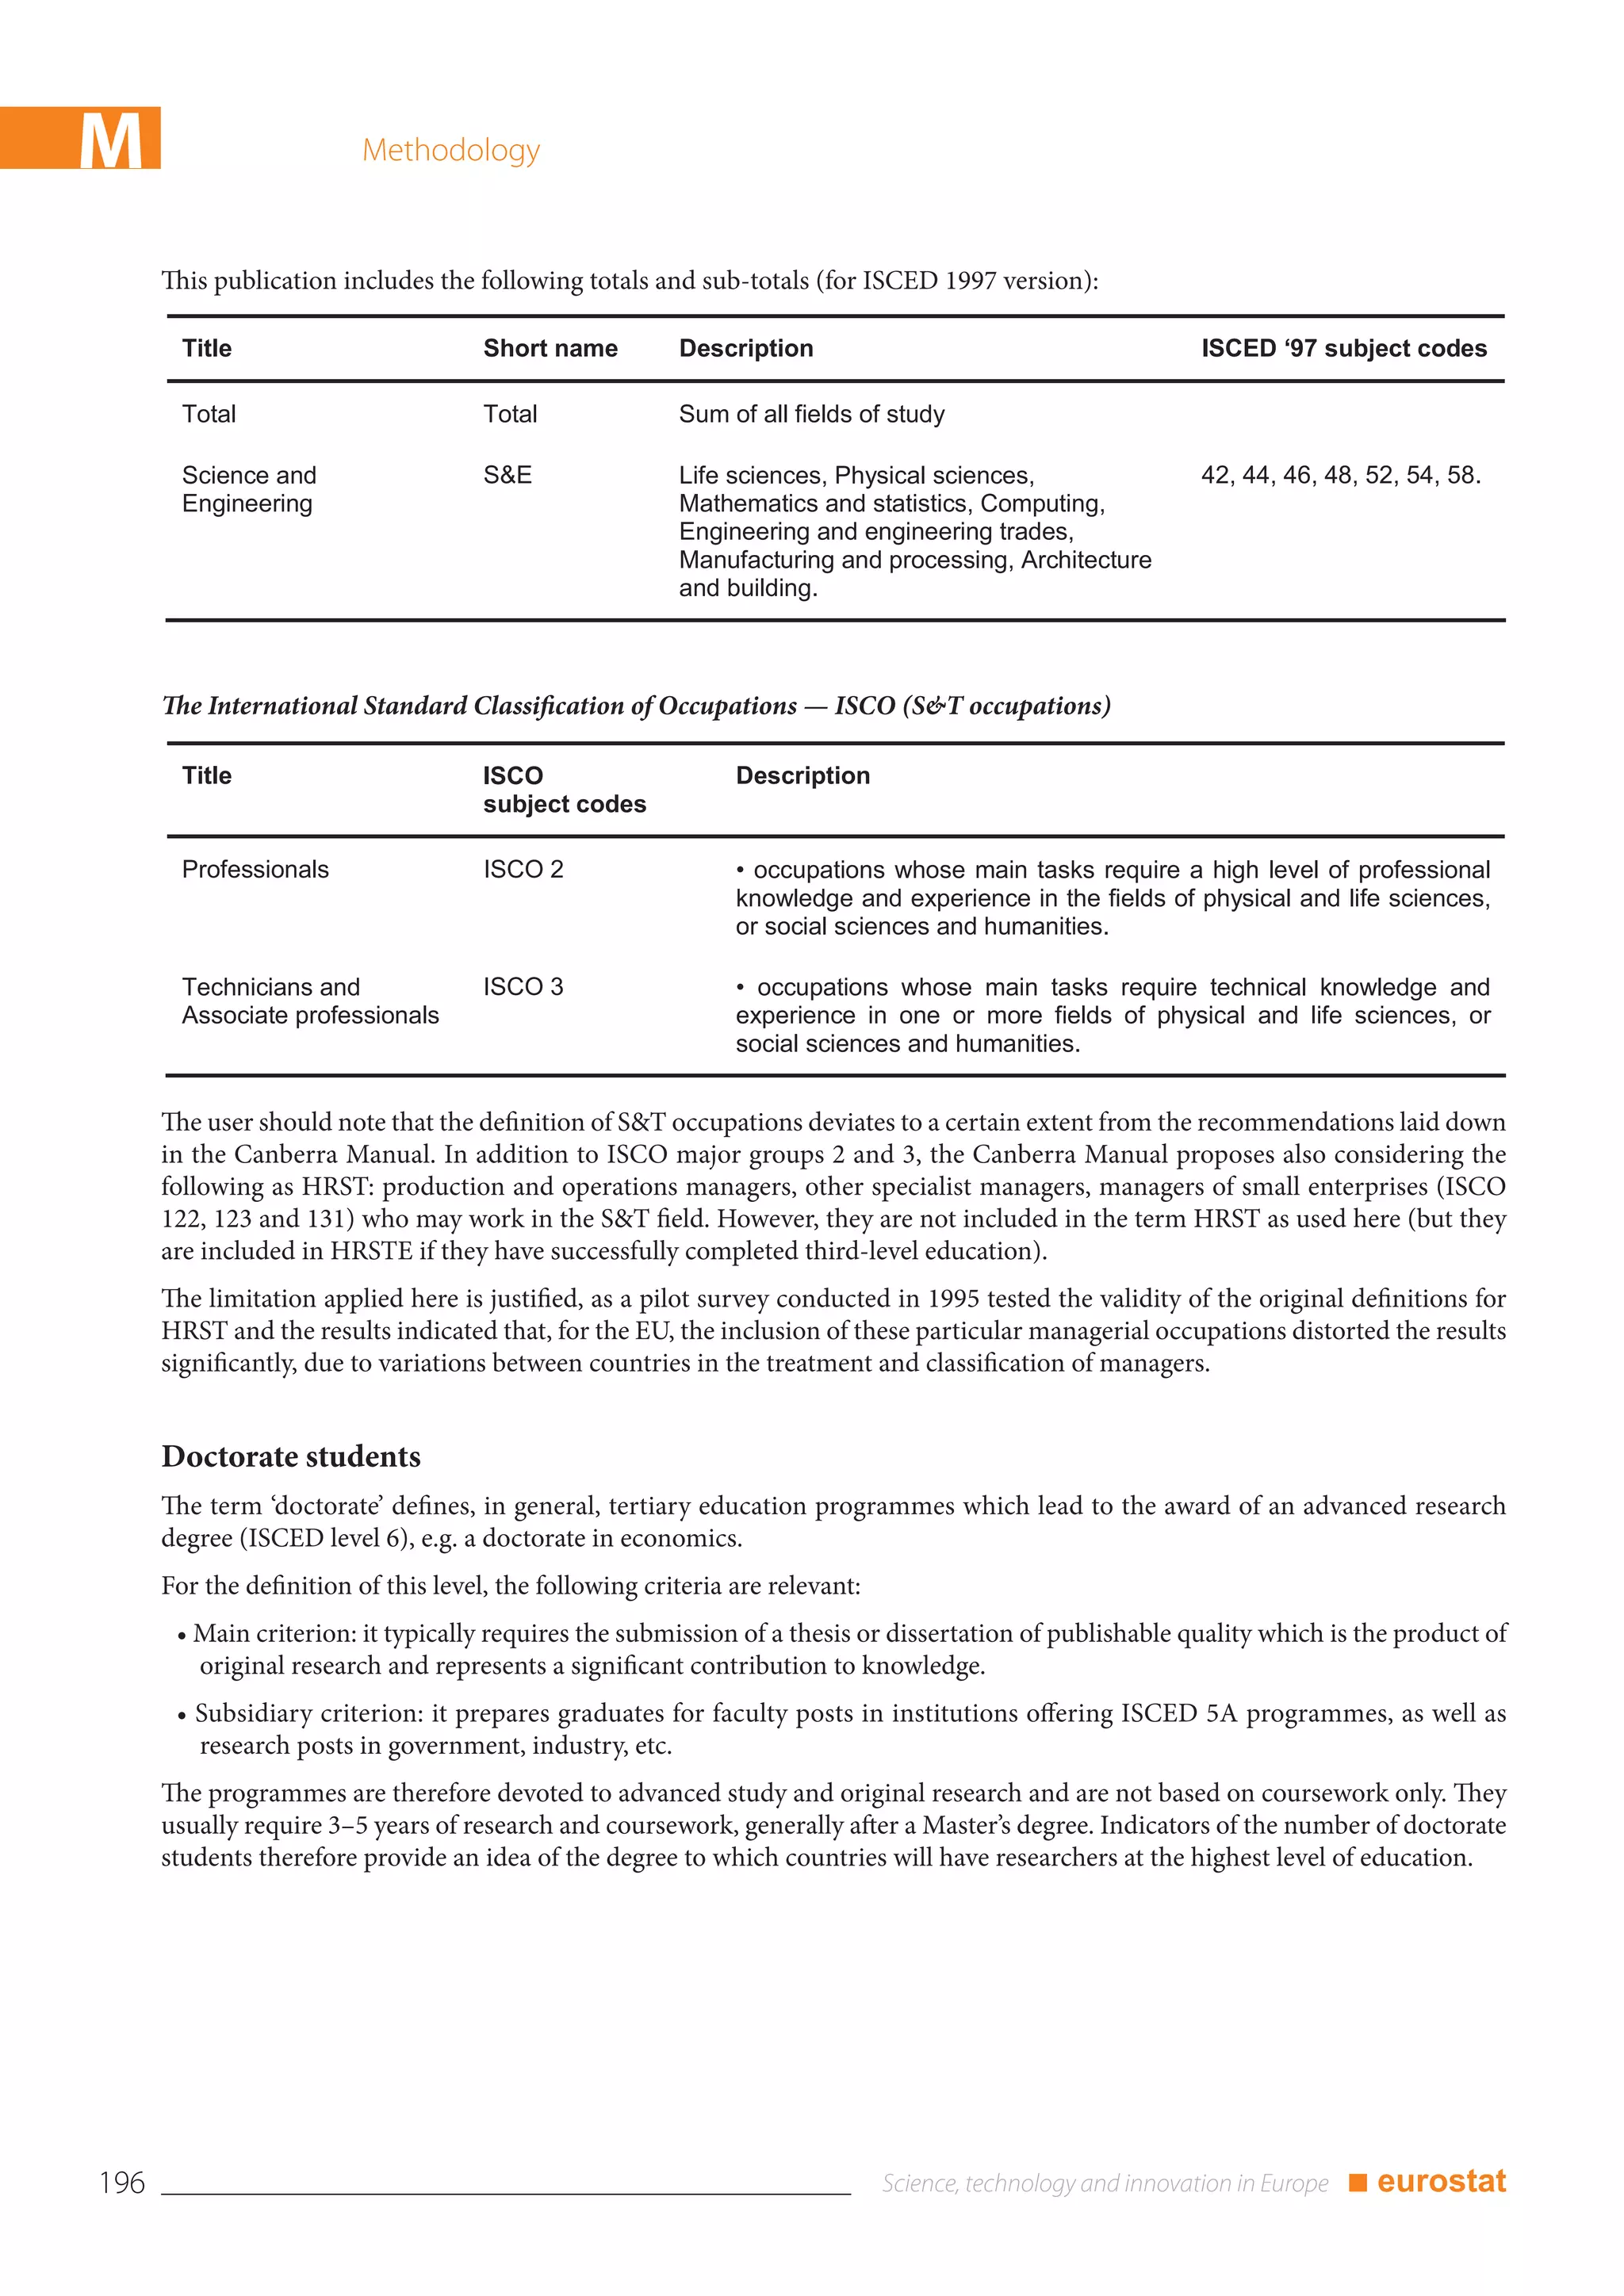
European Institute of Innovation and Technology (EIT) begins its work
The European Institute of Innovation and Technology (EIT), the EU's flagship initiative for boosting innovation in Europe, has marked
the launch of its activities with the first meeting of its recently appointed Governing Board on 15 September 2008. The meeting took
place in the Institute's host city of Budapest […]
At the meeting, the Governing Board members unanimously elected Prof. Dr. Martin Schuurmans, a Professor of Physics and former
Executive Vice President of Philips Research, as Chairman of the EIT's independent decision making body.
EIT: Mission and main features
Innovation is the key to growth, competitiveness and thus social well-being in the 21st century.
The European Institute of Innovation and Technology (EIT) is a new initiative which aims to become a flagship for excellence in
European innovation in order to face the challenges of globalisation.
Although Europe already has excellent education and research institutions, their representatives are often isolated from the business
world and do not obtain together the ‘critical mass’ necessary for innovation.
The EIT is the first European initiative to integrate fully the three sides of the ‘Knowledge Triangle’ (Higher Education, Research,
Business-Innovation) and will seek to stand out as a world-class innovation-orientated reference model, inspiring and driving change
in existing education and research institutions.
By boosting the EU's capacity to transform education and research results into tangible commercial innovation opportunities, the
EIT will further bridge the innovation gap between the EU and its major international competitors.
The EIT will favour sustainable economic growth and job creation throughout the Union by generating new products, services and
markets responding both to public demand and to the needs of the knowledge economy.
Based on partnerships known as ‘Knowledge and Innovation Communities’ (KICs) – highly integrated public-private networks of
universities, research organisations and businesses – the EIT's activities will be coordinated by a Governing Board ensuring its
strategic management. Direct involvement of business stakeholders, including SMEs, in all strategic, operational and financial aspects
of the Institute is the cornerstone of the initiative.
The EIT: transforming innovative ideas into reality.
Serving the EU’s strategic priorities
Operating across Europe, the KICs will be selected by the EIT Governing Board on a strategic basis as responses to the foremost
challenges currently facing the Union. The first areas covered by the Institute are likely to include -amongst others - climate change,
renewable energies and the next generation of information and communication technologies. […]
Connecting European business and research
Businesses stand to gain as they will be given fresh opportunities to commercialise the most up-to-date and relevant research
findings, potentially giving Europe first-mover advantage in the latest technological fields. In return, research organisations will
benefit from additional resources, an enhanced networking capacity and new research perspectives stressing interdisciplinary
approaches in areas with strong societal and economic importance.
Higher education and the EIT: a new approach to learning
Until now, higher education has notoriously been the absent member of innovation partnerships. However, new skills and talents
will be crucial to the concrete exploitation of Europe's innovation potential and the EIT will advocate the change of mindset required
to make this possible. […]
An incremental development path
The EIT represents a novel approach to innovation at the EU level. For this reason it needs to be set up gradually, based on a phased
implementation in view of its long-term development perspectives. During the first phase, two or three KICs will be established.
Subsequent partnerships will follow after the adoption of the first Strategic Innovation Agenda.
98 ■ eurostat](https://image.slidesharecdn.com/2009-09eurostatid27em-09-09-en-100113065936-phpapp01/75/2009-09-E-U-R-O-S-T-A-T-I-D-27-E-M-09-09-E-N-125-2048.jpg)


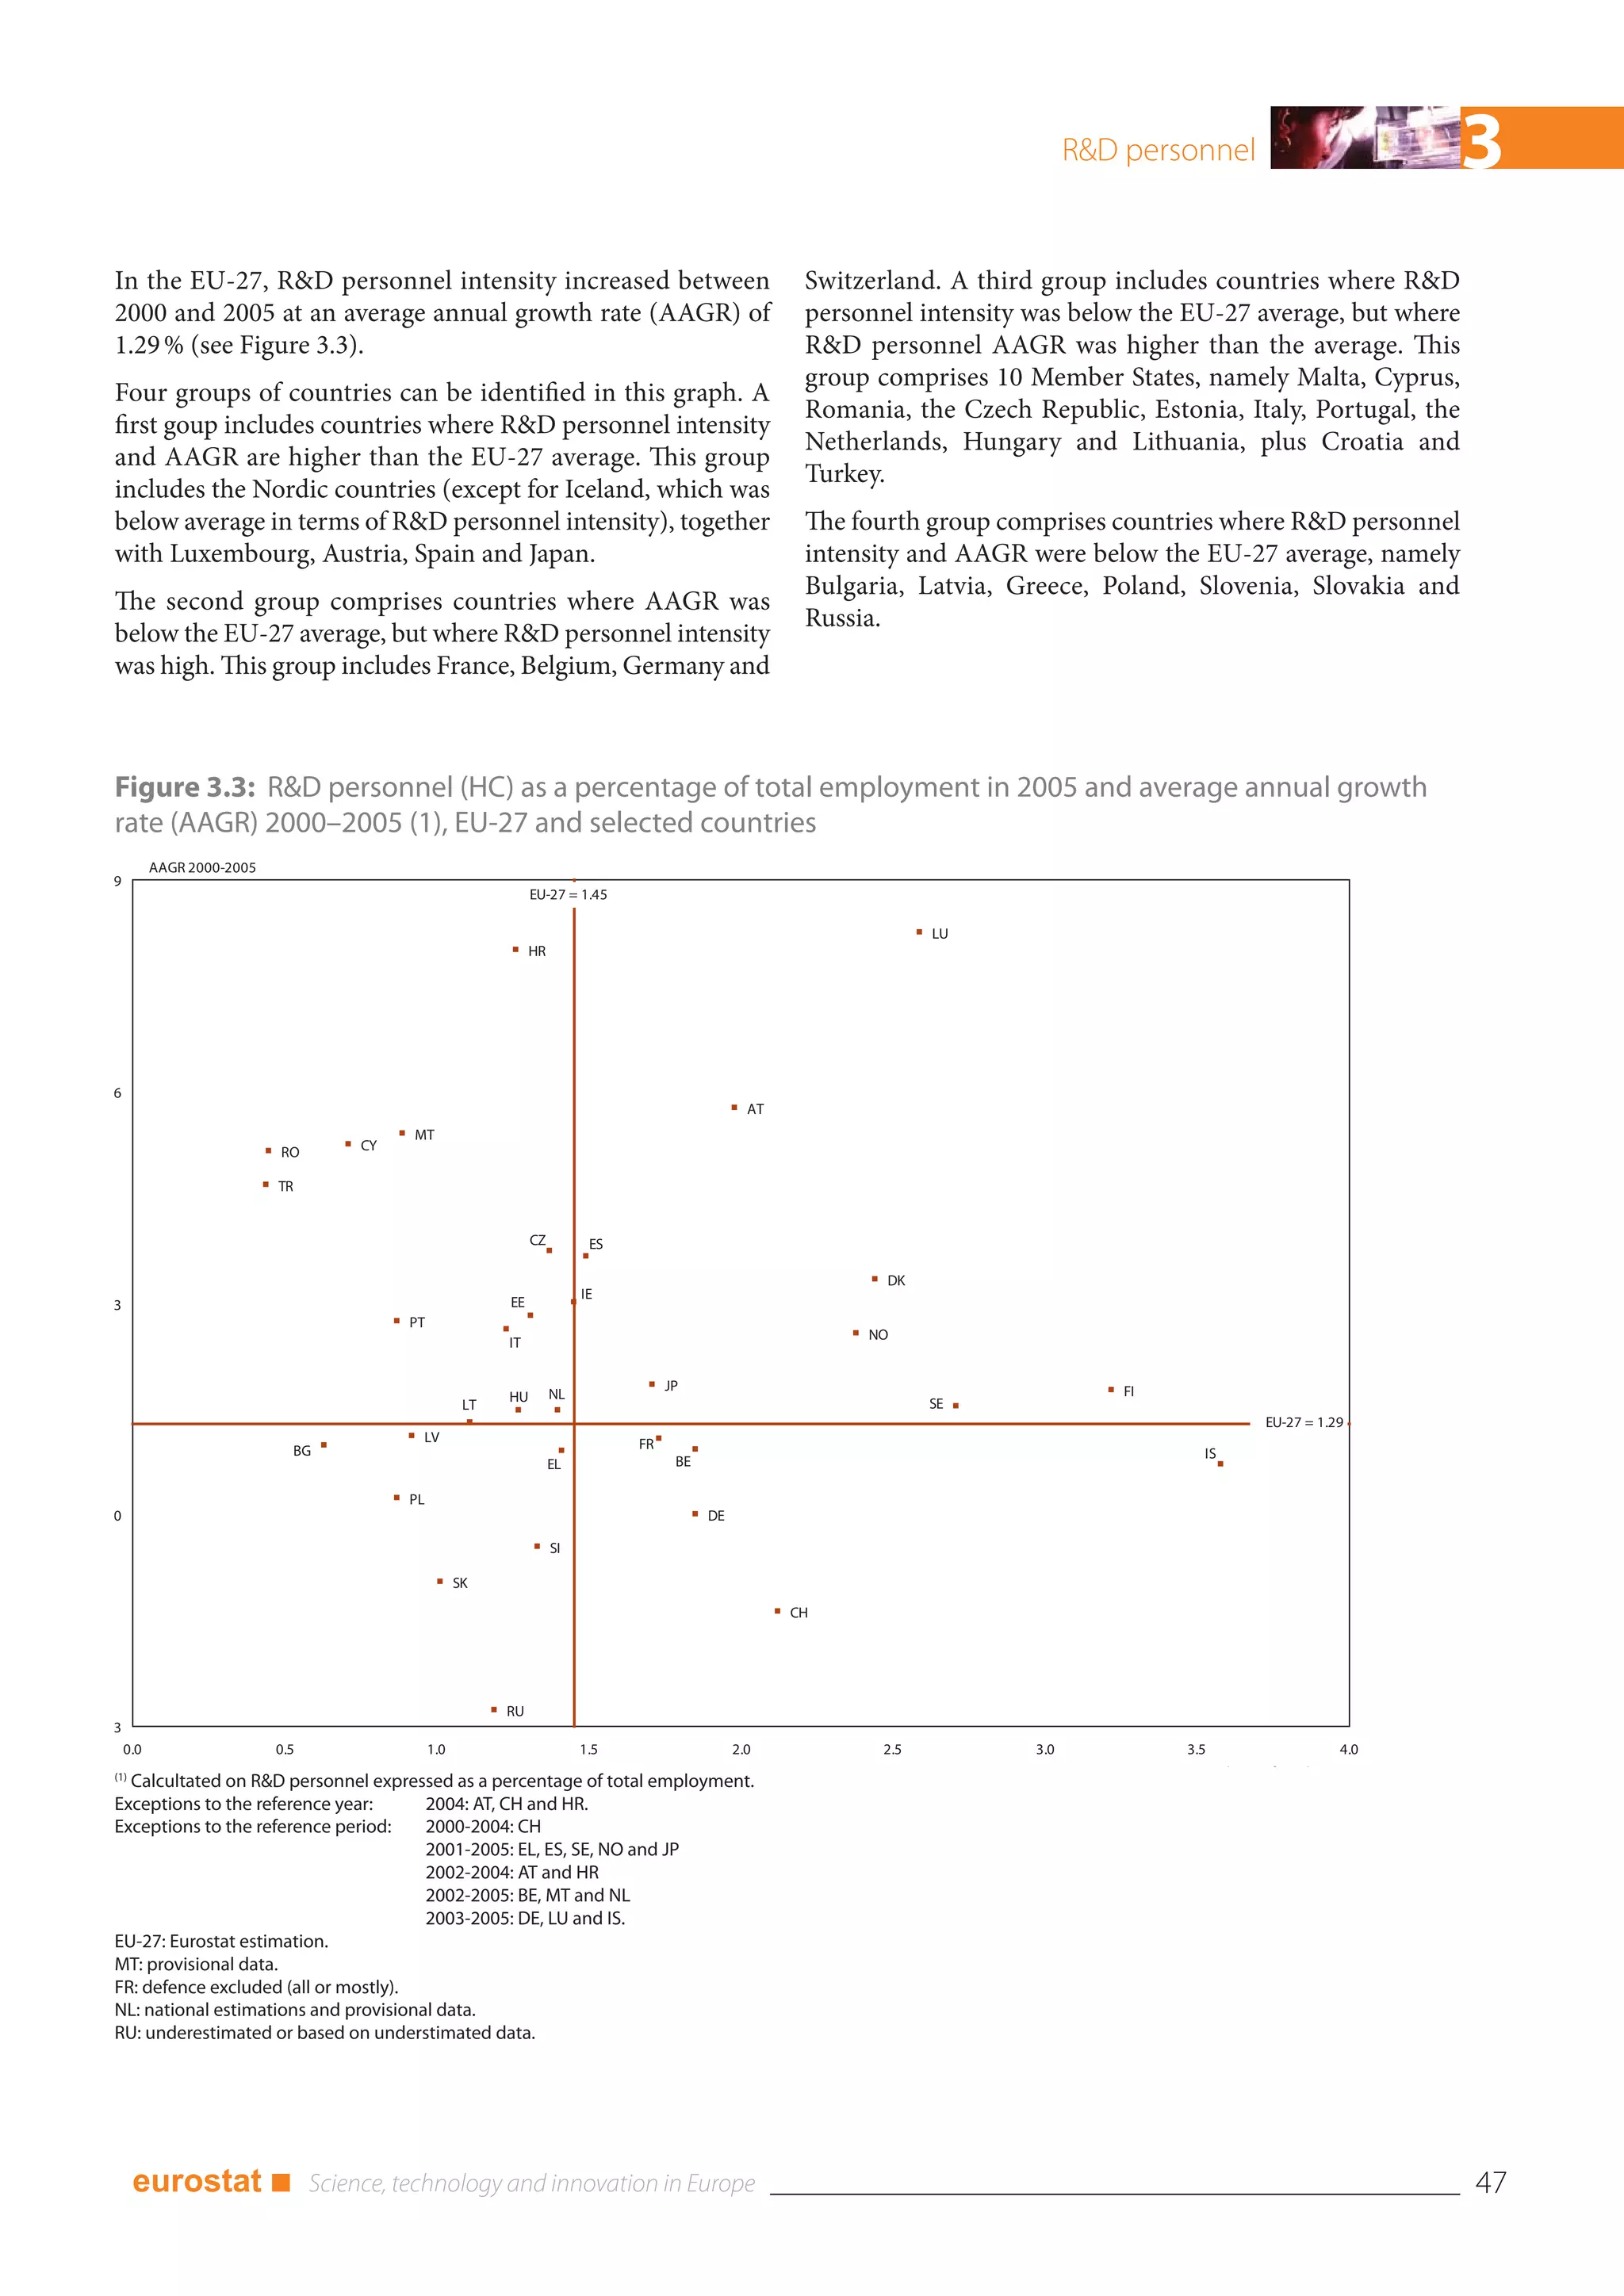
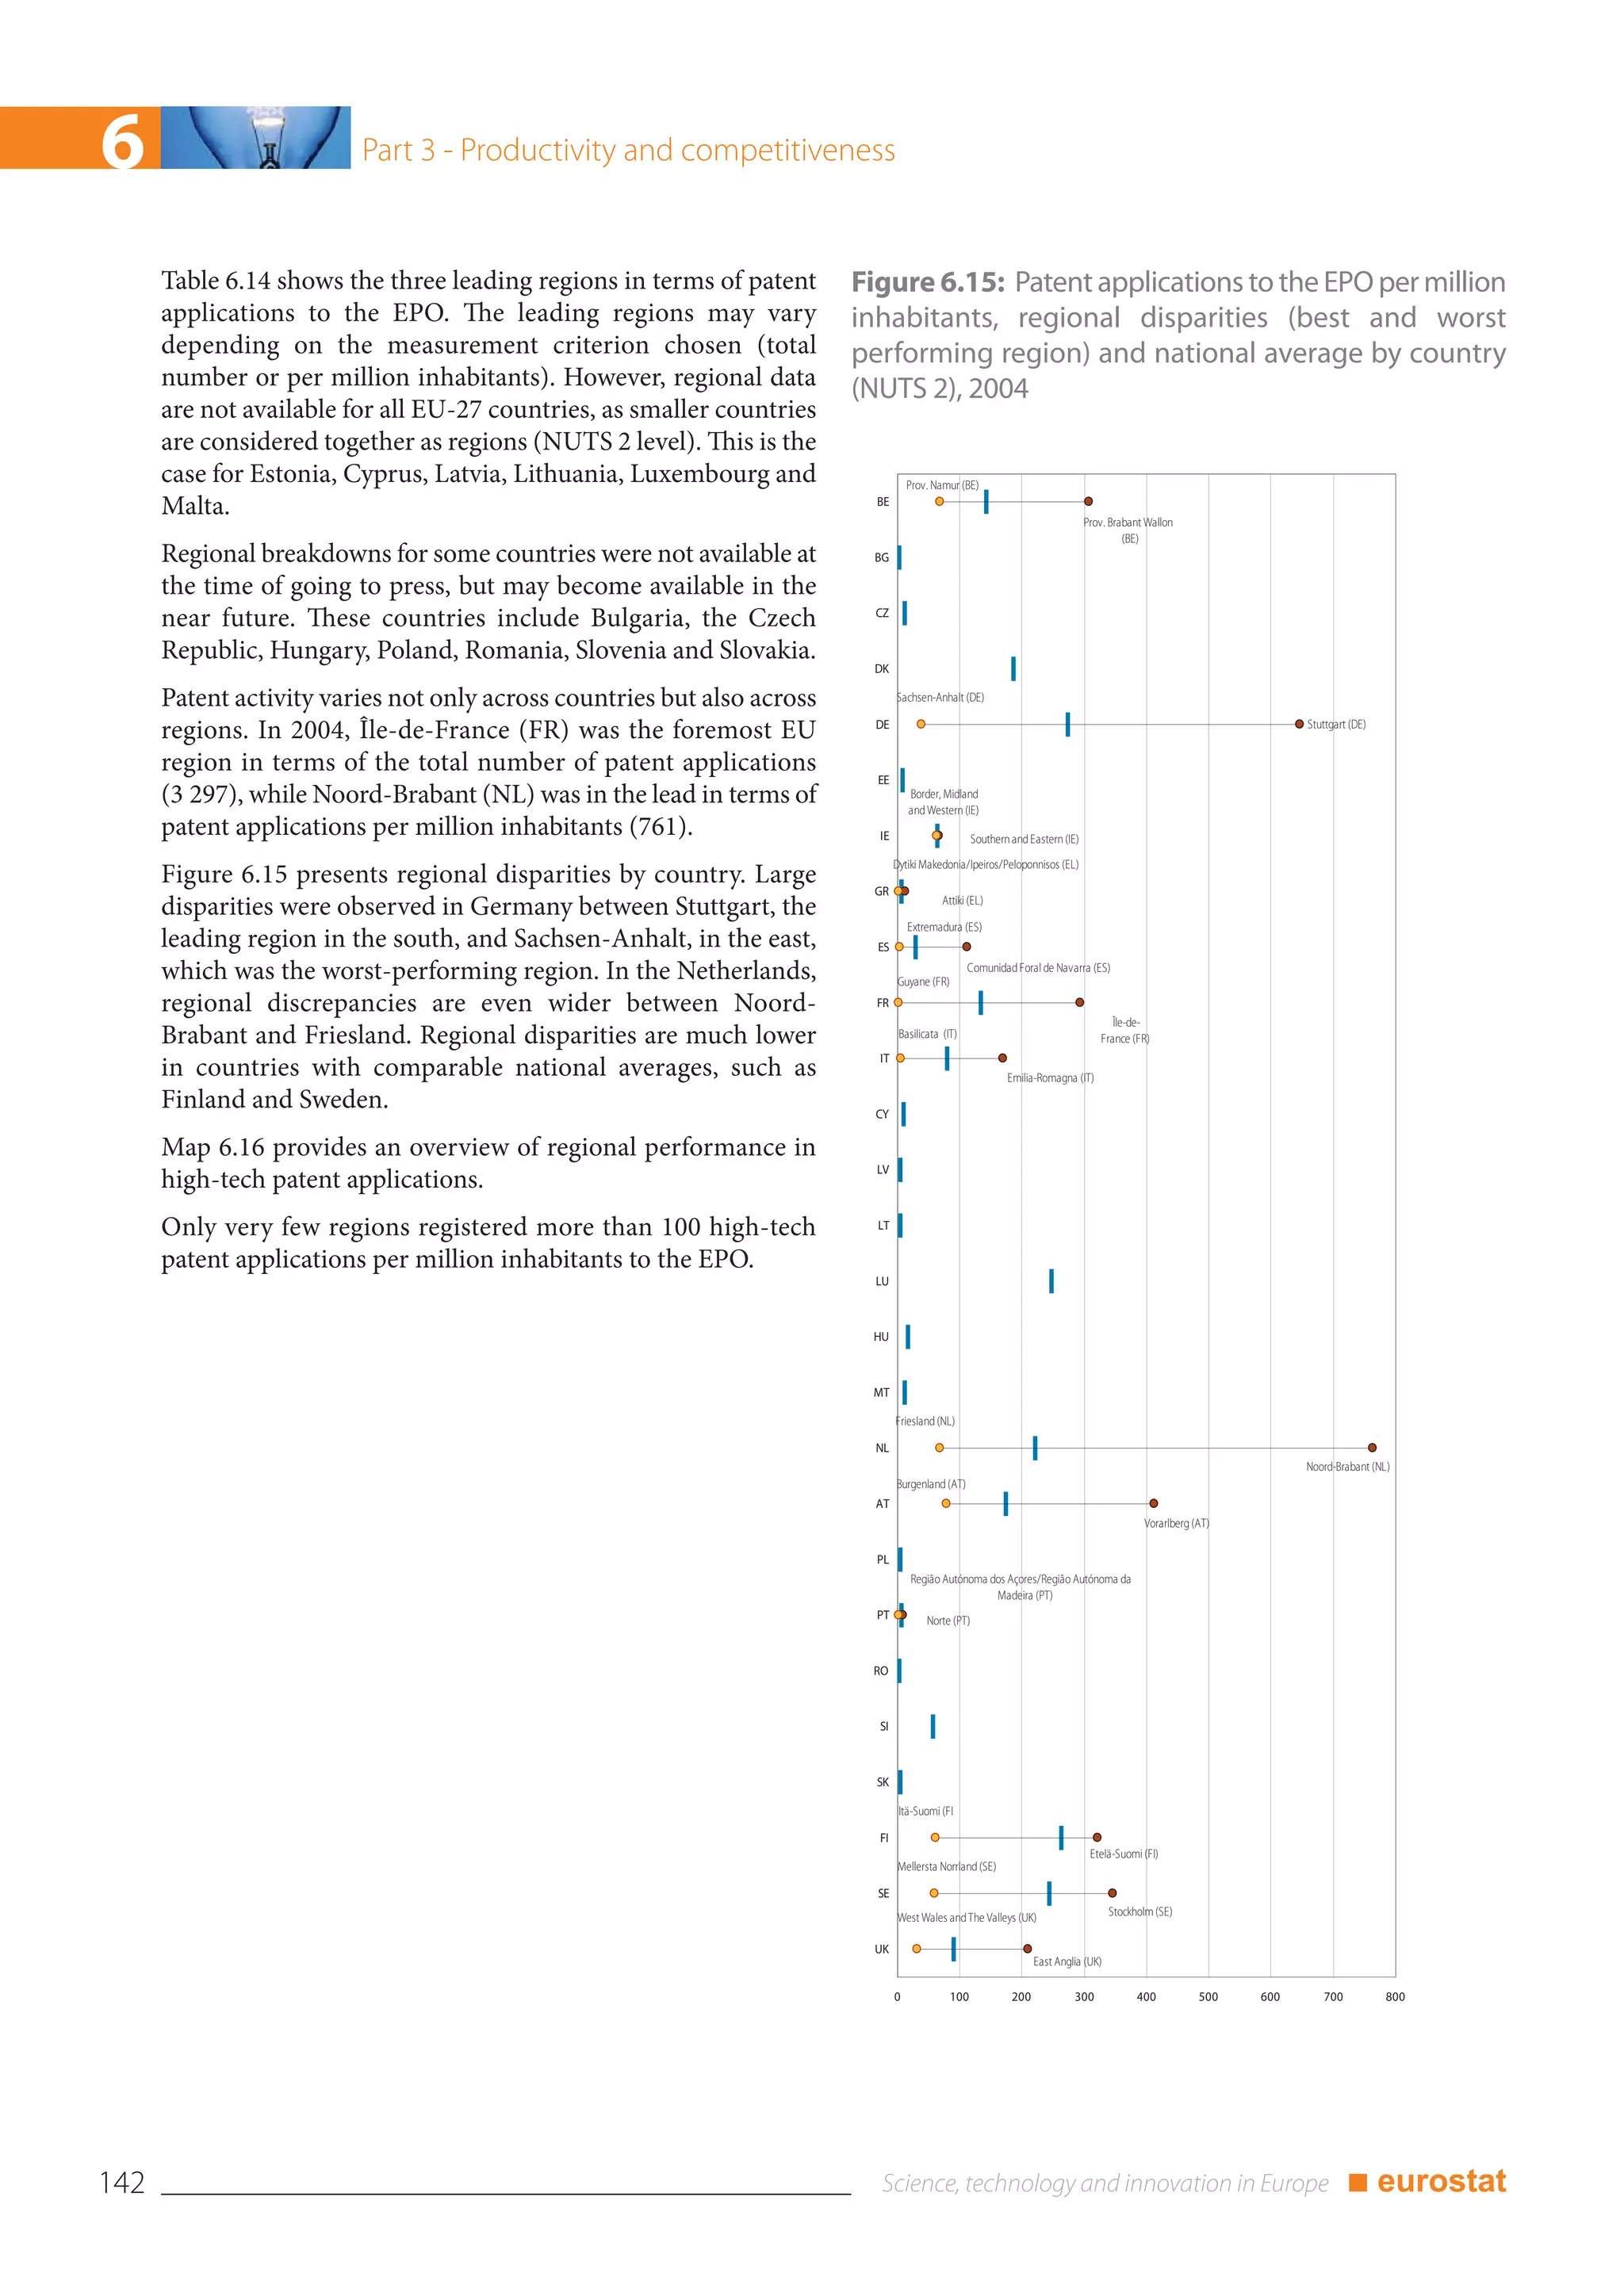
![6 Part 3 - Productivity and competitiveness
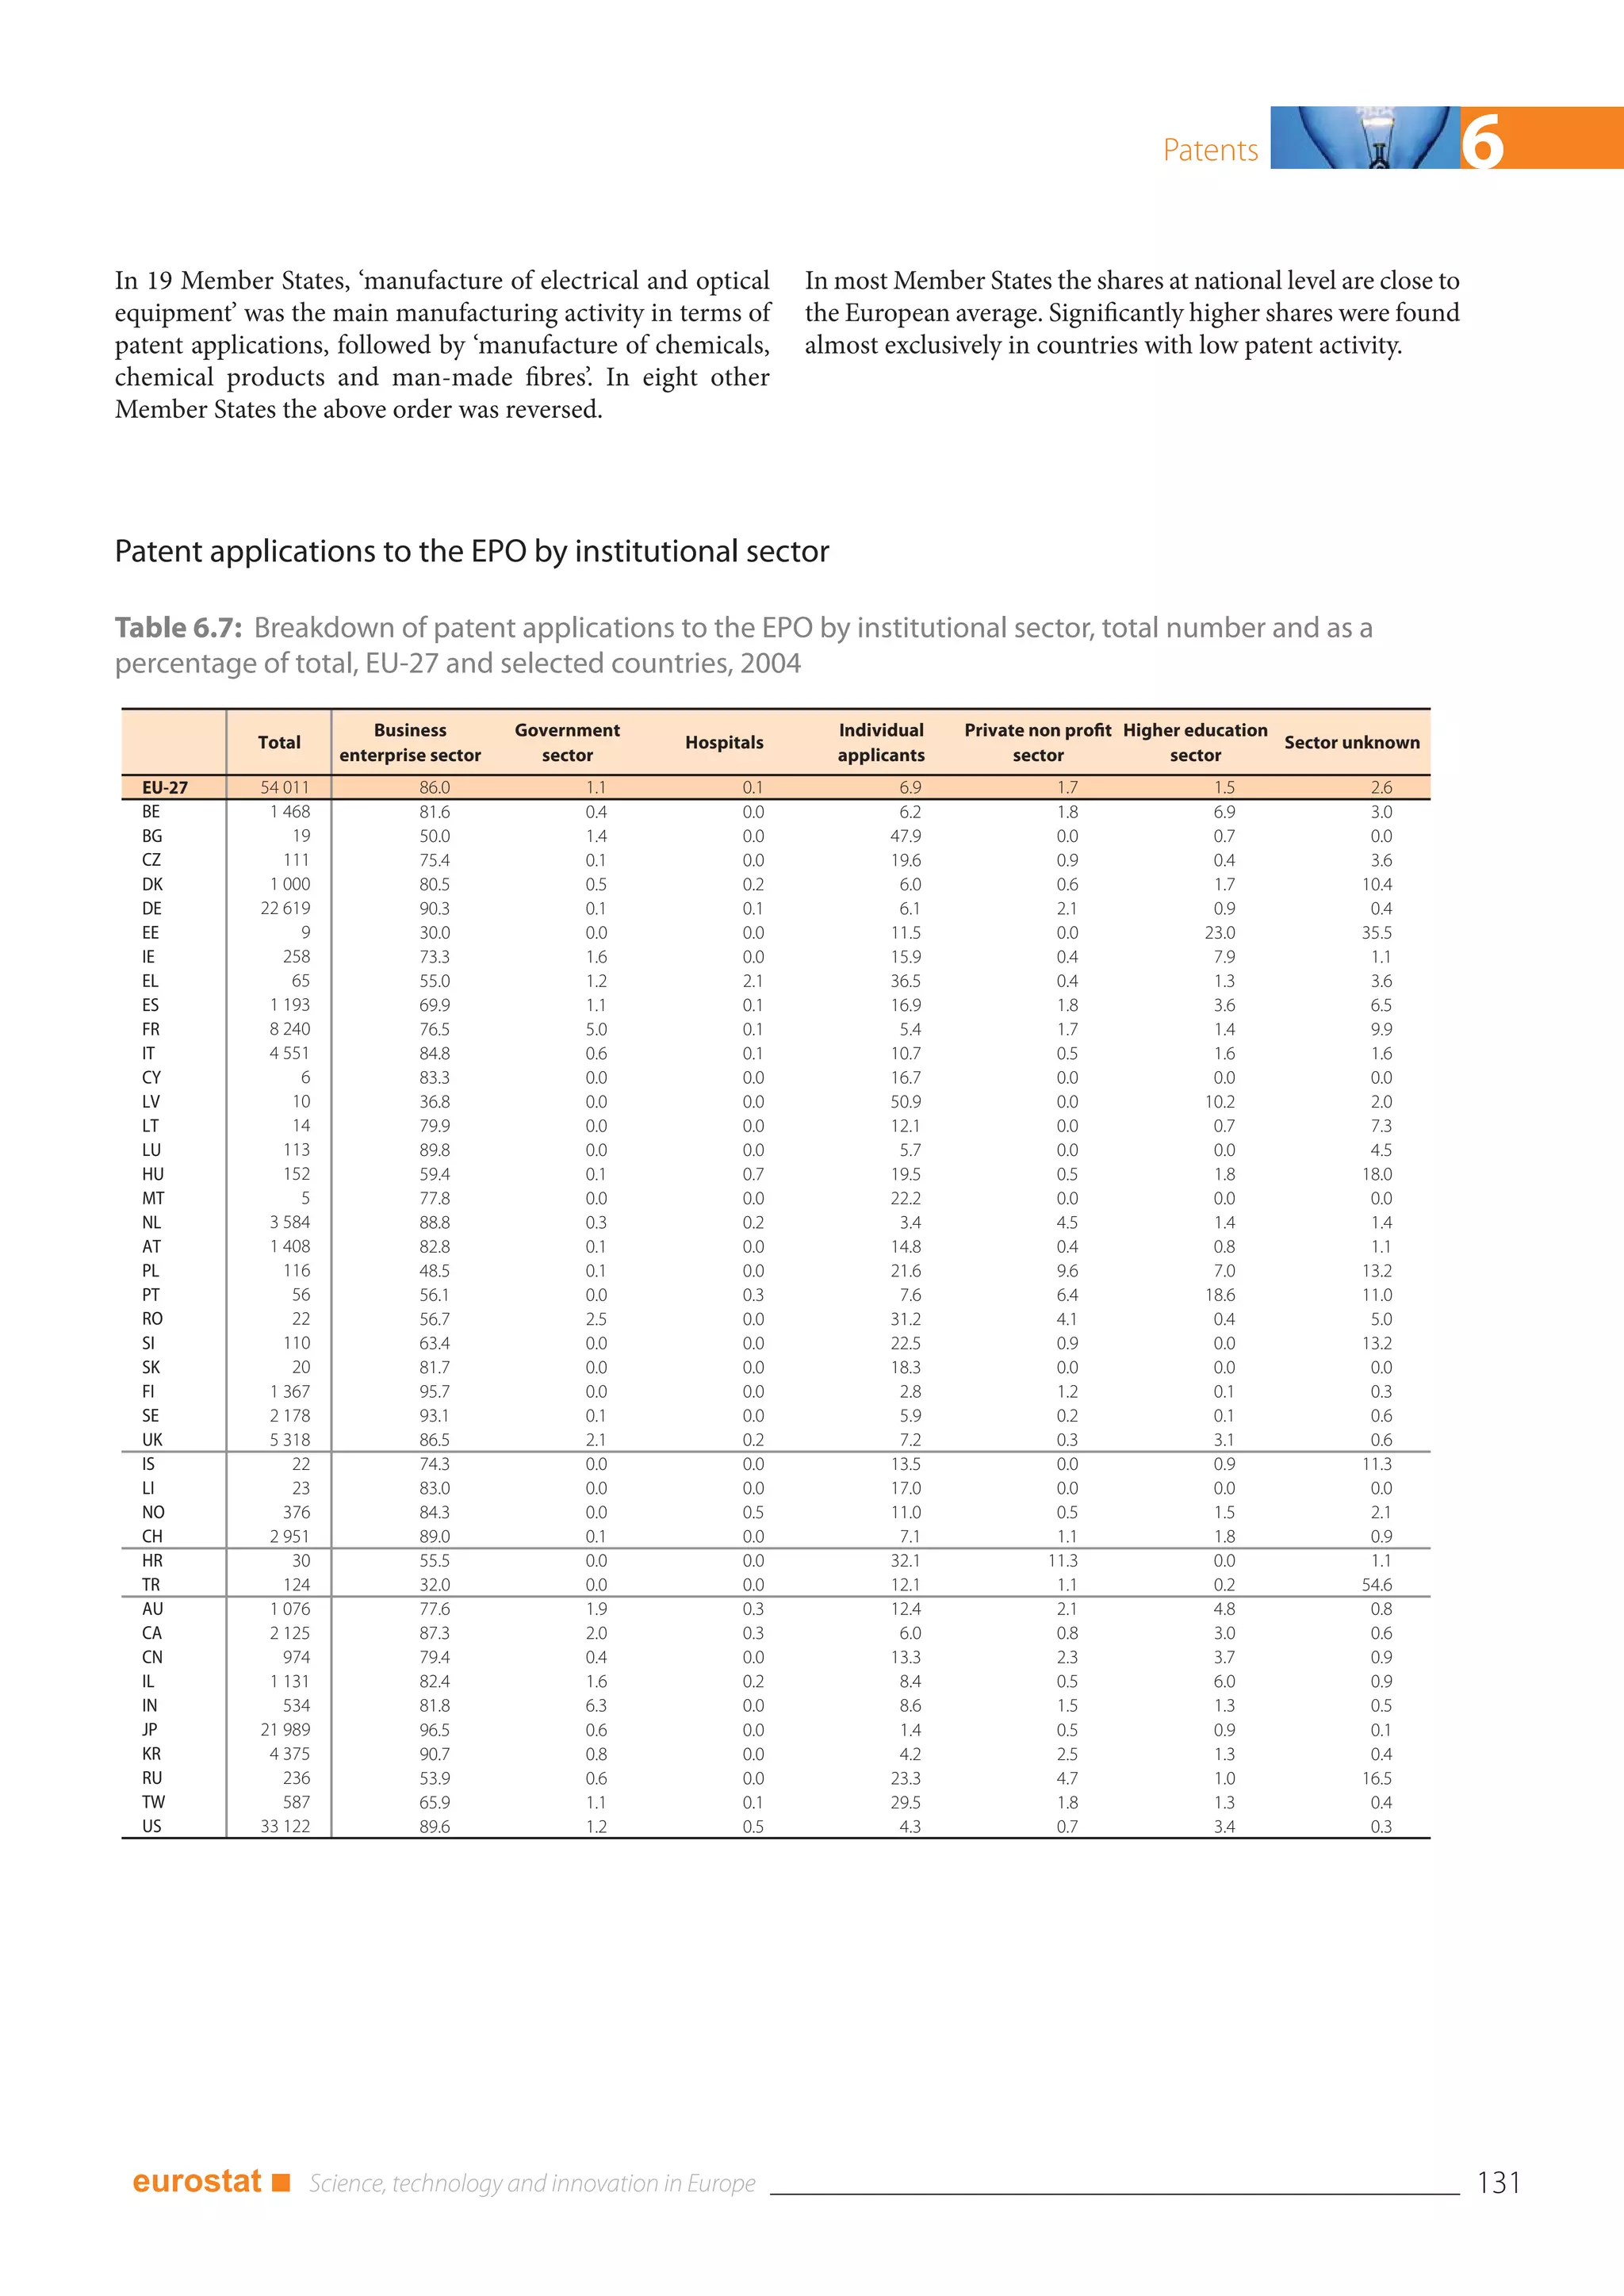
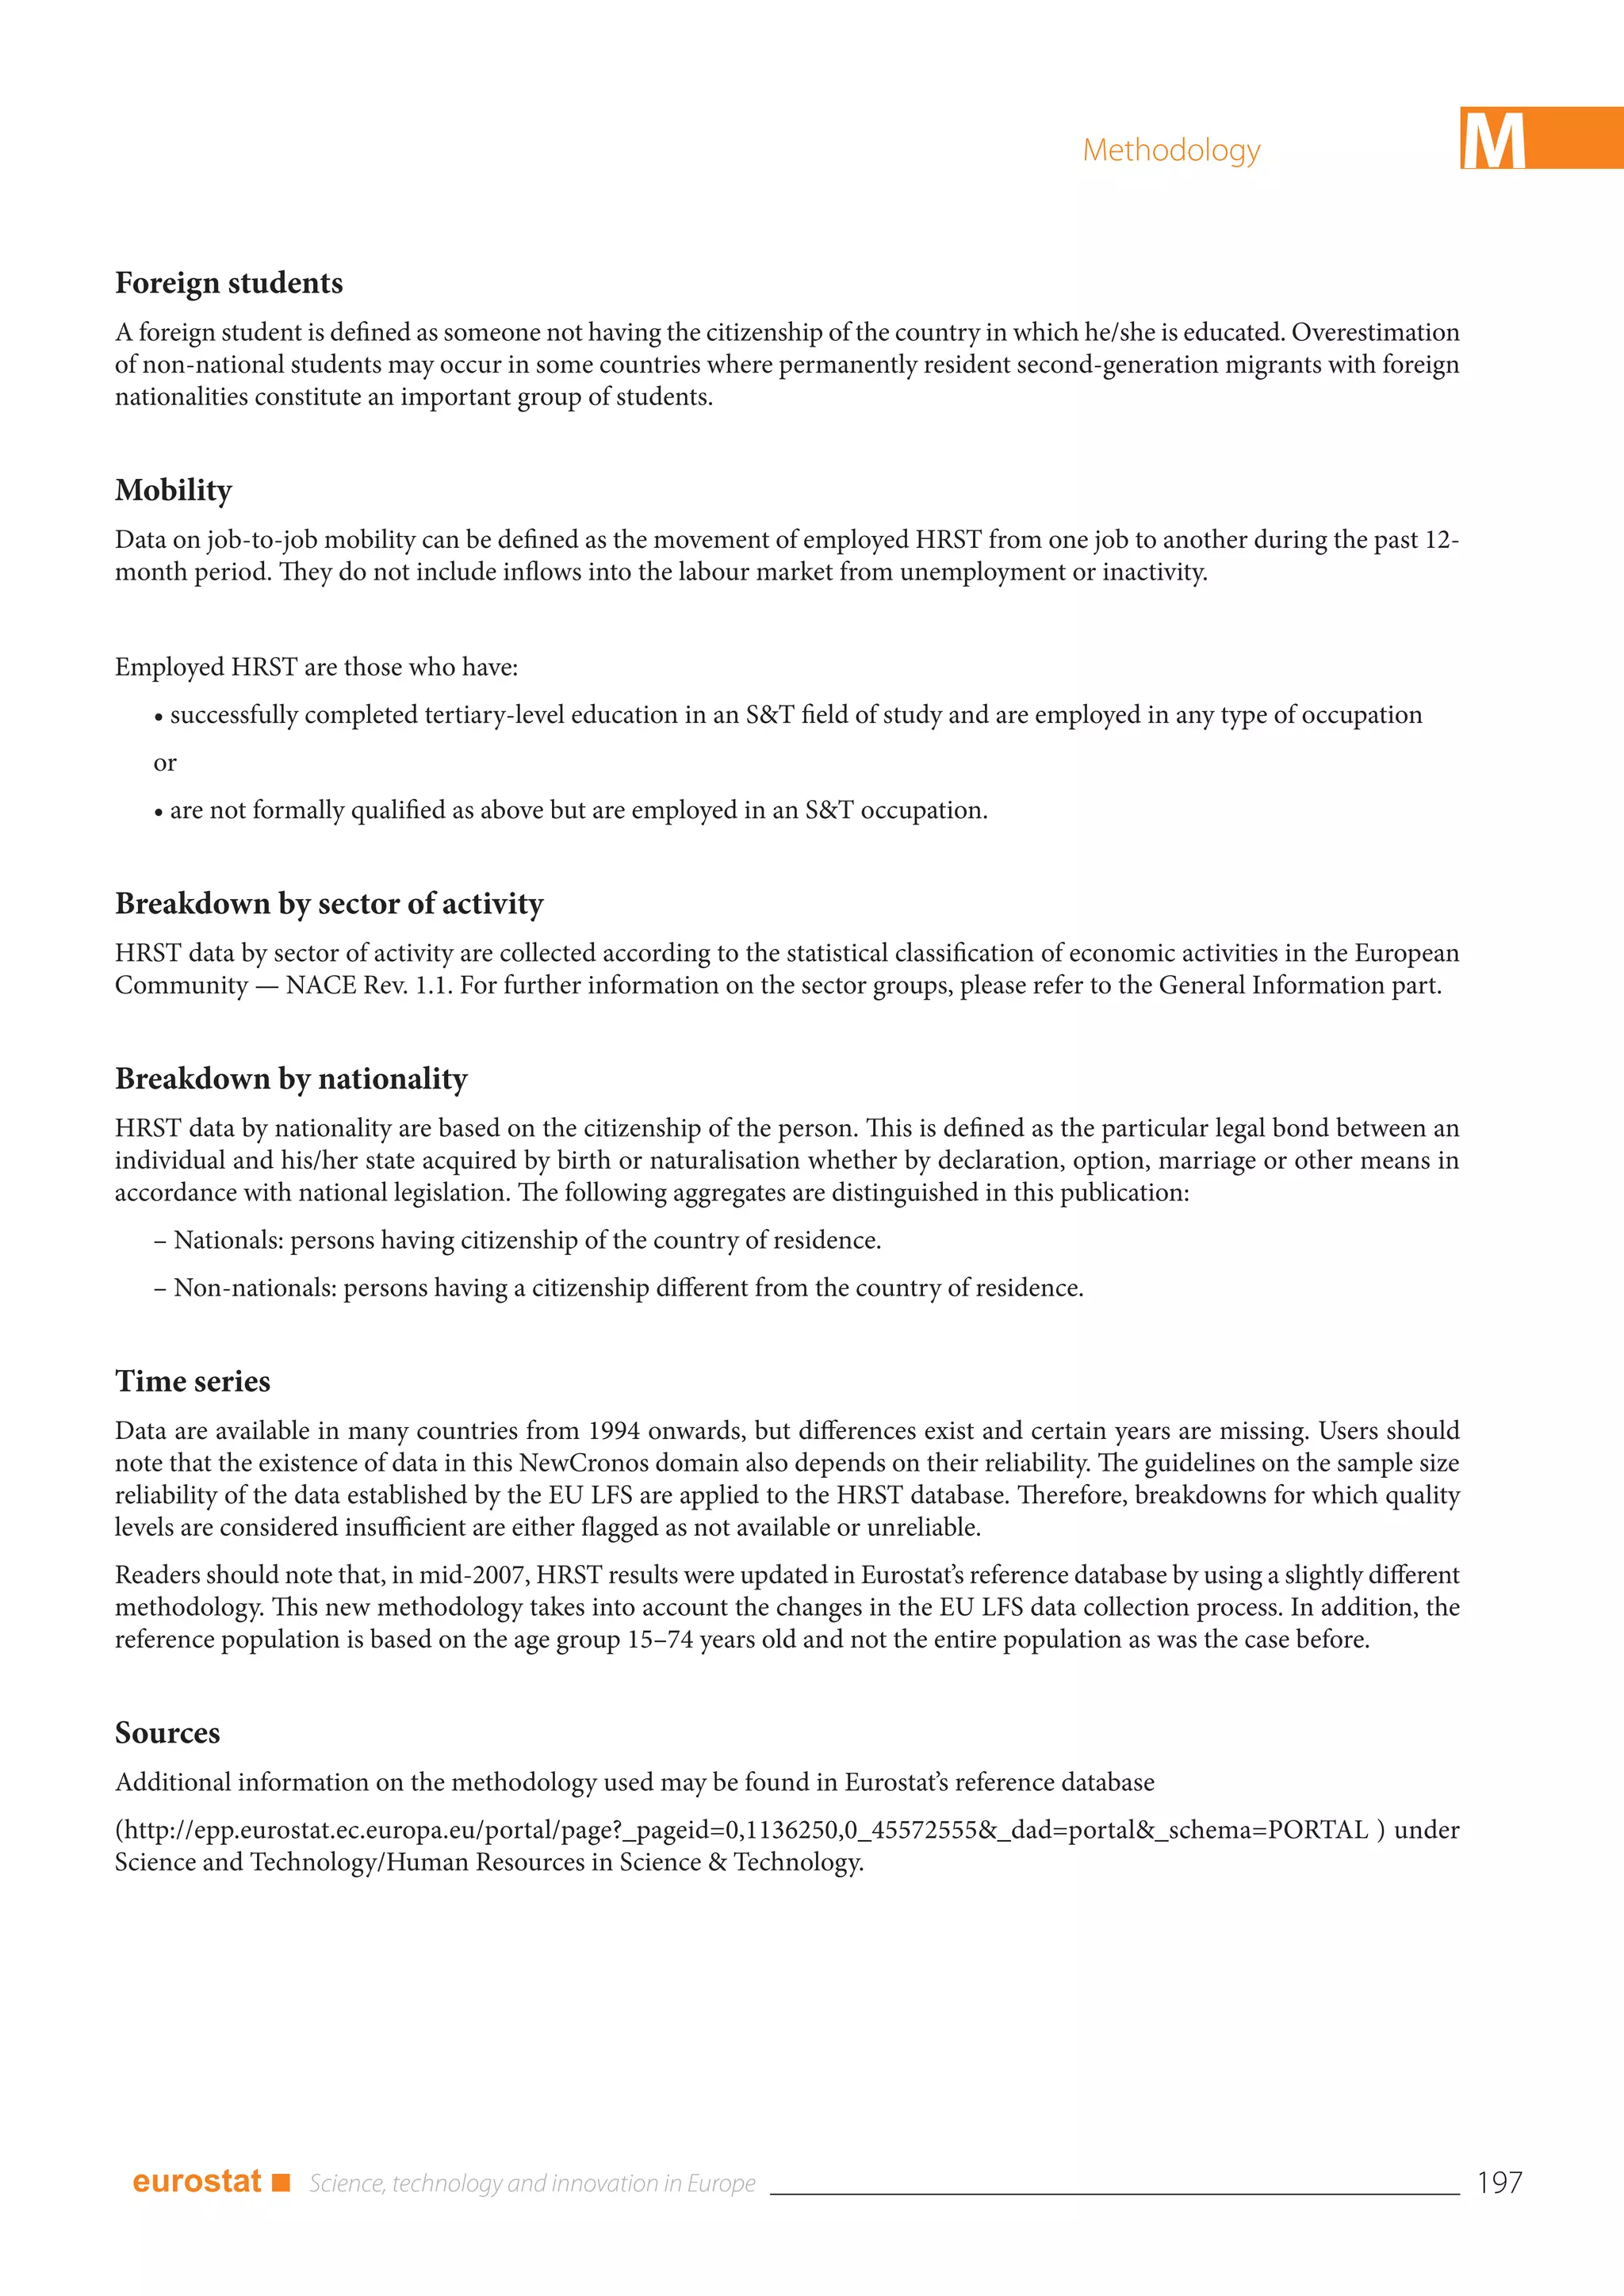
Although patents are not systematically granted, each
application nevertheless represents the inventor’s technical Industrial Property Rights:
efforts. Patent applications can therefore be considered as an Commission launches strategy to drive innovation
appropriate indicator of inventive activities. It takes, on from the laboratory to the marketplace
average, just over four years for a patent to be granted by the
EPO. In an effort to provide data promptly, Eurostat has On 16 July 2008 the European Commission adopted a Communication
therefore chosen to refer to patent applications in preference on a new industrial property rights strategy for Europe. Together with
to patents granted. In the United States, until recently, only the creation of a Community patent and integrated patent jurisdiction,
information on patents granted was published and therefore the Communication outlines a number of actions as the keystone to
no data on applications are presented in this chapter. It takes maintaining a high quality industrial property rights system for the EU
between two and five years for a patent to be granted at the in the 21st century. It sets out to support inventors in making informed
USPTO. Triadic patent families are counted on the basis of choices on the protection of their industrial property rights and calls for
the earliest priority year, i.e. the year in which a patent was robust enforcement against counterfeiting and piracy. The
first applied for at any patent office. They refer to applications Communication also aims to ensure that industrial property rights in
filed at the European Patent Office (EPO), the Japan Patent Europe are of high quality and that they are accessible to all innovators,
Office (JPO), and granted by the United States Patent and particularly small- and medium-sized enterprises (SMEs). […]
Trademark Office (USPTO).
A strong industrial property rights system is a driving force for
Regarding data at international level, readers should bear in innovation, stimulating R&D investment and facilitating the transfer of
mind that thanks to ‘home advantage’ European countries are knowledge from the laboratory to the marketplace. Along with the
leaders in the European patent system, whereas the United urgent adoption of the Community patent proposal and creation of an
States has the advantage in the US patent system. Figures may integrated EU-wide jurisdiction for patents, the actions proposed will
also be influenced by the countries’ industrial structures, since ensure Europe has a high-quality industrial property rights system in
different industries have a different propensity to patent. the years to come:
Some of these problems are less visible in the triadic patent
• Effective enforcement on the ground against counterfeiting and
family indicators, as they only take into account patent
piracy. This phenomenon is reaching alarming levels with damaging
applications that have been filed at the EPO and the JPO, and
effects on job creation in Europe and the heath and safety of
those granted by the USPTO. Besides improving the
consumers. In addition to improving coordination between key
international comparability of patent indicators, triadic patent
enforcement actors at a national level, the Commission will work
family data also balance the differences in the value of the
towards effective cooperation between Member States in intelligence
patents associated with the other indicators. This is because
gathering and rapid information exchange on counterfeit and pirated
patenting in all three offices is very costly, owing not only to
goods. Furthermore, the Commission will help facilitate agreements
administrative fees but also to translation costs. Under these
involving both the public and private sectors to crack down on blatant
circumstances, patentees will proceed with such applications
violations of intellectual property rights.
only if they deem it worthwhile, i.e. if the expectation of
having the patent granted and the expected return from • Ensuring high-quality industrial property rights in Europe that are
protection through sales or licences in the designated accessible to all innovators, including SMEs. To achieve this, the
countries are high enough. Because of differences in data Commission will undertake studies on the quality of the patent system
processing methods, direct comparisons between the EPO, and on the overall functioning of the trademark systems in the EU. This
the USPTO and triadic patent family data are not advisable. would also include the Community trademark, which the Office for
Harmonisation of the Internal Market has been successfully registering
For further explanations on the methodology used, please
for over 10 years.
refer to the methodological notes or to the section on patent
statistics on Eurostat’s website. • Facilitating exploitation by SMEs of industrial property rights. The
Communication outlines measures to facilitate access to industrial
property rights and dispute resolution procedures, and to improve
awareness among SMEs of the management of industrial property as
an integral element within an overall business plan.
More information on Industrial Property is available at:
http://ec.europa.eu/internal_market/indprop/rights/index_en.htm
124 ■ eurostat](https://image.slidesharecdn.com/2009-09eurostatid27em-09-09-en-100113065936-phpapp01/75/2009-09-E-U-R-O-S-T-A-T-I-D-27-E-M-09-09-E-N-151-2048.jpg)


![M Methodology
1.4 Employment
Employed persons are persons aged 15 and over who performed work during the reference week — even for just one hour
per week — for pay, profit or family gain or were not at work but had a job or business from which they were temporarily absent
because of e.g. illness, holidays, industrial dispute and education or training.
1.5 Labour force
The labour force is the active population; this is the sum of employed and unemployed persons as defined by the EU Labour
Force Survey. Persons in employment are those who during the reference week did any work for pay or profit, or were not
working but had jobs from which they were temporarily absent, including family workers. Unemployed persons comprise
persons aged 15 to 74 who were:
- without work during the reference week, i.e. neither had a job nor were at work (for one hour or more) in paid
employment or self-employment;
- currently available for work, i.e. were available for paid employment or self-employment before the end of the two
weeks following the reference week;
- actively seeking work, i.e. had taken specific steps in the four-week period ending with the reference week to seek paid
employment or self-employment or who found a job to start later, i.e. within a period of at most three months.
1.6 Average annual growth rate
Average annual growth rates (AAGR) in this publication are calculated according to the following formula:
AAGRT, T-n = [(XT/XT-n)1/n -1] x 100
Where X = value,
T = final year,
n = period in years for which the annual growth rate is calculated
1.7 Institutional classification by sectors
• The business enterprise sector - BES
With regard to R&D, the business enterprise sector includes: all firms, organisations and institutions whose primary activity
is the market production of goods or services (other than higher education) for sale to the general public at an economically
significant price and the private non-profit institutions mainly serving them - Frascati Manual, § 163.
• The government sector - GOV
In the field of R&D, the government sector includes: all departments, offices and other bodies which furnish but normally do
not sell to the community those common services, other than higher education, which cannot otherwise be conveniently and
economically provided, and administer the state and the economic and social policy of the community (public enterprises are
included in the business enterprise sector) as well as PNPs controlled and mainly financed by government - Frascati Manual,
§ 184.
• The higher education sector - HES
This sector comprises: all universities, colleges of technology and other institutes of post-secondary education, whatever their
source of finance or legal status. It also includes all research institutes, experimental stations and clinics operating under the
direct control of or administered by or associated with higher education establishments - Frascati Manual, § 206.
• The private non-profit sector - PNP
This sector covers: non-market, private non-profit institutions serving households (i.e. the general public) and private
individuals or households - Frascati Manual, § 194.
184 ■ eurostat](https://image.slidesharecdn.com/2009-09eurostatid27em-09-09-en-100113065936-phpapp01/75/2009-09-E-U-R-O-S-T-A-T-I-D-27-E-M-09-09-E-N-211-2048.jpg)


![Methodology M
2. High tech: Based on the data on patent applications/patents granted by IPC codes (7th edition, 2000), Eurostat has calculated
data on patent applications/patents granted in high-technology fields.
The aggregation “high-tech patents” is made up as follows in the IPC. For each of the six high-tech groups the patents with
the IPC codes in brackets are used.
1. Aviation – AVI [B64B, B64C, B64D, B64F, B64G];
2. Computer and automated business equipment – CAB [B41J, G06C, G06D, G06E, G06F, G06G, G06J, G06K, G06M,
G06N, G06T, G11C];
3. Communication technology – CTE [H04B, H04H, H04J, H04K, H04L, H04M, H04N, H04Q, H04R, H04S];
4. Lasers – LSR [H01S];
5. Micro-organism and genetic engineering - MGE [C12M, C12N, C12P, C12Q];
6. Semi-conductors – SMC [H01L].
3. Information and Communication Technologies (ICT): The IPC codes (7th edition, 2000) listed behind each ICT sub-
category are added up for the aggregation of each ICT-sub-category.
1. Telecommunications [G01S, G08C, G09C, H01P, H01Q, H01S3/(025, 043, 063, 067, 085, 0933, 0941, 103, 133, 18, 19,
25), H1S5, H03B, H03C, H03D, H03H, H03M, H04B, H04J, H04K, H04L, H04M, H04Q];
2. Consumer electronics [G11B, H03F, H03G, H03J, H04H, H04N, H04R, H04S];
3. Computers, office machinery [B07C, B41J, B41K, G02F, G03G, G05F, G06, G07, G09G, G10L, G11C, H03K, H03L];
4. Other ICT [G01B, G01C, G01D, G01F, G01G, G01H, G01J, G01K, G01L, G01M, G01N, G01P, G01R, G01V, G01W,
G02B6, G05B, G08G, G09B, H01B11, H01J(11/, 13/, 15/, 17/, 19/, 21/, 23/, 25/, 27/, 29/, 31/, 33/, 40/, 41/, 43/, 45/),
H01L].
eurostat ■ 207](https://image.slidesharecdn.com/2009-09eurostatid27em-09-09-en-100113065936-phpapp01/75/2009-09-E-U-R-O-S-T-A-T-I-D-27-E-M-09-09-E-N-234-2048.jpg)


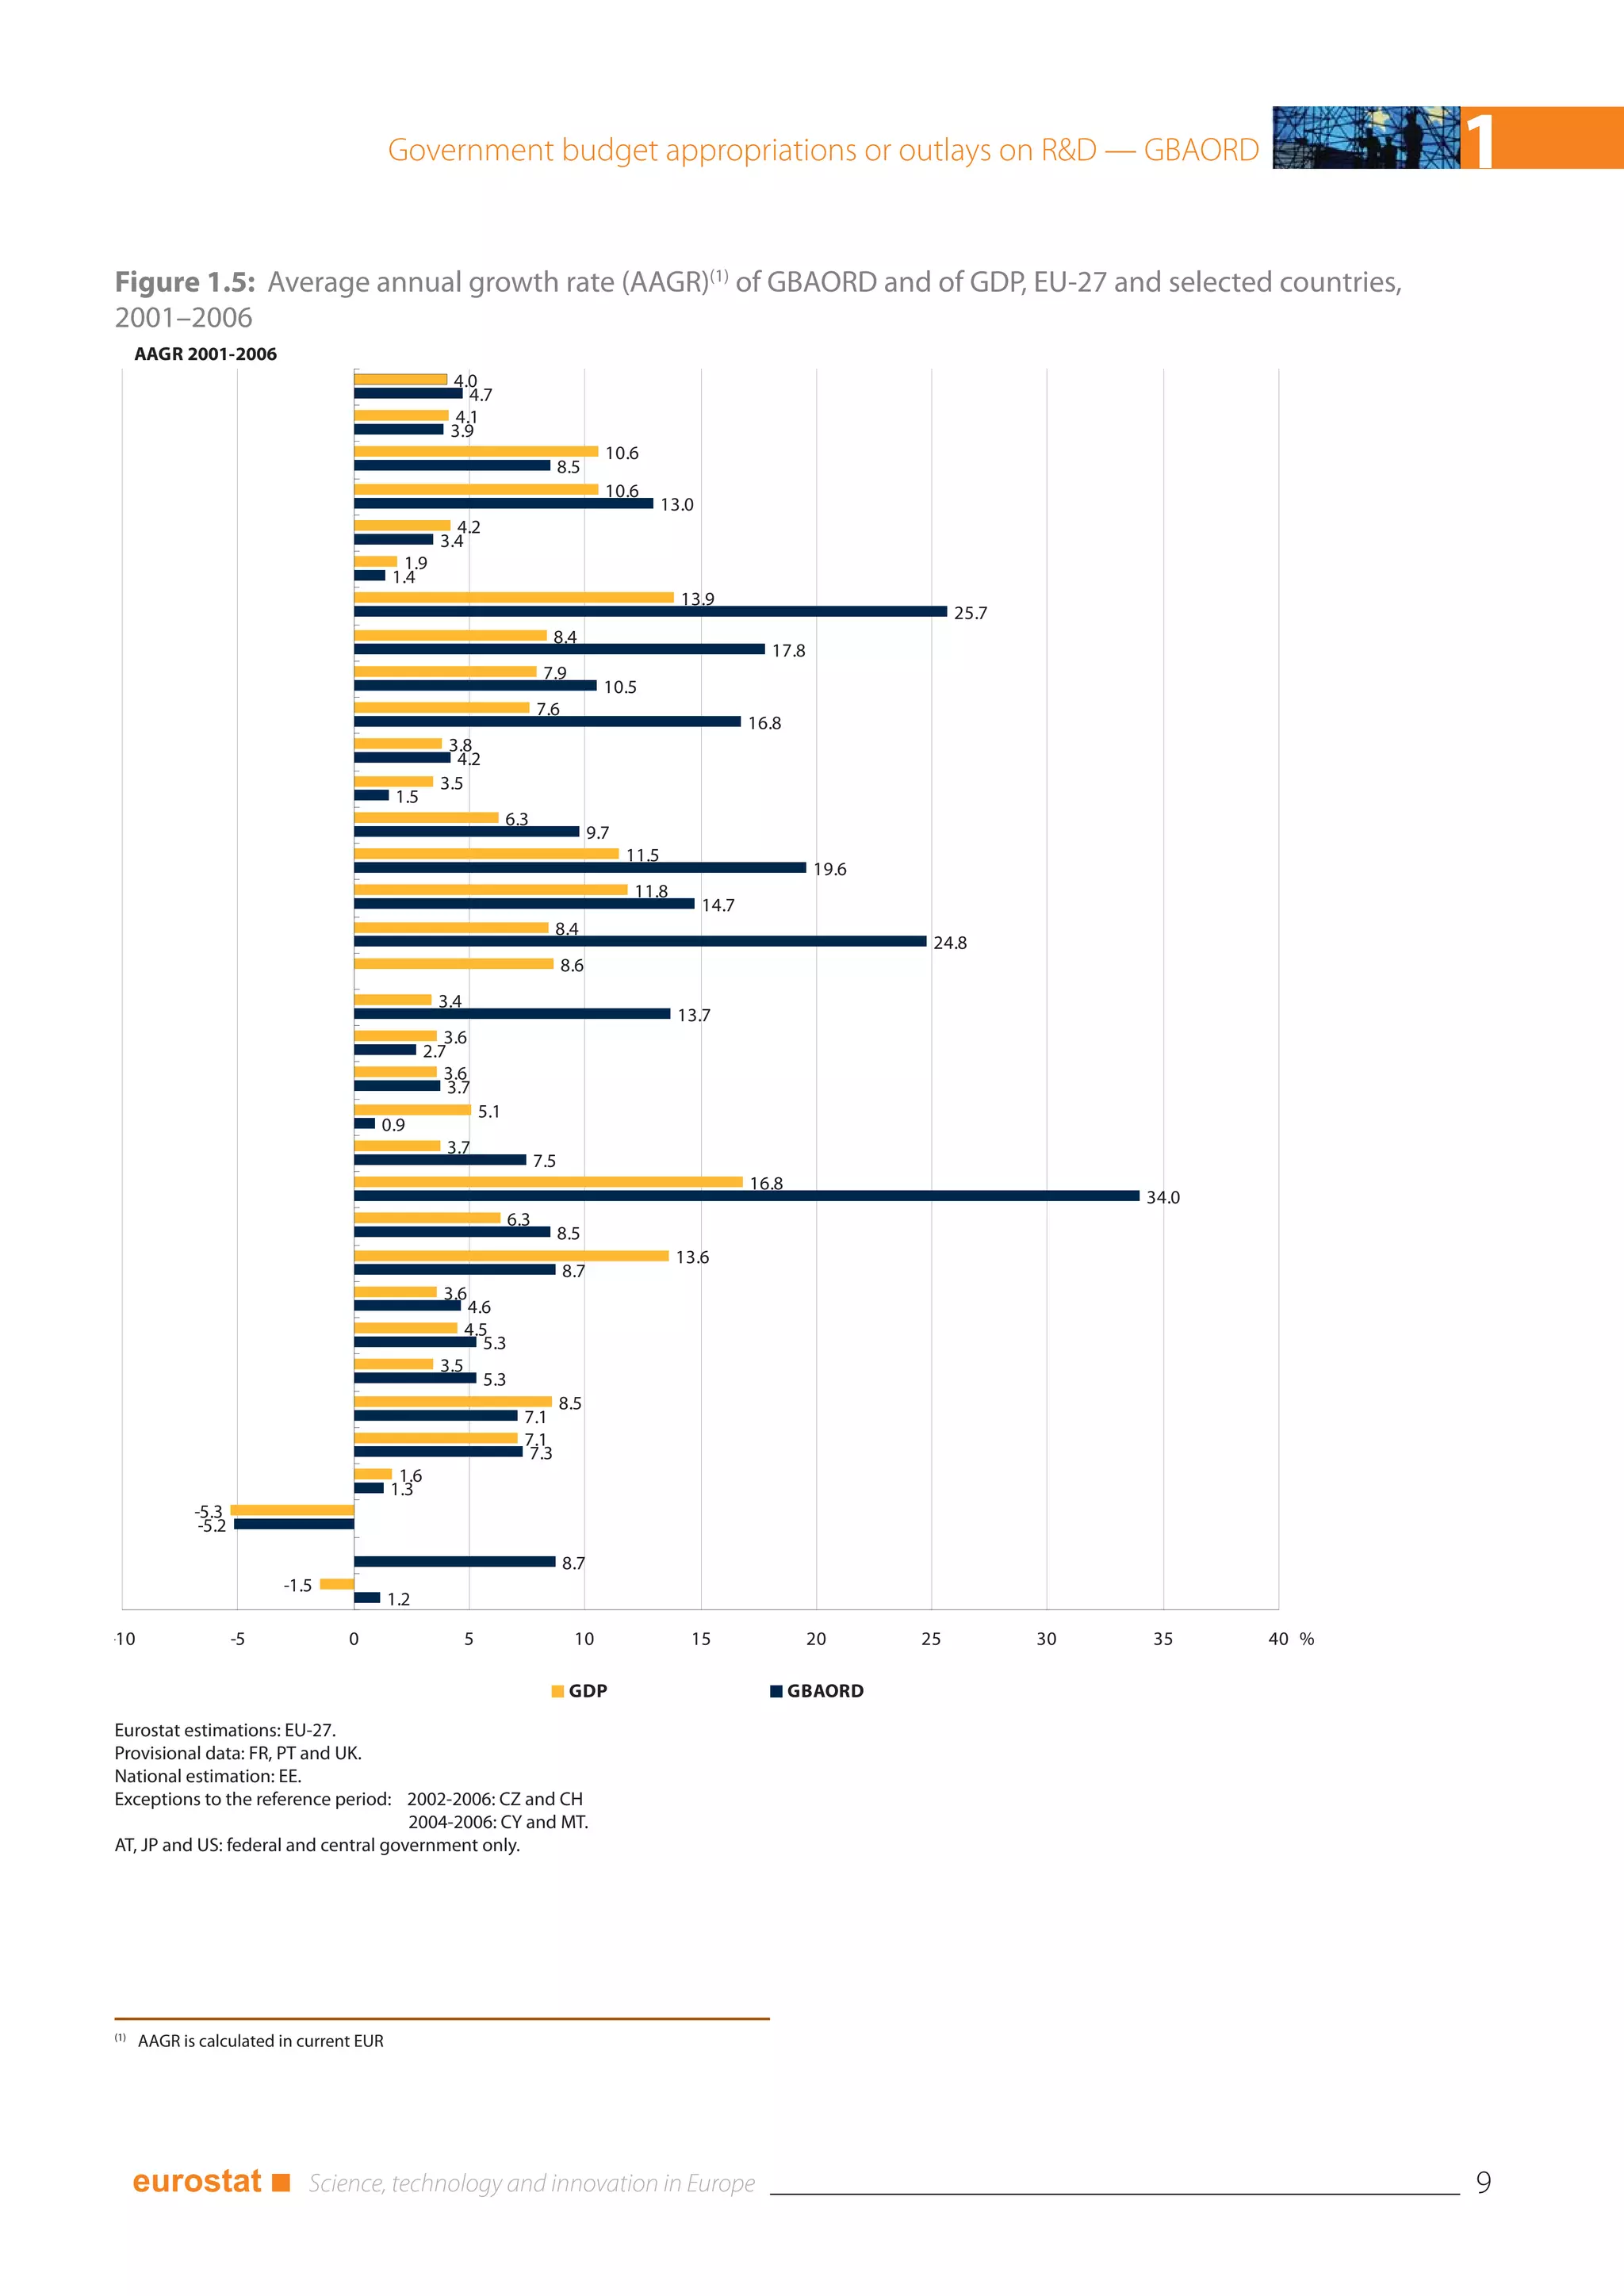
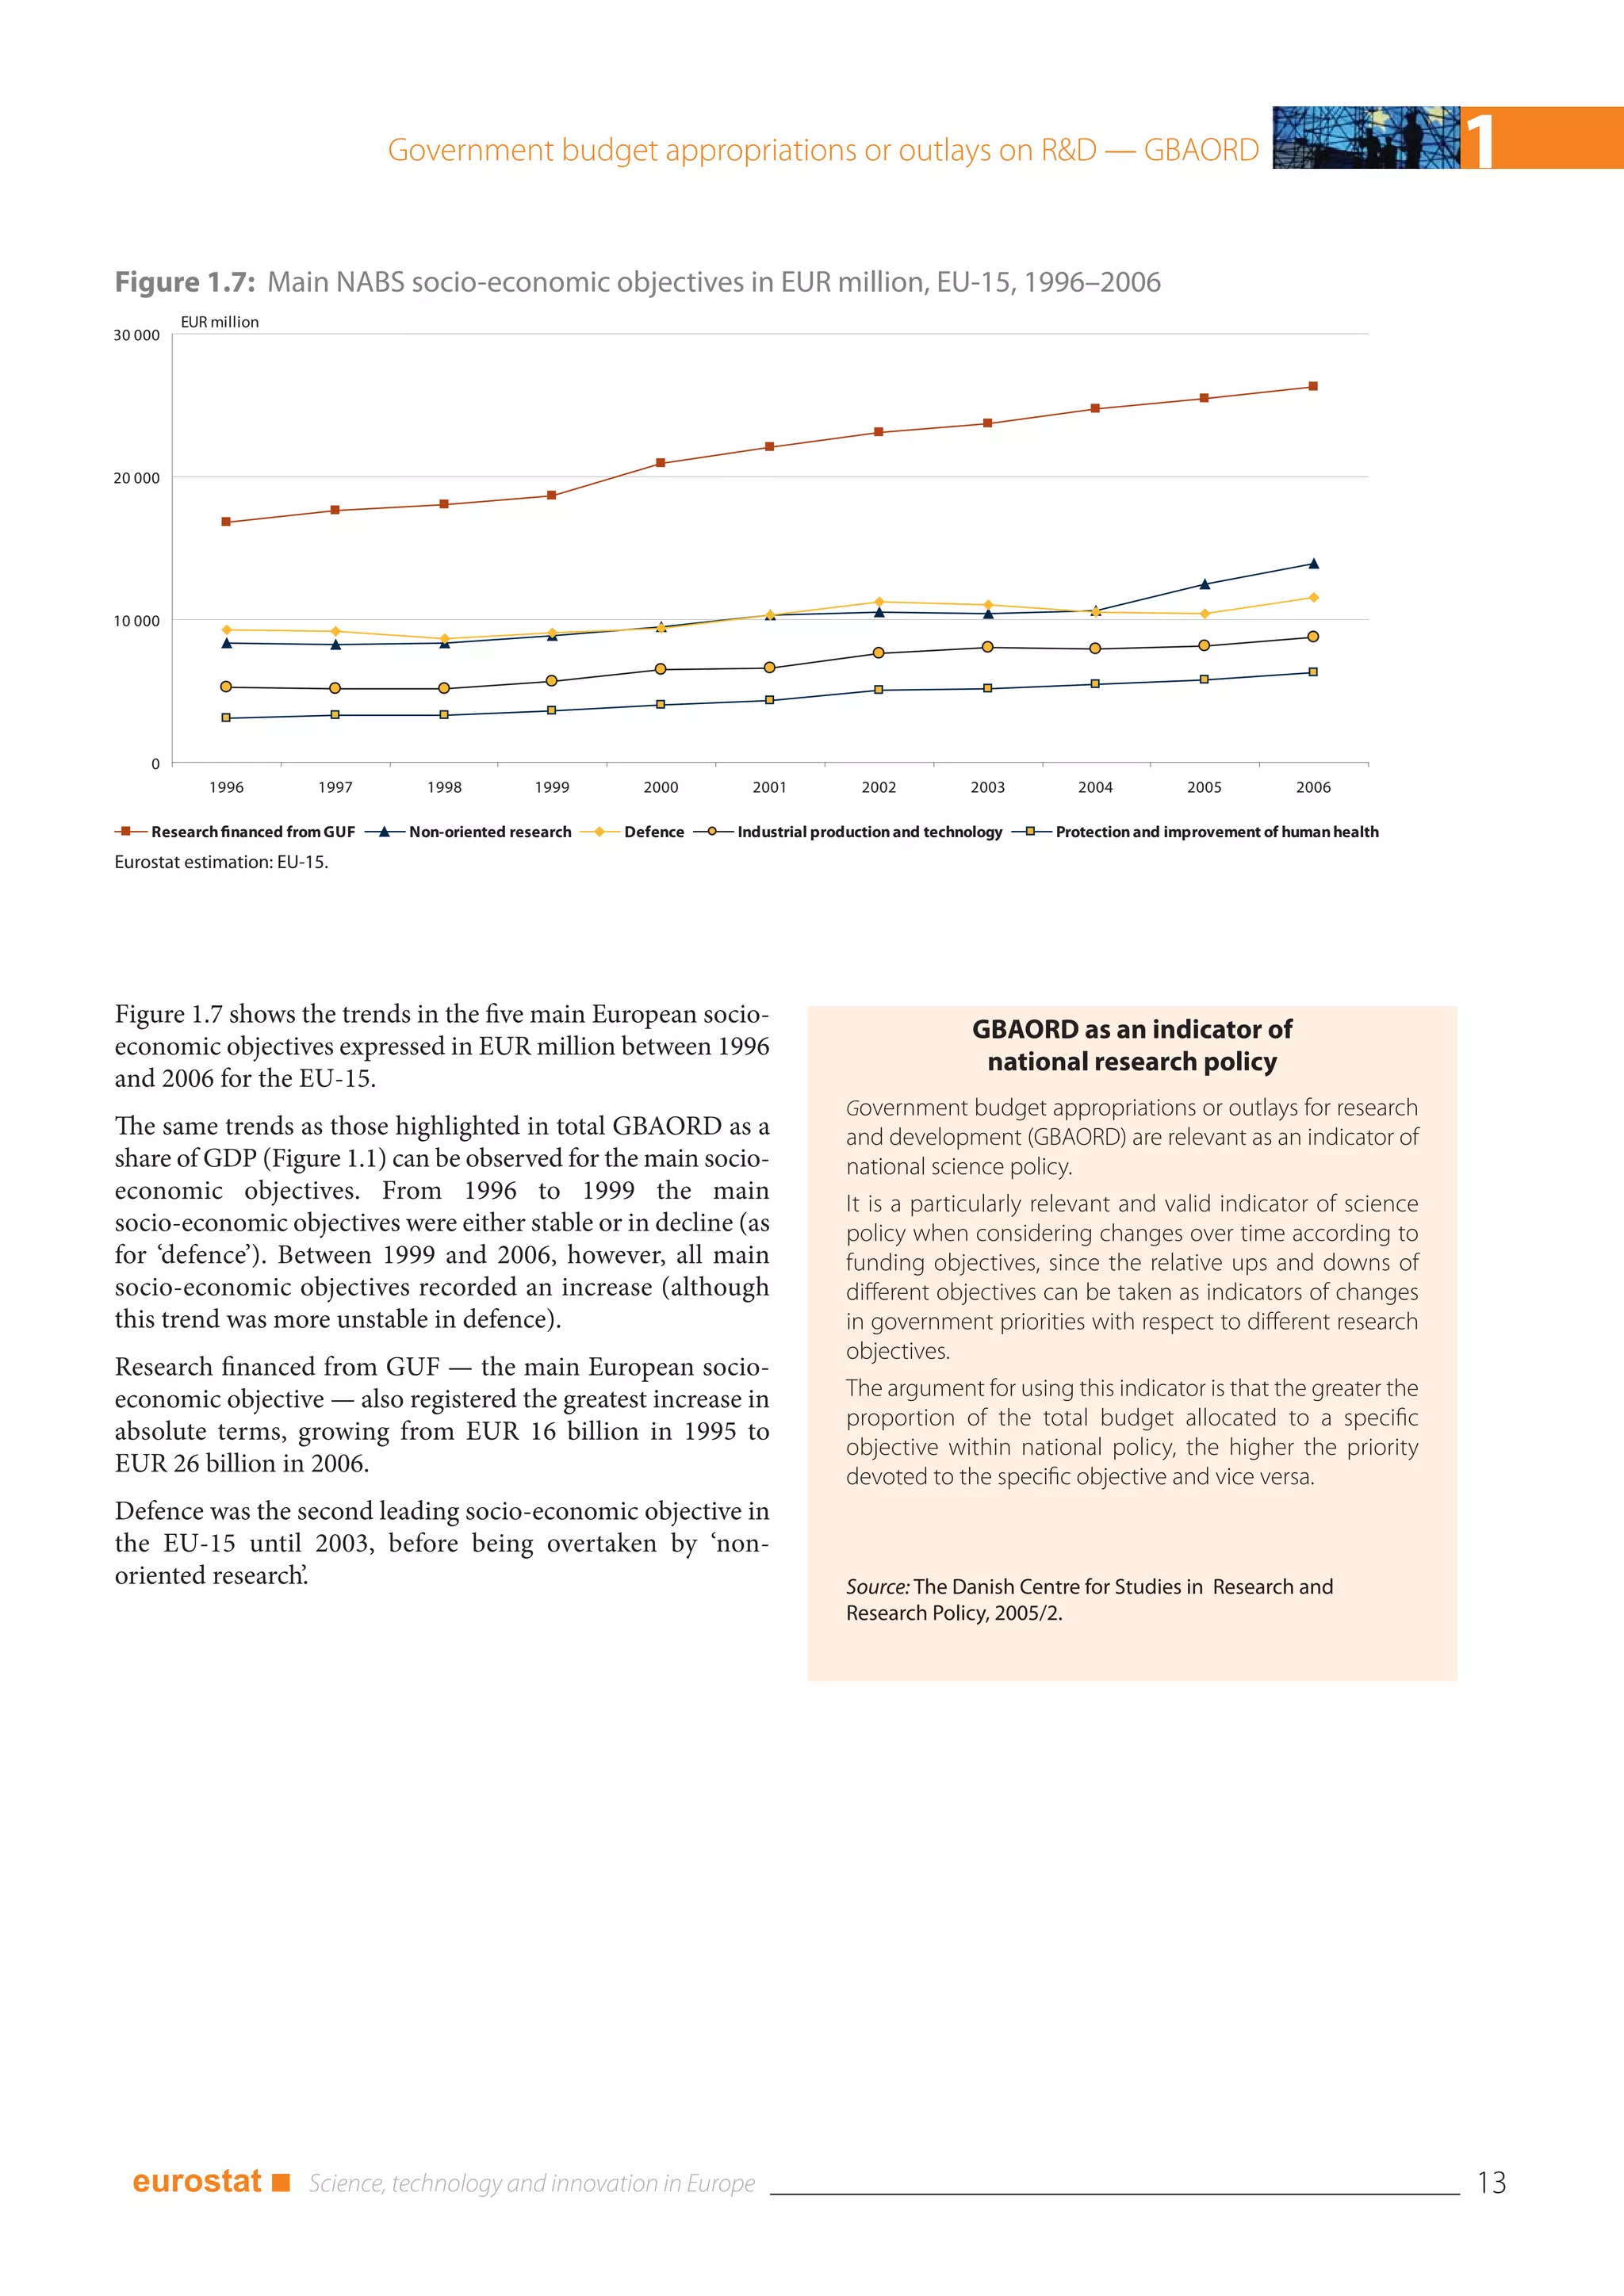
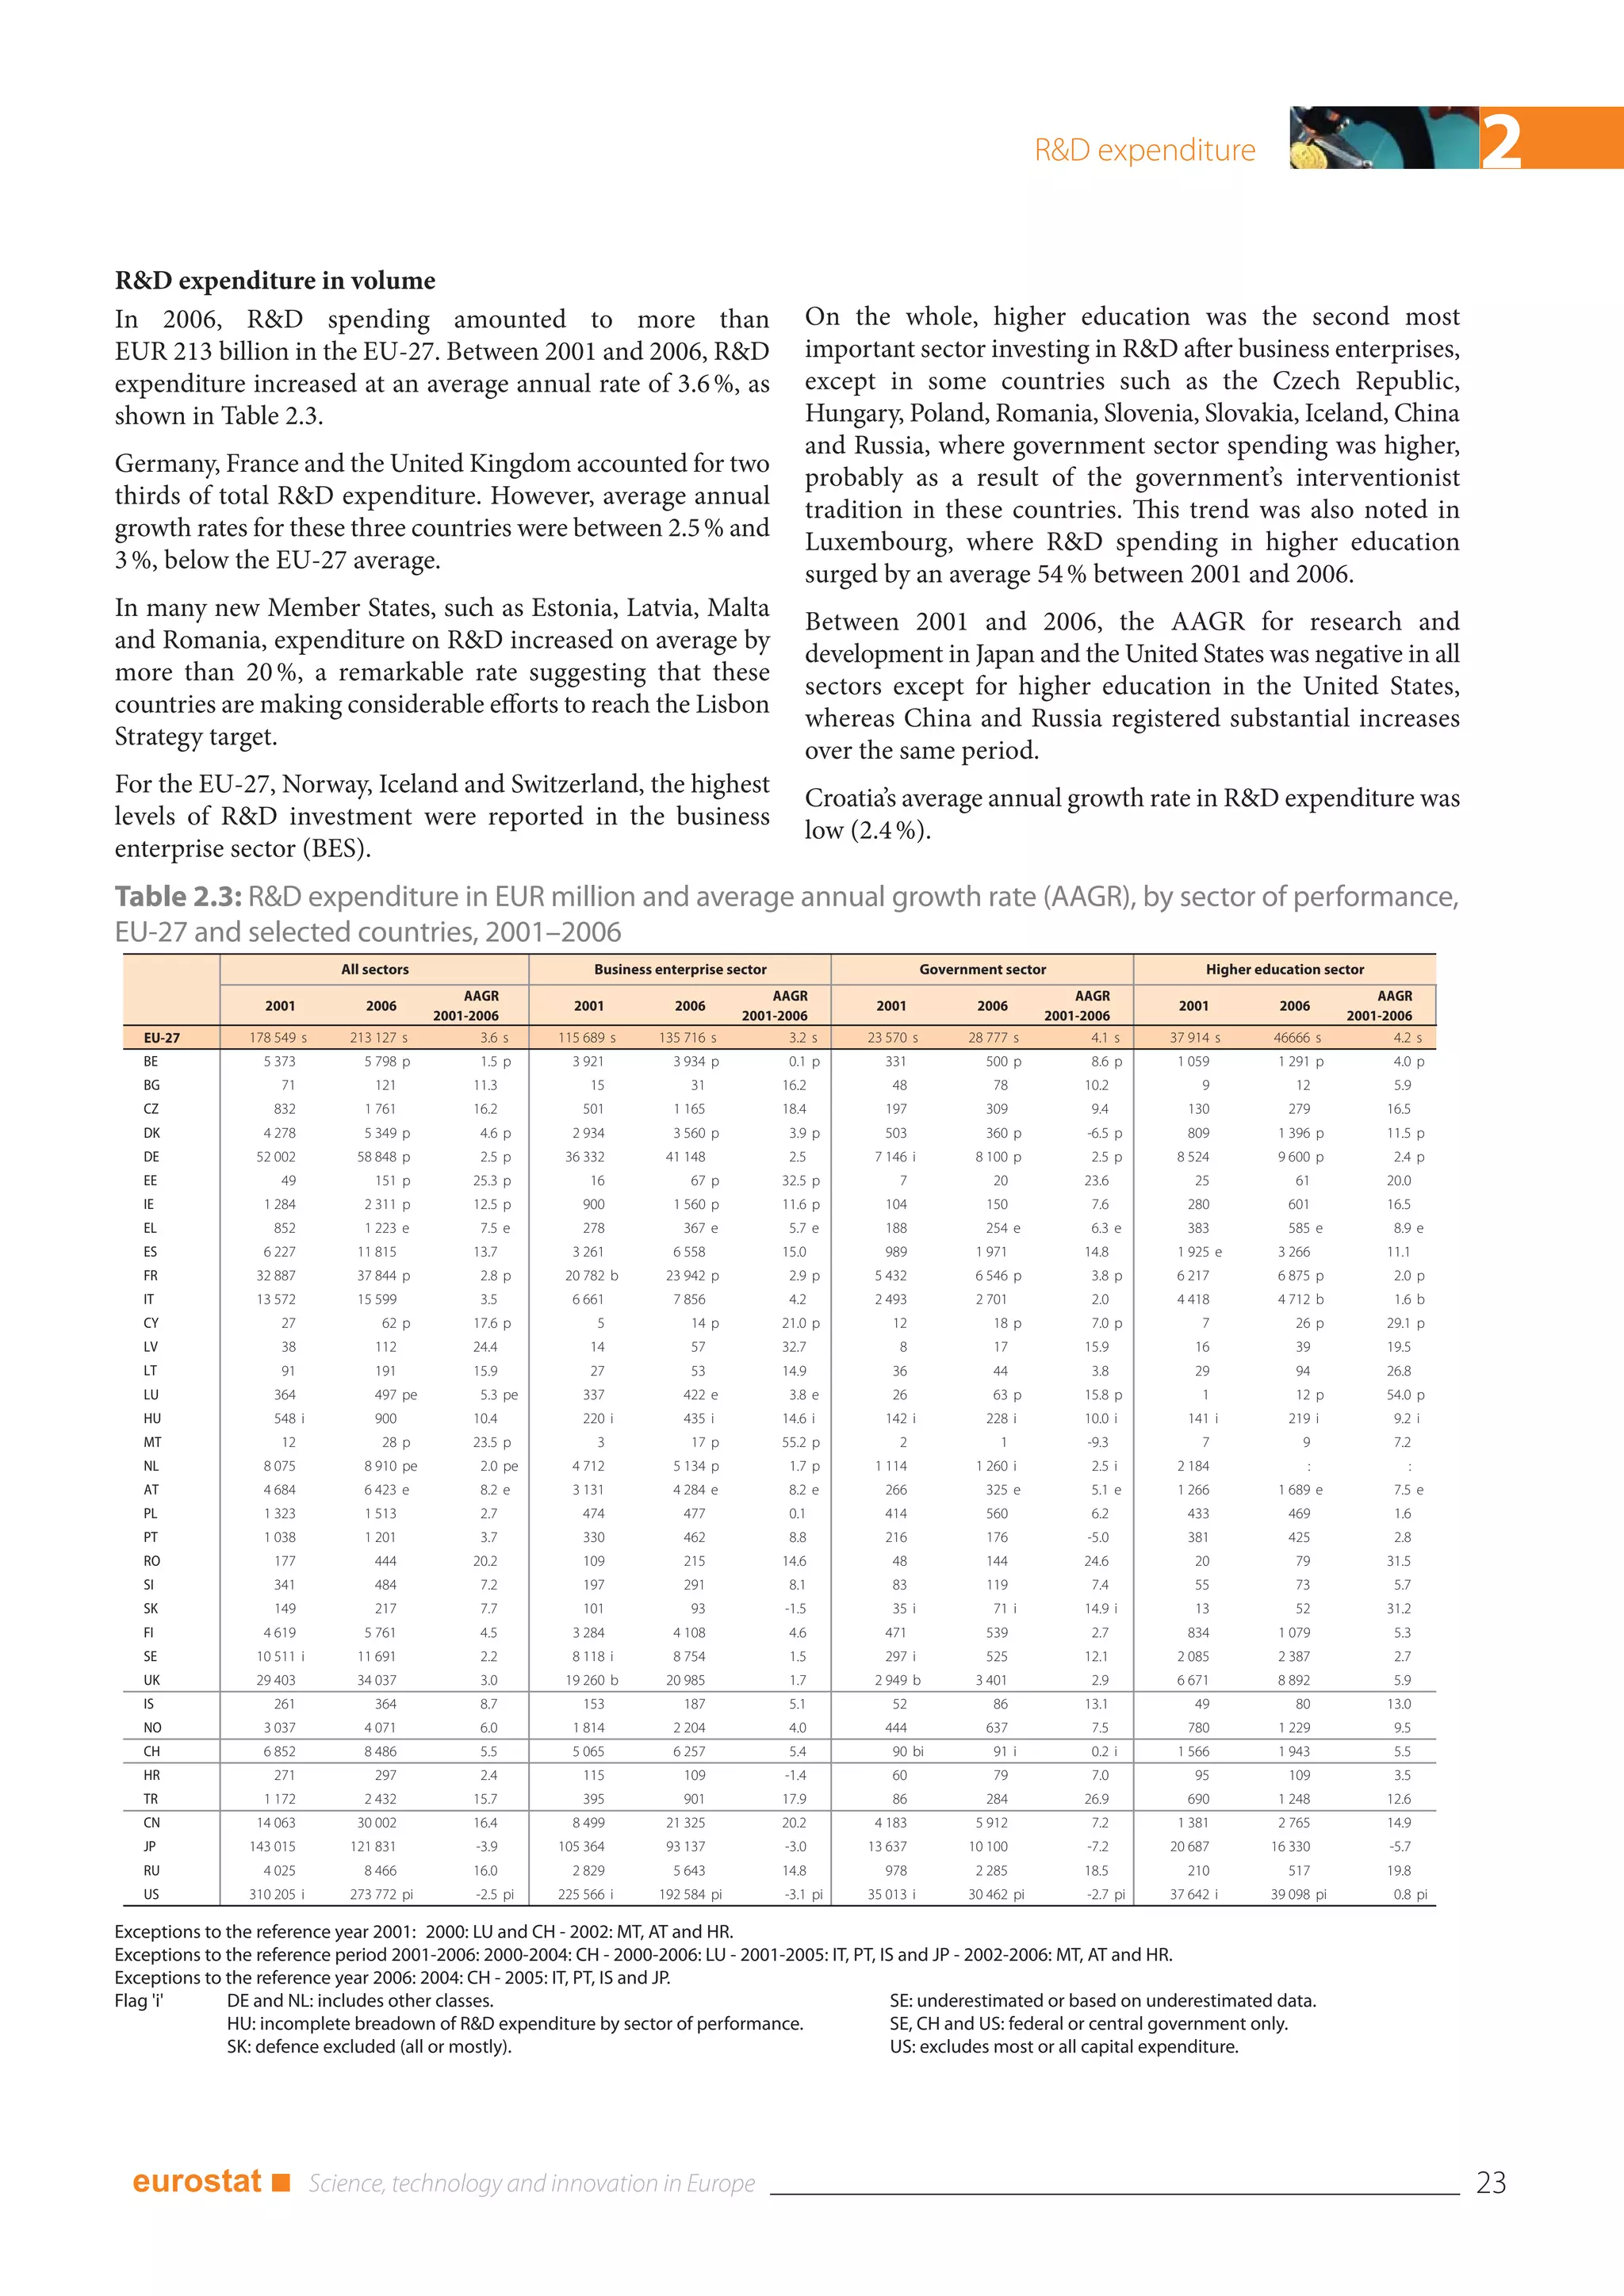
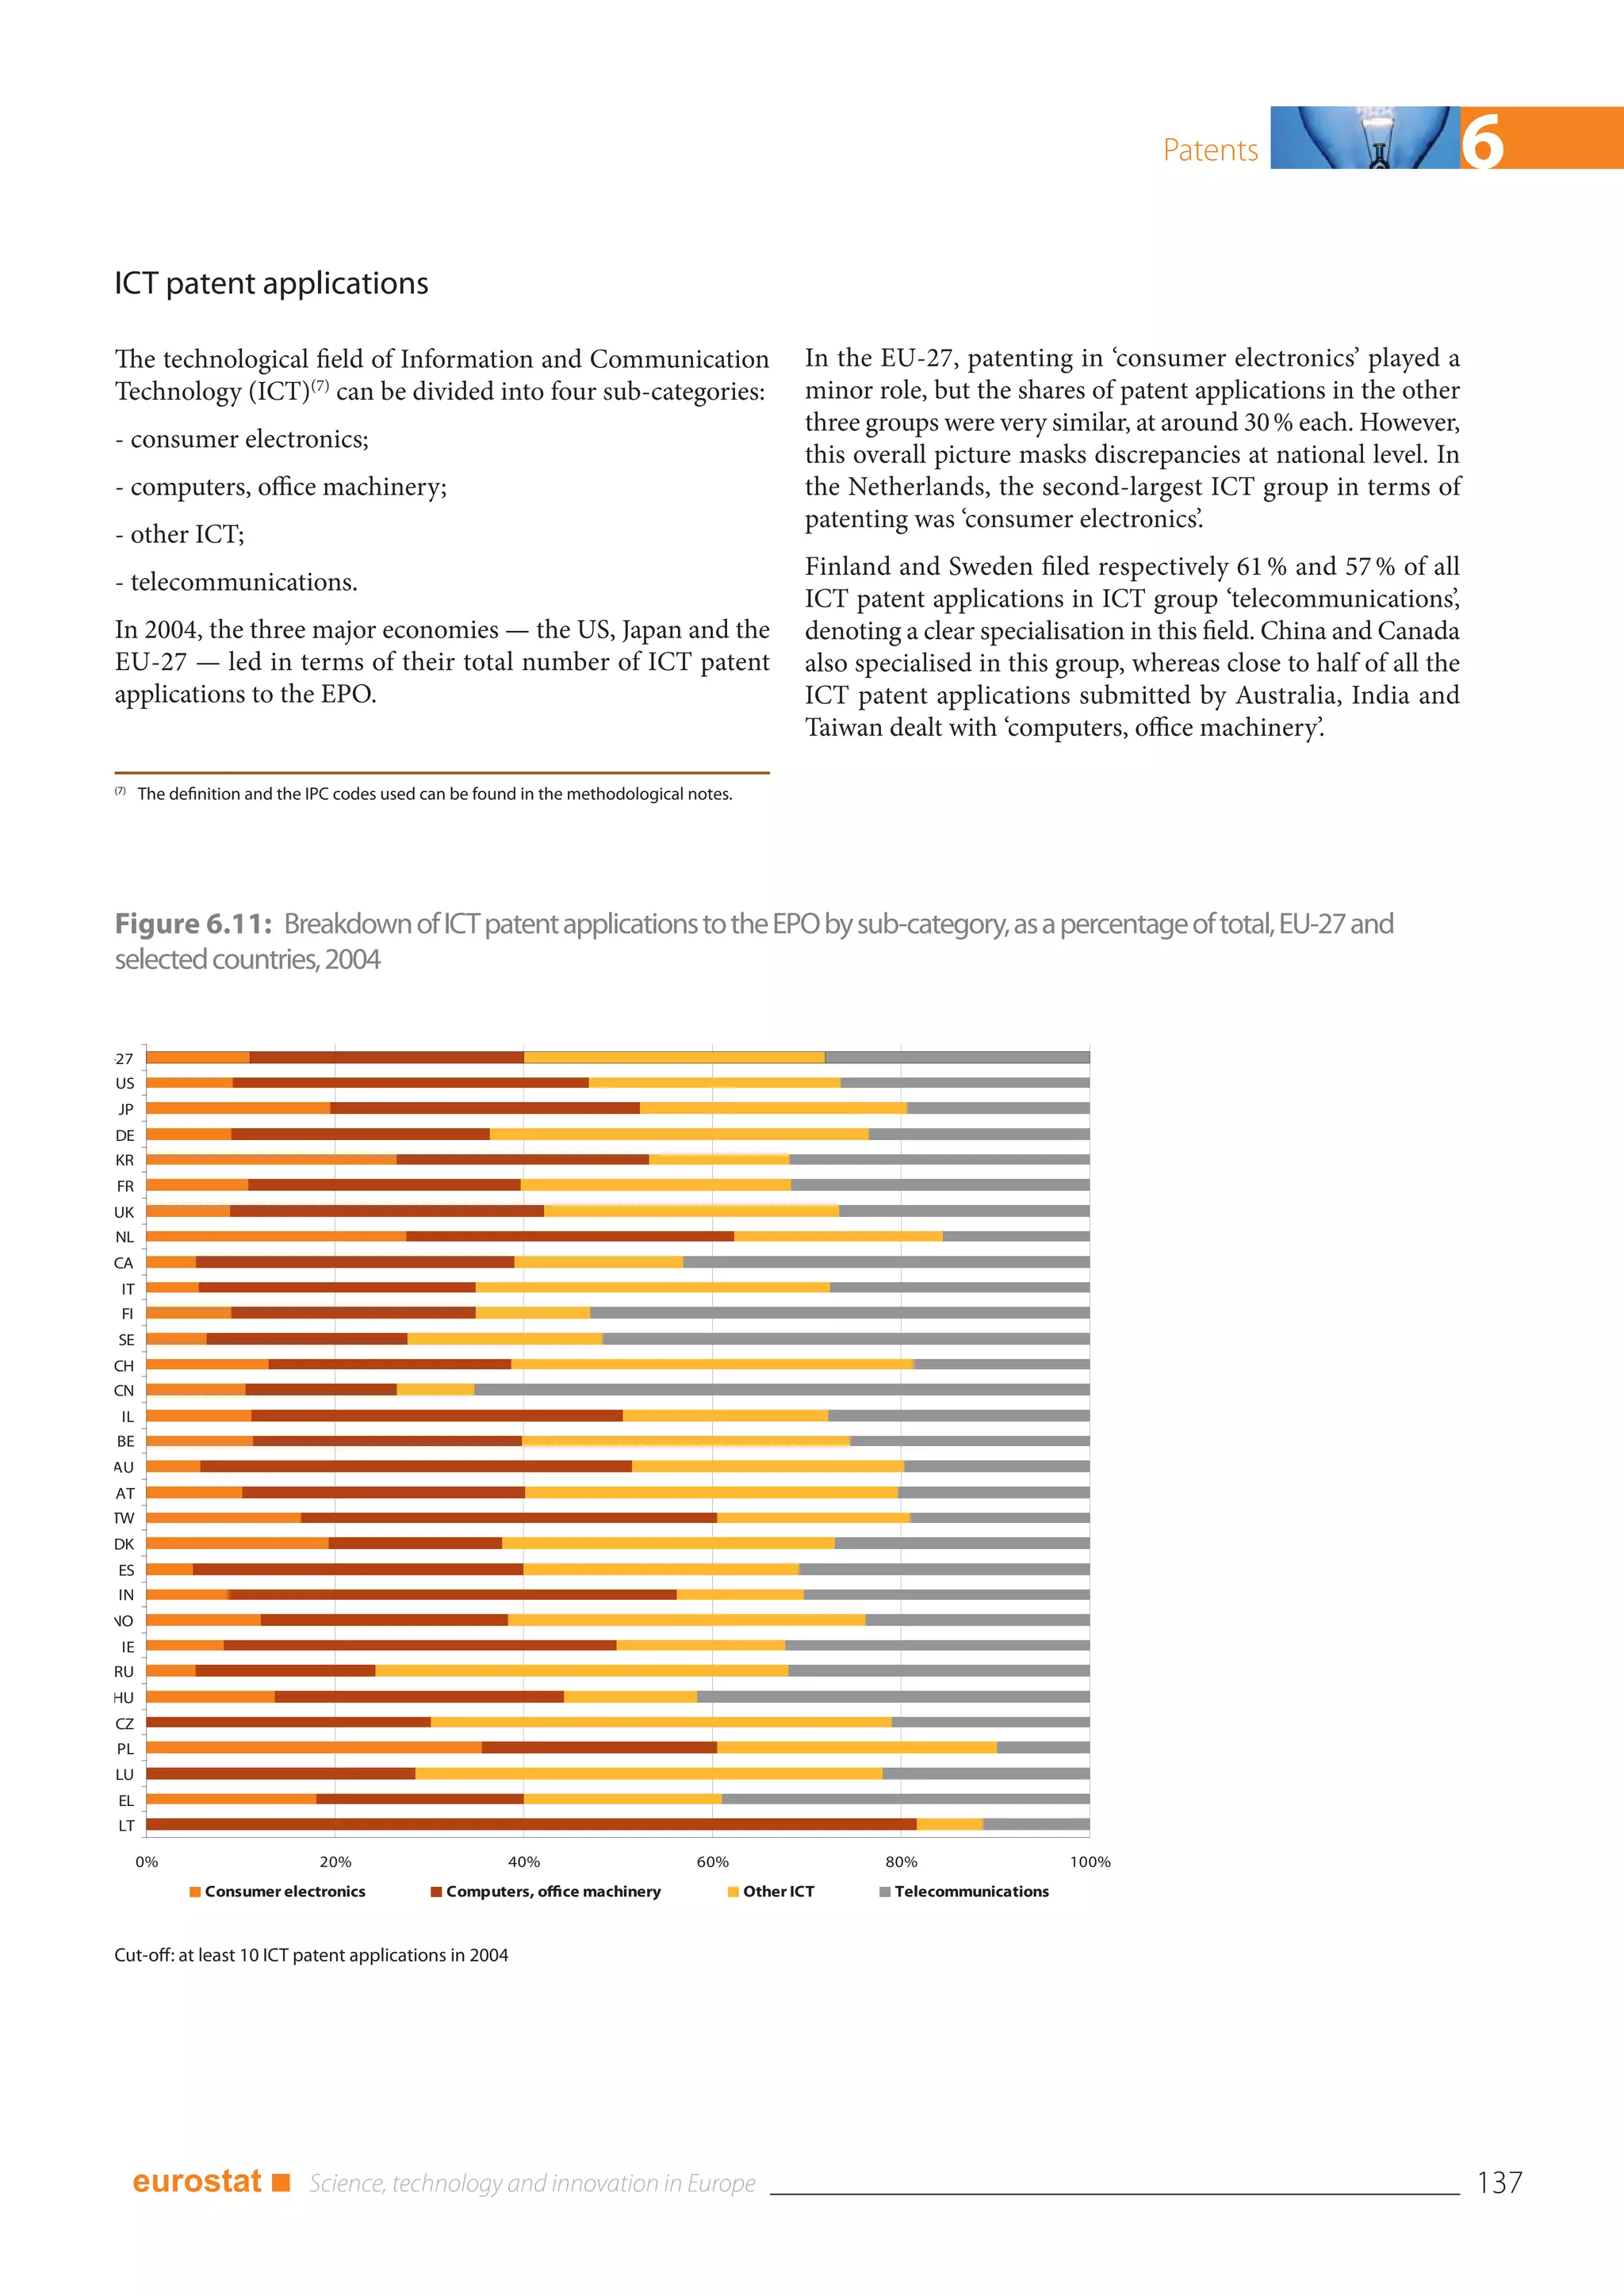
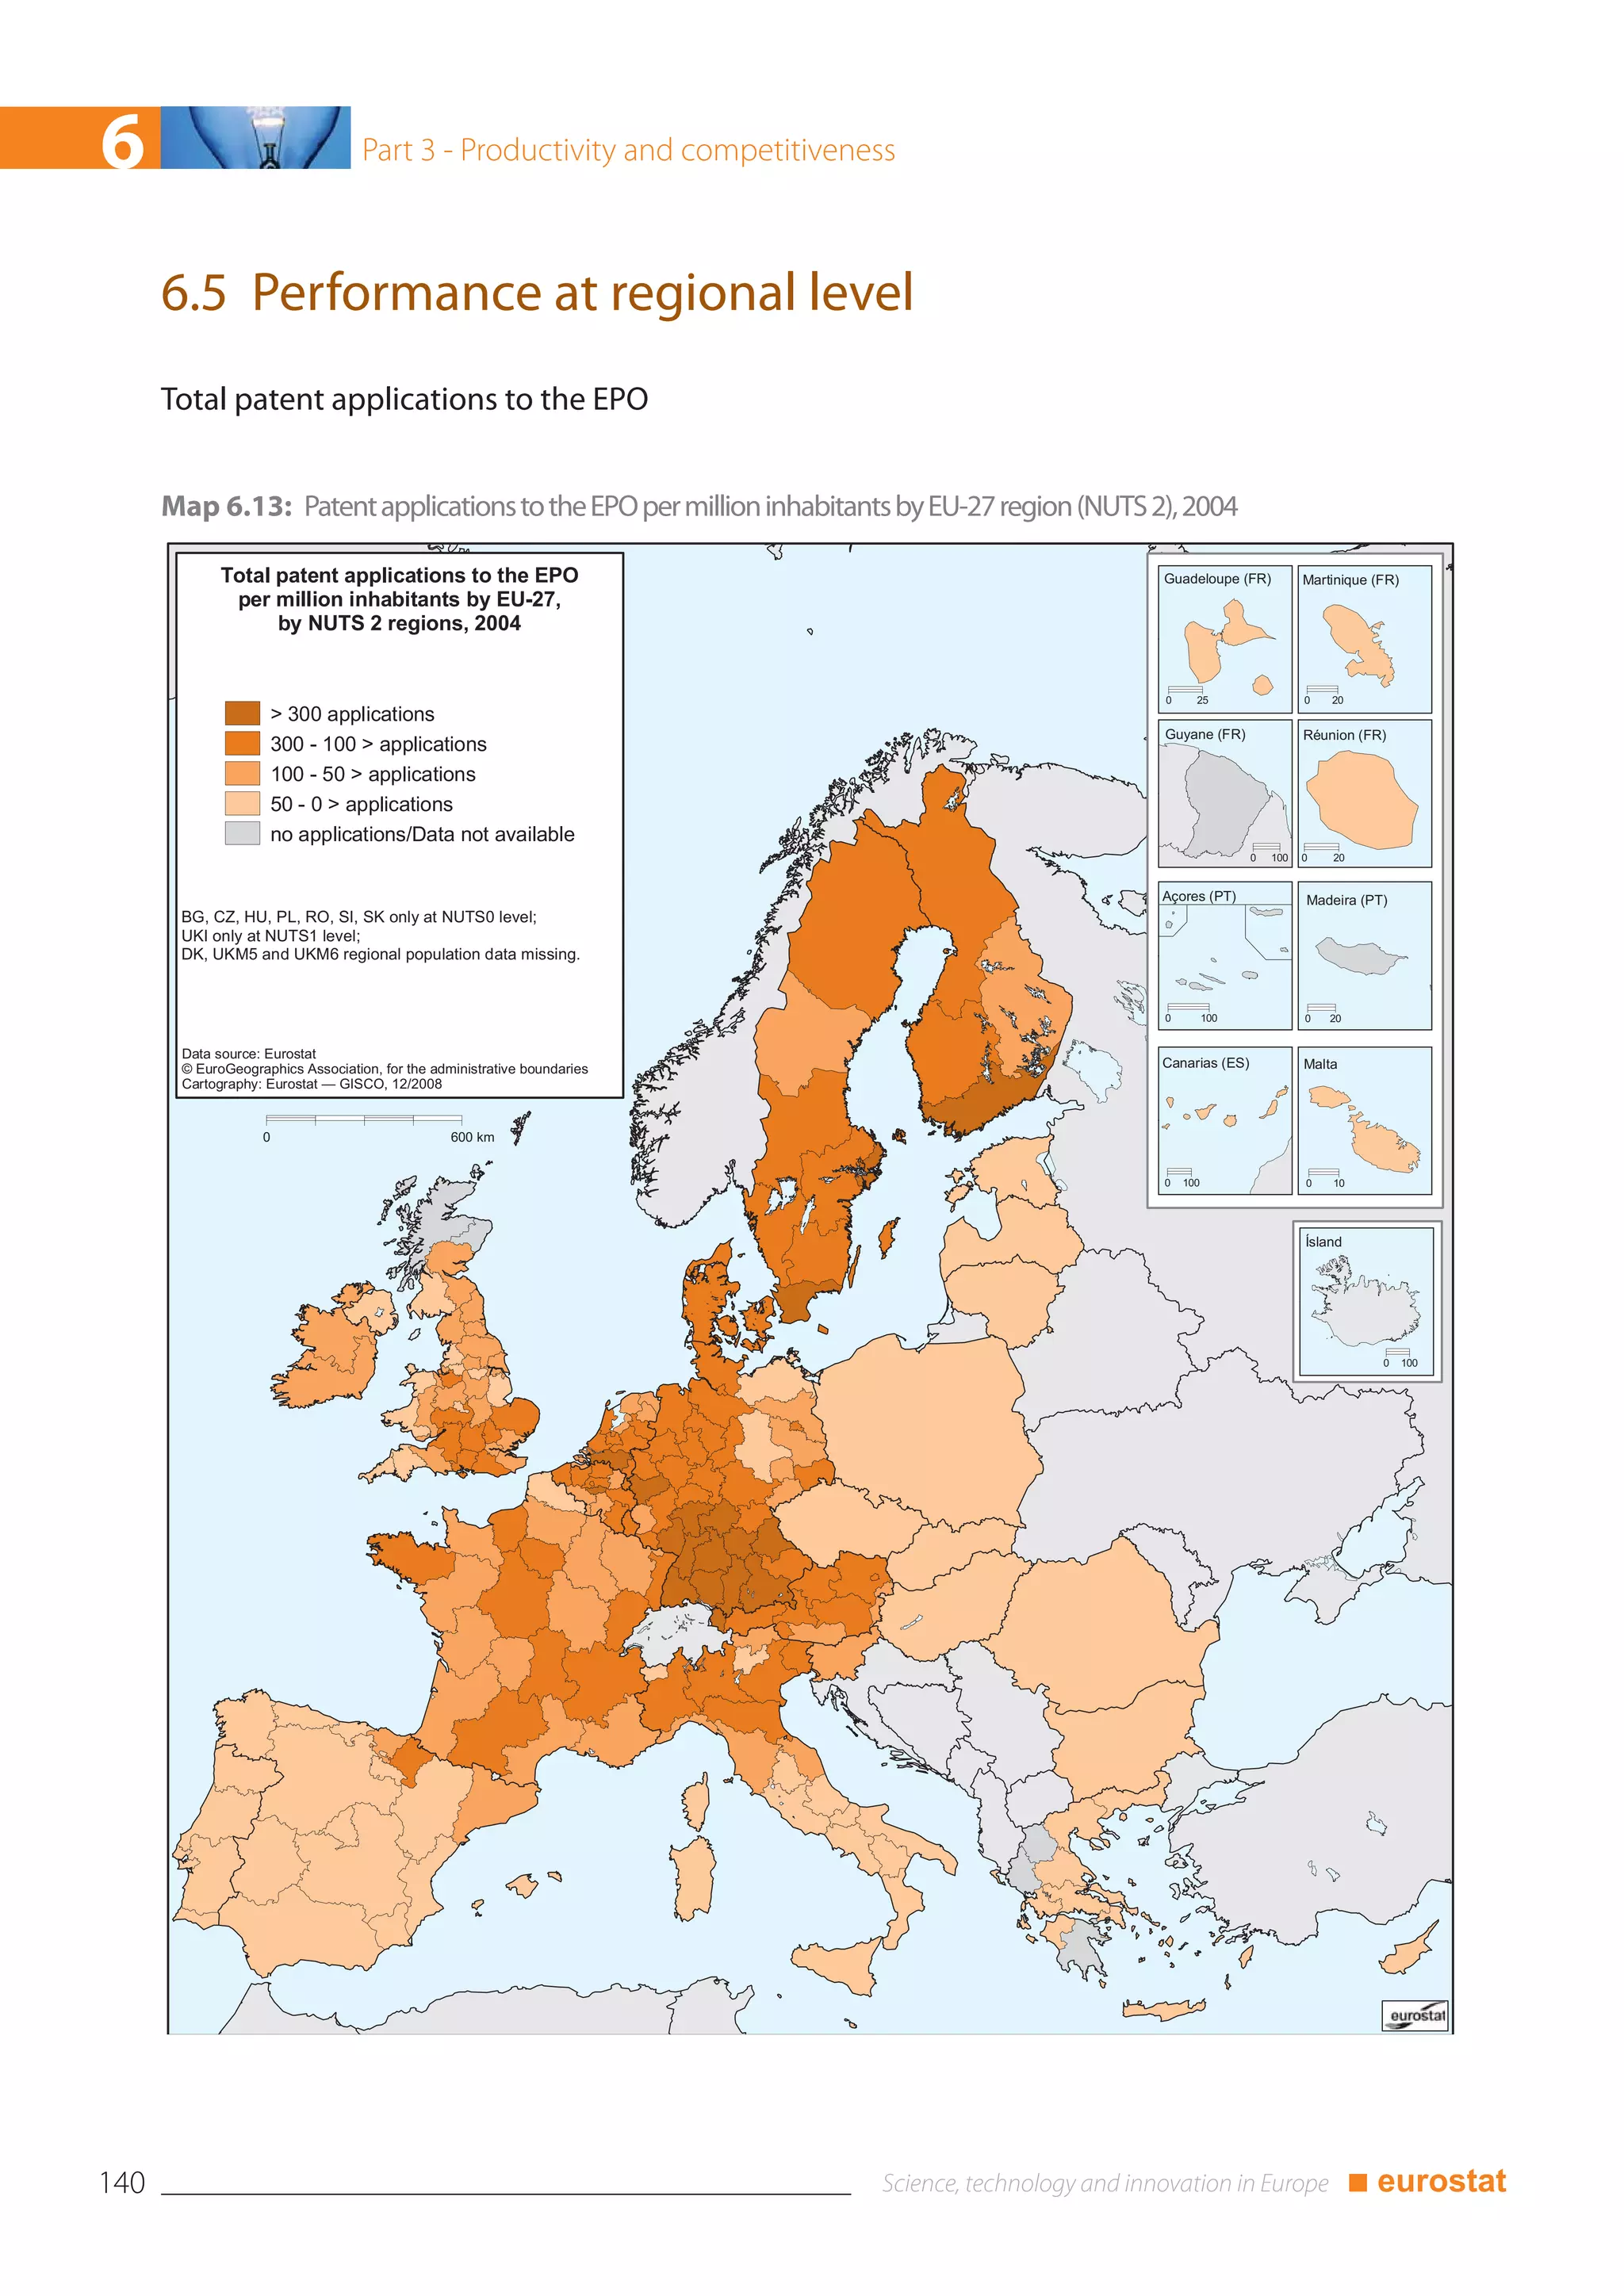
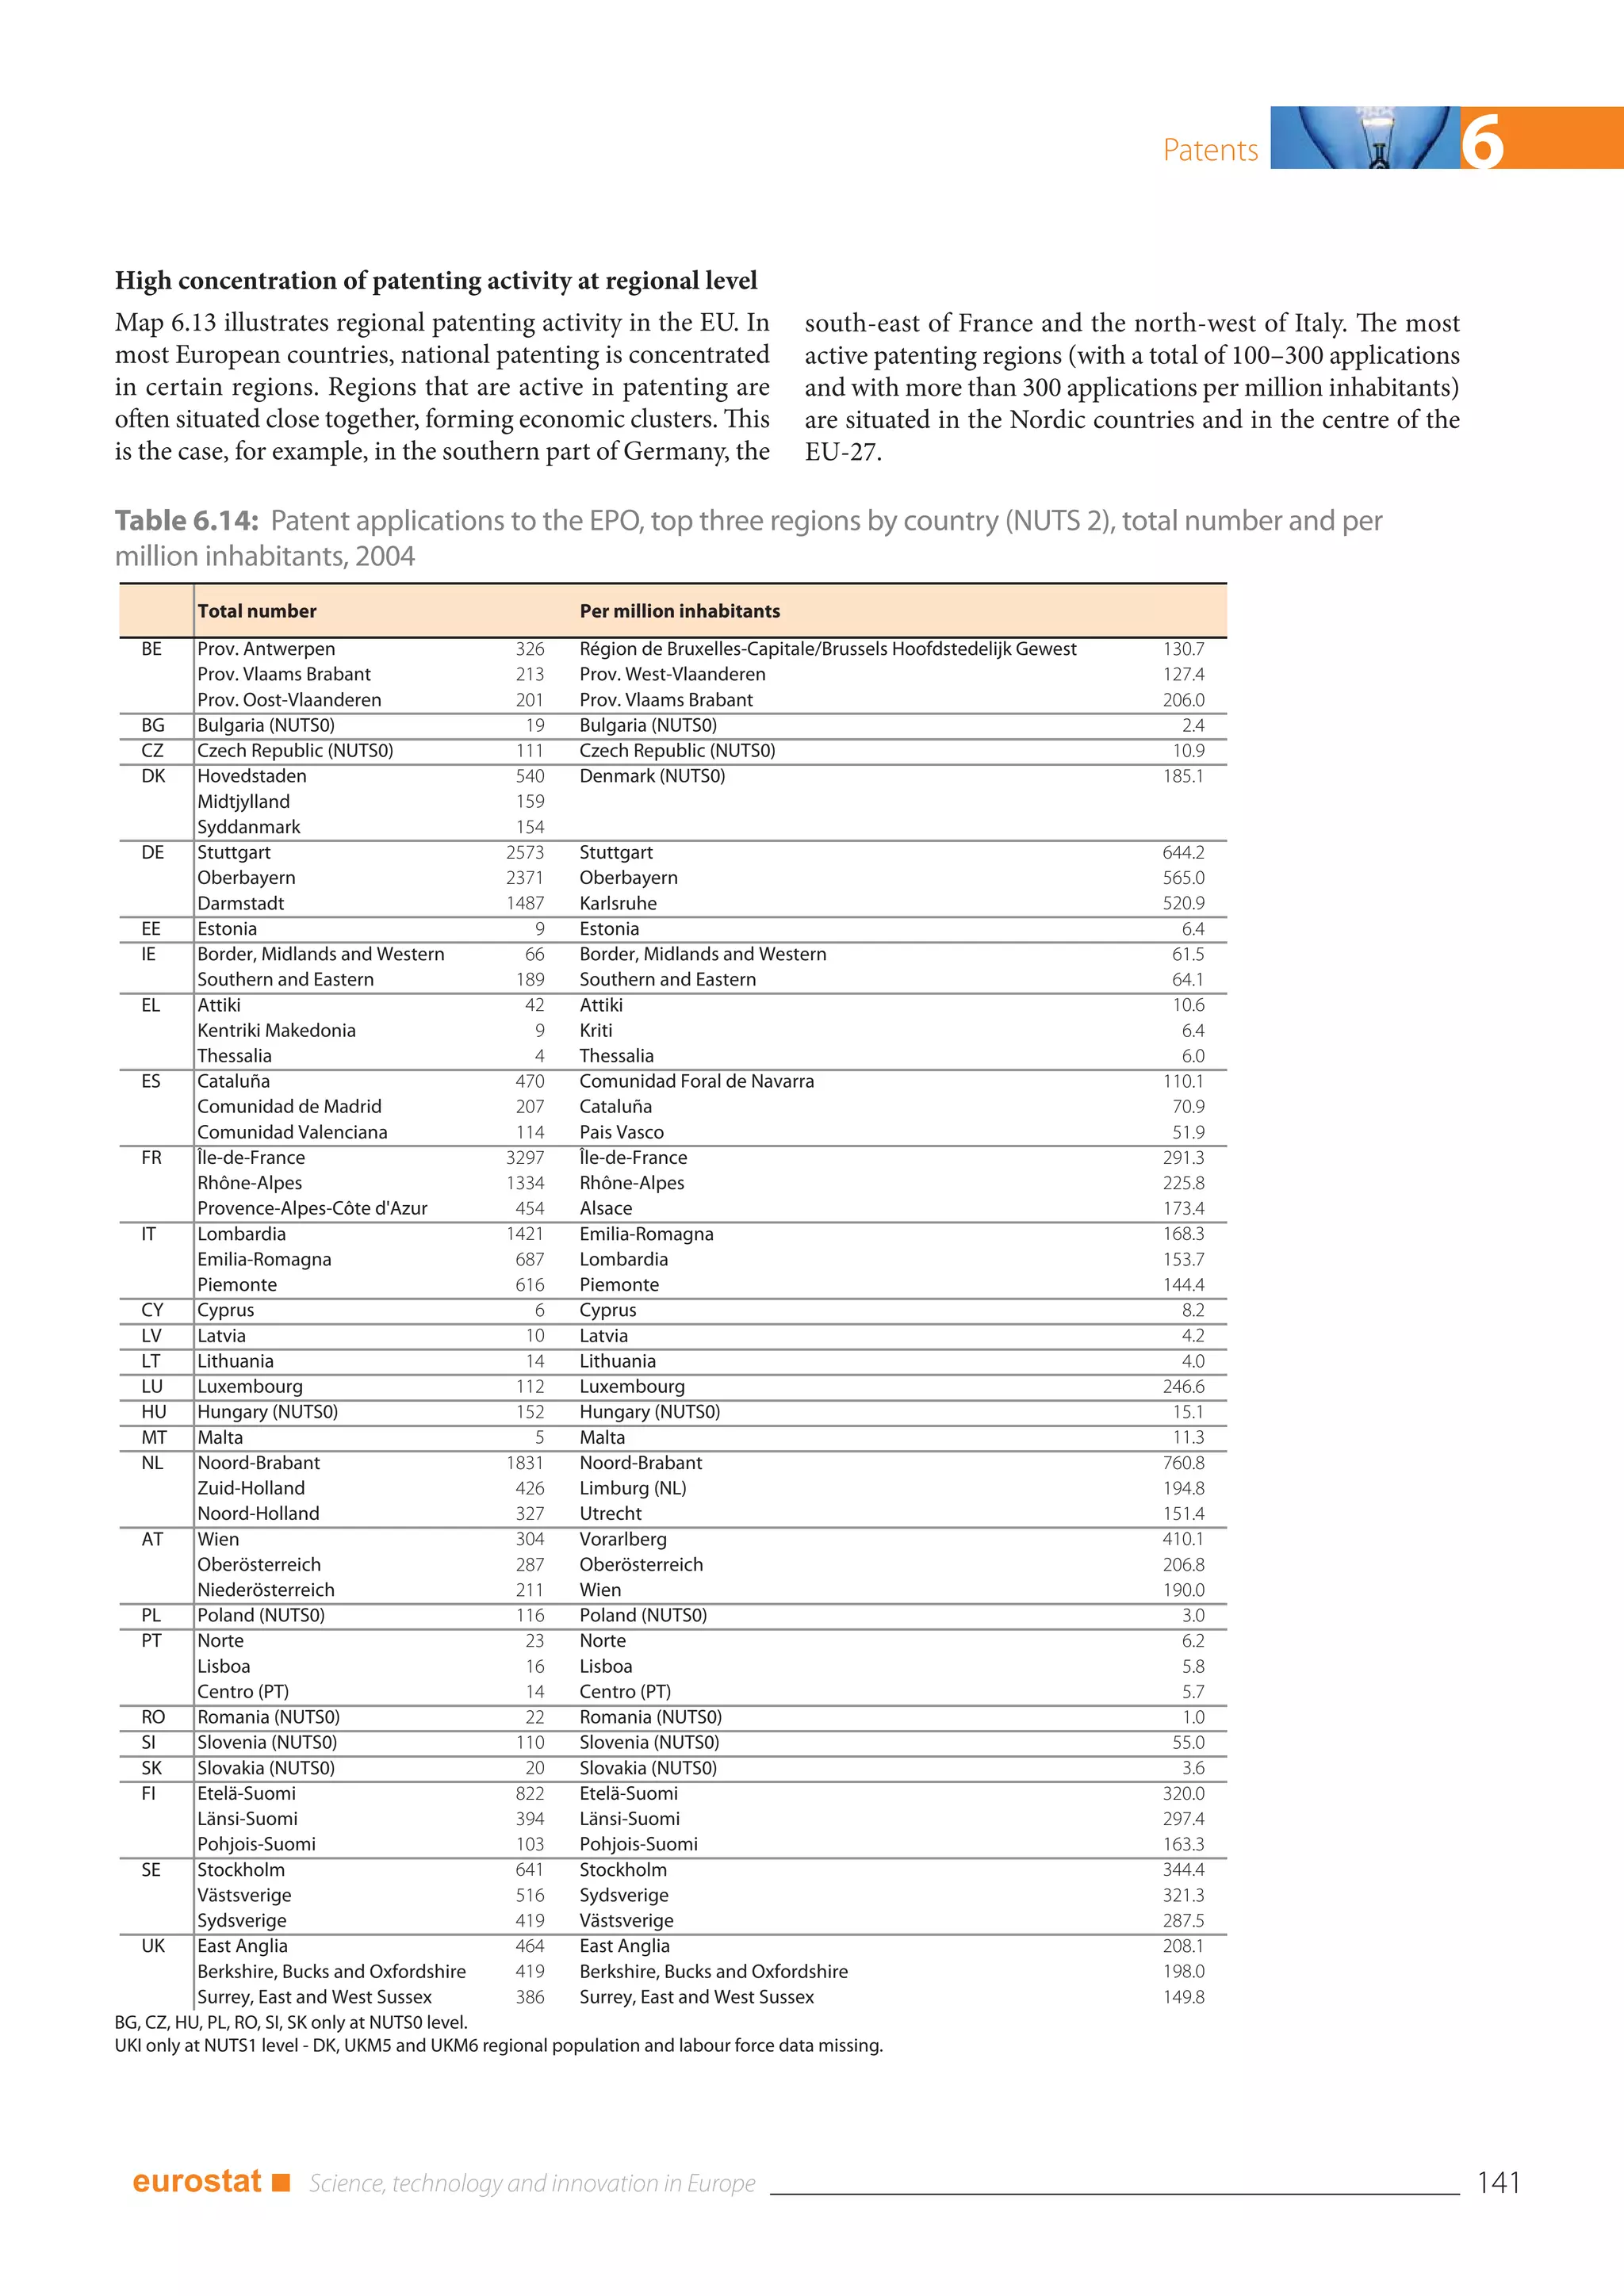
This document provides statistical information on science, technology, and innovation in Europe. It contains three parts: Part 1 focuses on investments in research and development (R&D), including government budget appropriations for R&D and total R&D expenditure at the national and regional levels in Europe. Part 2 examines human resources involved in science and technology through data on R&D personnel, education inflows into science fields, stocks of human resources, mobility, and international mobility. Part 3 analyzes productivity and competitiveness through chapters on innovation, patents, high-tech industries, knowledge-based services, and a scoreboard ranking the largest EU industrial companies. The document contains tables, figures, and


