Downloaded 56 times
![
log 1+ log 1
− −
1 − 1 ; (B) p + q ; (C)
4
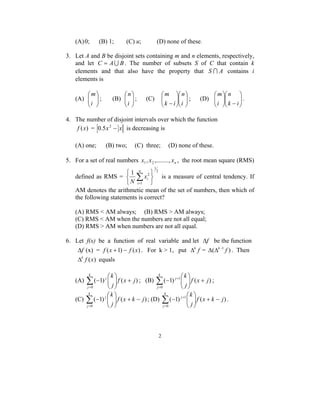
11. Let f (x) =
x
x
q
x
p
, x ≠ 0. If f is continuous at
x = 0, then the value of f(0) is
(A)
p q
1 + 1 ; (D) none of these.
p q
12. Consider four positive numbers 1 x , 2 x , 1 y , 2 y such that 1 y 2 y > 1 x 2 x .
Consider the number 1 2 2 1 1 2 S = (x y + x y ) − 2x x . The number S is
(A) always a negative integer;
(B) can be a negative fraction;
(C) always a positive number;
(D) none of these.
13. Given x ≥ y ≥ z, and x + y + z = 12, the maximum value of
x + 3y + 5z is
(A) 36; (B) 42; (C) 38; (D) 32.
14. The number of positive pairs of integral values of (x, y) that solves
2xy − 4x2 +12x − 5y = 11 is
(A) 4; (B) 1; (C) 2; (D) none of these.
15. Consider any continuous function f : [0, 1] → [0, 1]. Which one of
the following statements is incorrect?
(A) f always has at least one maximum in the interval [0, 1];
(B) f always has at least one minimum in the interval [0, 1];
(C) ∃ x ∈ [0, 1] such that f(x) = x;
(D) the function f must always have the property that f(0) ∈ {0, 1},
f(1) ∈ {0, 1} and f(0) + f(1) =1.](https://image.slidesharecdn.com/isi2006-140907060007-phpapp01/85/ISI-MSQE-Entrance-Question-Paper-2006-4-320.jpg)

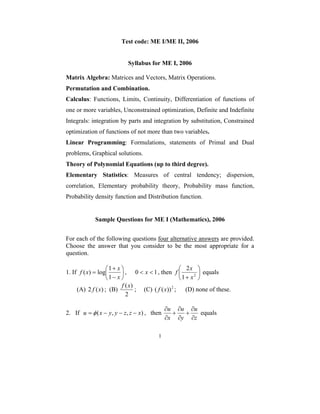
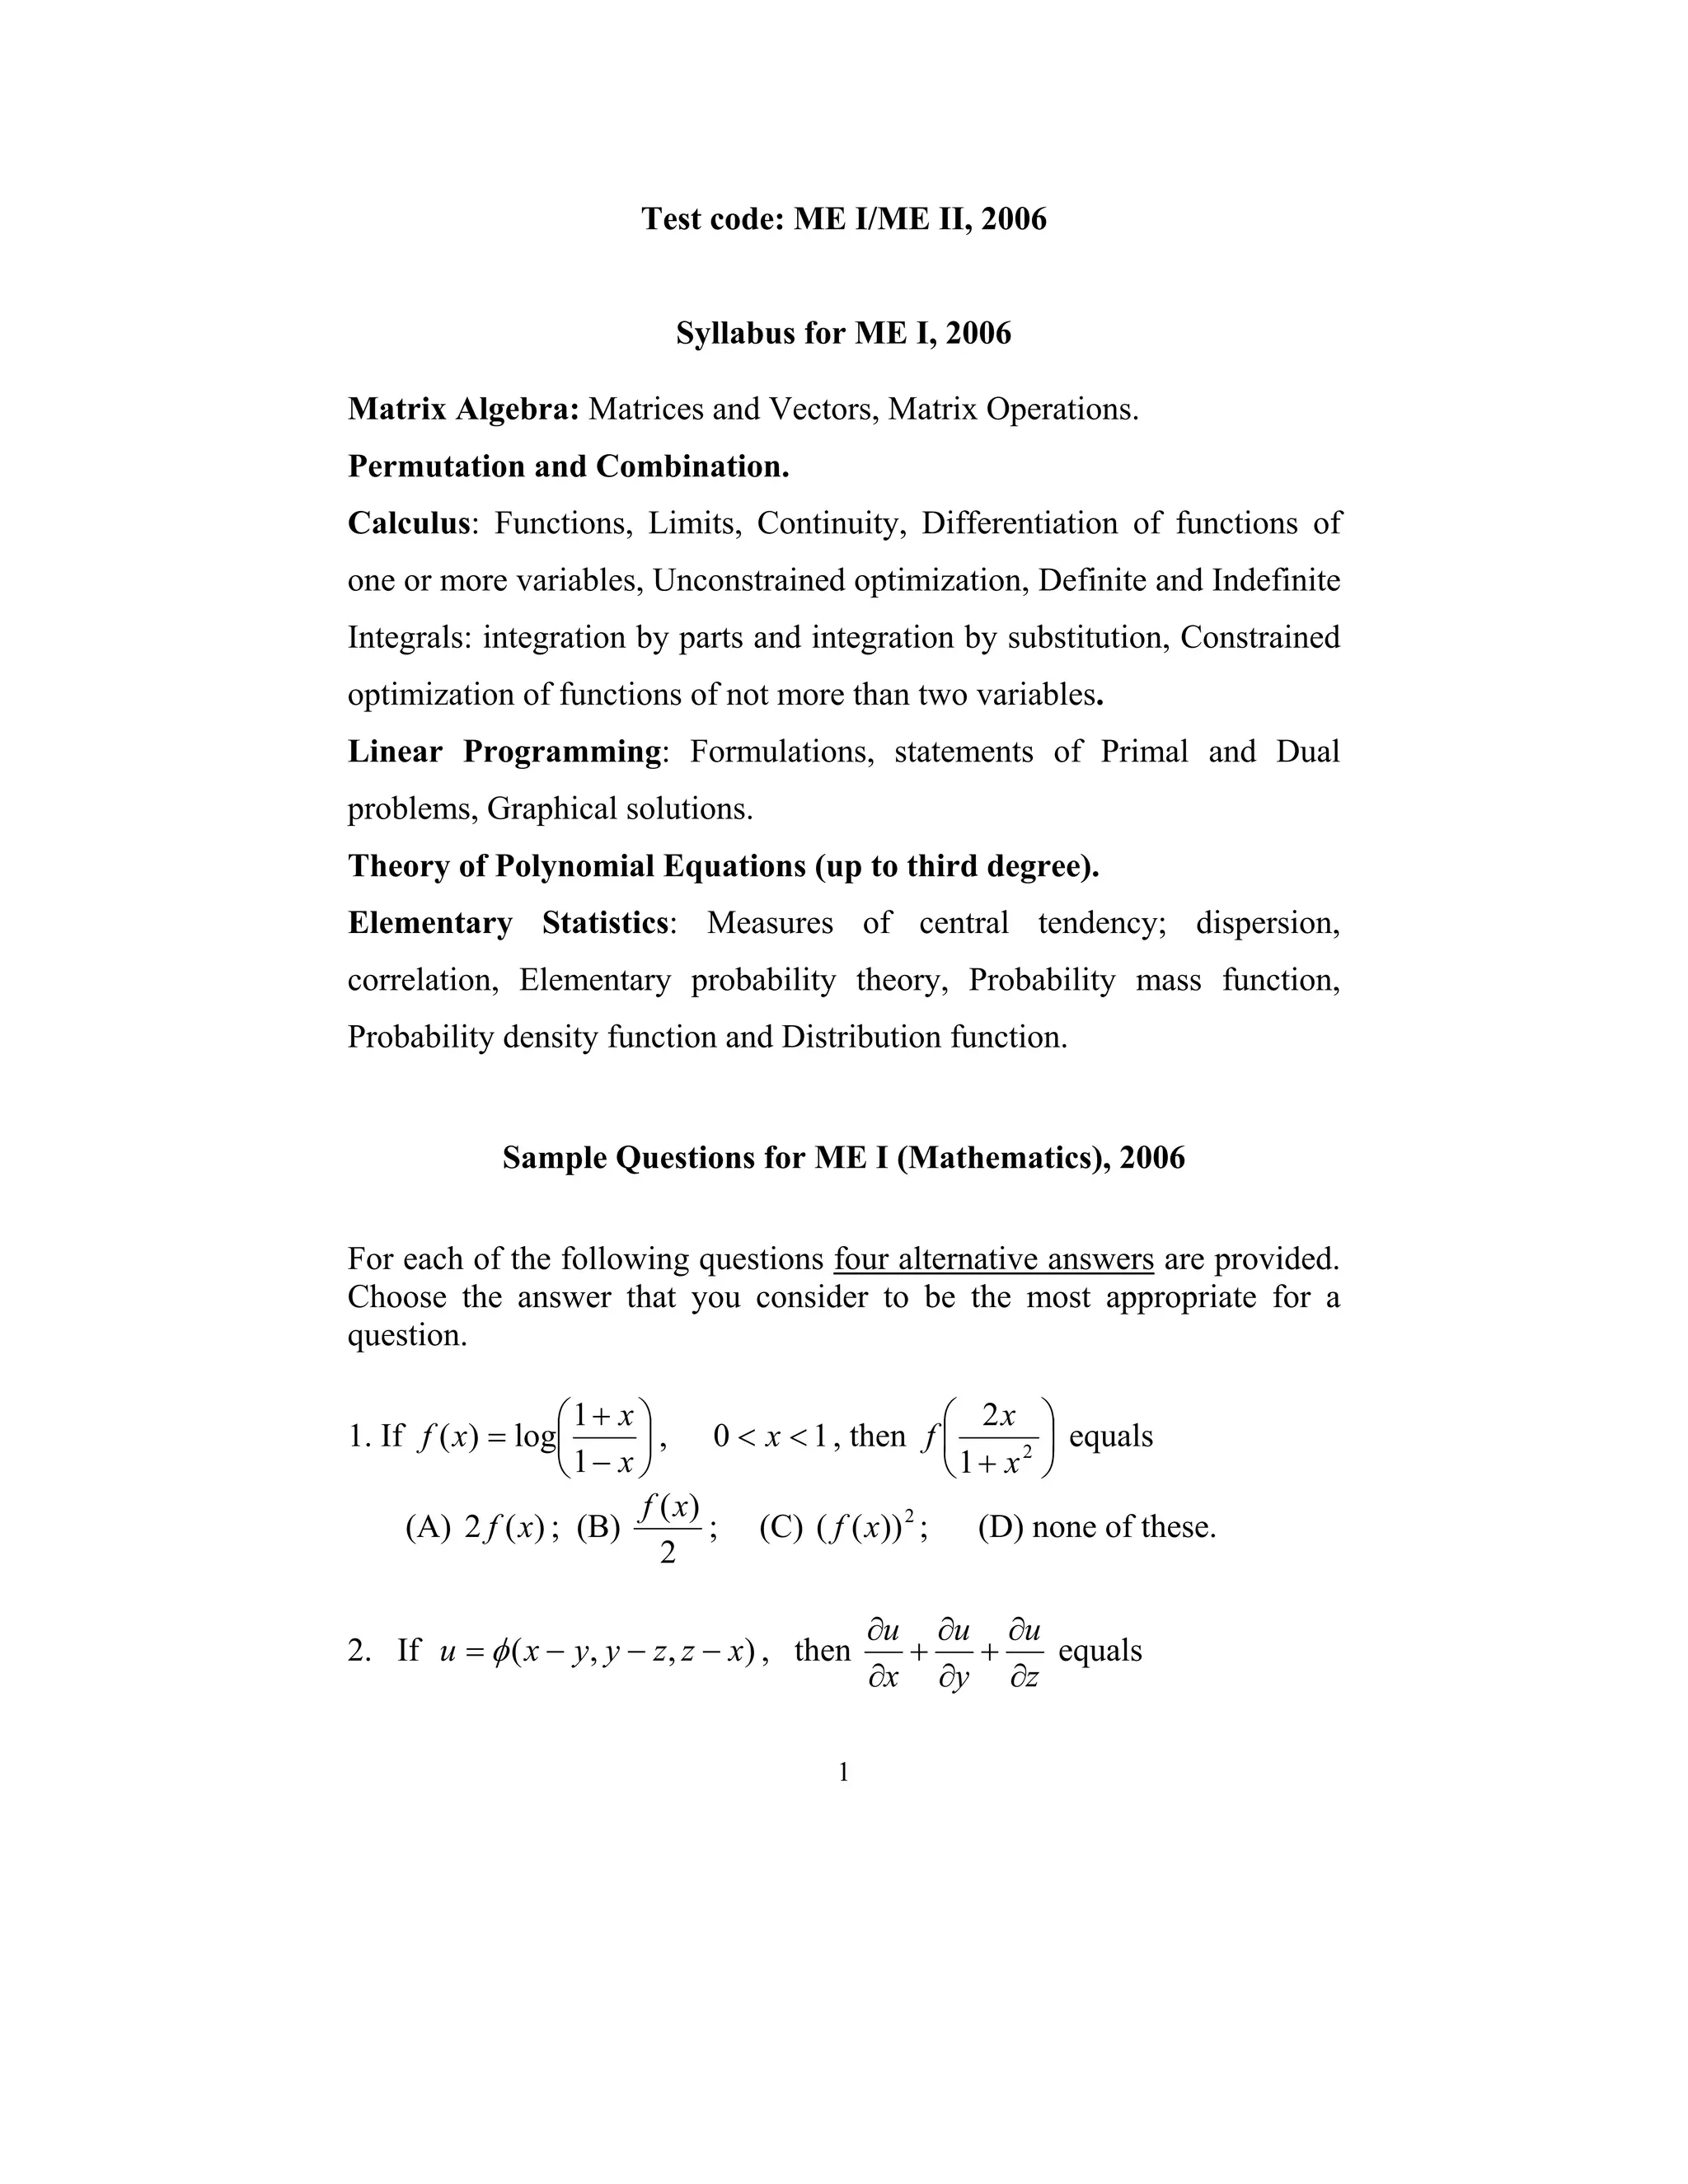
The document provides detailed syllabi for mathematics and economics courses for 2006, including topics and concepts in calculus, linear programming, probability, consumer behavior, market forms, national income accounting, and various economic models. It includes sample questions for both subjects, testing understanding of mathematical principles and economic theories. The mathematics section covers matrix algebra, polynomial equations, and basic statistics, while the economics section discusses micro and macroeconomic theories, including utility functions and labor market dynamics.