Download to read offline
![International Research Journal of Engineering and Technology (IRJET) e-ISSN: 2395-0056
Volume: 06 Issue: 07 | July 2019 www.irjet.net p-ISSN: 2395-0072
© 2019, IRJET | Impact Factor value: 7.211 | ISO 9001:2008 Certified Journal | Page 2241
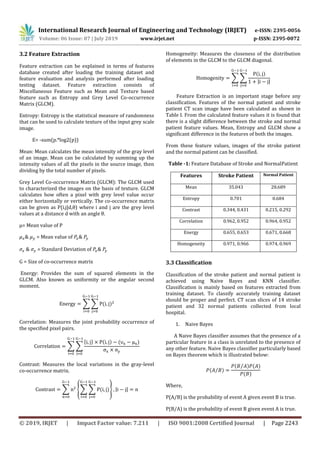
Acute Ischemic Stroke Detection and Classification
S.R. Tongase1, S.S. Thorat2
1P.G. Scholar, Dept. of Electronics Engineering, GCOE, Amravati
2Assitant Professor, Dept. of Electronics Engineering, GCOE, Amravati
----------------------------------------------------------------------***---------------------------------------------------------------------
Abstract - Ischemic stroke is more common hence,
identification of ischemic stroke and detection of region of
brain affected is more important. CT (Computed
Tomography) scan images are widely use in rehabilitation
process. This paper presents the method to detect the stroke
region and classify normal and stroke patient.
Preprocessing operation perform on the input CT scan
image and skull part removed from the image. Stroke region
segmented from the image using morphological operation
and highlighted the region on original CT image or if CT
scan image is normal case then it shows that patient is
normal. Naive Bayes (NB) and k- Nearest Neighbor (k-NN)
classifiers are used for classification of stroke patient and
normal patient. Classification accuracy of NB and KNN is
92% for 25 image slices of different patient. Processing time
of K-NN classifier is 8.80s while for Naive Bayes 5.85 s.
Key Words: Computed Tomography, Ischemic Stroke,
Naive Bayes, k- Nearest Neighbor, GLCM
1. INTRODUCTION
Stroke is a Cerebro Vascular Accident (CVA) which is a
serious health issue and it is forward in reason of death
worldwide. Stroke is becoming main reason in cause of
disability, dementia and death in the developing countries.
Stroke affects the person who may be disabled and their
family also. Stroke is cause by interruption in supply of
blood to the brain, generally because of blood vessel burst
or blockage due to blood clot as shown in Fig. 1. This
interruption in supply of nutrients and oxygen to the
brain, results into the damage of brain tissue. Stroke is
divided into two types which are Ischemic and
Hemorrhagic. Abrupt occlusion of arteries supplying the
brain is the main cause of Ischemic Stroke [18].
Hemorrhagic stroke are cause by subarachnoid
hemorrhage- bleeding from one of the brain arteries into
the brain tissue or intra-cerebral hemorrhage - arterial
bleeding.
Almost 80 percent of strokes are ischemic stroke[18].
Hence it is required to detect the stroke in early stages.
Computed Tomography Scan images are widely for the
diagnosis of stroke. In CT scan dataset Ischemic stroke
appears as dark area with the contrast and hemorrhage as
bright region.
The proposed method used image processing
techniques such as median filtering, segmentation,
morphological operation. Naive Bayes and k- Nearest
Neighbor (k-NN) classifiers are used for the classification.
Fig -1: Supply of blood to the brain through vessel
Obstructed
2. LITERATURE SURVEY
Stroke can be diagnosed, if immediate treatment is
available. Damage to the brain depend on severity of the
stroke and amount time period for which the stroke occur.
CT(Computed Tomography) scan and MRI(Magnetic
Resonance Imaging) used in the rehabilitation process of
stroke, whereas CT scan is easily available, less costly and
widely used.
P. R. Mirajkar [4] proposed an algorithm to detect of
an acute ischemic stroke utilizing CT scan and MRI dataset.
CT scan images and Diffusion Weighted MRI are fused
which results in a composite image. This image provides
more information than single modality which is
accomplished using DWT. The algorithm is tested on 18
cases and for 16 cases stroke region is identified precisely.
A. F. Z. Yahiaoui [5] derived a method for the segmentation
of the Ischemic Stroke from CT scan images. FCM
clustering technique is used to segment the stroke region
of the brain. 10.46 s is average processing time achieved.
Dr. Menaka R [6] derived an algorithm for the detection of
an Ischemic Stroke from MRI dataset utilizing wavelet
transform. Classification of Normal and abnormal brain is
attain using watershed segmentation. Texture analysis is
performed using Grey Level Co-occurrence Matrix (GLCM)
and wavelet features extracted. Neural Network is applied
on FPGA by making Xillinx Simulink Blocks. Jeena R S [7]](https://image.slidesharecdn.com/irjet-v6i7319-191112065055/85/IRJET-Acute-Ischemic-Stroke-Detection-and-Classification-1-320.jpg)
![International Research Journal of Engineering and Technology (IRJET) e-ISSN: 2395-0056
Volume: 06 Issue: 07 | July 2019 www.irjet.net p-ISSN: 2395-0072
© 2019, IRJET | Impact Factor value: 7.211 | ISO 9001:2008 Certified Journal | Page 2241
Acute Ischemic Stroke Detection and Classification
S.R. Tongase1, S.S. Thorat2
1P.G. Scholar, Dept. of Electronics Engineering, GCOE, Amravati
2Assitant Professor, Dept. of Electronics Engineering, GCOE, Amravati
----------------------------------------------------------------------***---------------------------------------------------------------------
Abstract - Ischemic stroke is more common hence,
identification of ischemic stroke and detection of region of
brain affected is more important. CT (Computed
Tomography) scan images are widely use in rehabilitation
process. This paper presents the method to detect the stroke
region and classify normal and stroke patient.
Preprocessing operation perform on the input CT scan
image and skull part removed from the image. Stroke region
segmented from the image using morphological operation
and highlighted the region on original CT image or if CT
scan image is normal case then it shows that patient is
normal. Naive Bayes (NB) and k- Nearest Neighbor (k-NN)
classifiers are used for classification of stroke patient and
normal patient. Classification accuracy of NB and KNN is
92% for 25 image slices of different patient. Processing time
of K-NN classifier is 8.80s while for Naive Bayes 5.85 s.
Key Words: Computed Tomography, Ischemic Stroke,
Naive Bayes, k- Nearest Neighbor, GLCM
1. INTRODUCTION
Stroke is a Cerebro Vascular Accident (CVA) which is a
serious health issue and it is forward in reason of death
worldwide. Stroke is becoming main reason in cause of
disability, dementia and death in the developing countries.
Stroke affects the person who may be disabled and their
family also. Stroke is cause by interruption in supply of
blood to the brain, generally because of blood vessel burst
or blockage due to blood clot as shown in Fig. 1. This
interruption in supply of nutrients and oxygen to the
brain, results into the damage of brain tissue. Stroke is
divided into two types which are Ischemic and
Hemorrhagic. Abrupt occlusion of arteries supplying the
brain is the main cause of Ischemic Stroke [18].
Hemorrhagic stroke are cause by subarachnoid
hemorrhage- bleeding from one of the brain arteries into
the brain tissue or intra-cerebral hemorrhage - arterial
bleeding.
Almost 80 percent of strokes are ischemic stroke[18].
Hence it is required to detect the stroke in early stages.
Computed Tomography Scan images are widely for the
diagnosis of stroke. In CT scan dataset Ischemic stroke
appears as dark area with the contrast and hemorrhage as
bright region.
The proposed method used image processing
techniques such as median filtering, segmentation,
morphological operation. Naive Bayes and k- Nearest
Neighbor (k-NN) classifiers are used for the classification.
Fig -1: Supply of blood to the brain through vessel
Obstructed
2. LITERATURE SURVEY
Stroke can be diagnosed, if immediate treatment is
available. Damage to the brain depend on severity of the
stroke and amount time period for which the stroke occur.
CT(Computed Tomography) scan and MRI(Magnetic
Resonance Imaging) used in the rehabilitation process of
stroke, whereas CT scan is easily available, less costly and
widely used.
P. R. Mirajkar [4] proposed an algorithm to detect of
an acute ischemic stroke utilizing CT scan and MRI dataset.
CT scan images and Diffusion Weighted MRI are fused
which results in a composite image. This image provides
more information than single modality which is
accomplished using DWT. The algorithm is tested on 18
cases and for 16 cases stroke region is identified precisely.
A. F. Z. Yahiaoui [5] derived a method for the segmentation
of the Ischemic Stroke from CT scan images. FCM
clustering technique is used to segment the stroke region
of the brain. 10.46 s is average processing time achieved.
Dr. Menaka R [6] derived an algorithm for the detection of
an Ischemic Stroke from MRI dataset utilizing wavelet
transform. Classification of Normal and abnormal brain is
attain using watershed segmentation. Texture analysis is
performed using Grey Level Co-occurrence Matrix (GLCM)
and wavelet features extracted. Neural Network is applied
on FPGA by making Xillinx Simulink Blocks. Jeena R S [7]](https://image.slidesharecdn.com/irjet-v6i7319-191112065055/75/IRJET-Acute-Ischemic-Stroke-Detection-and-Classification-1-2048.jpg)
![International Research Journal of Engineering and Technology (IRJET) e-ISSN: 2395-0056
Volume: 06 Issue: 07 | July 2019 www.irjet.net p-ISSN: 2395-0072
© 2019, IRJET | Impact Factor value: 7.211 | ISO 9001:2008 Certified Journal | Page 2242
analyzed the MRI and CT images of brain for stroke
diagnosis. The computational of the algorithm time is very
less. Md Tabish raza [8] derived a comparison based
technique for detection of Ischemic tissue, by utilizing CBV
and MTT perfusion map. Status of tissue is classified. T. L.
Tan [9] derived a technique to enhance the contrast of CT
brain images for the detection of acute ischemic stroke.
Proposed method enhanced contrast of soft tissue and
achieved EMEE is 3.9409, PSNR is 32.7426. Kiran Parmar
[10] analyses the fusion of CT scan and MRI images using
wavelet transform. Maximum fusion rule achieved least
MSE and higher PSNR values. Mayank Chawla [11] derived
a technique to detect and classify the stroke using CT scan
images of the brain. Histogram plot is used to detect the
abnormal slices. Daubechies-4 is used for classification.
Ming sian, Lee [13] derived an algorithm which increases
the visual perception of stroke detection system.
Anisotropic filter removes noise. Brain images extracted
using Mathematical morphology. Region growing
technique is used to extract stroke region. 85% success
rate is achieved by the proposed system.
3. METHODOLOGY
Fig -2: Complete Block diagram of the System
Implemented
3.1 Pre-processing of CT scan Images
The purpose of the pre-processing step is to produce data
which are compatible with the ischemic stroke region
detection and classification system.
Input image is converted into grey image and resize
operation performed to get specific size image for further
operation. Histogram plot operation is perform to
calculate the number of pixel and grey level of image.
Image converted to black and white (binary) image to find
the region of interest with certain threshold value. Small
specks remove that have fewer pixel than specific value.
Small holes filled to get cleaned binary image.
1. Median Filtering
Image Enhancement involves filtering, resizing and
adjustment operation. Median filtering removes unwanted
noise from the image. Median filtering is one of the
popular image enhancement techniques.
2. Skull Stripping
Skull is unwanted part of the brain, to eliminate this
skull stripping is implemented. Skull part of the brain
image is unwanted which is removed using erosion
operation as shown in Fig 3.
(a) (b)
Fig -3: (a) Original Input Image of Normal Patient
(b) Preprocessed and Skull stripped of Original Image
(a) (b)
Fig -4: (a) Original Input Image of Stroke Patient
(b) Preprocessed and Skull stripped of Original Image](https://image.slidesharecdn.com/irjet-v6i7319-191112065055/85/IRJET-Acute-Ischemic-Stroke-Detection-and-Classification-2-320.jpg)
![International Research Journal of Engineering and Technology (IRJET) e-ISSN: 2395-0056
Volume: 06 Issue: 07 | July 2019 www.irjet.net p-ISSN: 2395-0072
© 2019, IRJET | Impact Factor value: 7.211 | ISO 9001:2008 Certified Journal | Page 2245
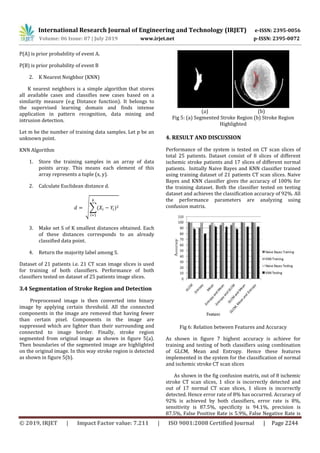
12.5%. Processing time of K-NN classifier for testing
Dataset is 8.80 second. Processing time of NB classifier for
testing dataset is 5.85 second.
Fig 7: Confusion Matrix of Naive Bayes and KNN
False Positive Rate is due to misclassification of slices.
False Negatives Rate is due arise due to a subtle difference
between normal and ischemic stroke. As the training
dataset is accurate hence all the parameters values
achieved are equal for both (Naive Bayes and KNN)
classifiers.
5. CONCLUSIONS
The present study demonstrates effectiveness of different
features and Naive Bayes and K Nearest Neighbor
Algorithm for the acute ischemic stroke detection and
classification. Stroke region is segmented on the basis of
gray level intensity of CT scan image. Naive Bayes and
KNN classifiers achieve the classification accuracy of 92%.
Both the classifiers are having equal accuracy according to
the features implemented. GLCM, Mean and Entropy are
the features used to analyze the texture of the image and
plays important role in the classification. Processing time
of Naive Bayes classifier is less as compare to KNN
classifier.
Finally, to achieve the higher accuracy training
dataset must be proper and suitable features are required
for the feature extraction. Hence accuracy can be
improved in future by implementing various features.
ACKNOWLEDGEMENT
I would like to express my deep gratitude to
Mrs. S. S. Thorat, Assistant Professor, Government College
of Engineering Amravati, my research supervisors, for
their patient guidance, enthusiastic encouragement and
useful critiques of this research work. I would also like to
thank Dr. P. R. Somwanshi, Dean of Dr. Panjabrao
Deshmukh Memorial Medical College (PDMMC), Amravati
for granting permission to take CT scan dataset. My
grateful thanks are also extended to Dr. S. P. Kothari, Head
of Radio-diagnosis Department, PDMMC, Amravati for her
help in allowing CT scan dataset. Also to I would also like
to extend my thanks to the Mr. K. V. Tayade CT scan
technicians of the Radio-diagnosis department, PDMMC,
Amravati for their help in offering me the resources in
running the program.
Finally, I wish to thank my parents for their support and
encouragement throughout my study
REFERENCES
[1] Ray BK, Hazra A, Ghosal M, Banerjee T, Chaudhuri A,
Singh V, et al. Early and delayed fatality of stroke in
Kolkata, India: Results from a 7-year longitudinal
population-based study. J Stroke Cerebrovasc
Dis. 2013; 22:281–9.
[2] The top 10 causes of death. World Health
Organization. http://www.who.
int/mediacentre/factsheets/fs310/en/. Accessed
March 24, 2015
[3] The internet stroke center.
http://www.strokecenter.org/patients/about-
stroke/ischemic-stroke/
[4] P. R. Mirajkar, K. A. Bhagwat, ArunVikas Singh,
Ashalatha M E.“Acute Ischemic Stroke Detection using
Wavelet Based Fusion of CT and MRI Images”
International Conference on Advances in Computing,
Communications and Informatics (ICACCI), 2015
[5] Amina Fatima Zahra Yahiaoui; Abdelhafid Bessaid.
“Segmentation of ischemic stroke area from CT brain
images” International Symposium on Signal, Image,
Video and Communications (ISIVC) , 2016
[6] Dr. Menaka R, Rohini. S,” Efficient Detection of
Ischemic Stroke from MRI Images Using Wavelet
Transform”, International Journal of Computer
Science and Information Technology Research Vol. 2,
Issue 3, pp: (446-454), Month: July - September 2014
[7] Jeena R.S., Kumar, S., "A comparative analysis of MRI
and CT brain images for stroke diagnosis", Emerging
Research Areas and 2013 International Conference on
Microelectronics, Communications and Renewable
Energy (AICERA/ICMiCR), 2013 Annual International
Conference on , vol., no., pp.1,5, 4-6 June 2013
[8] Md Tabish Raza, S. N. Merchant “A Comparison Based
Approach for Brain Tissue Detection under
Cerebrovascular Accident (Ischemic) Using CBV and
MTT Perfusion Map”. IEEE Conference on Information
& Communication Technologies, 2013.
[9] Tiong-Lang Tan; Kok-Swee Sim; Aun-Kee Chong,
"Contrast enhancement of CT brain images for
detection of ischemic stroke," Biomedical Engineering](https://image.slidesharecdn.com/irjet-v6i7319-191112065055/85/IRJET-Acute-Ischemic-Stroke-Detection-and-Classification-5-320.jpg)
![International Research Journal of Engineering and Technology (IRJET) e-ISSN: 2395-0056
Volume: 06 Issue: 07 | July 2019 www.irjet.net p-ISSN: 2395-0072
© 2019, IRJET | Impact Factor value: 7.211 | ISO 9001:2008 Certified Journal | Page 2246
(ICoBE), 2012 International Conference on , vol., no.,
pp.385,388, 27-28 Feb. 2012
[10] K. Parmar, R. K. Kher, F. N. Thakkar “Analysis of CT
and MRI Image fusion using Wavelet Transform”
International Conference on Communication System
and Network Technologies,2012
[11] Chawla, M.; Sharma, S.; Sivaswamy, J.; Kishore, L.T., "A
method for automatic detection and classification of
stroke from brain CT images," Engineering in
Medicine and Biology Society, 2009. EMBC 2009.
Annual International Conference of the IEEE , vol., no.,
pp.3581,3584, 3-6 Sept. 2009
[12] Teena Thomas, Jobin Jose,” Computer Aided Detection
Of Ischemic Stroke Using Cellular Automata”,
International Conference On Innovations & Advances
In Science, Engineering And Technology [IC -IASET
2014],Volume 3, Special Issue 5, July 2014
[13] Ming Sian Lee; Chiun Li Chin; Ya Wen Lee; Chian Yun
Lee; Yan Ru Chen, "Increasing Visual Perception Brain
Stroke Detection System," Computing, Measurement,
Control and Sensor Network (CMCSN), 2012
International Conference on , vol., no., pp.429,432, 7-9
July 2012
[14] J. D. Lee, T. C. Chang, C. H. Huang, S. J. Wu, C. J. Chen
“Computer- aided Diagnosis system for acute stroke
using Diffusion Weighted images with Volume
Calculation”.26th Annual International Conference if
the IEEE EMBS,2004.
[15] https://www.analyticsvidhya.com/blog/2017/09/nai
ve-bayes-explained/
[16] http://www.saedsayad.com/k_nearest_neighbors.htm
l
[17] https://www.geeksforgeeks.org/k-nearest-
neighbours/
[18] http://www.strokecenter.org/patients/about-
stroke/stroke-statistics/](https://image.slidesharecdn.com/irjet-v6i7319-191112065055/85/IRJET-Acute-Ischemic-Stroke-Detection-and-Classification-6-320.jpg)

This document presents a method for detecting and classifying acute ischemic strokes in CT scan images. The method involves pre-processing images using median filtering and skull stripping. Features like mean, entropy, and gray-level co-occurrence matrix values are then extracted. Naive Bayes and k-nearest neighbor classifiers are used to classify images as normal or stroke with 92% accuracy. The k-NN classifier takes longer (8.80 seconds) to process images compared to the Naive Bayes classifier (5.85 seconds). The method accurately detects stroke regions in images and can help in early diagnosis and treatment of ischemic strokes.