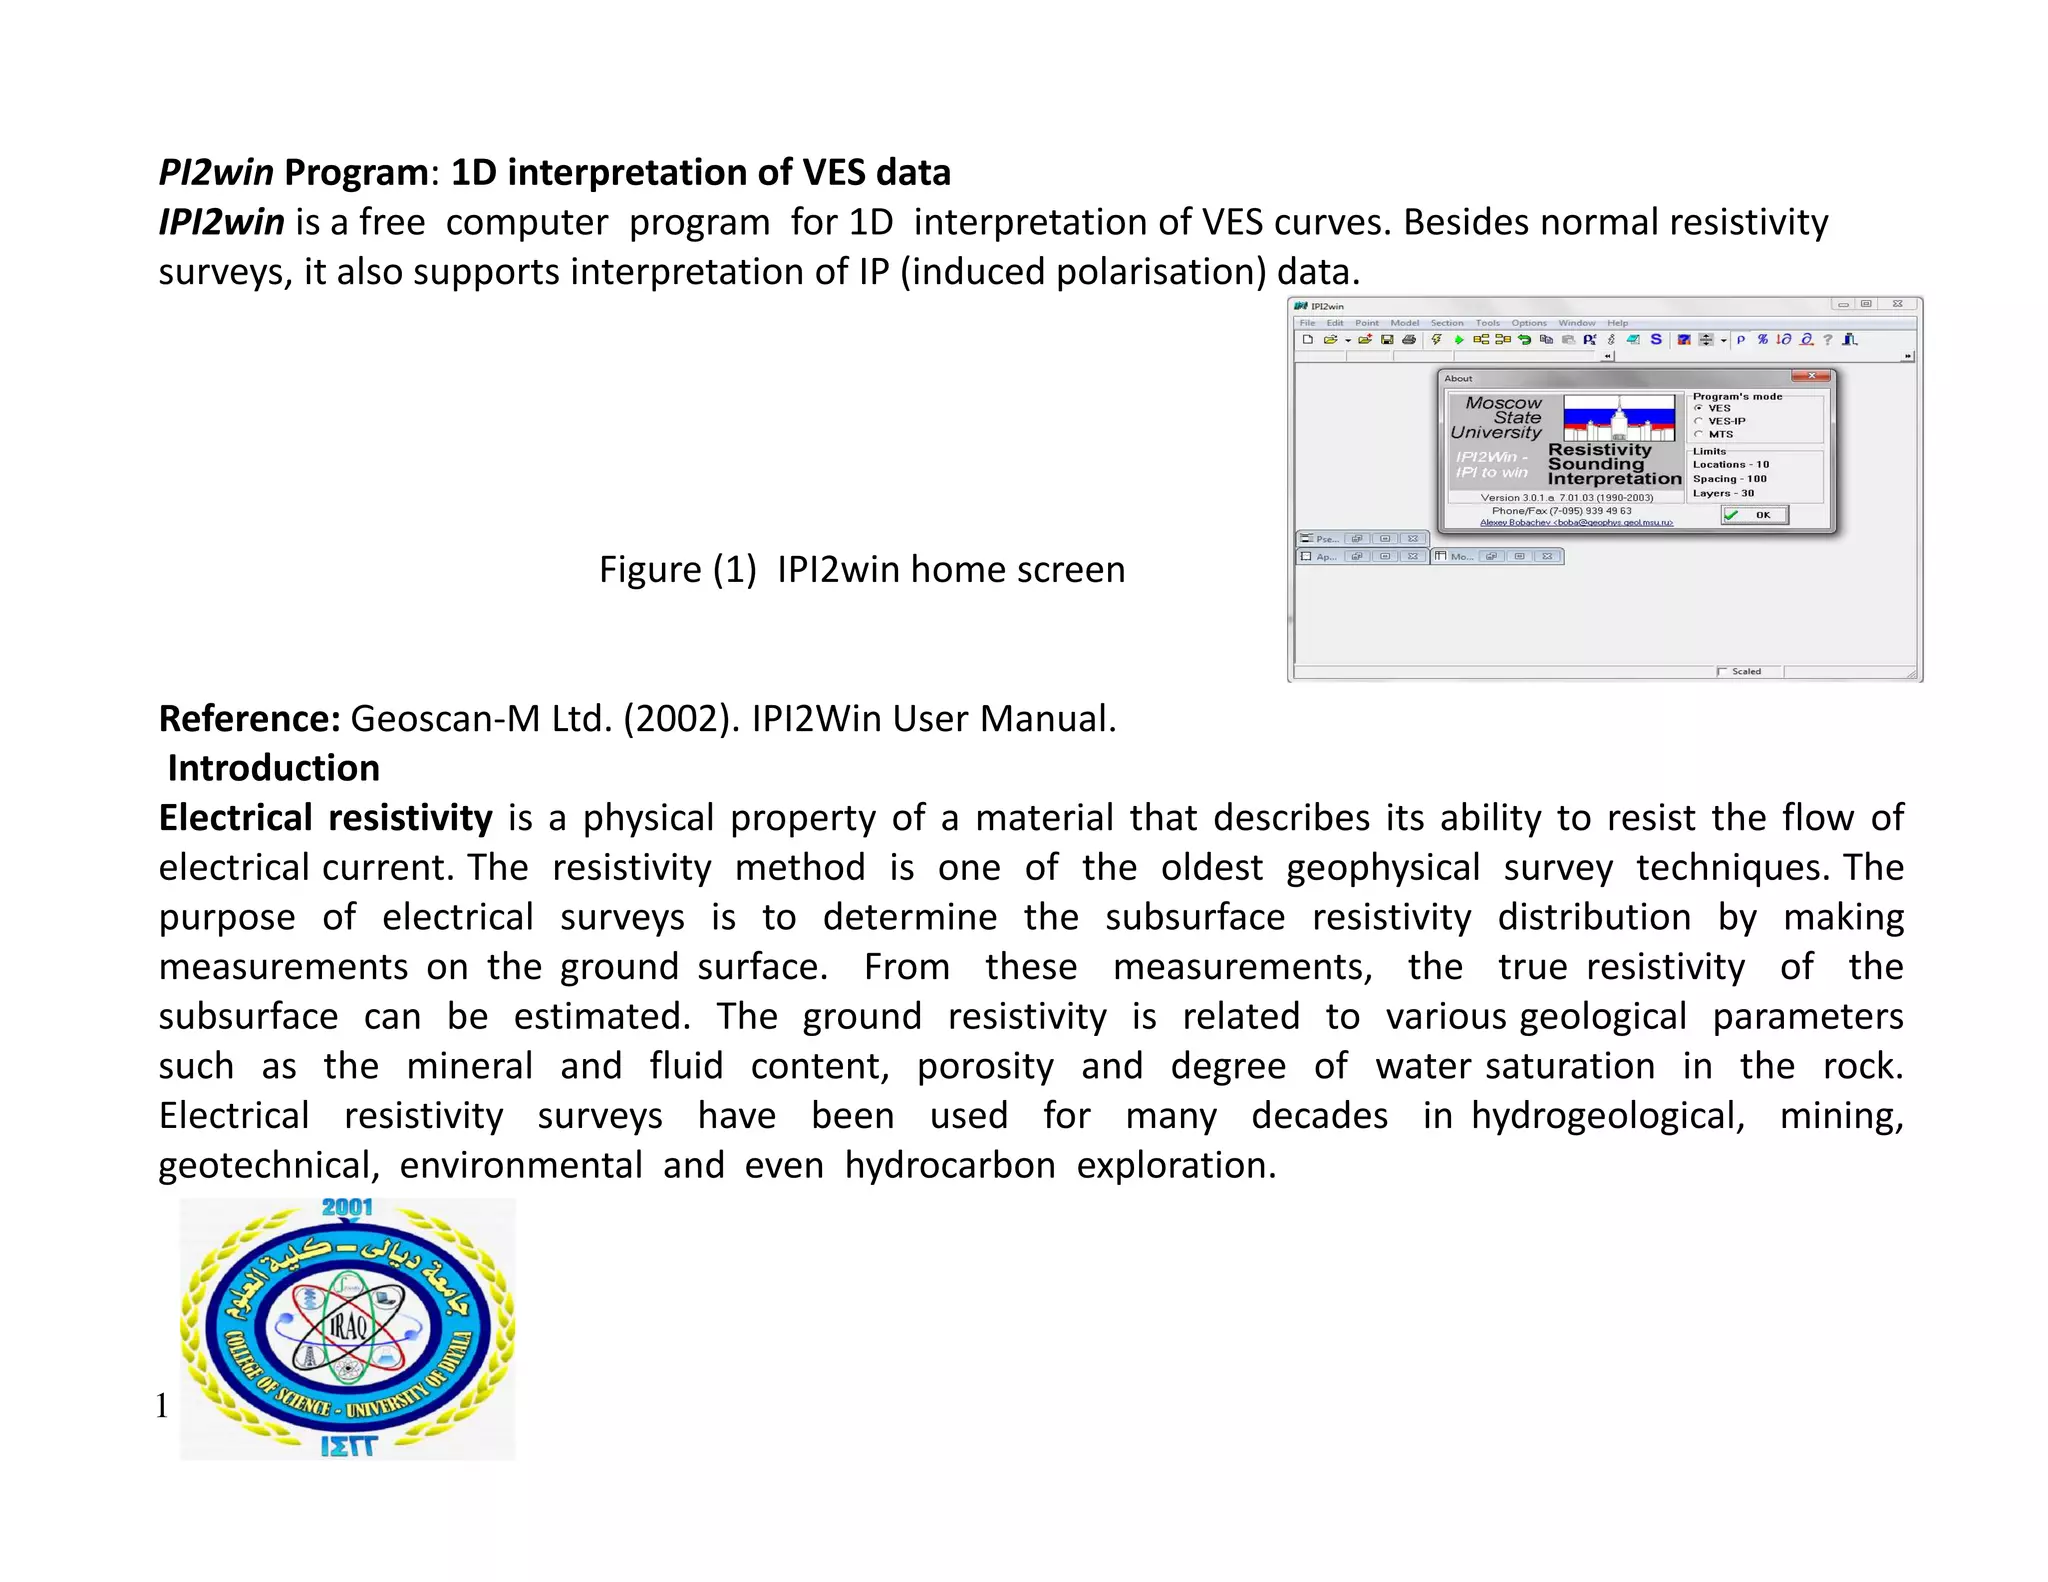
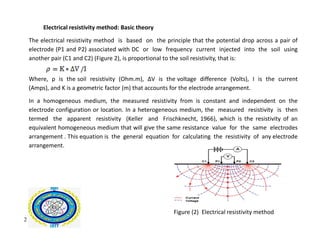
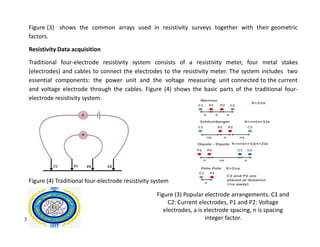
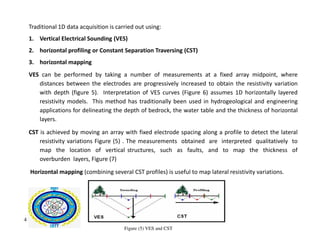
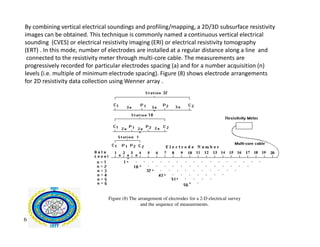
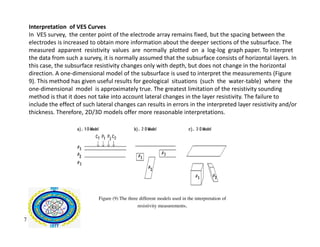
PI2win Program: 1D interpretation of VES data
IPI2win is a free computer program for 1D interpretation of VES curves. Besides normal resistivity
surveys, it also supports interpretation of IP (induced polarisation) data.
Figure (1) IPI2win home screen
Reference: Geoscan-M Ltd. (2002). IPI2Win User Manual.
Introduction
Electrical resistivity is a physical property of a material that describes its ability to resist the flow of
electrical current. The resistivity method is one of the oldest geophysical survey techniques. The
purpose of electrical surveys is to determine the subsurface resistivity distribution by making
measurements on the ground surface. From these measurements, the true resistivity of the
subsurface can be estimated. The ground resistivity is related to various geological parameters
such as the mineral and fluid content, porosity and degree of water saturation in the rock.
Electrical resistivity surveys have been used for many decades in hydrogeological, mining,
geotechnical, environmental and even hydrocarbon exploration.
1
Electrical resistivity method: Basic theory
The electrical resistivity method is based on the principle that the potential drop across a pair of
electrode (P1 and P2) associated with DC or low frequency current injected into the soil using
another pair (C1 and C2) (Figure 2), is proportional to the soil resistivity, that is:
Where, ρ is the soil resistivity (Ohm.m), ∆V is the voltage difference (Volts), I is the current
(Amps), and K is a geometric factor (m) that accounts for the electrode arrangement.
In a homogeneous medium, the measured resistivity from is constant and independent on the
electrode configuration or location. In a heterogeneous medium, the measured resistivity is then
termed the apparent resistivity (Keller and Frischknecht, 1966), which is the resistivity of an
equivalent homogeneous medium that will give the same resistance value for the same electrodes
arrangement . This equation is the general equation for calculating the resistivity of any electrode
arrangement.
Figure (2) Electrical resistivity method
2
Figure (3) shows the common arrays used in resistivity surveys together with their geometric
factors.
Resistivity Data acquisition
Traditional four-electrode resistivity system consists of a resistivity meter, four metal stakes
(electrodes) and cables to connect the electrodes to the resistivity meter. The system includes two
essential components: the power unit and the voltage measuring unit connected to the current
and voltage electrode through the cables. Figure (4) shows the basic parts of the traditional four-
electrode resistivity system.
Figure (4) Traditional four-electrode resistivity system
3
Figure (3) Popular electrode arrangements. C1 and
C2: Current electrodes, P1 and P2: Voltage
electrodes, a is electrode spacing, n is spacing
integer factor.
Traditional 1D data acquisition is carried out using:
1. Vertical Electrical Sounding (VES)
2. horizontal profiling or Constant Separation Traversing (CST)
3. horizontal mapping
VES can be performed by taking a number of measurements at a fixed array midpoint, where
distances between the electrodes are progressively increased to obtain the resistivity variation
with depth (figure 5). Interpretation of VES curves (Figure 6) assumes 1D horizontally layered
resistivity models. This method has traditionally been used in hydrogeological and engineering
applications for delineating the depth of bedrock, the water table and the thickness of horizontal
layers.
CST is achieved by moving an array with fixed electrode spacing along a profile to detect the lateral
resistivity variations Figure (5) . The measurements obtained are interpreted qualitatively to
map the location of vertical structures, such as faults, and to map the thickness of
overburden layers, Figure (7)
Horizontal mapping (combining several CST profiles) is useful to map lateral resistivity variations.
4
Figure (5) VES and CST
5 Figure (7) Horizontal resistivity profiling.
Figure (6) Vertical electrical sounding curves
By combining vertical electrical soundings and profiling/mapping, a 2D/3D subsurface resistivity
images can be obtained. This technique is commonly named a continuous vertical electrical
sounding (CVES) or electrical resistivity imaging (ERI) or electrical resistivity tomography
(ERT) . In this mode, number of electrodes are installed at a regular distance along a line and
connected to the resistivity meter through multi-core cable. The measurements are
progressively recorded for particular electrodes spacing (a) and for a number acquisition (n)
levels (i.e. multiple of minimum electrode spacing). Figure (8) shows electrode arrangements
for 2D resistivity data collection using Wenner array .
6
Figure (8) The arrangement of electrodes for a 2-D electrical survey
and the sequence of measurements.
Interpretation of VES Curves
In VES survey, the center point of the electrode array remains fixed, but the spacing between the
electrodes is increased to obtain more information about the deeper sections of the subsurface. The
measured apparent resistivity values are normally plotted on a log-log graph paper. To interpret
the data from such a survey, it is normally assumed that the subsurface consists of horizontal layers. In
this case, the subsurface resistivity changes only with depth, but does not change in the horizontal
direction. A one-dimensional model of the subsurface is used to interpret the measurements (Figure
9). This method has given useful results for geological situations (such the water-table) where the
one-dimensional model is approximately true. The greatest limitation of the resistivity sounding
method is that it does not take into account lateral changes in the layer resistivity. The failure to
include the effect of such lateral changes can results in errors in the interpreted layer resistivity and/or
thickness. Therefore, 2D/3D models offer more reasonable interpretations.
7
Figure (9) The three different models used in the interpretation of
resistivity measurements.

IPI2win 1..pdf

  • 1.
    PI2win Program: 1Dinterpretation of VES data IPI2win is a free computer program for 1D interpretation of VES curves. Besides normal resistivity surveys, it also supports interpretation of IP (induced polarisation) data. Figure (1) IPI2win home screen Reference: Geoscan-M Ltd. (2002). IPI2Win User Manual. Introduction Electrical resistivity is a physical property of a material that describes its ability to resist the flow of electrical current. The resistivity method is one of the oldest geophysical survey techniques. The purpose of electrical surveys is to determine the subsurface resistivity distribution by making measurements on the ground surface. From these measurements, the true resistivity of the subsurface can be estimated. The ground resistivity is related to various geological parameters such as the mineral and fluid content, porosity and degree of water saturation in the rock. Electrical resistivity surveys have been used for many decades in hydrogeological, mining, geotechnical, environmental and even hydrocarbon exploration. 1
  • 2.
    Electrical resistivity method:Basic theory The electrical resistivity method is based on the principle that the potential drop across a pair of electrode (P1 and P2) associated with DC or low frequency current injected into the soil using another pair (C1 and C2) (Figure 2), is proportional to the soil resistivity, that is: Where, ρ is the soil resistivity (Ohm.m), ∆V is the voltage difference (Volts), I is the current (Amps), and K is a geometric factor (m) that accounts for the electrode arrangement. In a homogeneous medium, the measured resistivity from is constant and independent on the electrode configuration or location. In a heterogeneous medium, the measured resistivity is then termed the apparent resistivity (Keller and Frischknecht, 1966), which is the resistivity of an equivalent homogeneous medium that will give the same resistance value for the same electrodes arrangement . This equation is the general equation for calculating the resistivity of any electrode arrangement. Figure (2) Electrical resistivity method 2
  • 3.
    Figure (3) showsthe common arrays used in resistivity surveys together with their geometric factors. Resistivity Data acquisition Traditional four-electrode resistivity system consists of a resistivity meter, four metal stakes (electrodes) and cables to connect the electrodes to the resistivity meter. The system includes two essential components: the power unit and the voltage measuring unit connected to the current and voltage electrode through the cables. Figure (4) shows the basic parts of the traditional four- electrode resistivity system. Figure (4) Traditional four-electrode resistivity system 3 Figure (3) Popular electrode arrangements. C1 and C2: Current electrodes, P1 and P2: Voltage electrodes, a is electrode spacing, n is spacing integer factor.
  • 4.
    Traditional 1D dataacquisition is carried out using: 1. Vertical Electrical Sounding (VES) 2. horizontal profiling or Constant Separation Traversing (CST) 3. horizontal mapping VES can be performed by taking a number of measurements at a fixed array midpoint, where distances between the electrodes are progressively increased to obtain the resistivity variation with depth (figure 5). Interpretation of VES curves (Figure 6) assumes 1D horizontally layered resistivity models. This method has traditionally been used in hydrogeological and engineering applications for delineating the depth of bedrock, the water table and the thickness of horizontal layers. CST is achieved by moving an array with fixed electrode spacing along a profile to detect the lateral resistivity variations Figure (5) . The measurements obtained are interpreted qualitatively to map the location of vertical structures, such as faults, and to map the thickness of overburden layers, Figure (7) Horizontal mapping (combining several CST profiles) is useful to map lateral resistivity variations. 4 Figure (5) VES and CST
  • 5.
    5 Figure (7)Horizontal resistivity profiling. Figure (6) Vertical electrical sounding curves
  • 6.
    By combining verticalelectrical soundings and profiling/mapping, a 2D/3D subsurface resistivity images can be obtained. This technique is commonly named a continuous vertical electrical sounding (CVES) or electrical resistivity imaging (ERI) or electrical resistivity tomography (ERT) . In this mode, number of electrodes are installed at a regular distance along a line and connected to the resistivity meter through multi-core cable. The measurements are progressively recorded for particular electrodes spacing (a) and for a number acquisition (n) levels (i.e. multiple of minimum electrode spacing). Figure (8) shows electrode arrangements for 2D resistivity data collection using Wenner array . 6 Figure (8) The arrangement of electrodes for a 2-D electrical survey and the sequence of measurements.
  • 7.
    Interpretation of VESCurves In VES survey, the center point of the electrode array remains fixed, but the spacing between the electrodes is increased to obtain more information about the deeper sections of the subsurface. The measured apparent resistivity values are normally plotted on a log-log graph paper. To interpret the data from such a survey, it is normally assumed that the subsurface consists of horizontal layers. In this case, the subsurface resistivity changes only with depth, but does not change in the horizontal direction. A one-dimensional model of the subsurface is used to interpret the measurements (Figure 9). This method has given useful results for geological situations (such the water-table) where the one-dimensional model is approximately true. The greatest limitation of the resistivity sounding method is that it does not take into account lateral changes in the layer resistivity. The failure to include the effect of such lateral changes can results in errors in the interpreted layer resistivity and/or thickness. Therefore, 2D/3D models offer more reasonable interpretations. 7 Figure (9) The three different models used in the interpretation of resistivity measurements.