Investigation on thermodynamics in separation for ethylene glycol neopentyl glycol system by azeotropic distillation
•
0 likes•278 views

The document investigates azeotropic distillation for separating an ethylene glycol (EG) and neopentyl glycol (NPG) system. Vapor-liquid equilibrium data was measured for the EG-NPG and NPG-para-xylene systems under atmospheric pressure. The data was found to be thermodynamically consistent and well-correlated by models like NRTL and UNIQUAC. An azeotropic distillation process was designed using para-xylene as an entrainer that can produce EG and NPG at 99.9% purity with minimal cost.

Recommended
More Related Content
What's hot
What's hot (20)
Similar to Investigation on thermodynamics in separation for ethylene glycol neopentyl glycol system by azeotropic distillation
Similar to Investigation on thermodynamics in separation for ethylene glycol neopentyl glycol system by azeotropic distillation (20)
More from Josemar Pereira da Silva
More from Josemar Pereira da Silva (20)
Recently uploaded
Recently uploaded (20)
Investigation on thermodynamics in separation for ethylene glycol neopentyl glycol system by azeotropic distillation
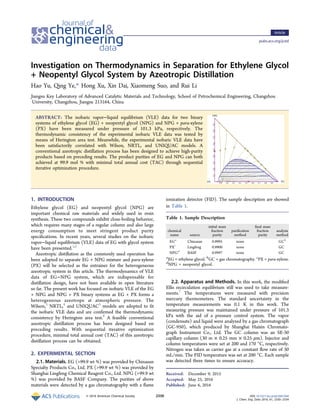
- 1. Investigation on Thermodynamics in Separation for Ethylene Glycol + Neopentyl Glycol System by Azeotropic Distillation Hao Yu, Qing Ye,* Hong Xu, Xin Dai, Xiaomeng Suo, and Rui Li Jiangsu Key Laboratory of Advanced Catalytic Materials and Technology, School of Petrochemical Engineering, Changzhou University, Changzhou, Jiangsu 213164, China ABSTRACT: The isobaric vapor−liquid equilibrium (VLE) data for two binary systems of ethylene glycol (EG) + neopentyl glycol (NPG) and NPG + para-xylene (PX) have been measured under pressure of 101.3 kPa, respectively. The thermodynamic consistency of the experimental isobaric VLE data was tested by means of Herington area test. Meanwhile, the experimental isobaric VLE data have been satisfactorily correlated with Wilson, NRTL, and UNIQUAC models. A conventional azeotropic distillation process has been designed to achieve high-purity products based on preceding results. The product purities of EG and NPG can both achieved at 99.9 mol % with minimal total annual cost (TAC) through sequential iterative optimization procedure. 1. INTRODUCTION Ethylene glycol (EG) and neopentyl glycol (NPG) are important chemical raw materials and widely used in resin synthesis. These two compounds exhibit close-boiling behavior, which requires many stages of a regular column and also large energy consumption to meet stringent product purity specifications. In recent years, several studies on the isobaric vapor−liquid equilibrium (VLE) data of EG with glycol system have been presented.1,2 Azeotropic distillation as the commonly used operation has been adopted to separate EG + NPG mixture and para-xylene (PX) will be selected as the entrainer for the heterogeneous azeotropic system in this article. The thermodynamics of VLE data of EG−NPG system, which are indispensable for distillation design, have not been available in open literature so far. The present work has focused on isobaric VLE of the EG + NPG and NPG + PX binary systems as EG + PX forms a heterogeneous azeotrope at atmospheric pressure. The Wilson,3 NRTL,4 and UNIQUAC5 models are adopted to fit the isobaric VLE data and are confirmed the thermodynamic consistency by Herington area test.6 A feasible conventional azeotropic distillation process has been designed based on preceding results. With sequential iterative optimization procedure, minimal total annual cost (TAC) of this azeotropic distillation process can be obtained. 2. EXPERIMENTAL SECTION 2.1. Materials. EG (>99.9 wt %) was provided by Chinasun Specialty Products Co., Ltd. PX (>99.9 wt %) was provided by Shanghai Lingfeng Chemical Reagent Co., Ltd. NPG (>99.9 wt %) was provided by BASF Company. The purities of above materials were detected by a gas chromatography with a flame ionization detector (FID). The sample description are showed in Table 1. 2.2. Apparatus and Methods. In this work, the modified Ellis recirculation equilibrium still was used to take measure- ments.7 The temperatures were measured with precision mercury thermometers. The standard uncertainty in the temperature measurements was 0.1 K in this work. The measuring pressure was maintained under pressure of 101.3 kPa with the aid of a pressure control system. The vapor (condensate) and liquid were analyzed by a gas chromatograph (GC-950), which produced by Shanghai Haixin Chromato- graph Instrument Co., Ltd. The GC column was an SE-30 capillary column (30 m × 0.25 mm × 0.25 μm). Injector and column temperatures were set at 200 and 170 °C, respectively. Nitrogen was taken as carrier gas at a constant flow rate of 30 mL/min. The FID temperature was set at 200 °C. Each sample was detected three times to ensure accuracy. Received: December 9, 2015 Accepted: May 25, 2016 Published: June 6, 2016 Table 1. Sample Description chemical name source initial mass fraction purity purification method final mass fraction purity analysis method EGa Chinasun 0.9995 none GCb PXc Lingfeng 0.9900 none GC NPGd BASF 0.9997 none GC a EG = ethylene glycol. b GC = gas chromatography. c PX = para-xylene. d NPG = neopentyl glycol. Article pubs.acs.org/jced © 2016 American Chemical Society 2330 DOI: 10.1021/acs.jced.5b01044 J. Chem. Eng. Data 2016, 61, 2330−2334
- 2. 3. THERMODYNAMIC MODELING 3.1. Experimental Data. The experimental isobaric VLE data and calculated activity coefficients for EG + NPG and NPG + PX systems were listed in Table 2 and Table 3, respectively. The activity coefficient γi was calculated with the following equation φ γφ̑ = −⎡ ⎣ ⎢ ⎢ ⎤ ⎦ ⎥ ⎥ py x p V p p RT exp ( ) i i i i i i iV s s L s (1) Under mesolow circumstances, the values of φ̑V and φi s can both thought to equal to 1. Equation 1 can be simplified as γ=py x pi i i i s (2) The saturation vapor pressure was calculated by Antoine equation8 = + + +p A B T C T DTln lni Es (3) The constants of Antoine equation for vapor pressures of the pure compounds were listed in Table 4. 3.2. Thermodynamic Consistency Test. The thermody- namic consistency tests for the two binary systems were based on the Gibbs−Duhem equation9,10 and verified with the Herington area test.11 The Gibbs−Duhem equation was γ γ+ = −x x H RT T V RT pdln dln d d E E 1 1 2 2 2 (4) Under constant pressure circumstance, the Gibbs−Duhem equation can be simplified as ∫ ∫ γ γ = − = = = = x H RT Tln d ln d x x x x E 1 2 1 2 1 0 1 1 1 0 1 1 (5) As Herington proposed, the experimental isobaric VLE data can be regarded thermodynamically consistent when |D − J| < 10. D and J were calculated in the equations ∫ ∫ γ γ γ γ = × | | | | D x x 100 ln( / )d ln( / ) d 0 1 1 2 1 0 1 1 2 1 (6) = × − J T T T 150 max min min (7) Tmax and Tmin are the highest and lowest temperature, respectively. The results of thermodynamics consistency test are shown in Table 5, the experimental isobaric VLE data of the two binary systems both passed the Herington area test. 3.3. Data Regression. The interaction parameters of the two binary systems were regressed by means of Wilson, NRTL, and UNIQUAC models and the values were listed in Table 6. The interaction parameter α in NRTL was fixed at 0.3.4 The root-mean-square deviations (σT and σy1) between the evaluated and experimental data were defined as12 σ = ∑ −= T T T N ( )i N i i1 cal exp 2 (8) σ = ∑ −= y y y N ( )i N i i 1 1 1 cal 1 exp 2 (9) The calculated root-mean-squared deviations were also given in Table 6. The comparison results indicated that NRTL model Table 2. Experimental VLE Data for Temperature T, Liquid- Phase Mole Fraction x, and Gas-Phase Mole Fraction y, for the System Ethylene Glycol (1) + Neopentyl Glycol (2)a at at 101.3 kPa T/K x1 y1 γ1 γ2 ln(γ1/γ2) 470.22 1.0000 1.0000 470.80 0.9242 0.9382 0.9994 1.0025 −0.0031 471.28 0.8524 0.8763 0.9981 1.0138 −0.0156 471.77 0.7727 0.8047 0.9960 1.0236 −0.0273 472.29 0.6841 0.7216 0.9936 1.0312 −0.0371 472.71 0.6115 0.6518 0.9921 1.0347 −0.0419 473.31 0.4966 0.5394 0.9925 1.0351 −0.0420 473.76 0.4165 0.4601 0.9969 1.0318 −0.0344 474.79 0.2439 0.2870 1.0293 1.0177 0.0113 475.76 0.1333 0.1696 1.0815 1.0071 0.0713 476.63 0.0587 0.0813 1.1430 1.0016 0.1320 478.95 0.0000 0.0000 a Standard uncertainties are u(P) = 1 kPa, u(T) = 0.1 K, u(x1) = u(y1) = 0.001. Table 3. Experimental VLE data for Temperature T, Liquid- Phase Mole Fraction x, and Gas-Phase Mole Fraction y, for the System Neopentyl Glycol (1) + para-Xylene (2)a at 101.3 kPa T/K x1 y1 γ1 γ2 ln(γ1/γ2) 411.21 0.0000 0.0000 414.70 0.0751 0.0097 0.7152 0.9992 −0.3343 419.62 0.2237 0.0218 0.8455 0.9898 −0.1576 427.69 0.3512 0.0497 0.9122 0.9762 −0.0678 432.33 0.4310 0.0776 0.9460 0.9638 −0.0186 442.49 0.5764 0.1631 0.9936 0.9288 0.0674 449.35 0.6626 0.2465 1.0127 0.8996 0.1184 456.64 0.7508 0.3634 1.0233 0.8698 0.1625 466.21 0.8711 0.5824 1.0183 0.8785 0.1477 472.57 0.9468 0.7754 1.0057 1.0005 0.0052 475.19 0.9752 0.8775 1.0004 1.0307 −0.0262 478.95 1.0000 1.0000 a Standard uncertainties are u(P) = 1 kPa, u(T) = 0.1 K, u(x1) = u(y1) = 0.001. Table 4. Antoine Constants of EG, NPG, and PX Antoine equation EG NPG PX A 72.577 75.011 77.207 B −10411 −11276 −7741.2 C −8.198 −8.336 −9.869 D 1.65 × 10⁻¹⁸ 4.45 × 10⁻¹⁸ 6.08 × 10⁻⁶ E 6 6 2 Table 5. Thermodynamics Consistency Test for Two Binary System at 101.3 kPa system D J |D − J| EG + NPG 5.068 1.857 3.211 NPG + PX 23.972 20.932 3.040 Journal of Chemical & Engineering Data Article DOI: 10.1021/acs.jced.5b01044 J. Chem. Eng. Data 2016, 61, 2330−2334 2331
- 3. was more suitable to regress the interaction parameters in this study than others did, which fit the experimental isobaric VLE data in a similar way. The experimental isobaric VLE data of the two binary systems were plotted in Figure 1 and Figure 2, in which the NRTL model was showed in solid lines. 4. DISTILLATION PROCESS DESIGN Figure 3 illustrated the residue curve map (RCM) for EG + NPG + PX heterogeneous azeotropic system at 101.3 kPa computed by Aspen Plus with NRTL model based on the regressed interaction parameters. Only a binary heterogeneous azeotrope with composition of 89.14 mol % PX/10.86 mol % EG and an azeotropic temperature of 135.42 °C existed in EG + NPG + PX heterogeneous azeotropic system.13 The Table 6. Binary Interaction Parameters of Wilson, NRTL, and UNIQUAC Models for Two Binary System model parameters root-mean-square deviation models A12/(J·mol−1 )a A21/(J·mol−1 )a α σT/Kb σy1 b EG (1) + NPG (2) System Wilson −590.2820 334.3378 0.5025 0.0015 NRTL −449.4958 686.3341 0.3000 0.5000 0.0005 UNIQUAC 235.3980 −365.8704 0.4978 0.0019 NPG (1) + PX (2) System Wilson 488.4102 −958.3601 0.8548 0.0086 NRTL 896.7799 −602.2680 0.3000 0.9119 0.0091 UNIQUAC −502.2751 353.6040 0.9198 0.0077 a Wilson: A12 = (λ12 − λ11)/R, A21 = (λ21 − λ22)/R. NRTL: A12 = (g12 − g22)/R, A21 = (g21 − g11)/R. UNIQUAC: A12 = (u12 − u22)/R, A21 = (u21 − u11)/R. b σT = [∑i = 1 N (Ti cal − Ti exp )2 /N]1/2 ; σy1 = [∑i = 1 N (y1i cal − y1i exp )2 /N]1/2 Figure 1. T−x−y diagram for EG (1) + NPG (2) at 101.3 kPa: (red ● and black ■), experimental data; solid lines, NRTL equation. Figure 2. T−x−y diagram for NPG (1) + PX (2) at 101.3 kPa: (red ● and black ■), experimental data; solid lines, NRTL equation. Figure 3. RCM for the EG + NPG + PX heterogeneous azeotropic system at 101.3 kPa simulated by Aspen Plus using NRTL model. Figure 4. Simulation flowsheet of the conventional azeotropic distillation process. Journal of Chemical & Engineering Data Article DOI: 10.1021/acs.jced.5b01044 J. Chem. Eng. Data 2016, 61, 2330−2334 2332
- 4. conventional two-column/decanter flowsheet14 was designed for separating the heterogeneous azeotropic system (Figure 4). Both of the two columns were operated at 1.0 atm and the bottom purities were set at 99.9 mol %. The compositions of the two vapor streams fed to a single heater exchanger (HX) were almost the same. The vapor condensate separated into aqueous and organic phases in a decanter. The organic phase 1 (containing mainly entrainer) was fed to the first tray of column C1, which served as a heterogeneous azeotropic distillation column. The organic phase 2 (containing lesser entrainer) was returned to the first tray of column C2, which served as a product column. Several parameters should be optimized for the design with optimized operation conditions of this azeotropic distillation process. Optimum parameters can be achieved through elaborate comparison of the minimal TAC values. TAC was defined as the sum of the annual operation cost and capital investment divided by a three-year payback period.15 Parameters of the columns were obtained based on the TAC results by the methods proposed by Douglas.16 The capital investment was considered as the investment of the major piece of equipment such as vessels and HXs. Other minor pieces such as pipes, valves, and pumps can usually be neglected as the investment were much less than that of major ones. Only utility consumption was taken into consideration when calculating operating cost in this study. The price of high-pressure steams and the relation between equipment sizes with investment were followed the recommendation by Luyben.15 Sequential iterative optimization procedure for the conventional azeotropic distillation process (Figure 5) is follows: (1) Fix total number of trays (NT) of column C2. (2) Fix NT of column C1. (3) Give the feed tray (NF) of the fresh feed. (4) Change the reboiler duty (QR) of the two columns until two product meet their specifications. (5) Back to the third step, if the previous step can not proceed, until the minimized TAC obtained. (6) Back to the second step, if the previous step can not proceed, until the minimized TAC obtained. (7) Back to the first step, if the previous step can not proceed, until the minimized TAC obtained. The optimum NT of the azeotropic distillation column is 37 with feed location at fifth tray. The optimum NT of the product column is 4. The effect of NT1 and NT2 on the TAC of the conventional heterogeneous azeotropic distillation process were showed in Figures 6 and 7, respectively. The results for all of the streams in each column were shown in Table 7. 5. CONCLUSION The thermodynamics was studied in detail in order to make an appropriate azeotropic distillation process design in this article. The experimental isobaric VLE data for the two binary systems of EG + NPG and NPG + PX were measured under pressure of Figure 5. Sequential iterative optimization procedure for the conventional azeotropic distillation process. Figure 6. Effect of NT1 on the TAC of the conventional azeotropic distillation process. Figure 7. Effect of NT2 on the TAC of the conventional azeotropic distillation process. Journal of Chemical & Engineering Data Article DOI: 10.1021/acs.jced.5b01044 J. Chem. Eng. Data 2016, 61, 2330−2334 2333
- 5. 101.3 kPa. Reasonable thermodynamic consistency were confirmed by means of Herington area tests. The experimental isobaric VLE data were regressed by Wilson, NRTL, and UNIQUAC models. A conventional azeotropic distillation process was designed and optimized with minimal TAC to achieve 99.9 mol % of EG and NPG based on preceding results. ■ AUTHOR INFORMATION Corresponding Author *Tel.: +86 519 86330355. Fax: +86 519 86330355. E-mail: huagonglou508@126.com. Funding There is no grant of financial support in the study. Notes The authors declare no competing financial interest. ■ ACKNOWLEDGMENTS We are thankful for assistance from the staff at the School of Petrochemical Technology (Changzhou University). ■ NOMENCLATURE VLE = vapor−liquid equilibrium EG = ethylene glycol NPG = neopentyl glycol PX = para-xylene NRTL = nonrandom two-liquid UNIQUAC = universal quasichemical activity coefficient TAC = total annual cost FID = flame ionization detector ADD = average absolute deviation NT = total number of trays QR = reboiler duty HX = heater exchanger NF = feed tray ■ REFERENCES (1) Li, X. S.; Englezos, P. Vapor-liquid equilibrium of systems containing alcohols using the statistical associating fluid theory equation of state. Ind. Eng. Chem. Res. 2003, 42, 4953−4961. (2) Zhang, L.; Wu, W.; Sun, Y.; Li, L.; Jiang, B.; Li, X.; Yang, N.; Ding, H. Isobaric Vapor−Liquid Equilibria for the Binary Mixtures Composed of Ethylene Glycol, 1, 2-Propylene Glycol, 1, 2-Butanediol, and 1, 3-Butanediol at 10.00 kPa. J. Chem. Eng. Data 2013, 58, 1308− 1315. (3) Wilson, G. M. Vapor-liquid equilibrium. XI. A new expression for the excess free energy of mixing. J. Am. Chem. Soc. 1964, 86, 127−130. (4) Renon, H.; Prausnitz, J. M. Local compositions in thermody- namic excess functions for liquid mixtures. AIChE J. 1968, 14, 135− 144. (5) Abrams, D. S.; Prausnitz, J. M. Statistical thermodynamics of liquid mixtures: A new expression for the excess Gibbs energy of partly or completely miscible systems. AIChE J. 1975, 21, 116−128. (6) Herington, E. F. G. Tests for the Consistency of Experimental Isobaric Vapor-Liquid Equilibrium Data. J. Inst. Petrol. 1951, 37, 457− 470. (7) Walas, S. M. Phase Equilibria in Chemical Engineering; Butterworth-Heineman: Boston, 1985. (8) Daubert, T. E.; Danner, R. P. Physical and Thermodynamic Properties of Pure Chemicals; Hemisphere: New York, 1989. (9) Abbott, M. M.; Smith, J. M.; Van Ness, H. C. Introduction to Chemical Engineering Thermodynamics; McGraw-Hill: New York, 2001. (10) Jackson, P. L.; Wilsak, R. A. Thermodynamic Consistency Tests Based on the Gibbs-Duhem Equation Applied to Isothermal, Binary Vapor-Liquid Equilibrium Data: Data Evaluation and Model Testing. Fluid Phase Equilib. 1995, 103, 155−197. (11) Chen, S.; Bao, Z.; Lü, Z.; Yang, Y.; Xu, W.; Chen, Z.; Ren, Q.; Su, B.; Xing, H. Vapor-Liquid Equilibrium for the 1,1,1-Trifluorotri- chloroethane + Sulfuryl Chloride System at 101.3 kPa. J. Chem. Eng. Data 2014, 59, 16−21. (12) Giner, B.; Martín, S.; Haro, M.; Artigas, H.; Lafuente, C. Experimental and predicted vapor-liquid equilibrium for cyclic ethers with 1-chloropentane. Ind. Eng. Chem. Res. 2005, 44, 6981−6988. (13) Horsley, L. H. Table of azeotropes and nonazeotropes. Anal. Chem. 1949, 21, 831−873. (14) Doherty, M. F.; Malone, M. F. Conceptual Design of Distillation Systems; McGraw-Hill: New York, 2001. (15) Luyben, W. L. Principles and Case Studies of Simultaneous Design; John Wiley & Sons: New York, 2012. (16) Douglas, J. M. Conceptual Design of Chemical Processes; McGraw Hill: New York, 1988. Table 7. Specifications for Flows in Column C1 and Column C2 column C1 column C2 B1 V1 B2 V2 mole flow/kmol·h−1 50.00 531.78 50.00 0.52 temperature/K 483.88 408.58 471.58 408.56 EG/mol fraction 7.69 × 10⁻² 11.11 99.92 10.86 NPG/mol fraction 99.92 7.23 × 10⁻³³ 7.69 × 10⁻² 2.01 × 10⁻³ PX/mol fraction 4.81 × 10⁻³¹ 88.88 4.86 × 10⁻¹⁰ 89.14 Journal of Chemical & Engineering Data Article DOI: 10.1021/acs.jced.5b01044 J. Chem. Eng. Data 2016, 61, 2330−2334 2334