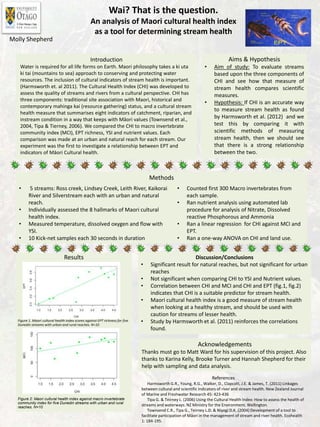
1. Results
Figure 1. Maori cultural health index scores against EPT richness for five
Dunedin streams with urban and rural reaches. N=10
Figure 2: Maori cultural health index against macro invertebrate
community index for five Dunedin streams with urban and rural
reaches. N=10
Wai? That is the question.
An analysis of Maori cultural health index
as a tool for determining stream health
Introduction
Water is required for all life forms on Earth. Maori philosophy takes a ki uta
ki tai (mountains to sea) approach to conserving and protecting water
resources. The inclusion of cultural indicators of stream health is important.
(Harmsworth et. al 2011). The Cultural Health Index (CHI) was developed to
assess the quality of streams and rivers from a cultural perspective. CHI has
three components: traditional site association with Maori, historical and
contemporary mahinga kai (resource gathering) status, and a cultural stream
health measure that summarises eight indicators of catchment, riparian, and
instream condition in a way that keeps with Māori values (Townsend et al.,
2004, Tipa & Tierney, 2006). We compared the CHI to macro invertebrate
community index (MCI), EPT richness, YSI and nutrient values. Each
comparison was made at an urban and natural reach for each stream. Our
experiment was the first to investigate a relationship between EPT and
indicators of Māori Cultural health.
Aims & Hypothesis
• Aim of study: To evaluate streams
based upon the three components of
CHI and see how that measure of
stream health compares scientific
measures.
• Hypothesis: If CHI is an accurate way
to measure stream health as found
by Harmsworth et al. (2012) and we
test this by comparing it with
scientific methods of measuring
stream health, then we should see
that there is a strong relationship
between the two.
• 5 streams: Ross creek, Lindsey Creek, Leith River, Kaikorai
River and Silverstream each with an urban and natural
reach.
• Individually assessed the 8 hallmarks of Maori cultural
health index.
• Measured temperature, dissolved oxygen and flow with
YSI.
• 10 Kick-net samples each 30 seconds in duration
• Counted first 300 Macro invertebrates from
each sample.
• Ran nutrient analysis using automated lab
procedure for analysis of Nitrate, Dissolved
reactive Phosphorous and Ammonia
• Ran a linear regression for CHI against MCI and
EPT.
• Ran a one-way ANOVA on CHI and land use.
Methods
Discussion/Conclusions
• Significant result for natural reaches, but not significant for urban
reaches
• Not significant when comparing CHI to YSI and Nutrient values.
• Correlation between CHI and MCI and CHI and EPT (fig.1, fig.2)
indicates that CHI is a suitable predictor for stream health.
• Maori cultural health index is a good measure of stream health
when looking at a healthy stream, and should be used with
caution for streams of lesser health.
• Study by Harmsworth et al. (2011) reinforces the correlations
found.
Acknowledgements
Thanks must go to Matt Ward for his supervision of this project. Also
thanks to Karina Kelly, Brooke Turner and Hannah Shepherd for their
help with sampling and data analysis.
References
Harmsworth G.R., Young, R.G., Walker, D., Clapcott, J.E. & James, T. (2011) Linkages
between cultural and scientific indicators of river and stream health. New Zealand Journal
of Marine and Freshwater Research 45: 423-436
Tipa G. & Teirney L. (2006) Using the Cultural Health Index: How to assess the health of
streams and waterways. NZ Ministry for the Environment, Wellington.
Townsend C.R., Tipa G., Teirney L.D. & Niyogi D.K. (2004) Development of a tool to
facilitate participation of Māori in the management of stream and river health. Ecohealth
1: 184-195.
Molly Shepherd