Cardiac Output, Venous Return, and Their Regulation
payne1964.pdf
1. JOURNALOF CHROMATOGRAPNY =73
THiX QUANTITATIVE SEPARATION AND ESTIMATION BY THIN-
LAYER CHROMATOGRAPHY OF LIPIDS IN NERVOUS TISSUE
SHEILA N. PAYNE
Human Nutrition Research U&t, National Institzrte for Medical Research,
Lo&on (Great Britain)
(Received September goth, I963)
During the last four years there has been a great increase in the’ use of thin-layer
chromatography for the separation of lipids but for brain lipids reports have been
concerned mainly with the procedure as a qualitative rather than as a quantitative
technique,
JATZKEWITZ~
has determined the eight sphingolipids in brain, quantitatively,, by
scraping off the silicic acid containing the separated fractions from the plate and
estimating the lipids calorimetrically. In 1962, HONEGGER~
published a semi-quanti-
tative method of estimation of brain lipids by visual comparison of spot densities on
thin-layer chromatoplates. DAVISONAND GRAWAM-WOLFAARD~
have also determined
brain lipids quantitatively by thin-layer chromatography, but their method also
involves scraping off the silicic acid as well as the lipid and then transfering the
“scraped off” material to columns for elution before hydrolysing the lipids ‘for ana-
lysis .
The procedure to be described below is considered to be much simpler in that
lipids are determined directly on the plate. It is an application of methods ,by
Z~LLNER, WOLFRAM AND AM!N~ who estimated cholesterol esters, and PRIVETT,
BLANK AND LUNDBERG" who estimated mono-, di- and triglycerides by spraying
with sulphuric acid and scanning the separated spots with a densitometer.
Two methods for scanning thin-layer, chromatograms have recently been pub-
lished. CSALLANYAND DRAPERYcoat the silicic acid layer with Neatan and remove
it from the plate before scanning, SQUIBB’uses a clear plastic onto which the silicic
acid is bonded; this can then be cut into strips prior to scanning in standard equip-
ment.
MATXRIALS
ANDEQUIPMENT
Merck’s Kieselgel G spread on glass plates 20 cm x 20 cm, in layers about 250 F thick.
Plates are activated T h before use at 120’ for 30 min. Chloroform, methanol G.P.R.,
st-propanol, distilled once and 1.2.5 o/o aqueous ammonia.
The samples were applied to the plate with an Agla micrometer syringe mounted
vertically on the coarse adjustment of an old microscope. This enables .the sample to
be applied to the plate without scratching the surface of the silicic acid.
The chromatoplate is placed on a bed which moves over a scale so that samples
are always applied in exactly the same positions.
J. Chrotnatog., 15 (1964) 173-179
2. 174 -S. N. PAYNE
The scanner is of the reflectance type (Fig. I) and is manually operated. Rays
from the light source strike the plate at right angles and are reflected onto photocells
from which the signal passes through an amplifier and is registered on a voltmeter.
PC
P
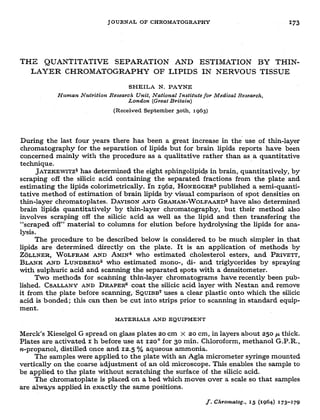
Fig. I. Bloclc diagram of scanner. A = amplifier; L = light source ; P = plate : PC I photocell ;
v= voltmeter.
METHOD
Total lipids are extracted from freeze-dried brain with CHCl,-MeOH (z : I, v/v) in the
ratio of 20 ml of solvent to T g of the original wet tissue. An aliquot of the extract
(equivalent to x50-200 pg of total lipid) is applied to the silicic acid as a narrow band
(0.8 cm x 0.1 cm) under a stream of nitrogen, without prior concentration, Samples
are run in duplicate on the same plate in parallel with standard lipids of varying
concentration.
The prepared chrornatoplates are run in small tanks, previously saturated with the
solvents used by JATZKEWITZ~, except that the volumes of solvents in the second
mixture, rt-PrOH-NH,OH, are 39: II, which has been found to produce better sep-
arations.
After drying, the plates are ‘sprayed with 50 ‘+” sulphurid acid to which methyl
orange has been added (5 mg %). The plates are then heated at 160” for 20 min when
the lipids show up as carbonized spots on a white background. (Fig. 2).
The separated lipids are scanned directly on the plate by the reflectance scanner
which measures the optical density at intervals of 0.3 mm along the length of the
plate. The trace produced is shown in Fig. 3. A trace is also made along a blank strip
of the sprayed, heated silicic acid.
The areas under the curves are measured with a planimeter and the mean value of
3 readings is taken. The area is found to be proportional to the weight of lipid in the
sample (see Figs. 4-6). By comparison of the graphs of areas under the curves against
weight of standard lipid applied with the area of a particular lipid in the sample, it is
possible to calculate the amount of that lipid in the tissue.
Cholesterol is determined calorimetrically by a modified Liebermann-Burchard
reaction on an aliquot of the original lipid extract.
J. Chrontatog., 15 (1964) x73-179
3. TLC OF LIPIDS IN NERVOUS TISSUE
*75
A”‘.‘# .
Fig. o,. Lipids in rat brain separated on a thin layer of silicic acid on a glass plate
in CHCl,-MeOI-I-H,0 (14:6: I) to 15 cm and then in n-PrOH-NI3,OI-I (39: II) to
in position A are those found in rat brain. Lipids in position B are “standards”:
ovolecithin, the cerebroside is synthetic glucoccrebroside. The pbosphatidyl ethan
up as two spots when the spot is not overloaded: the faster running is the plasma1
the phosphatide.
and run first
IO cm. Lipids
the lecithin is
olamine shows
ogenic form of
10
0.0.
8
6
0
Fig. 3. Separation of lipids. 1.64 mg wet brain tissue E 23 ,~l lipid extract of brain of stock rat
38 % 1_5r ,uug lipid. Total length of plate = 20 cm.
J. ChrOtm.Zto~. , I fj (I 964) 173-I 79
4. 176 S. N. PAYNE
?-
c: 6-
.r
z
- 5-
?
5
” 4-
d
P
5 a-
0
if!
4 2-
::
100 120 140 160 160 200
,ug lipid applied at origin
Fig. 4. Graphs showing relationship between area under the curve ‘(sq. in.) and the quantities of
different lipids found in varying amounts of total lipid. l = sphingomyelins; 0 = cerebrosides;
A = cerebroside sulphuric acid esters; A = gangliosides.
0 I I 1 I I I
0 0.2 0.4 0.6 0.6 1.0 1.2
/usp
Fig. s.‘Graplis showing relationship between areas under curves (sq. in.) and quantities of P of
three phospholipids. A = sphingomyelin; 0 T phosphatidyl ethanolamine; 0 = ovolecithin.
1. Chromaiog., 15 (1964) 173-17g
5. TLC OF LIPIDS IN NERVOUS TISSUE I77
!f
E
//
a .I
&
2 l-
pg CSAE
8 12 18 22 26 30
0 I
3 4 6 8 10 12 14 16
Ng lipid
Fig. 6. Graphs showing relationship between area under the curve (sq. in.) and concentration of
lipids. 0 = CSAE = cerebroside sulphuric acid esters; 0 = sphingomyclins; A = glucocerebro-
sicles.
RESULTS AND DISCUSSION
Table I shows the reproducibility of the method. As would be expected, the standard
errors of the smaller peaks are rather larger than could be desired, but that on the
larger peaks is considered sufficiently small to make the method usable.
Methyl orange is added to the sulphuric acid spray so that even cbverage of the
plate is easier to obtain. Although this produces a slightly darker background due
to carbonization of the methyl orange, the advantages greatly outweigh the disad-
vantages.
TABLE I
REPRODUCIBILITY &? TWB ‘METIIOD
Arca tbnder cwve its “/6 of totid awcu
Gangliosidc a + b
Ganglioside c
Ganglioside d
Lysocephalins and lysolecithin
Phosphatidyl serine
Sphingomyelin
Lecithin
Cerebroside sulphuric acid esters
Phosphaticlyl ethanolamine
Degradation product of phosphaticlyl
ethanolamine
Cerebrosides
0.7
1.3
0.s
0.23
6.2
9.0
19.4,
7.5
32.4
2.4
20.4
I .o
2.0
= a3
1.3
9-o
6.3
IS.9
6.6
“Z
-.
19.9 20.4 + 0.45 22.G
0.6 + 0.05 o-3 0.5
I *3 + 0.07 0.8 I.0
0.7 + 0.09 0.4 0.5
I *a + 0.02 I ..j. 1.6
s.4 + 0.78 9.3 10.3
7.3 + 0.34 3.8
ISag + 0.41 12:; 18.9
G-0 + 0.41 4.8 4-S
33.2 + 0.59 35.3 35.2
2.7 + 0.45 2.5 4 .2
19.0
Total area under curve (sq. in.) 38.59 36.70 22.71 16.73
Wet weight of brain tissue (mg) 2.09 2xs+ Oa7
1.63 . 0.gz 0.65
* All values given in this column are the means and standard errors of 5 separate determinations
on 3 different days, on 3 different plates.
J. Chromalog., 15 (1964) x73-x79
6. 17s S. N. P.4YNE
TABLE II
APPROXIMATE np VALUES POR LIPIDS IN NERVOUS TISSUE RUN IN CI-ICI,-MeOH-)_I,0 (I 4: 6: I)
TO 15 cm AND THEN IN ?z-PrOH-x2.5 o/. aq. NH,OH (39: I I) TO IO cm
Li$id RF
Gaqlioside a 0.022
Ganglioside b 0.027
Canglioside c 0.09
Ganglioside cl 0.13
Lysoccphalin 0.22
Phosphatidyl serine 0.25
Lysolecithin 0.27
Sphingomyelin a 0.31
Sphingomyelin b 0.33
Lecithin 0.46
Ccrebroside sulphuric acid esters a O.Gl
Cercbroside sulphuric acid esters b o.G4
Phosphatidyl ethanolamine 0.67-0.80*
Phrenosin 0.93
Kerasin 0.96
Cholesterol 0.99
Free fatty acids 1.00
* The first figure is the Rp value measured from the end of the spot and the second figure is
the Rp value measured from the front of the spot.
TABLE III
CONCENTRATION OF LIPIDS IN RAT BRAIN TISSUE AS DETERMINED BY THIN-LAYER CHROMATOGRAPHY
(TLC) COMPARED WITH THE RZSULTS OF OTHER AUTHORS
LiQid
Rcsdts by TLC
Lipid (rtrg) itr
total brain qf 50
day old rat
0th.~ aatliors results
Li;bid (mg) itI total brctitr Refererrce
Cerebrosides
Cerebroside sulphuric
acid esters
19.3* I 6.5 (40 day old rat) IiOCH AND IiOCHe
14.6 (65 day old rat) ICISHIMOTOAND RADIX@
11.0 7.2 (40 day old rat) I<OCI-lAND I<OCHs
Lipid P (molrsjg) of wet bmirr tissue
Sphingomyelin
Lecithin
9.1
32.2
8. I (42-day-old rat) BETH, FREYSZ AND MANDEL~O
I I .o (a-month-old rat) MANDEL AND BIETH~~
28.2 (42-day-old rat) BETH, FREYSZ AND MANDEL~~
Total choline phosphatides 4x.3 29.4 (3-6 months old) NIEnlIno AND PRZYJEMSKI~~
* Using a synthetic glucocerebroside as standard.
J. C~womuiog., 15 (1964) x73-179
7. TLC OF LIPIDS IN NERVOUS TISSUE I79
Equal quantities of different lipids give varying areas under the densitometric
curves (Figs. 5 and 6) so that although the figures given in Table I for the percentages
of individual lipids present in the extract can be used for direct comparison of diffe-
rent tissues, they cannot be taken as an absolute indicatioq of the amount of each
component present. Therefore it is essential to have pure lipids for use as standards.
The Rr;l values of the lipid are not reproducible from day to day, but in relation
to one another they are constant. Therefore it is advisable to run standards on each
plate. The approximate RI;~values of the lipids in the solvents used are given in
Table II.
The two spots found for sphingomyelin and for the cerebroside sulphuric acid
esters are probably due to the difference in fatty acid composition. The gangliosides
have differing proportions of hexosamine to neuraminic acid in the molecule.
Not many figures are available in the literature for quantities of lipids in rat
brains, especially for cerebrosides, since most of the figures for “cerebroside” given
in the literature before 1955 include values for ganglioside as it was the sugar moiety
of both which was estimated. Table TIT shows the results obtained by this method
compared with those for rat brains reported in the literature.
ACKNOWLEDGEMENTS
I would like to thank pr. J. OLLEY for the gift of the sphingokyelin standard; Drr
G. H. SLOANE-STANLEY for the cerebroside sulphuric acid standard; Dr. D. SHAPIRO
for the synthetic glucocerebroside; and Dr. R. M. C, DAWSON for gifts of phosphatidyl
ethanolamine, phosphatidyl inositol and ovolecithin standards.
All the equipment was designed and made by Mr. P. R. PAYNE and Mr. J, BARKER
of this Unit.
SUMMARY
Lipids from brain ‘tissue have been estimated densitometrically after separation on
thin-layer chrornatograms.
Standard error on five determinations on three different days for lipids present
in large amounts is z %, but on lipids present in smaller amounts the standard error
is sometimes as much as IO %.
REFERENCES
1 W. JATZKBWITZ,Z. Pitysiol. Chem., 3k (1g61)61.
3 C. G. I-IONEGGER,Helv. Chh. Ada, 45 (1962) 2020.
3 A. N. DAVISON AND E. GRAHAM-WOLFAARD,B~~~?~~~.J., 57 (1963)31P.
4 N. ULLNER, G-WOLFRAM AND G. AMIN, Klin. Wocltschr., 40 (1962) 273.
6 0. S. PRIVETT, M. L. BLANK AND W. 0. LUNDBERG,J.A~. OilChemists Sot.,38 (Ig6r) 312.
o A. S. C~ALLANY AND I% W:DRAPER, Anal. Biochem., 4 (1962) 418..
7 R. L. SQUIBB, NaEzCYe,
rg8 (1963)'
3x7.
B W. KOCH AND M. L. KOCH, J. Biol. Chenz., 15 (19x3) 423.
e Y. KISHIRIOTO AND N. S. RADIN,J'. Lipid Res.,I (1959)79.
10R. BIETW, L. FREY~Z AND P. MANDEL,B~~c~~~. Bioph~s.Acfa, 53 (1961)576.
11P. MANDEL AND 1% 'BIETH,Bz&.Soc. Chim. Bz'ol.,
33 (1951)973.
12R. NIEMIRO AND J. PRZYJEMSICI,A~~~ Biochim. Polon., IO (1963) 107.
J. Cltromatog., 15 (1964)x73-179