Download to read offline

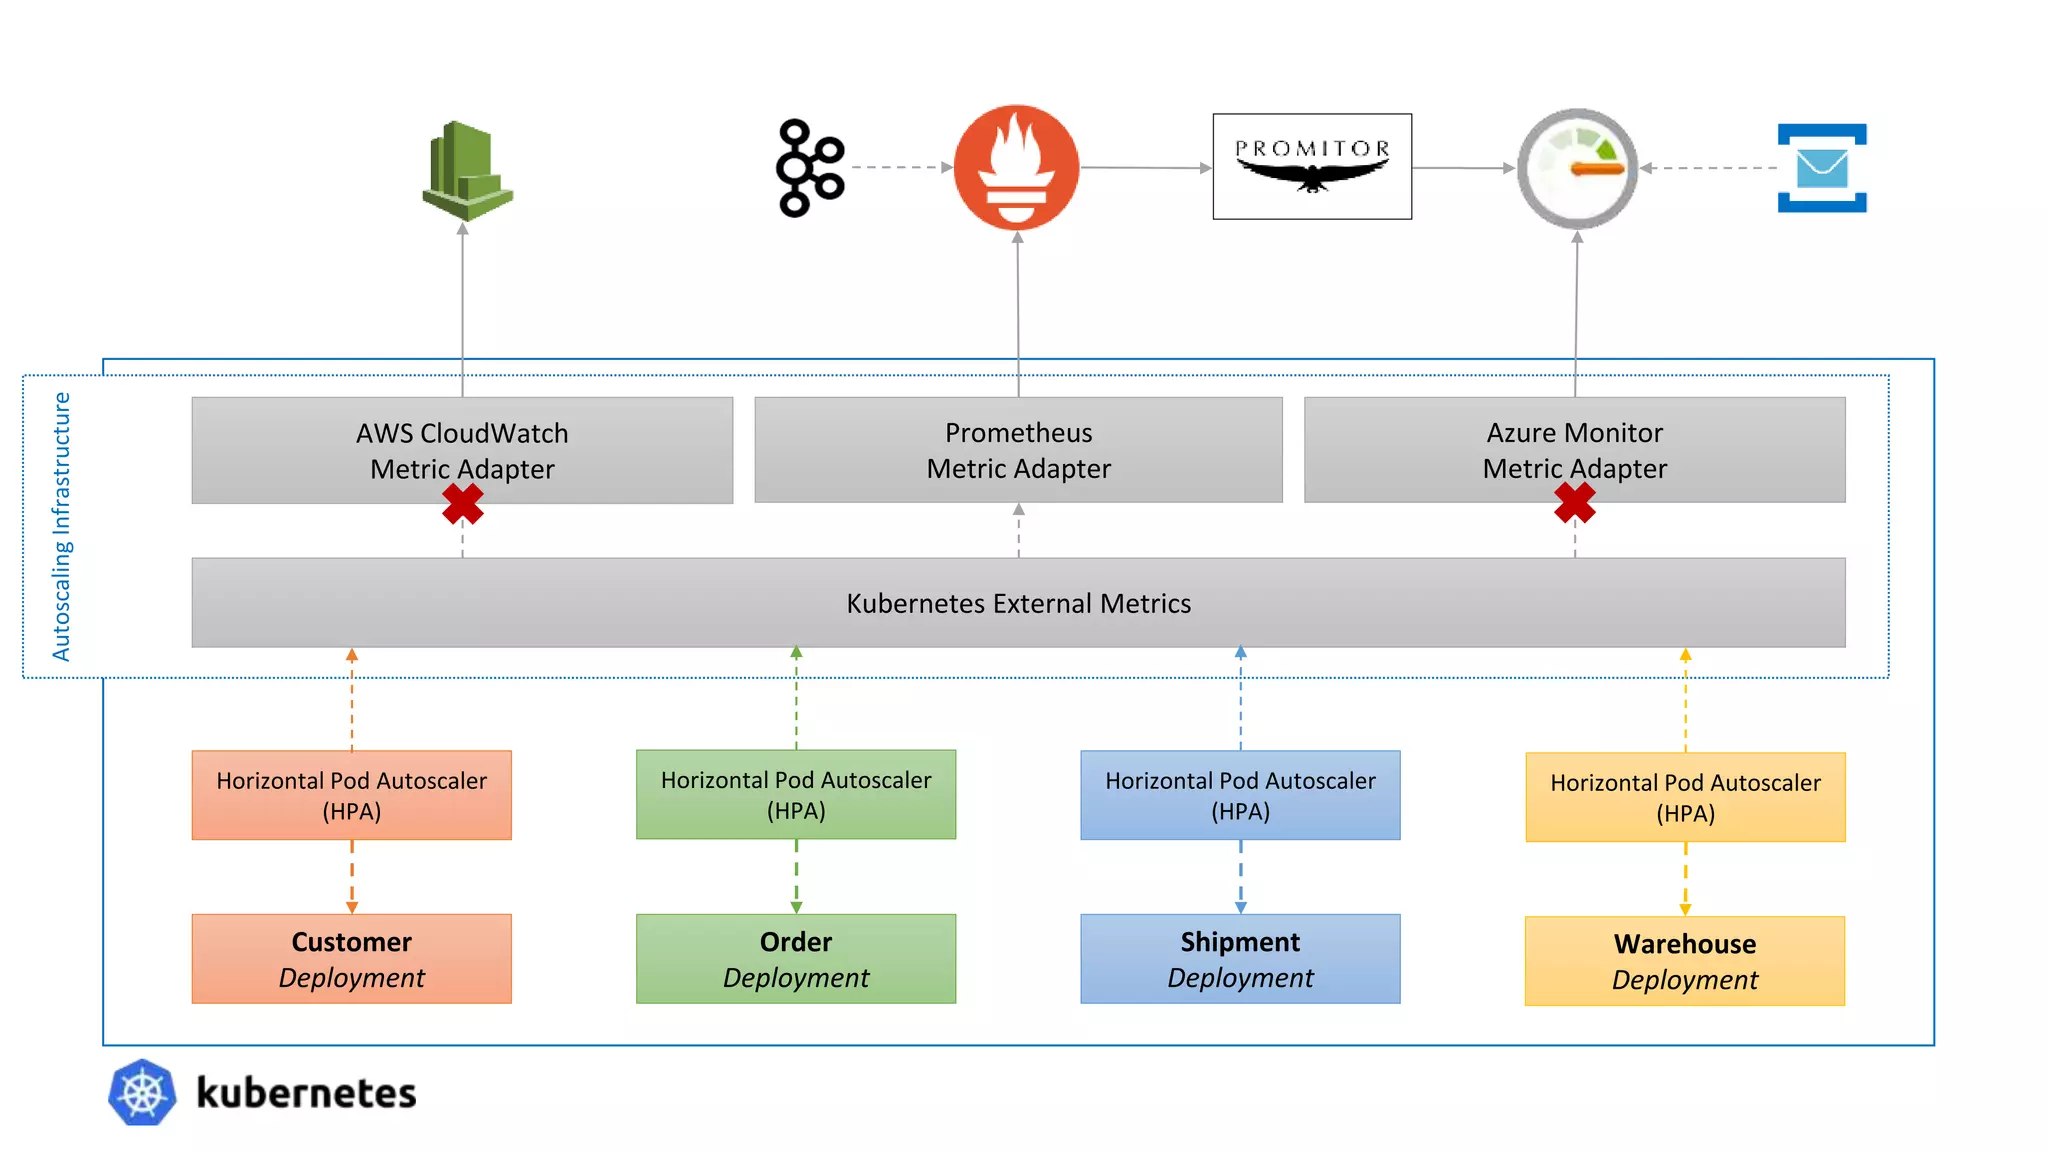
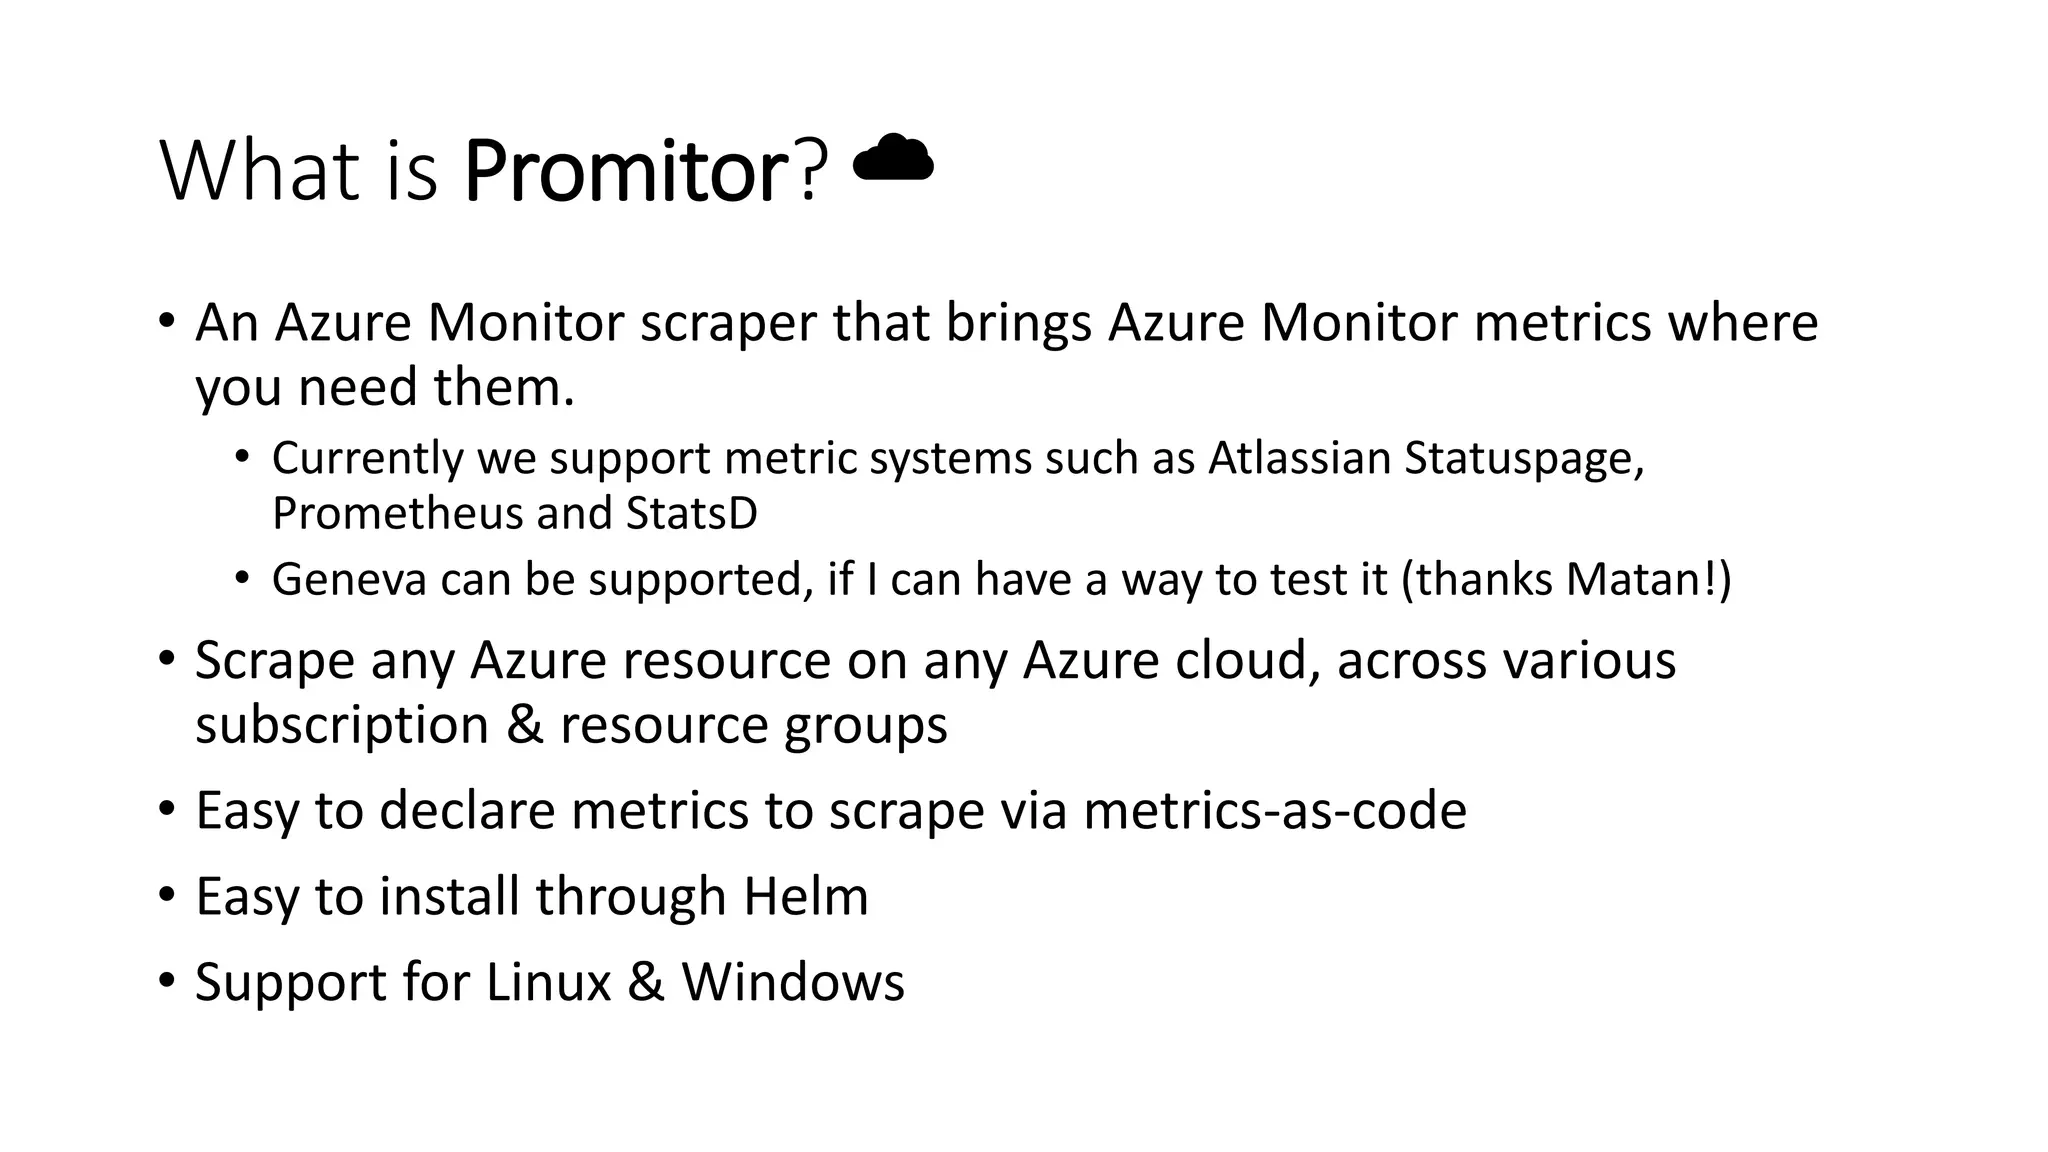
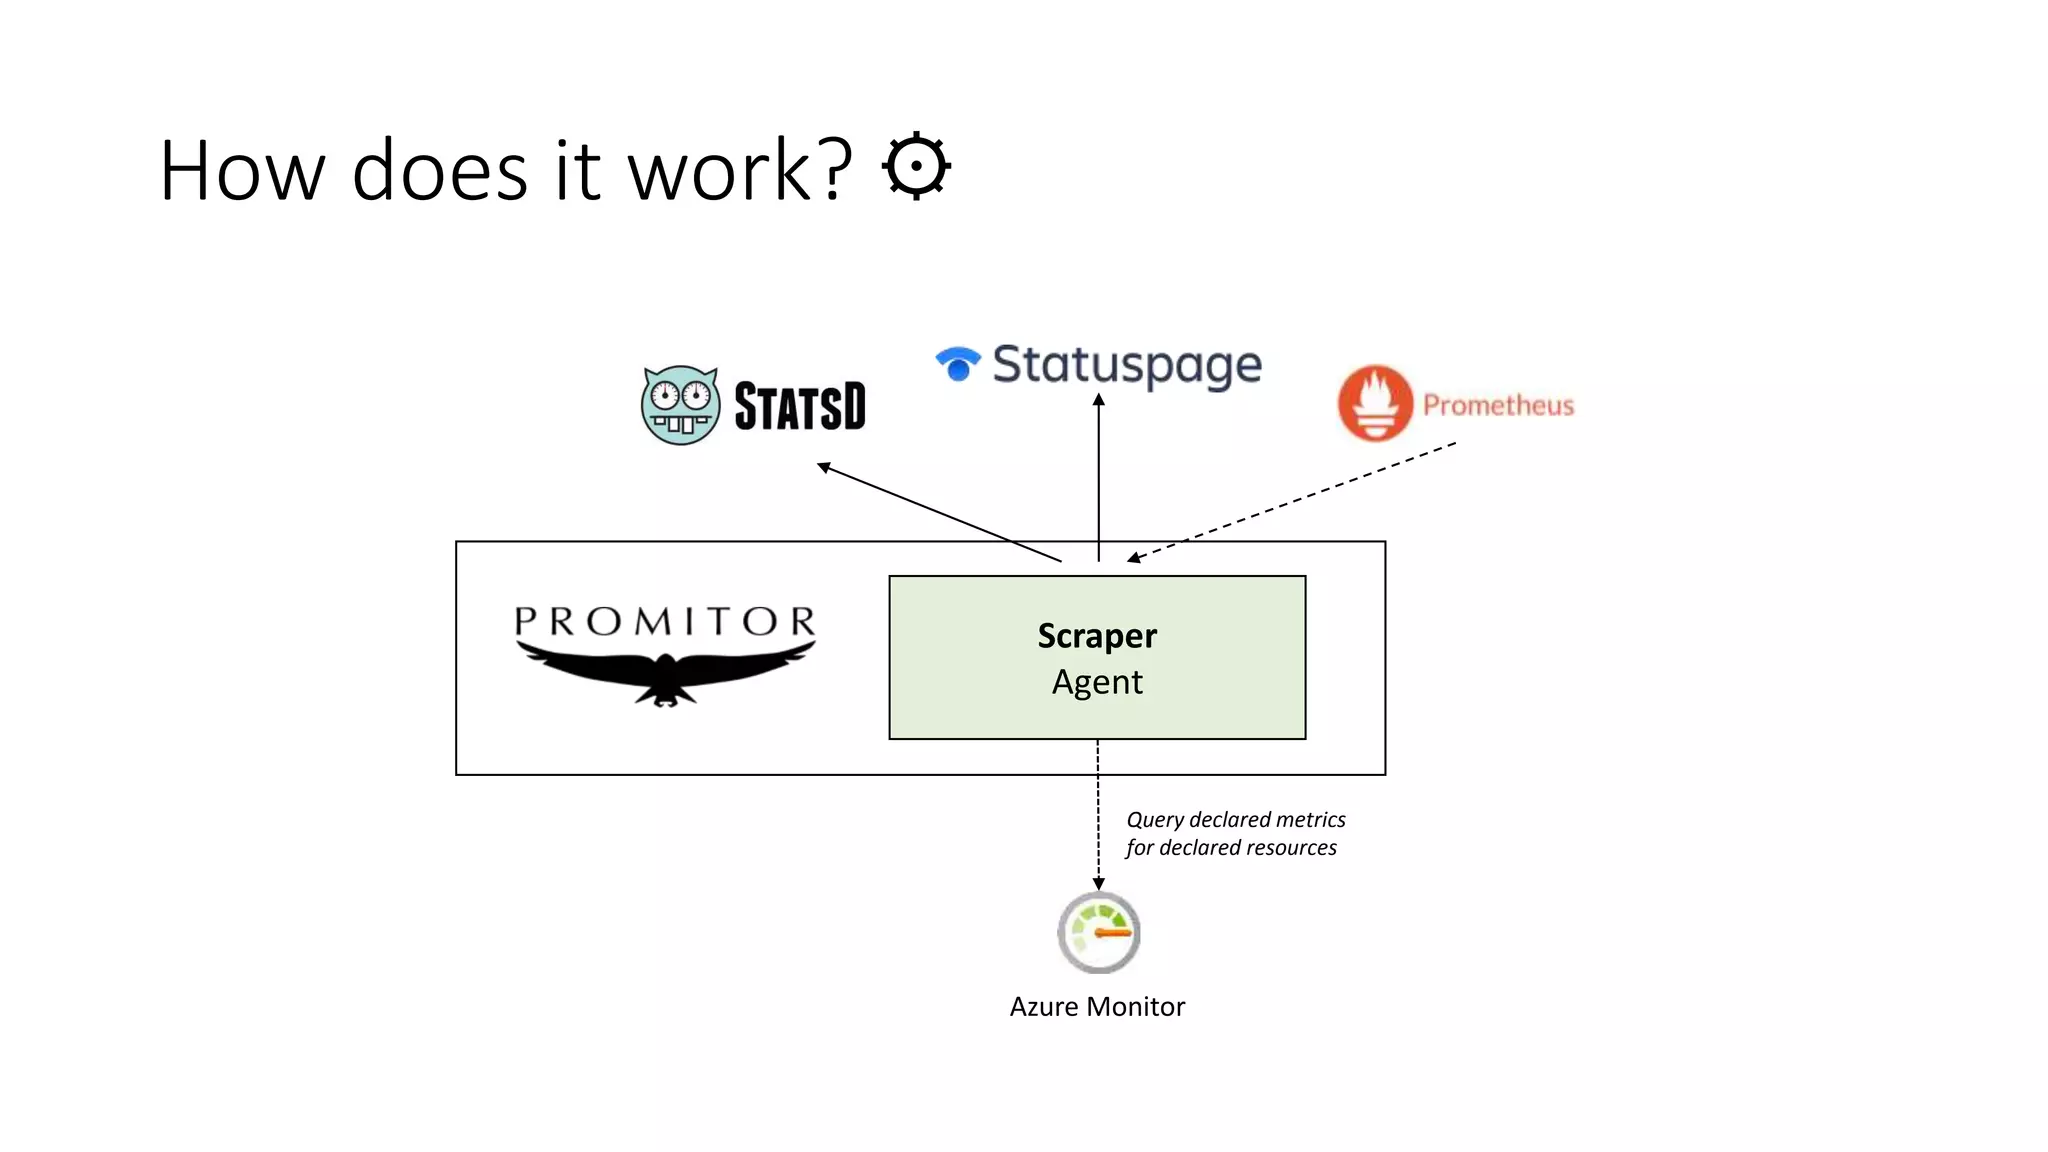
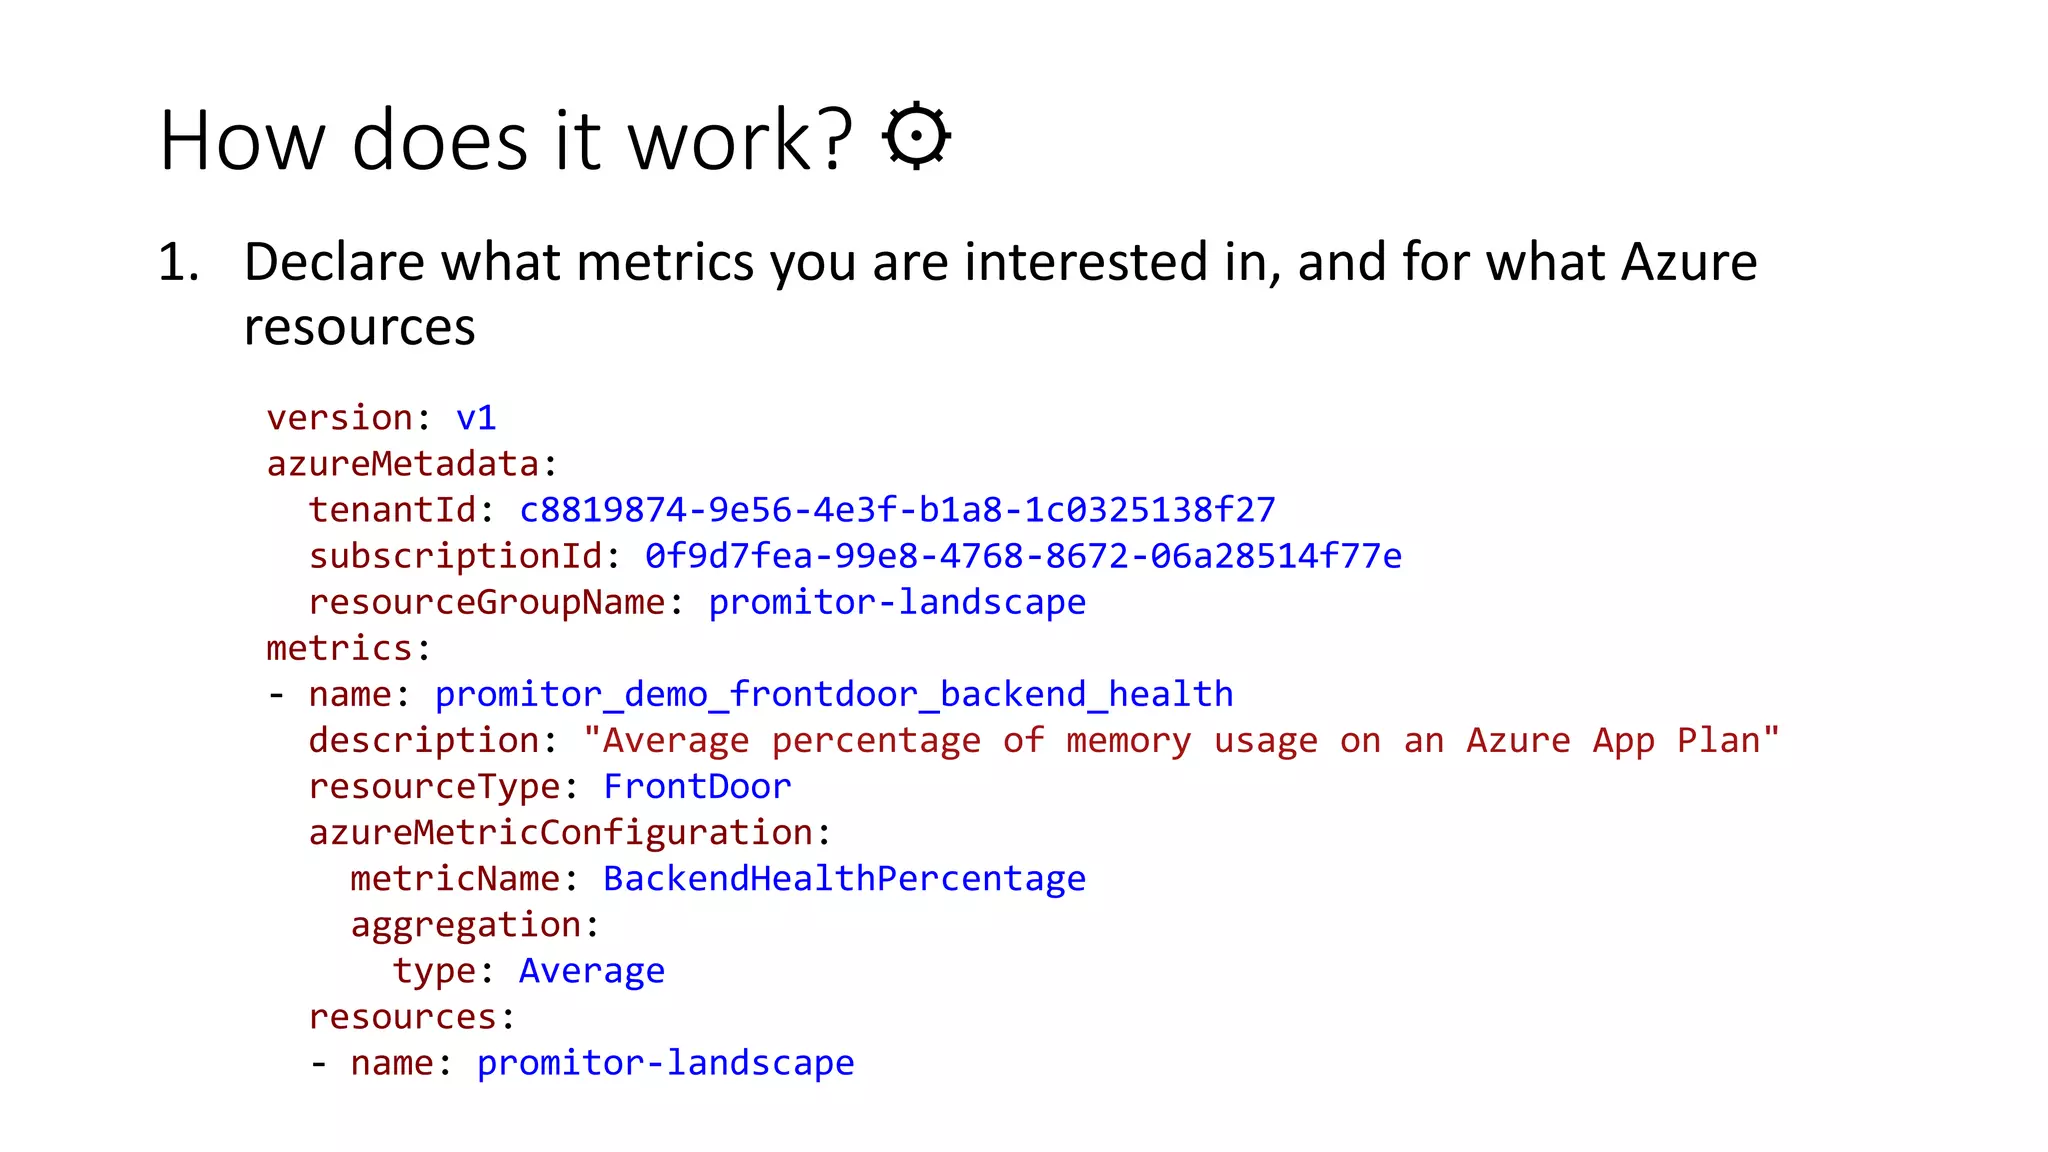
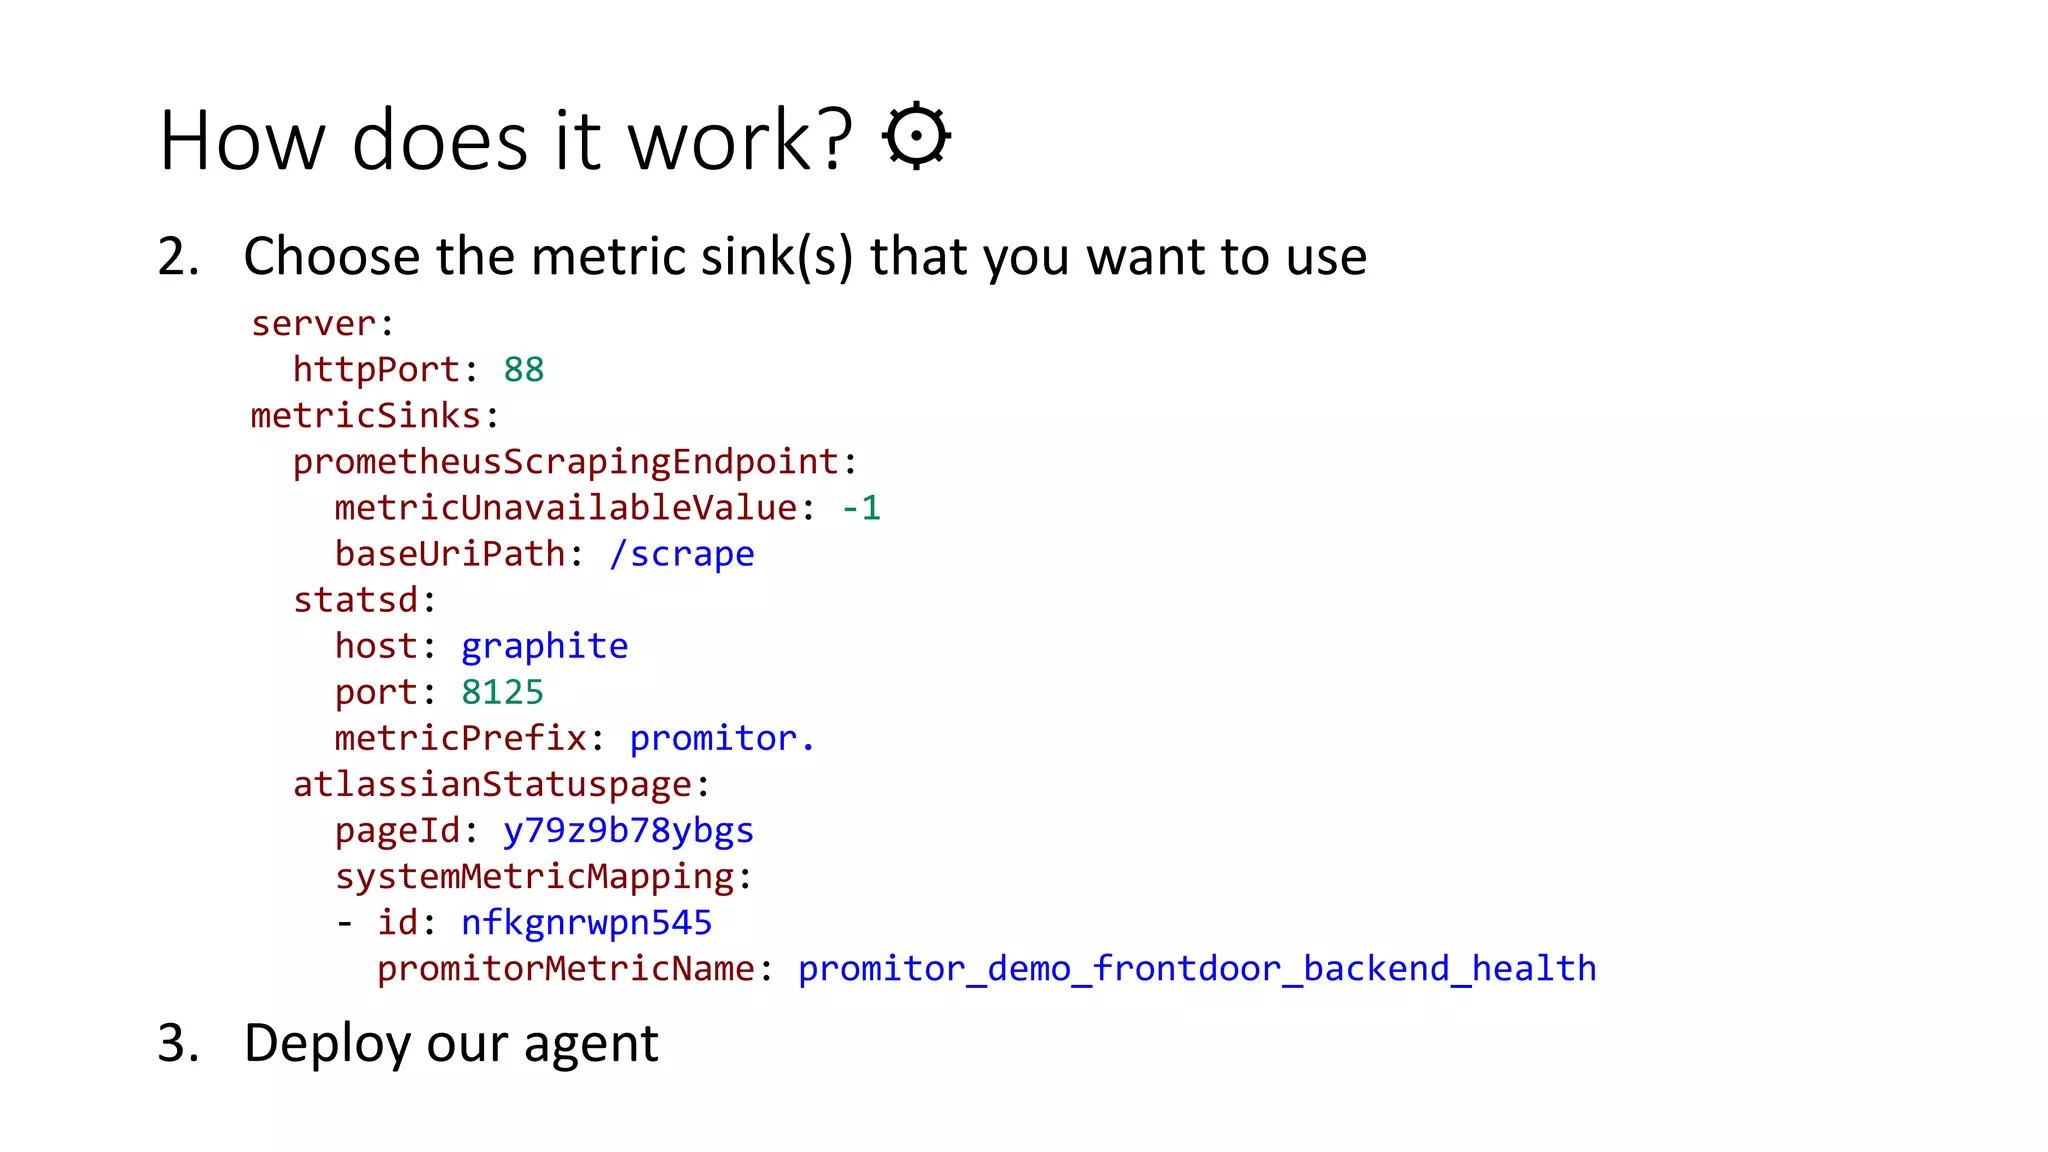
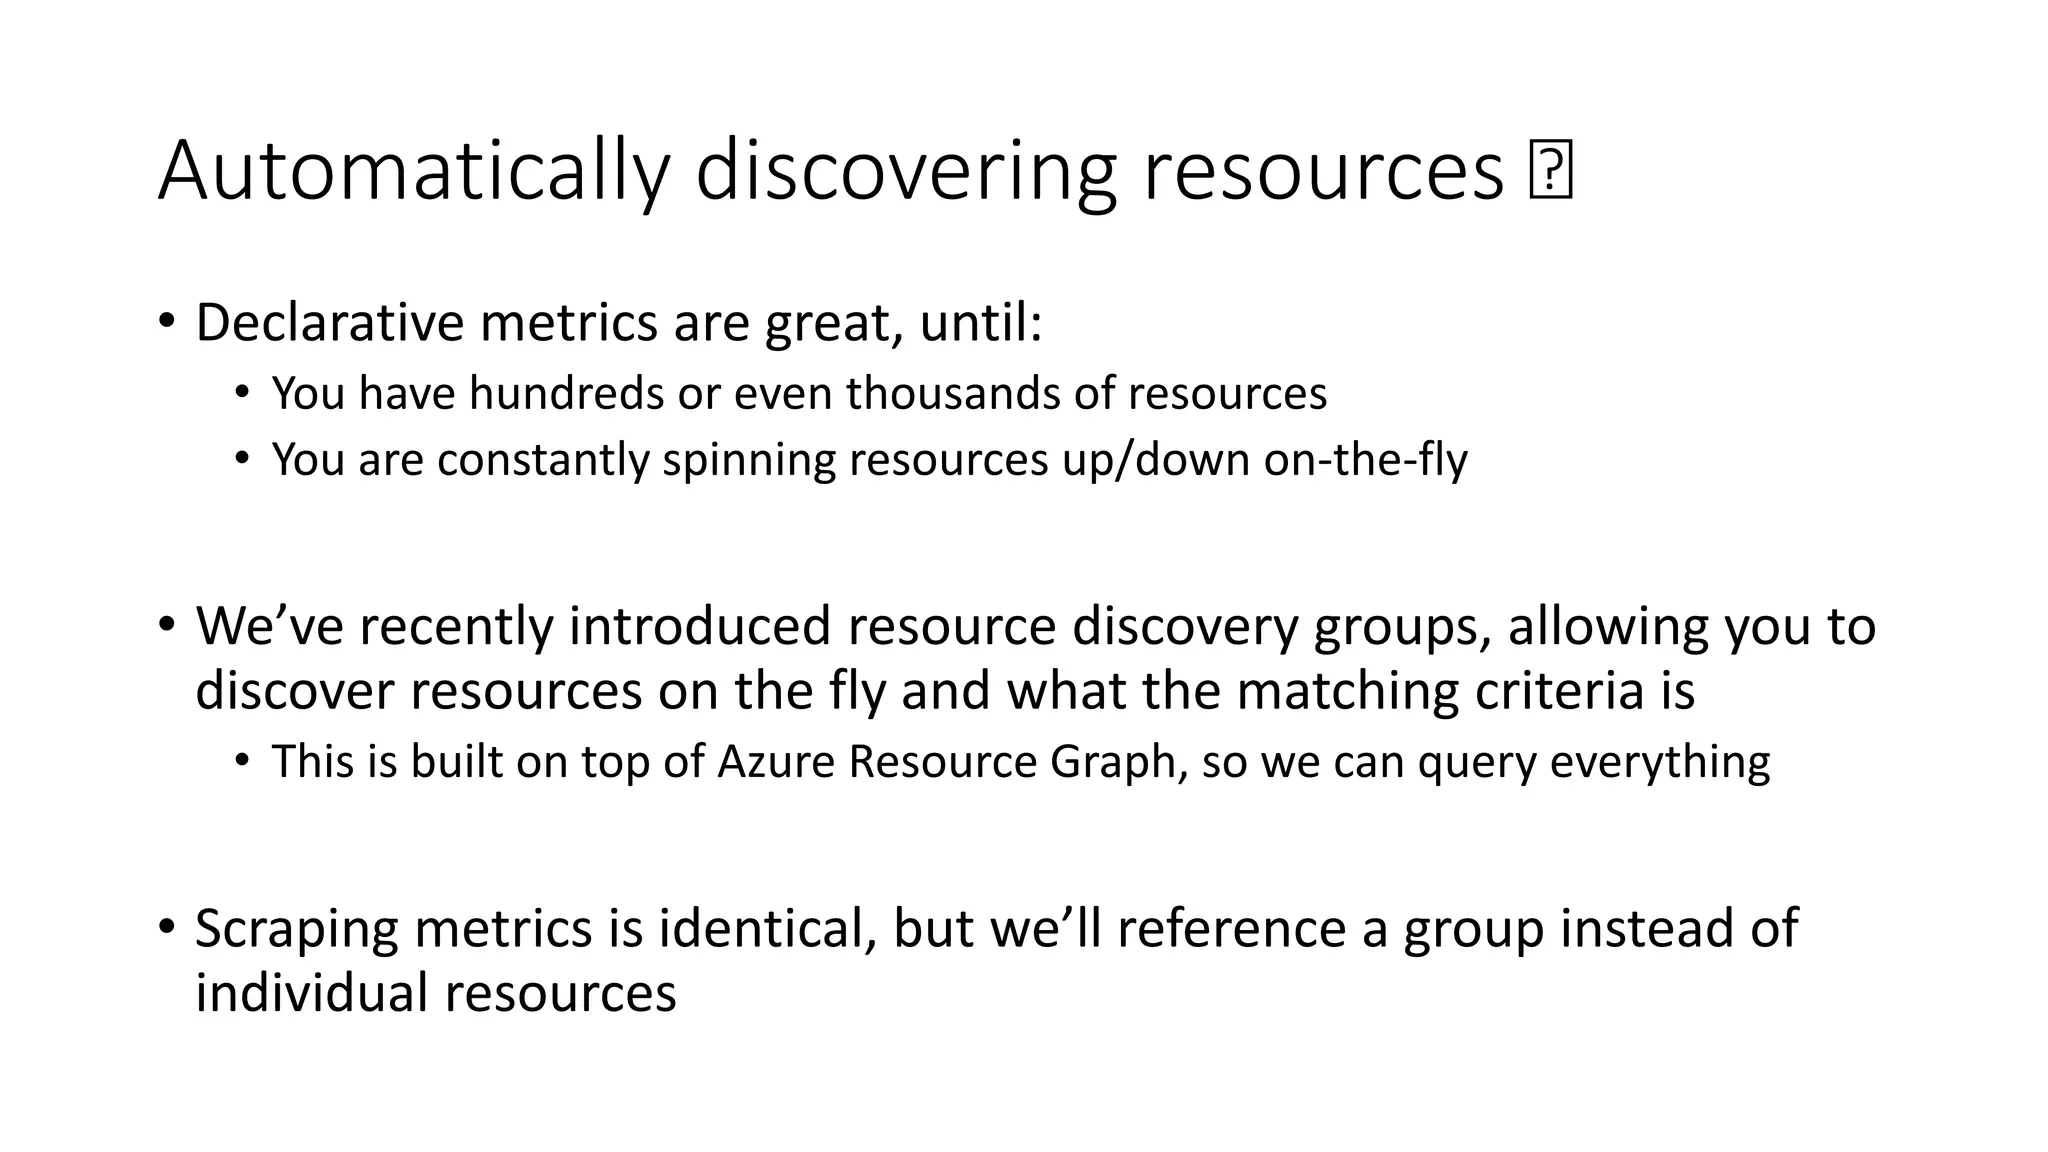
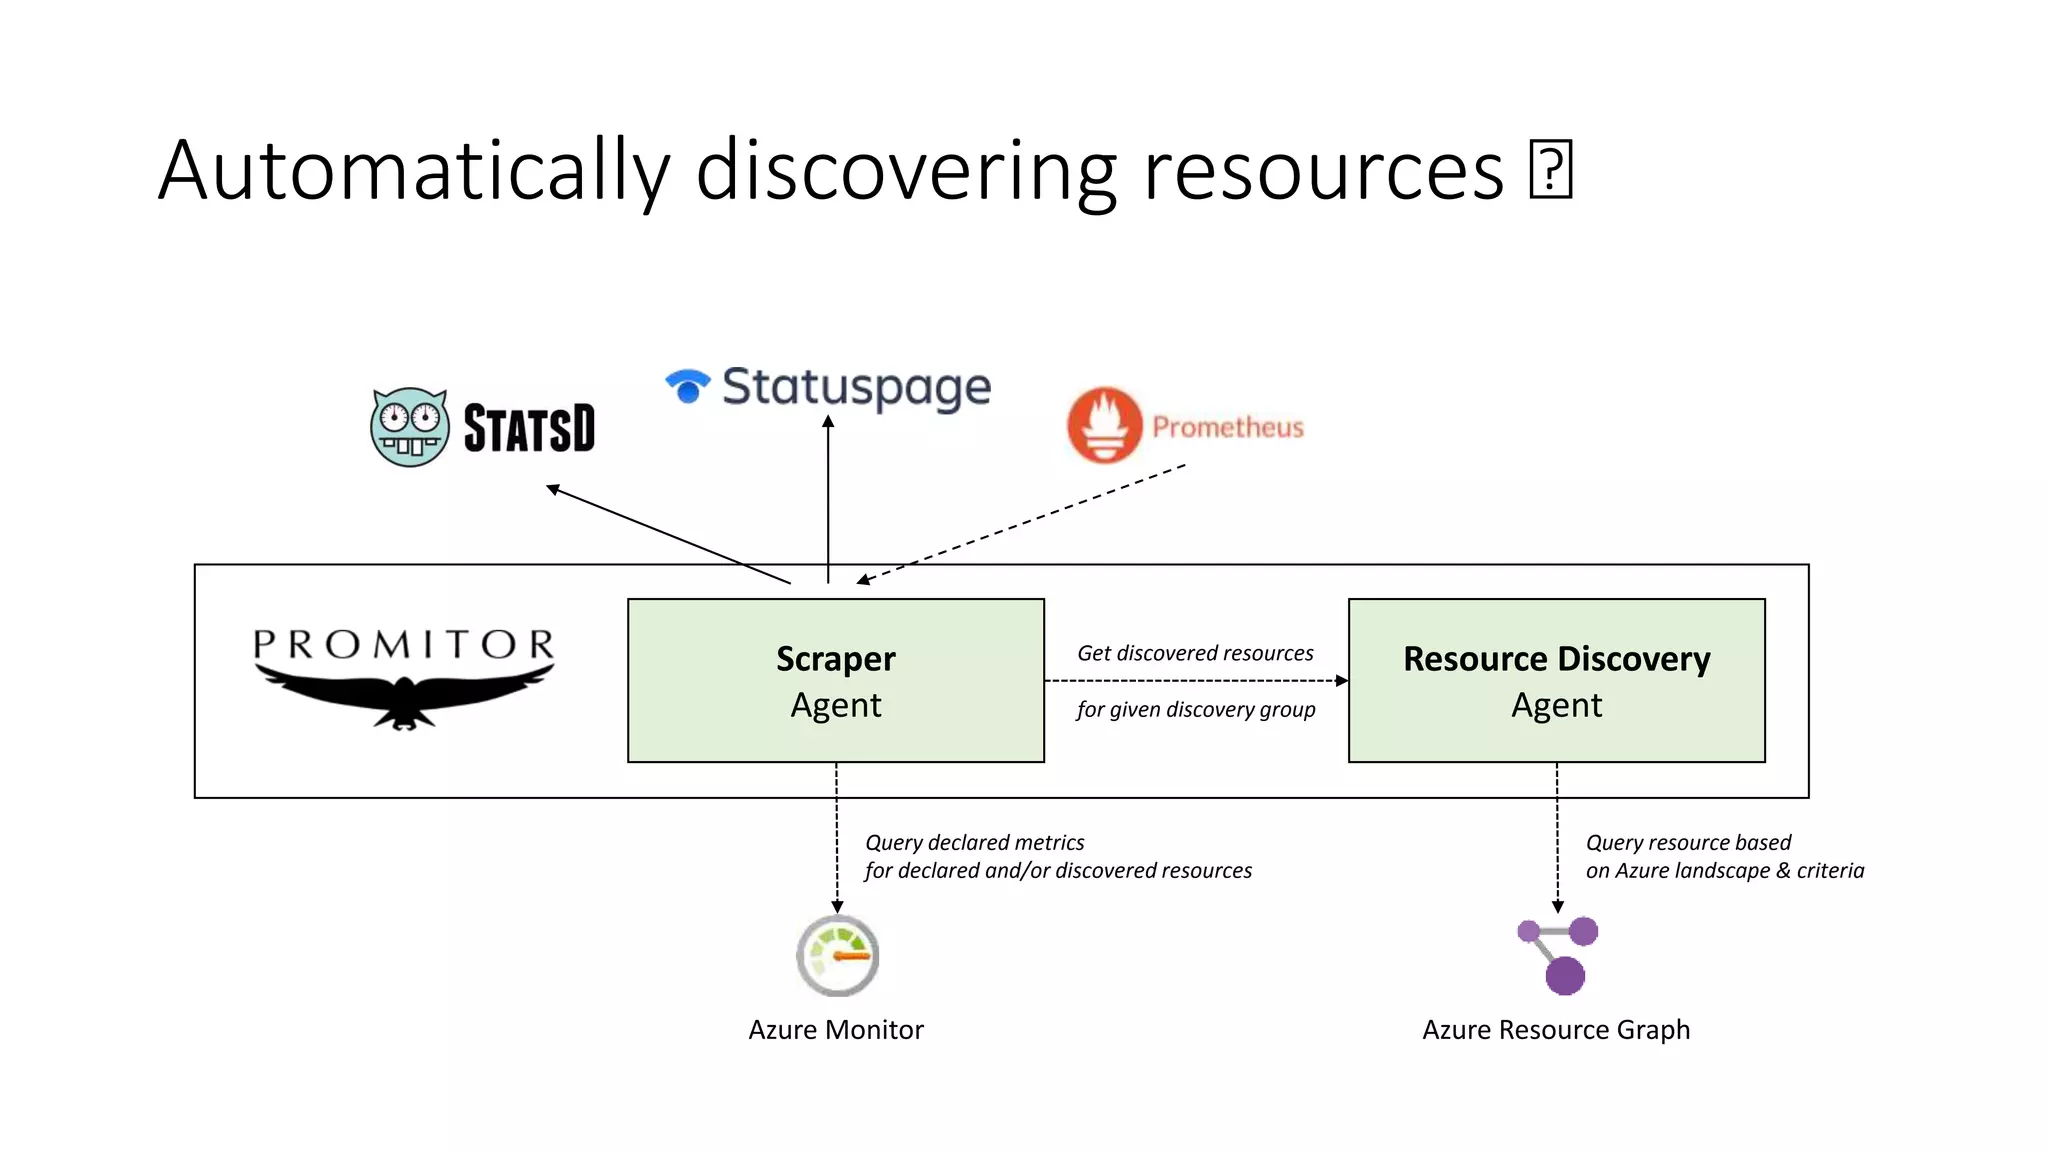
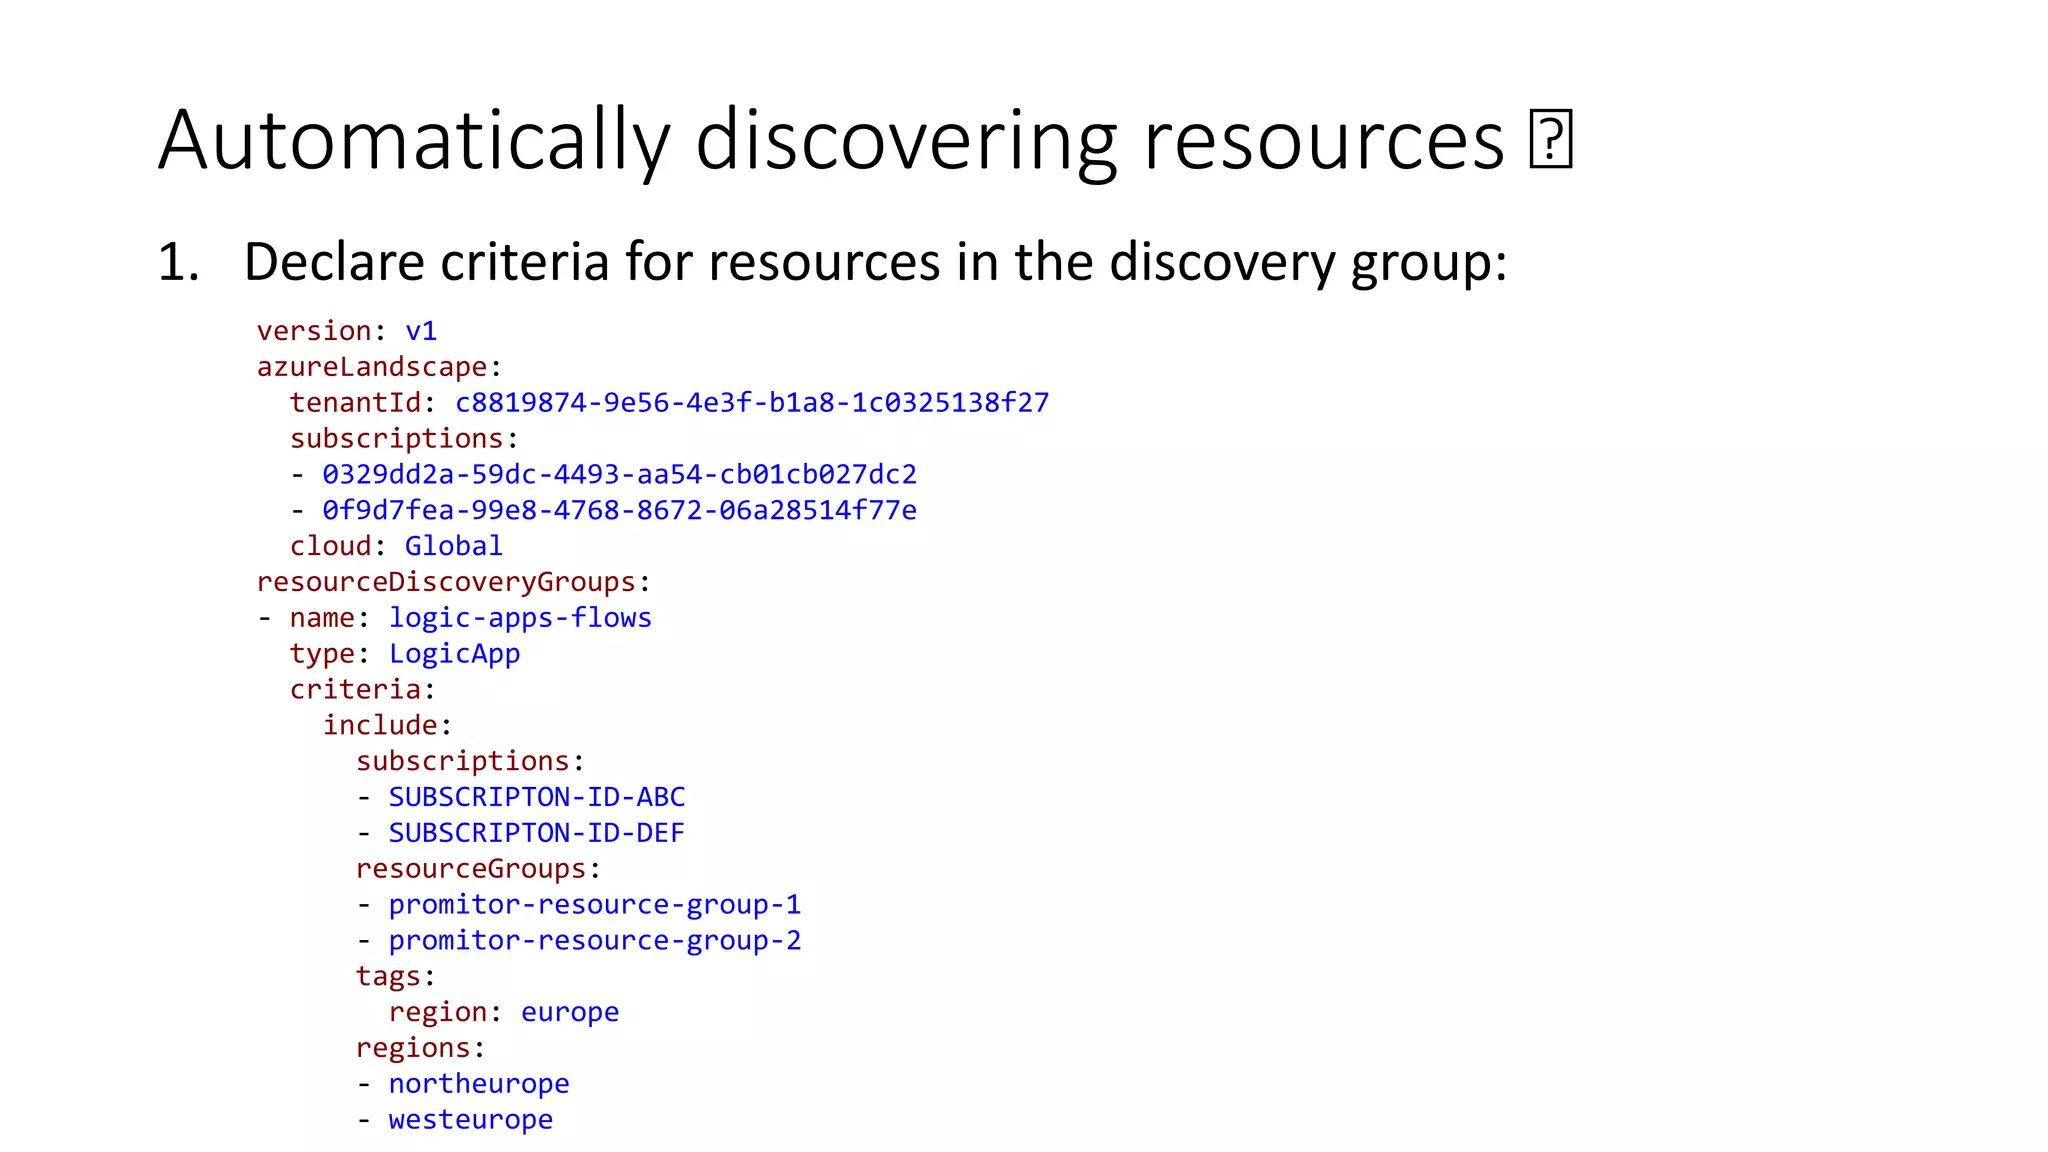
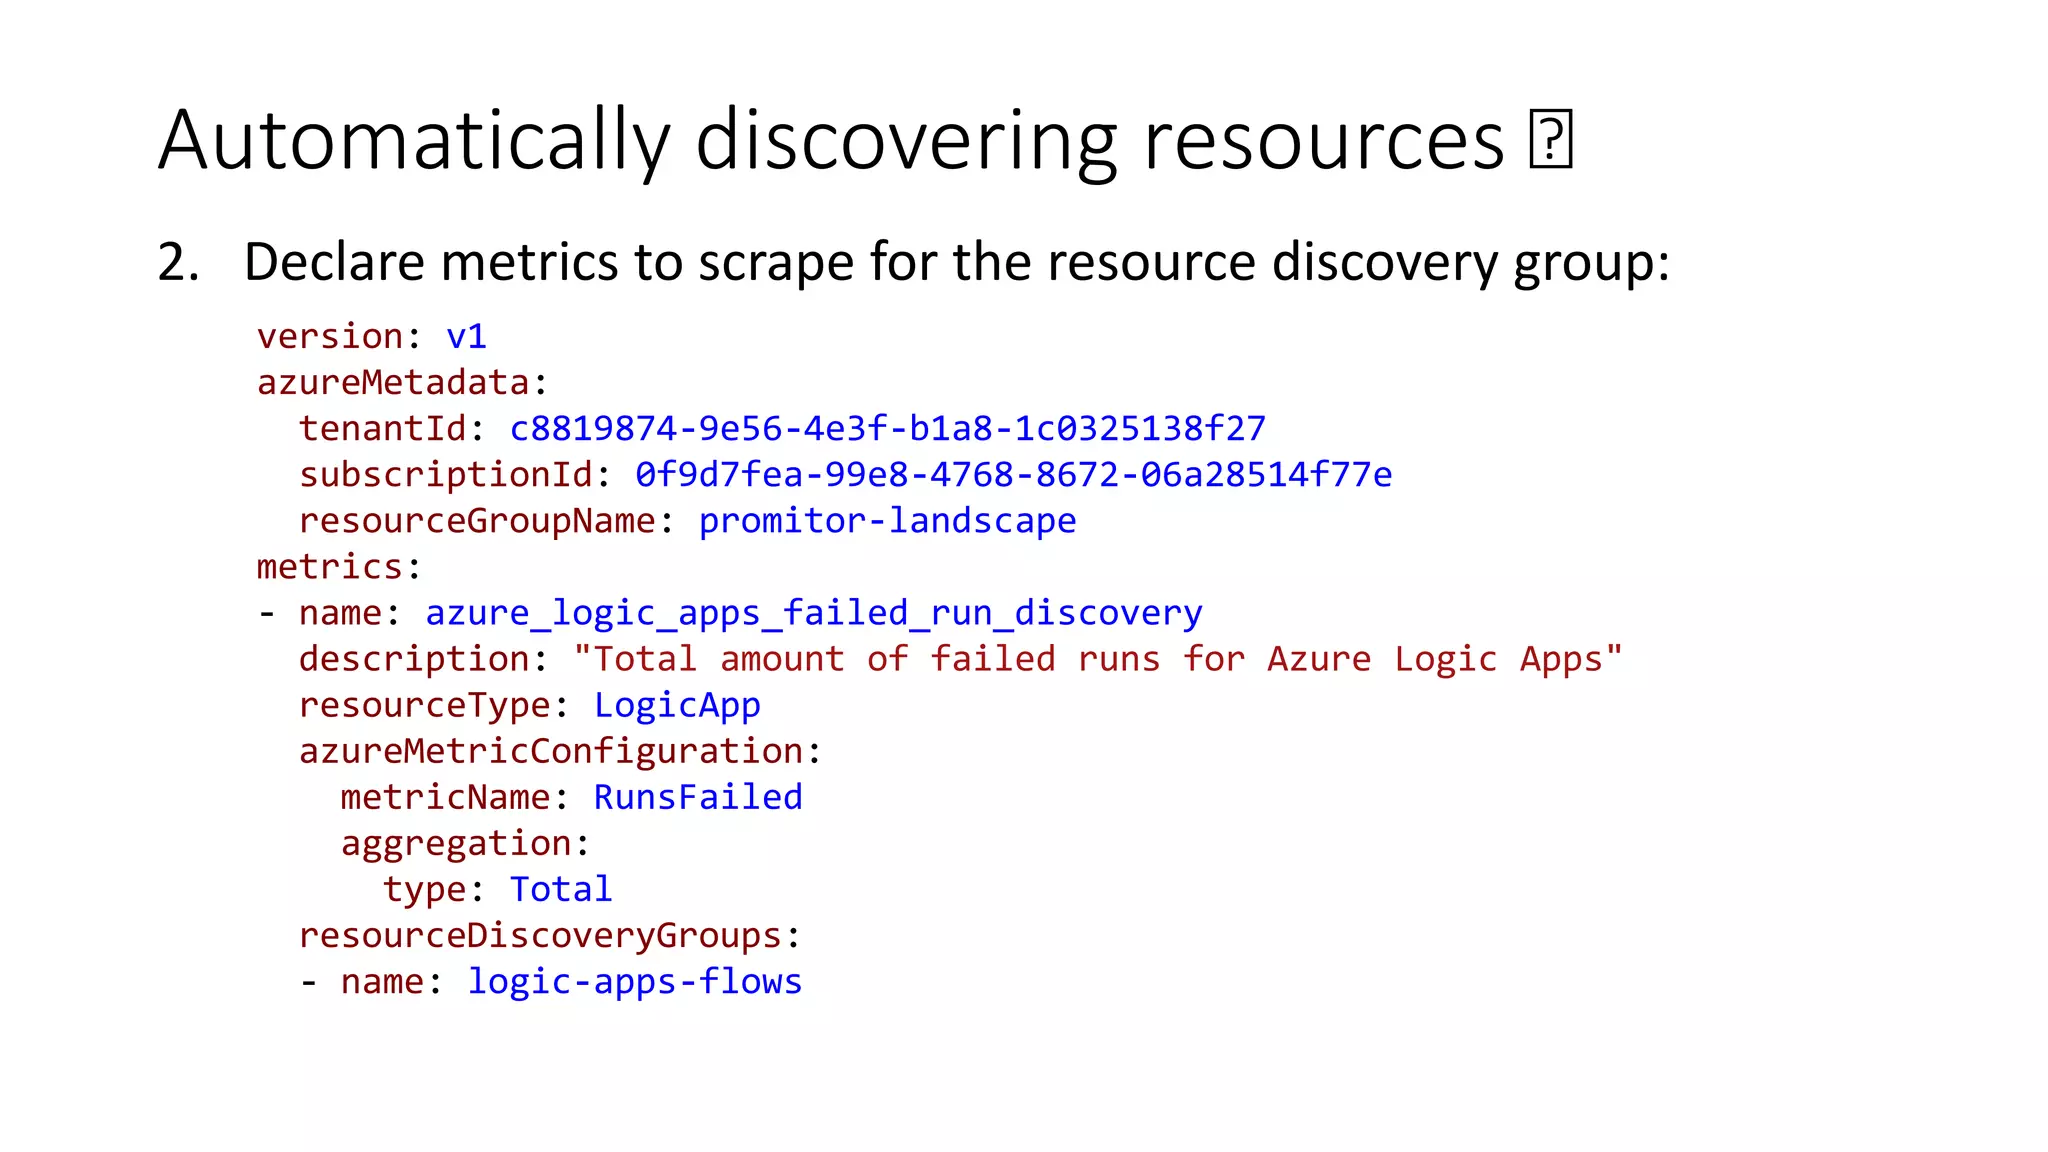
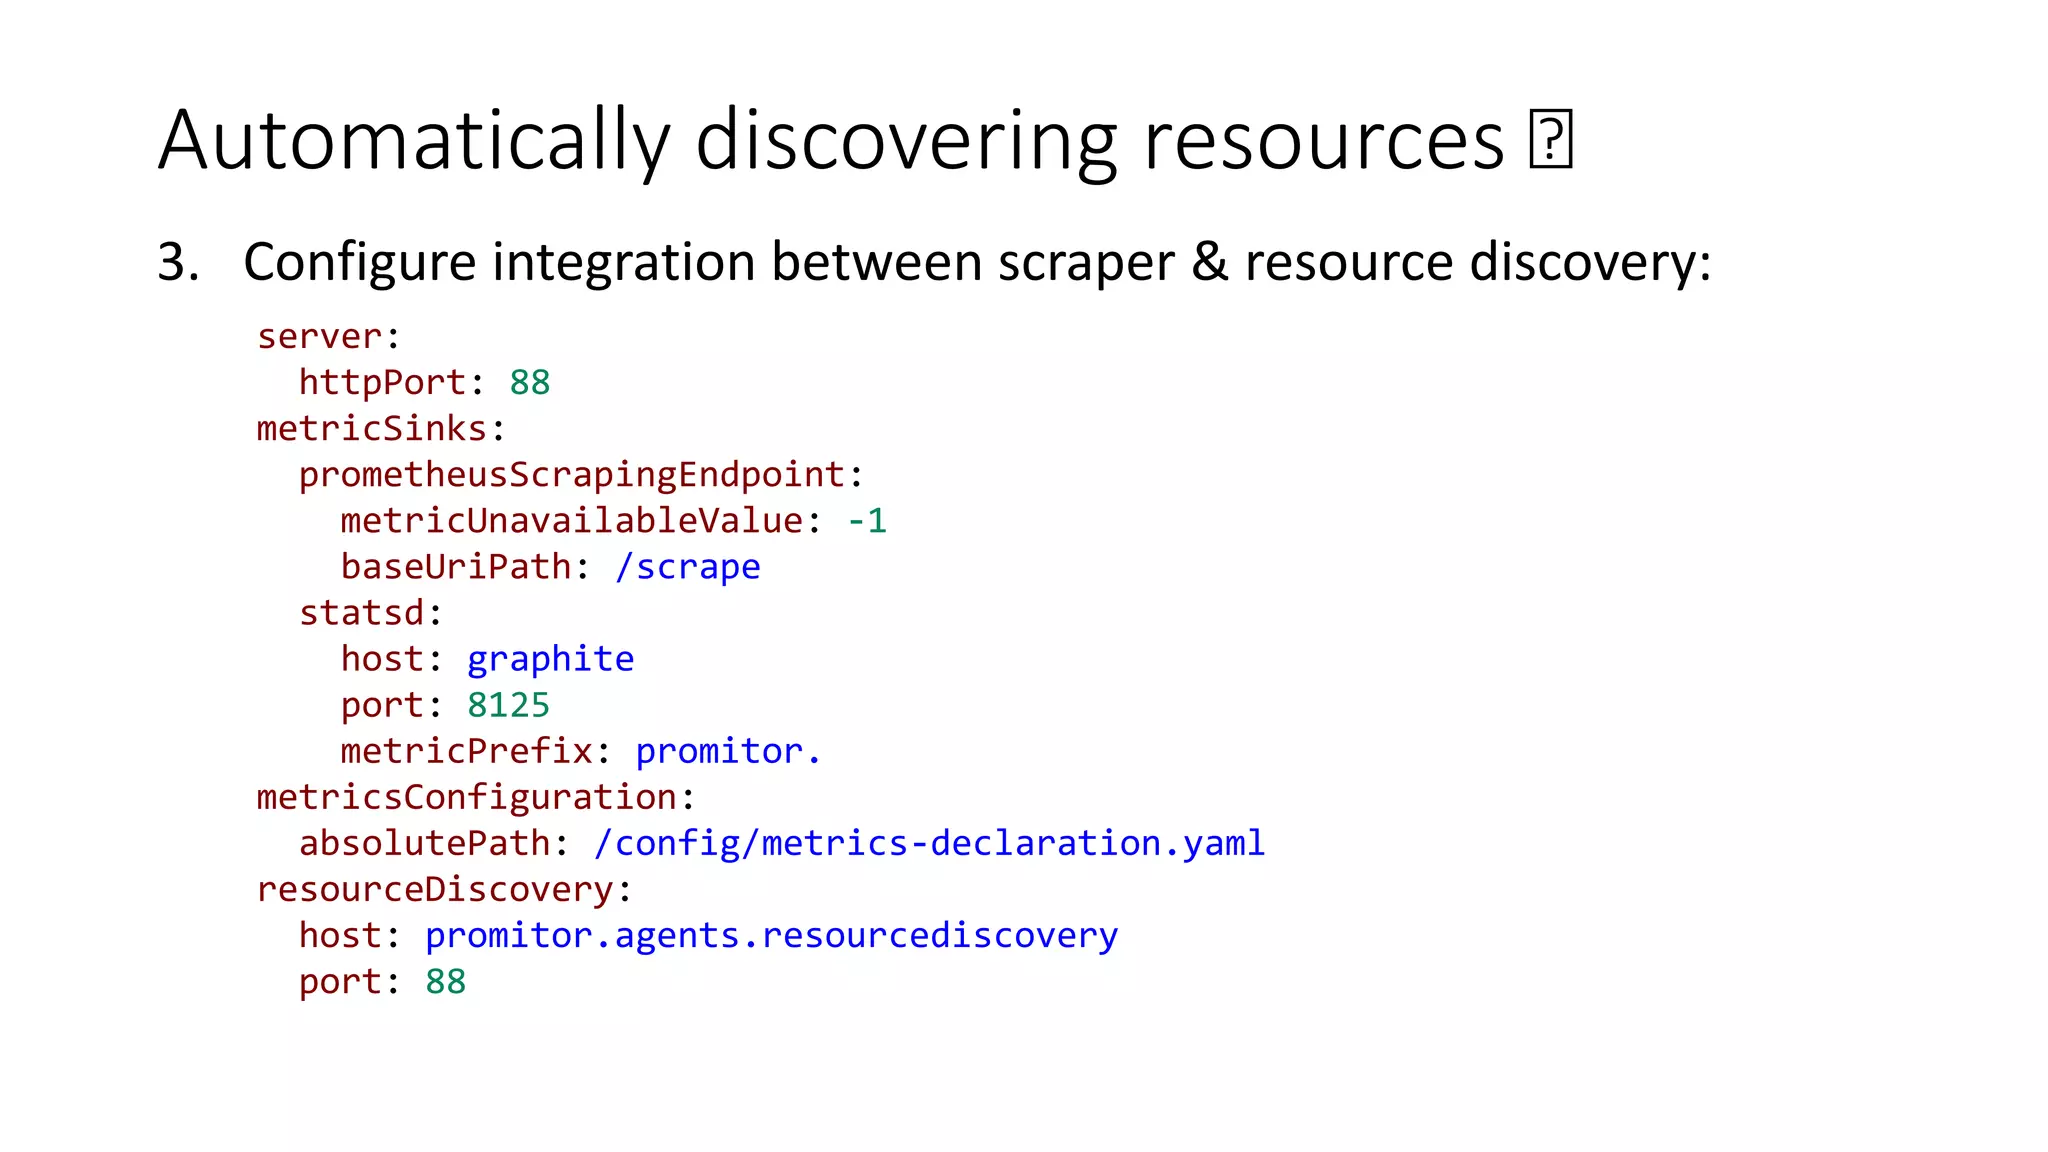
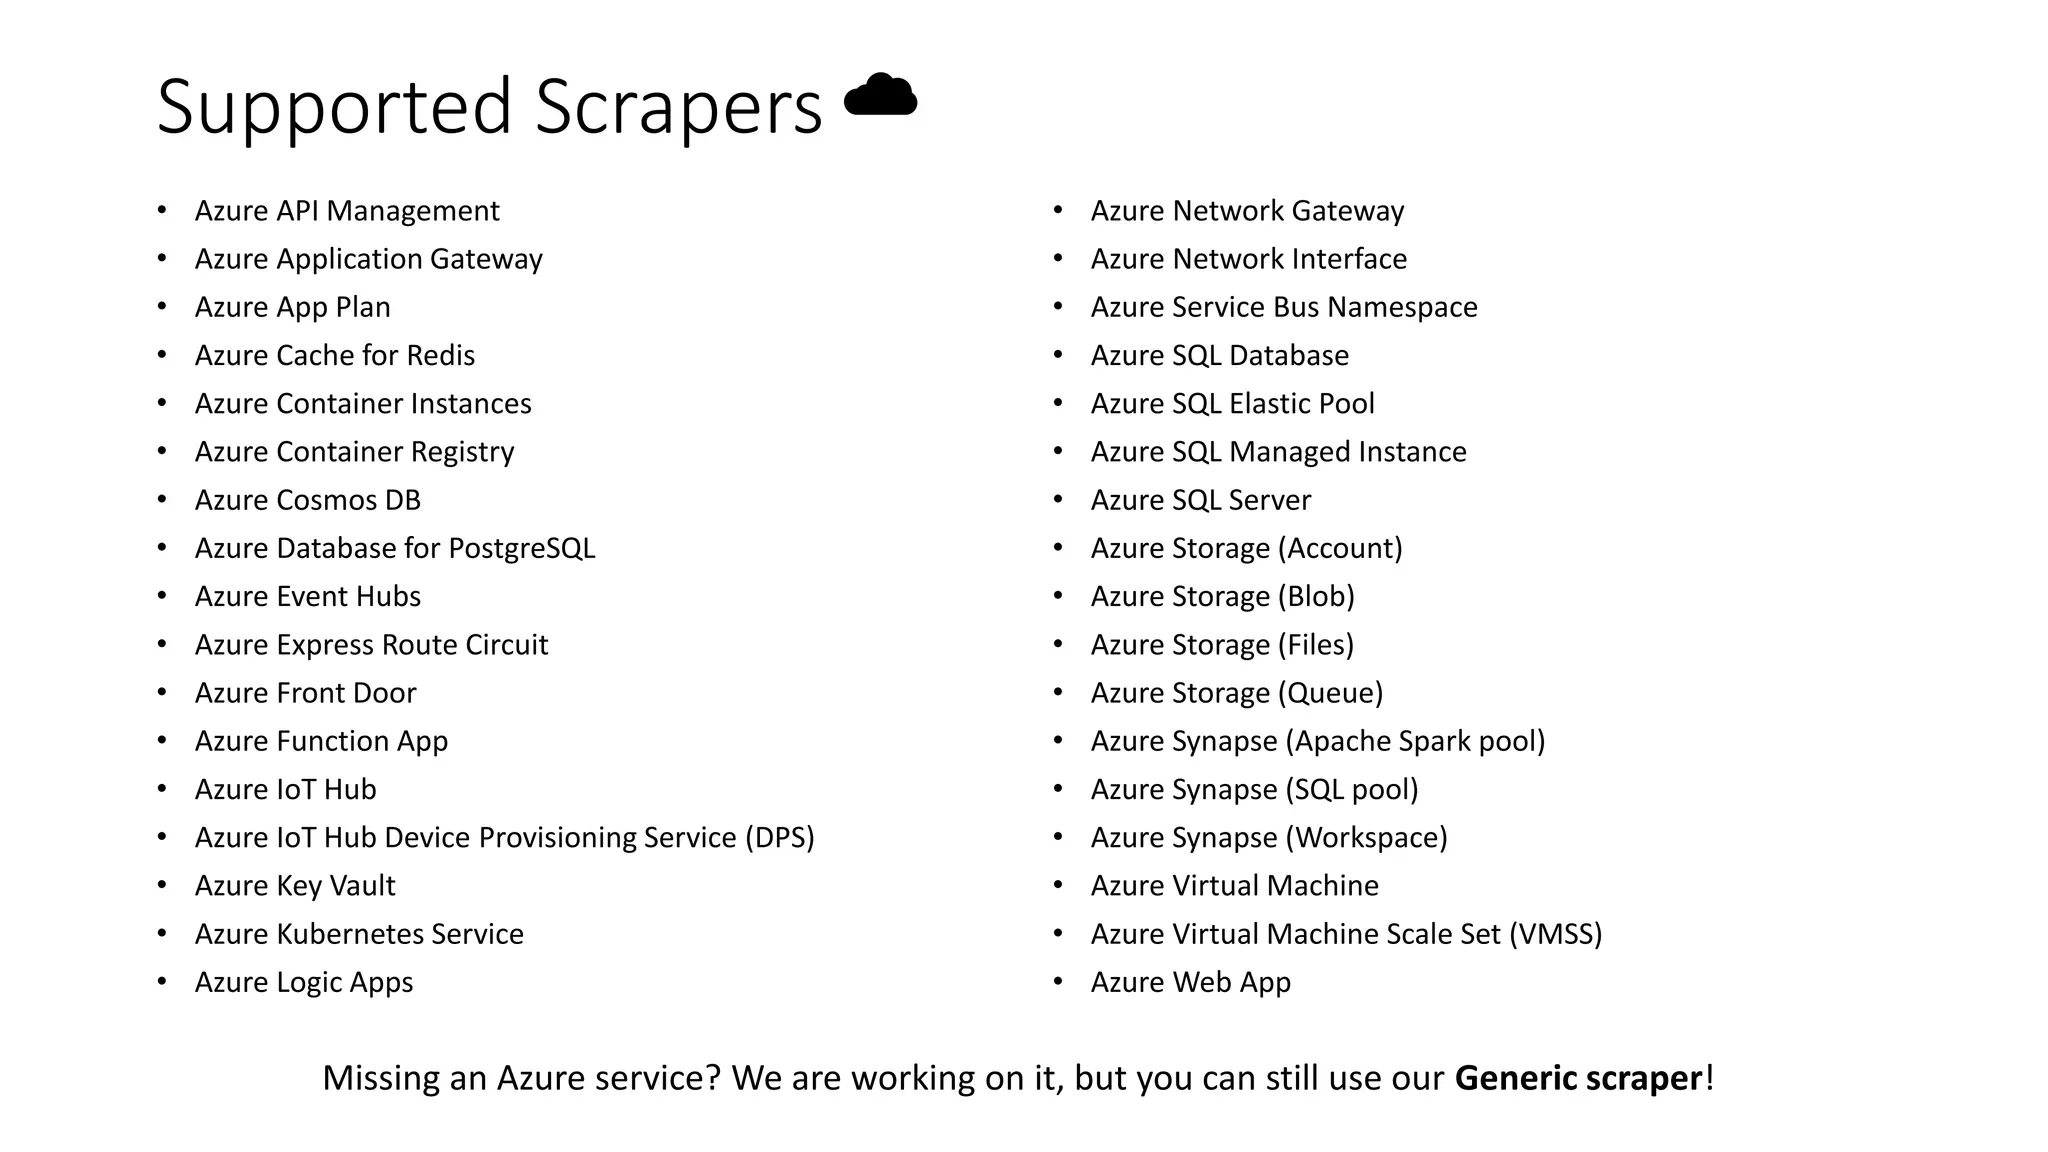
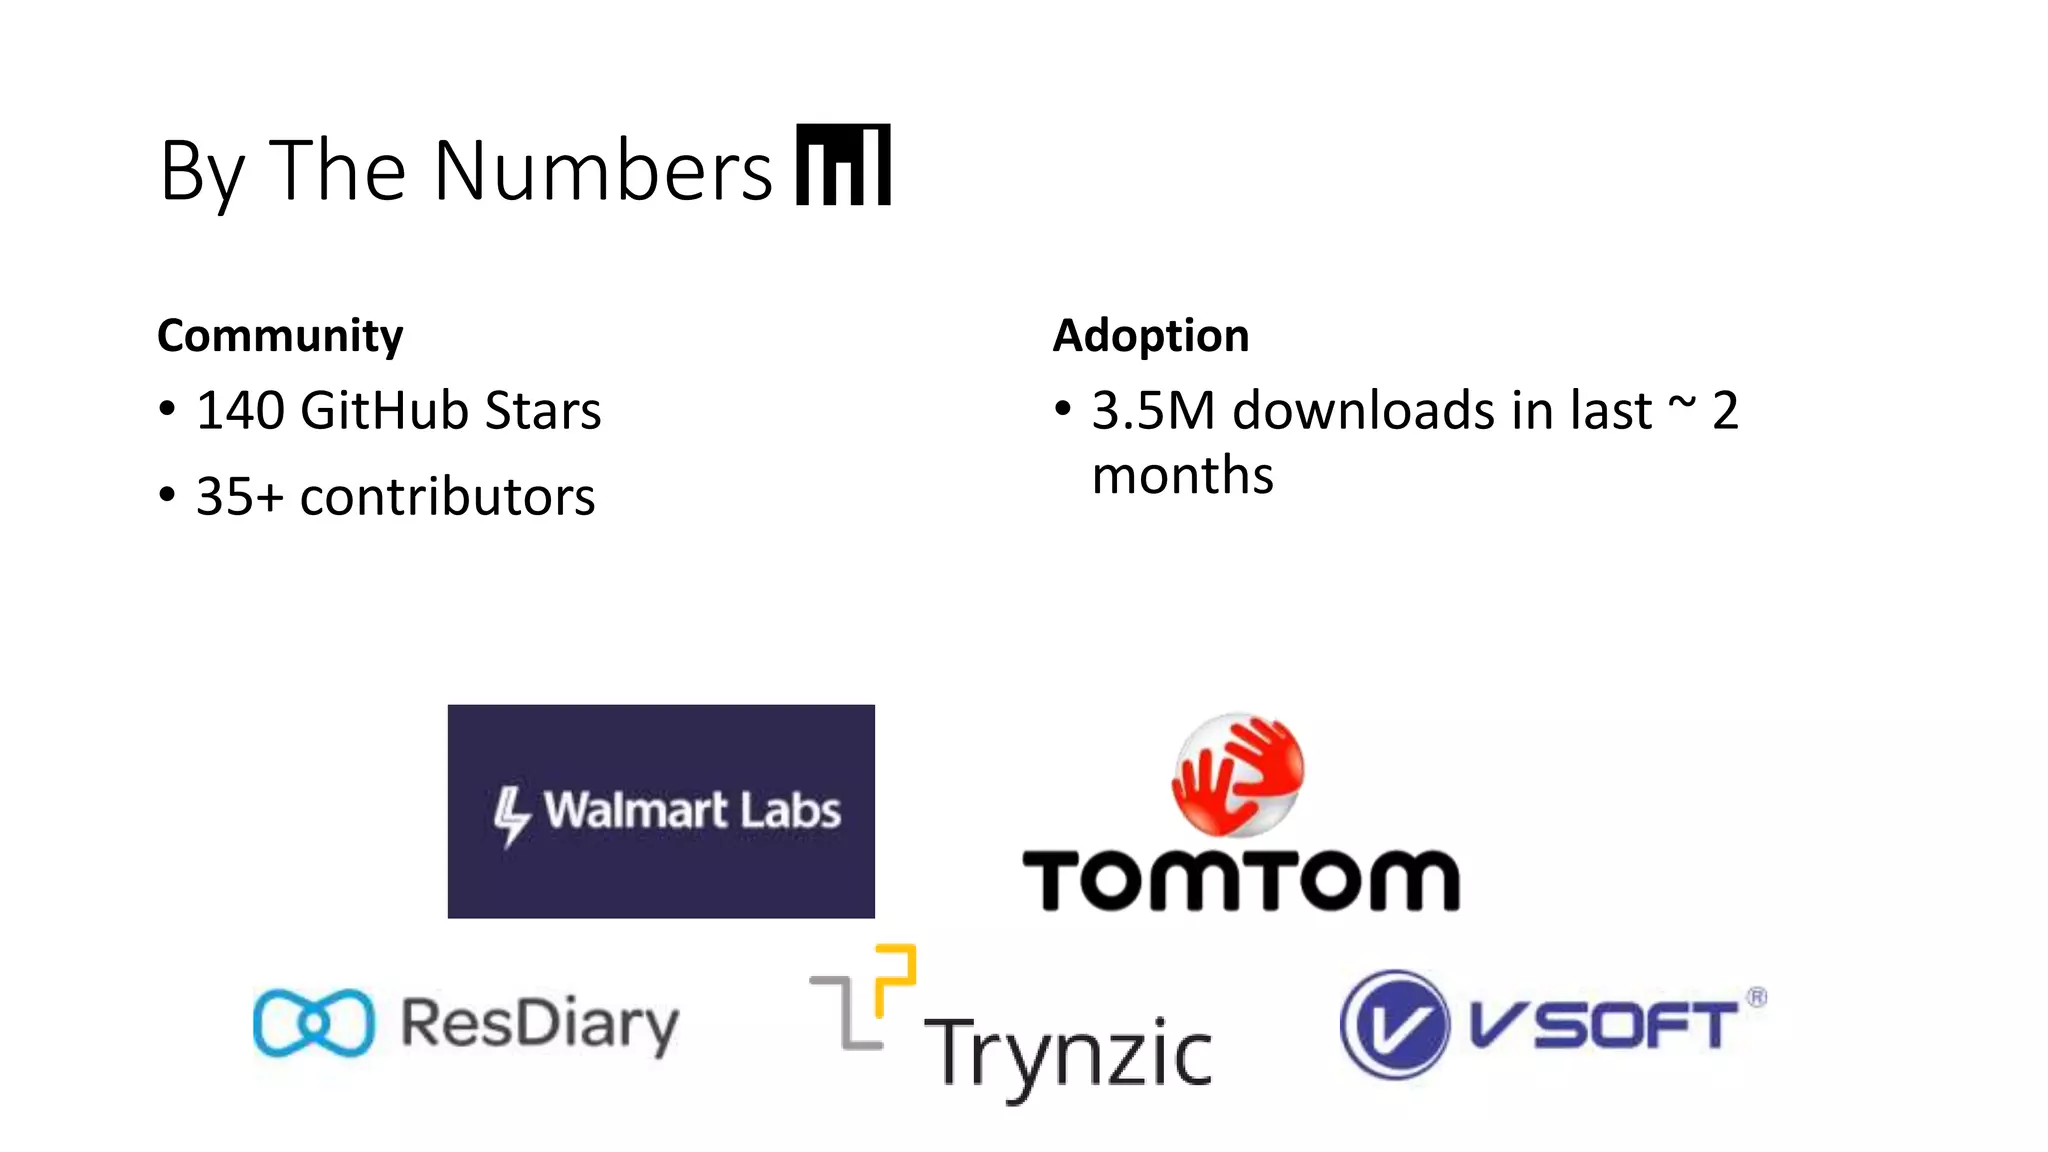
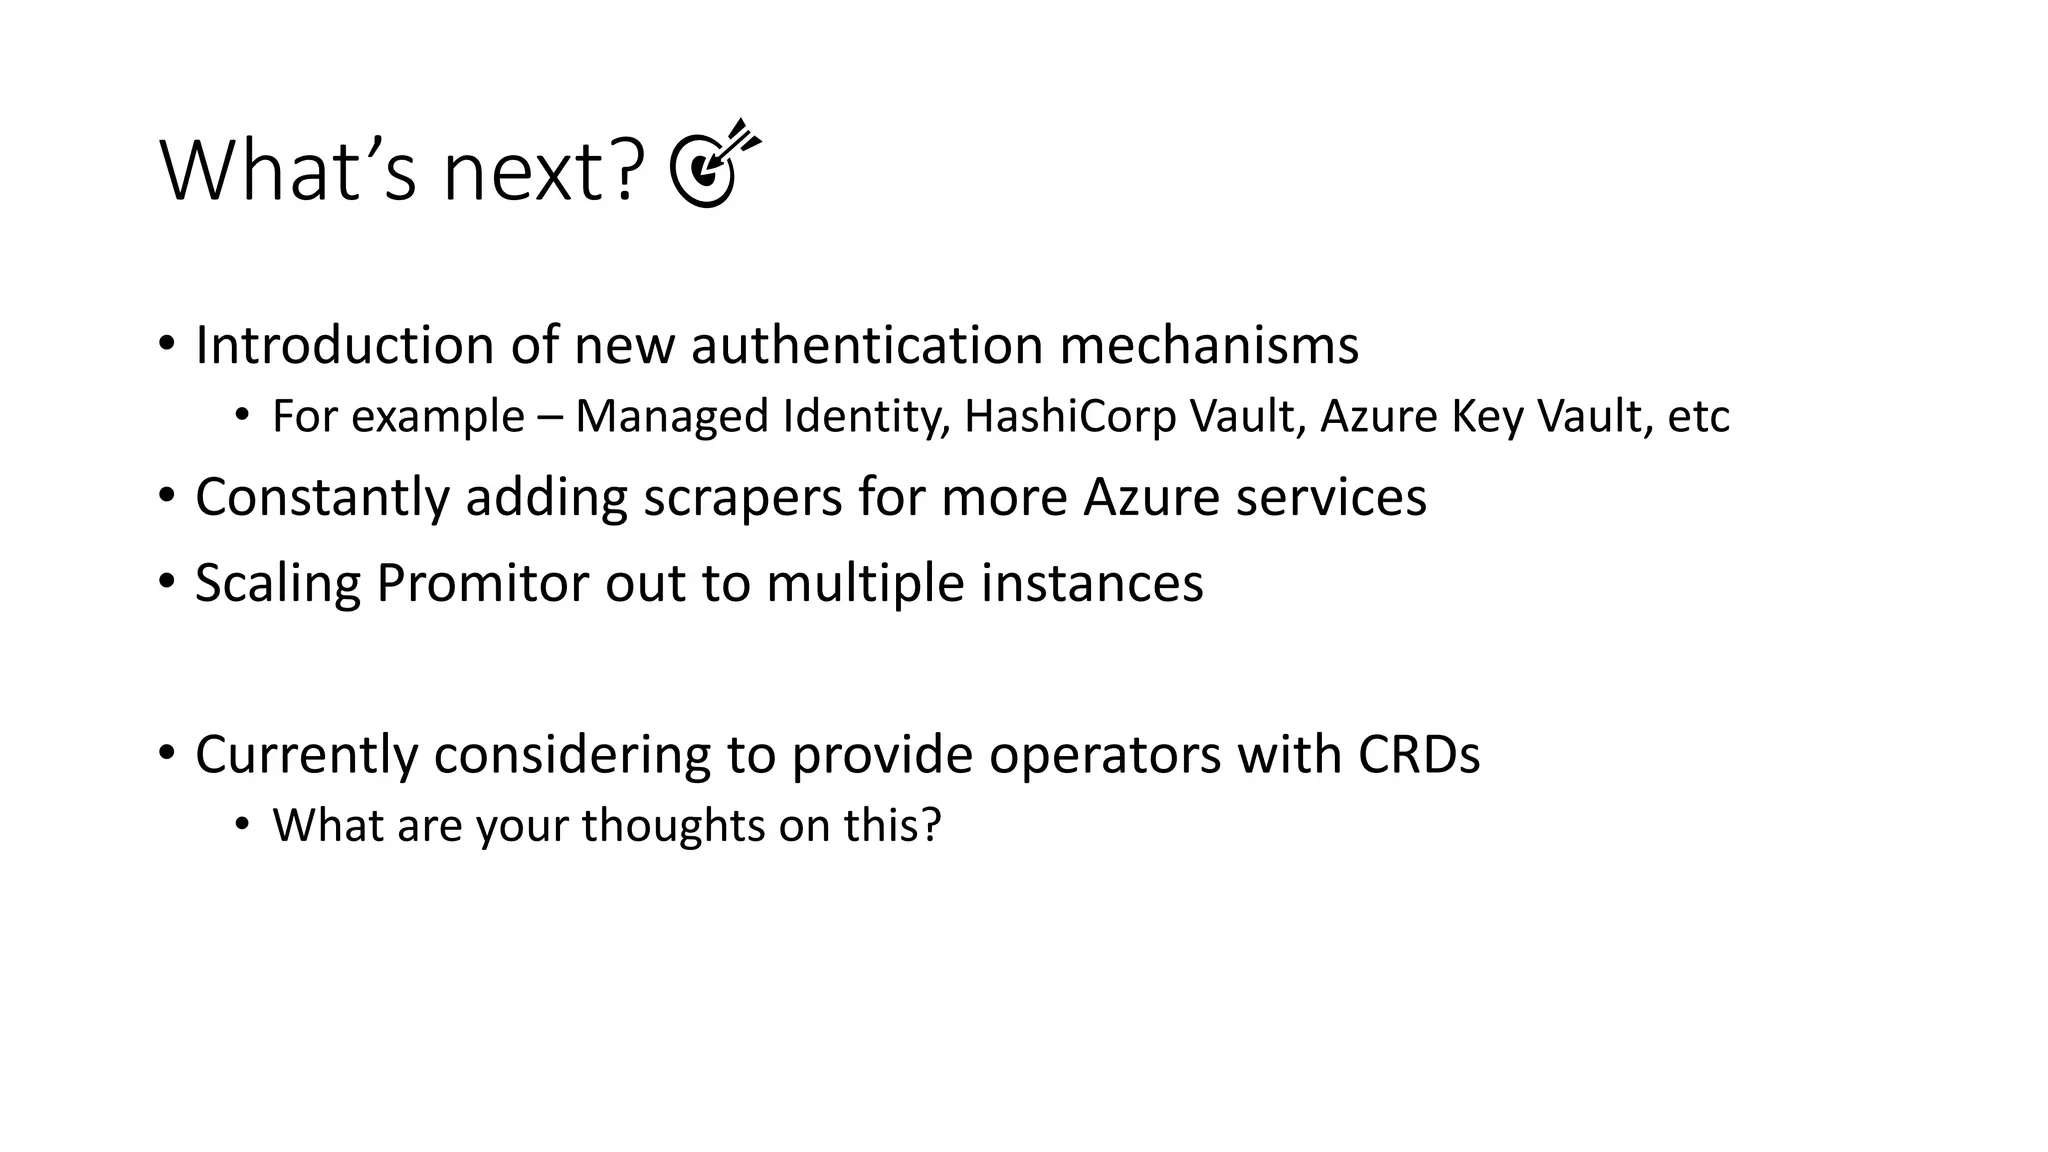

Promitor is an open source tool that scrapes metrics from Azure Monitor and other sources and makes them available to systems like Prometheus and Graphite. It works by declaring which metrics to collect from which Azure resources. It can also automatically discover resources using criteria like resource tags. The scraper agent queries Azure Monitor and resource discovery to collect metrics from both static and dynamic resources. Promitor supports scraping many Azure services and has over 140 stars on GitHub with growing adoption and downloads. Future plans include new authentication options and adding more Azure service scrapers.


![Coded Agents – with UiPath SDK + LangGraph [Virtual Hands-on Workshop]](https://cdn.slidesharecdn.com/ss_thumbnails/codedagentsdeck-251215155422-5497c599-thumbnail.jpg?width=640&height=640&fit=bounds)


