Download to read offline


![Creating and working with Arrays of
numbers
>> x=[4 5 6 ] % x is a row vector with three
elements
>> y=[1 2 3]
>> z=x+y % z=5 7 9
>> z=x-y %z= 3 3 3
>> j=[1;2;3] % x is a column vector with three
elements
>> z=x.*y % z= 4 10 18
>> z=x./y % z=4.0000 2.5000 2.0000
4](https://image.slidesharecdn.com/matlabbasicsworkshop-201023090548/85/Introduction-to-MATLAB-SIMULINK-4-320.jpg)

![Matrices & Vectors
% Create a random matrix 4X3
x=rand(4,3)
x(3:4,2:3) % get those elements of A that are
located in 3 to 4 and columns 2 to 3
x(:,4)=x(:,1) % Add a fourth column to x and set
it equal to the first column of x
x(2:4,2:4)=eye(3) % Replace the last 3X3
submatrix of x by a identity matrix
x([1 3],:)=[] % Delete the first and third rows of x
21](https://image.slidesharecdn.com/matlabbasicsworkshop-201023090548/85/Introduction-to-MATLAB-SIMULINK-21-320.jpg)


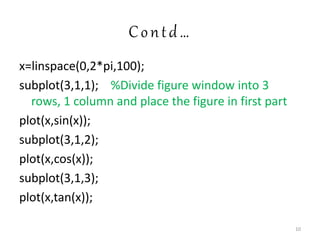
![Contd…
3. switch-case-otherwise
color=input(‘color=’,’s’);
switch color
case ‘red’
c=[1 0 0];
case ‘green’
c=[0 1 0];
case ‘blue’
c=[0 0 1];
otherwise
error(‘Invalid choice of color’)
end 27](https://image.slidesharecdn.com/matlabbasicsworkshop-201023090548/85/Introduction-to-MATLAB-SIMULINK-27-320.jpg)
![Linear Algebra
%Task: To solve a set of given linear algebraic
equations
5x-3y+2z=10
-3x+8y+4z=20
2x+4y-9z=9
>> A=[5 -3 2; -3 8 4; 2 4 -9];
>> b=[10; 20; 9];
>> x=Ab
>> c=A*x % 10.00 20.00 9.00
29](https://image.slidesharecdn.com/matlabbasicsworkshop-201023090548/85/Introduction-to-MATLAB-SIMULINK-29-320.jpg)
![Contd..
%Task: Compute roots of polynomials
x^5-3*x^3+x^2-9
>> c=[1 0 -3 1 -9];
>> roots(c)
30](https://image.slidesharecdn.com/matlabbasicsworkshop-201023090548/85/Introduction-to-MATLAB-SIMULINK-30-320.jpg)
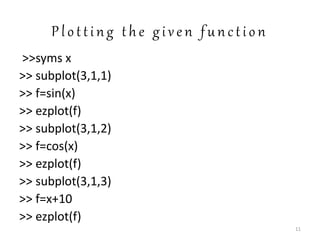
![B a s i c 2 - D p l o t s
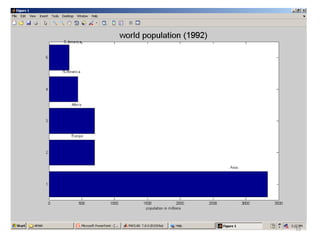
% World population by continents.
>>cont=char(‘Asia’,’Europe’,’Africa’,
’N.America’,’S.America’);
>>pop=[3332;696;694;437;307];
>>barh(pop) % Bar chart
>>for i=1:5
gtext(cont(i,:));
>>end
>>xlabel(‘population in millions’)
>>title(‘World poplation (1992)’,’fontsize’,18)
32](https://image.slidesharecdn.com/matlabbasicsworkshop-201023090548/85/Introduction-to-MATLAB-SIMULINK-32-320.jpg)
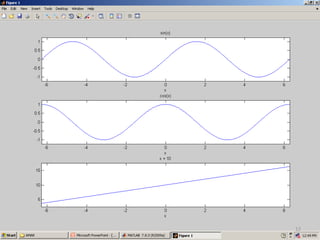
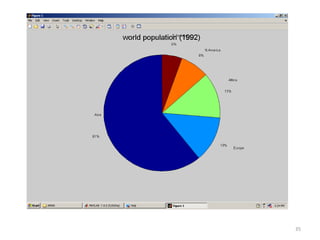
![Contd..
>>cont=char(‘Asia’,’Europe’,’Africa’,
’N.America’,’S.America’);
>>pop=[3332;696;694;437;307];
>>pie(pop) % Pie chart
>>for i=1:5
gtext(cont(i,:));
>>end
>>xlabel(‘population in millions’)
>>title(‘World poplation (1992)’,’fontsize’,18)
34](https://image.slidesharecdn.com/matlabbasicsworkshop-201023090548/85/Introduction-to-MATLAB-SIMULINK-34-320.jpg)
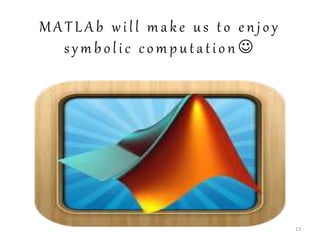
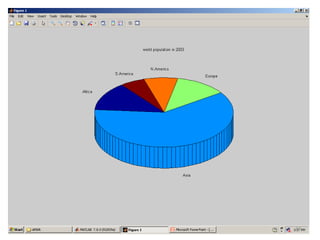
![CONTd..
>>pop=[807;3701;731;481;349];
>>continents={'Africa','Asia','Europe','N.America
','S.America'};
>> pie3(pop,continents)
>> title('world population in 2003')
36](https://image.slidesharecdn.com/matlabbasicsworkshop-201023090548/85/Introduction-to-MATLAB-SIMULINK-36-320.jpg)


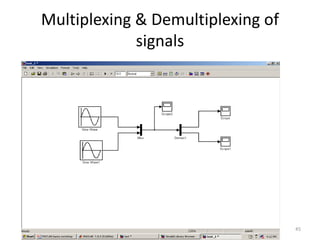
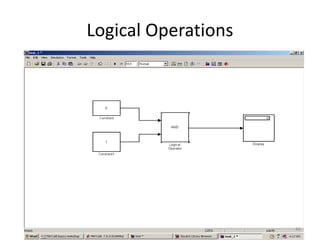
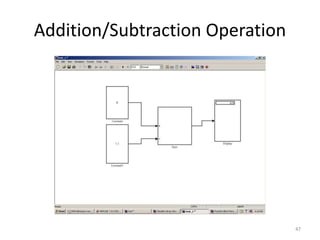
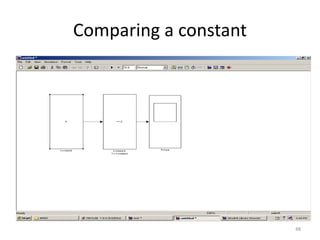
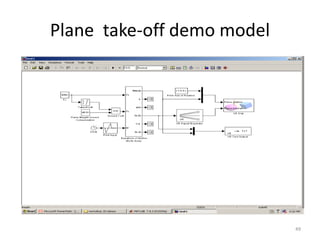
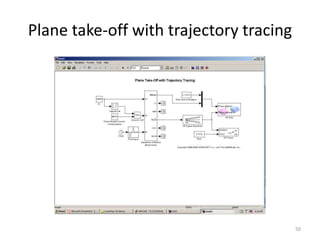


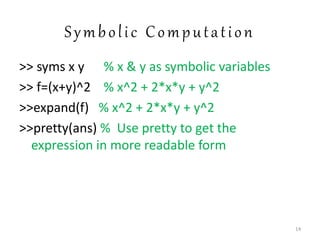
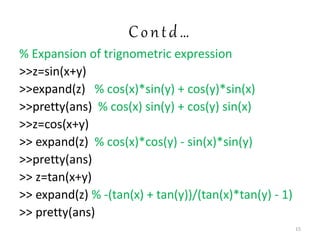
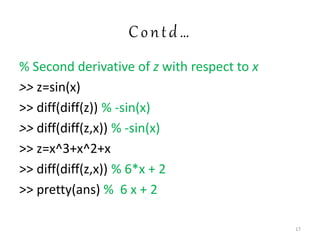
The document is an introductory presentation on MATLAB and Simulink, covering essential commands for creating arrays, plotting graphs, symbolic computation, and linear algebra operations. It includes examples such as plotting a circle, sine waves, and performing differentiation and integration. The document also touches on basic programming structures, data visualization techniques like bar and pie charts, and mentions practical applications like signal processing.