Download as PDF, PPTX
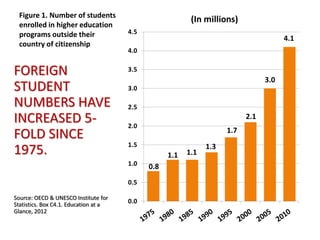


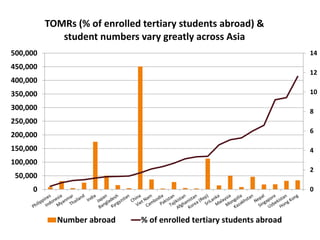


Globalization has led to a five-fold increase in the number of students enrolling in higher education programs outside their home country since 1975. While most international students currently come from Asia and study in North America, trends vary by world region. Factors like a country's economic development and domestic education capacity influence outbound student mobility rates and destination choices. As cross-border higher education expands, it could impact global patterns of student flows while offering opportunities for collaboration between education systems.