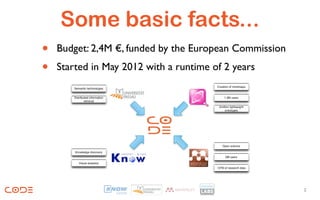
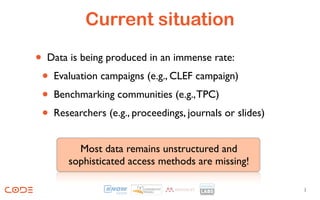
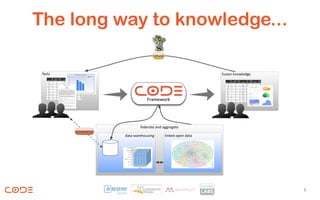
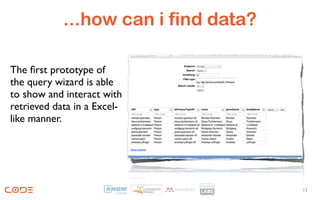
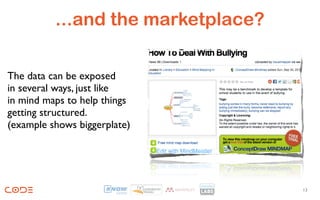
Big Data Benchmarking Community Call


                 CODE
Commercial Empowered Linked Open Data
       Ecosystem in Research

           presented by Florian Stegmaier
                University of Passau
                    2012-10-04
Some basic facts...
•   Budget: 2,4M €, funded by the European Commission
•   Started in May 2012 with a runtime of 2 years


                                                        2
Current situation

•    Data is being produced in an immense rate:
    • Evaluation campaigns (e.g., CLEF campaign)
    • Benchmarking communities (e.g., TPC)
    • Researchers (e.g., proceedings, journals or slides)
            Most data remains unstructured and
          sophisticated access methods are missing!

                                                            3
Why is this a problem?!
• From a data perspective...
  • ...what is the quality of data?
  • ...how to deal with missing values?
•  From a user perspective...
  • ...how can i compare this data? baseline?
  • ...are there contradicting facts?
    The semantics of documents must be unleashed
       to make them accessible and processible!
                                                   4
The long way to knowledge...


                               5
Step 1: Analyze data
• Analysis of documents has to find:
 • Structural elements (TOC, images, etc.)
 • Extract facts and numerical measures
 • Disambiguate facts (from „string“ to „object“)
• Automatic annotation is defective or not complete
 • Crowdsourced annotation of documents
 • Marketplace offers revenue for expert knowledge
                                                      6
Step 2: Lift and extend data
• Extracted and disambiguated data will be lifted into the
  Linked Data cloud
 • Interlink with already existent data of the cloud
 • Enrich data with provenance information (increase
     quality estimations)
 •   Perform OLAP queries on data cubes (e.g., time series)
         Enriched and aggregated data is exposed
                as Linked Data endpoint.
                                                              7
Step 3: Interact with data
• Query wizard will focus on:
 • Excel based interaction possibilities
 • On the fly creation of statistical analyses on a
     federated dataset
•   Marketplace encourages users to interact with data

Non-IT (but maybe domain) experts are able to create
  visual analytics as well as create new data cubes.


                                                         8
...does all this actually work?


Current analysis of PDFs
is able to discover basic
table of contents,
reading direction, as well
as specific objects.


                                       9
...how are the users involved?

One possible way to
engage users in
annotating data is the
Mendeley Desktop.
(early stage)


                                      10
...what about lifting data?

Basic triplification
chain established to
lift table based data
into a Semantic Web
compatible data
cube.


                                       11
...how can i find data?

The first prototype of
the query wizard is able
to show and interact with
retrieved data in a Excel-
like manner.


                                      12
...and the marketplace?

The data can be exposed
in several ways, just like
in mind maps to help things
getting structured.
(example shows biggerplate)


                                    13
Thank you for your
                          attention!        http://www.code-research.eu/
                                       https://www.facebook.com/CODEresearchEU
                                              #CODEresearchEU (Twitter)


Thanks to Michael Granitzer, Christin Seifert, Kai Schlegel and Sebastian Bayerl for supporting me with input, figures and slide templates and last but
not least our consortium for the prototype screenshots ;)

Introduction to the FP7 CODE project @ BDBC

  • 1.
    Big Data BenchmarkingCommunity Call CODE Commercial Empowered Linked Open Data Ecosystem in Research presented by Florian Stegmaier University of Passau 2012-10-04
  • 2.
    Some basic facts... • Budget: 2,4M €, funded by the European Commission • Started in May 2012 with a runtime of 2 years 2
  • 3.
    Current situation • Data is being produced in an immense rate: • Evaluation campaigns (e.g., CLEF campaign) • Benchmarking communities (e.g., TPC) • Researchers (e.g., proceedings, journals or slides) Most data remains unstructured and sophisticated access methods are missing! 3
  • 4.
    Why is thisa problem?! • From a data perspective... • ...what is the quality of data? • ...how to deal with missing values? • From a user perspective... • ...how can i compare this data? baseline? • ...are there contradicting facts? The semantics of documents must be unleashed to make them accessible and processible! 4
  • 5.
    The long wayto knowledge... 5
  • 6.
    Step 1: Analyzedata • Analysis of documents has to find: • Structural elements (TOC, images, etc.) • Extract facts and numerical measures • Disambiguate facts (from „string“ to „object“) • Automatic annotation is defective or not complete • Crowdsourced annotation of documents • Marketplace offers revenue for expert knowledge 6
  • 7.
    Step 2: Liftand extend data • Extracted and disambiguated data will be lifted into the Linked Data cloud • Interlink with already existent data of the cloud • Enrich data with provenance information (increase quality estimations) • Perform OLAP queries on data cubes (e.g., time series) Enriched and aggregated data is exposed as Linked Data endpoint. 7
  • 8.
    Step 3: Interactwith data • Query wizard will focus on: • Excel based interaction possibilities • On the fly creation of statistical analyses on a federated dataset • Marketplace encourages users to interact with data Non-IT (but maybe domain) experts are able to create visual analytics as well as create new data cubes. 8
  • 9.
    ...does all thisactually work? Current analysis of PDFs is able to discover basic table of contents, reading direction, as well as specific objects. 9
  • 10.
    ...how are theusers involved? One possible way to engage users in annotating data is the Mendeley Desktop. (early stage) 10
  • 11.
    ...what about liftingdata? Basic triplification chain established to lift table based data into a Semantic Web compatible data cube. 11
  • 12.
    ...how can ifind data? The first prototype of the query wizard is able to show and interact with retrieved data in a Excel- like manner. 12
  • 13.
    ...and the marketplace? Thedata can be exposed in several ways, just like in mind maps to help things getting structured. (example shows biggerplate) 13
  • 14.
    Thank you foryour attention! http://www.code-research.eu/ https://www.facebook.com/CODEresearchEU #CODEresearchEU (Twitter) Thanks to Michael Granitzer, Christin Seifert, Kai Schlegel and Sebastian Bayerl for supporting me with input, figures and slide templates and last but not least our consortium for the prototype screenshots ;)