This document summarizes a study that integrated solar photovoltaic distributed generators into an IEEE 33-bus radial distribution network based on the site's solar capacity factor. The study used a particle swarm optimization approach to determine optimal placement and sizing of solar PV units to minimize power losses and improve voltage profiles. Load flow analysis using the backward-forward sweep method was performed to analyze the effects on real and reactive power losses and bus voltages. Results were compared to other approaches in literature and showed the capacity factor-based approach provided benefits like reduced losses and improved voltages.
![Citation: Adeagbo, A.P.; Ariyo, F.K.;
Makinde, K.A.; Salimon, S.A.;
Adewuyi, O.B.; Akinde, O.K.
Integration of Solar Photovoltaic
Distributed Generators in
Distribution Networks Based on
Site’s Condition. Solar 2022, 2, 52–63.
https://doi.org/10.3390/
solar2010004
Academic Editor: Jürgen Heinz
Werner
Received: 11 December 2021
Accepted: 21 February 2022
Published: 24 February 2022
Publisher’s Note: MDPI stays neutral
with regard to jurisdictional claims in
published maps and institutional affil-
iations.
Copyright: © 2022 by the authors.
Licensee MDPI, Basel, Switzerland.
This article is an open access article
distributed under the terms and
conditions of the Creative Commons
Attribution (CC BY) license (https://
creativecommons.org/licenses/by/
4.0/).
Article
Integration of Solar Photovoltaic Distributed Generators in
Distribution Networks Based on Site’s Condition
Ayooluwa Peter Adeagbo 1 , Funso Kehinde Ariyo 2 , Kehinde Adeleye Makinde 3,* ,
Sunday Adeleke Salimon 4 , Oludamilare Bode Adewuyi 5,* and Olusola Kunle Akinde 5
1 Department of Electrical and Electronic Engineering, Adeleke University, Ede 232101, Nigeria;
ayooluwaadeagbo@yahoo.com
2 Department of Electronic and Electrical Engineering, Obafemi Awolowo University, Ile-Ife 220282, Nigeria;
funsoariyo@yahoo.com
3 School of Computing, Engineering and Digital Technologies, Teesside University,
Middlesbrough TS1 3BX, UK
4 Department of Electrical and Electronic Engineering, Ladoke Akintola University of Technology,
Ogbomoso 210214, Nigeria; sunnydexs.sa@gmail.com
5 Department of Electrical and Electronic Engineering, First Technical University, Ibadan 200255, Nigeria;
olusola.akinde@tech-u.edu.ng
* Correspondence: kehindemakinde2003@yahoo.com (K.A.M.); adewuyiobode@gmail.com (O.B.A.)
Abstract: The significance of Distributed Generators (DGs) in the technical and economic operations
of electric power distribution systems cannot be overemphasized in recent times. This is essential
as a result of the incessant increase in electrical energy demand, which is becoming considerably
difficult to meet with the conventional means of energy supply. Thus, DGs offer better alternatives
for providing a quality supply of energy near the site of consumption. This type of energy supply is
cleaner and cheaper most of the time due to the lessened transmission losses, which consequently
reduced the cost of operation at the transmission and distribution levels of the power system. In this
work, an approach for placement and sizing of solar PV DGs into radial distribution networks (RDN)
based on the solar PV capacity factor of the site was analyzed using particle swarm optimization. The
aim of this study is to analyze the effect of the approach on the real and reactive power losses within
the network as well as the bus voltage profile. Constraints on credible system operation parameters,
which includes bus voltage limits, power balance, and power flow limits, are considered in the
formulation of the optimization problem. In order to verify the viability of the deployed approach,
steady-state performance analyses were executed on IEEE 33-bus RDN; and the results obtained were
compared with the results from other approaches reported in the literature.
Keywords: capacity factor; distributed generation; particle swarm optimization; power loss mini-
mization; voltage profile improvement
1. Introduction
In the early times, centralized generation was the only means for the provision of
electricity, which involves using conventional generators for the production of electricity.
However, in recent times, the modernization of power system structure is highly essential
due to the increase in electrical energy demand, and this has necessitated the need to
move from centralized generation to decentralized generation. The decentralized gen-
eration consists of using small power-generating units either in the form of renewable
or non-renewable energy sources installed and integrated into the power system at the
distribution end very close to the local users [1]. The distribution network is usually radial
in structure in its operational simplicity [2]. Thus, in recent years, the distribution networks
(DN) have witnessed a rapid integration of distributed generators (DGs) as a result of the
advances being made in renewable energy technologies. There has also been an increase
in government drives to reduce carbon emission, achieve energy sustainability, enhance
Solar 2022, 2, 52–63. https://doi.org/10.3390/solar2010004 https://www.mdpi.com/journal/solar](https://image.slidesharecdn.com/integrationofsolarphotovoltaicdistributedgeneratorsin-230123105512-dcc97fc0/75/Integration-of-Solar-Photovoltaic-Distributed-Generators-in-pdf-1-2048.jpg)
![Solar 2022, 2 53
energy autonomy as well as the need to increase energy security in line with the United
Nation’s sustainable development goal agenda [3]; and this can be achieved by DG inte-
gration. Some of the network support benefits that can be achieved from DG integration
include: avoidance or reduction of transmission and distribution costs, reduction of real
power losses, and provision of backup power in the advent of outages from the utility and
overall improvement of network reliability [4]. However, the benefits are only realizable
through appropriate placement and sizing of DG in distribution networks. Furthermore,
improper placement of DG in distribution networks can result in issues such as increased
power losses, voltage rise problems, and reduced power qualities, among others. About
30% of the total power losses in electric power systems are incurred in the transmission
and sub-transmission networks while the remaining 70% takes place in the distribution
networks [5].
Moreover, the losses in the distribution networks directly influence the operational
cost of the system and can also lead to a poor voltage profile, especially in the condition
of high load. Thus, the conventional methods to reduce losses have focused on network
reconfiguration [6] and reactive power support through capacitor placement [7]. Several
kinds of research have shown that the optimal placement and sizing of DG at carefully
identified buses can effectively minimize the system power losses [8]. Most of the con-
ventional distribution networks are passive but become active when DG units that are
capable of supplying electrical power to the national grid are added to the system, bring-
ing about bidirectional flows of power in the network. Hence, in order to avoid reverse
power flow, which can be harmful to the operation of power systems, especially at the
distribution network, energy storage facilities can be included [9]. Explicitly, some of the
issues related to the conventional distribution system that can be solved by DG integration
include technical, economic, and environmental issues [10]. The key goal of power system
distribution planning is to plan the distribution system in a way that it can meet demand
growth in a cost-effective but safe and reliable manner. The renewable DG technologies
produce minimal or no emissions compared with non-inexhaustible DG technologies, but
the extensive adoption of renewable DG technology could be limited by specific mandatory
power systems’ technical and economical operational limits and constraints [11].
Solar PV is one of the widely deployed DGs, and this is due to its numerous advan-
tages, which includes abundant availability of primary energy from sun, easy installation
and setup, sufficient technologies for deployment for both industrial and domestic pur-
poses, minimum maintenance requirements and readily available personnel and resources
with much needed technical know-how on solar PV technologies [12]. However, the solar
PV technology, like other weather-dependent DG technologies, suffers from the prob-
lem of output uncertainties, which can cause both technical and economic issues if not
properly planned and designed. In the present unbundling rules, due to power industry
deregulation, the planning of DG location and sizes can be effectively carried out by DG
owners/investors and not by power system operators. There might also be issues about
selecting optimal location due to the availability of primary sources of energy such as
wind or solar or availability of a sufficient piece of land and other factors. However, by
providing the right information and incentives, power system operators can influence the
DG owners/investors’ decisions in selecting locations that give credible techno-economic
benefits [13].
Hence, the purpose of optimal DG placement is to provide the best sites and sizes
of DG units for an overall improvement in network performance in terms of improved
reliability, minimal active power losses, improved voltage profile, reduced cost of operation,
ensuring environmental sustainability, etc. In this paper, photovoltaic (PV) is integrated
into standard IEEE 33 Bus RDN using the capacity factor of the site for determining the
safe level for real power injection by monitoring important steady-state performance of the
distribution system. Since PV can also inject reactive power into the system in accordance
with the current drawn and grid codes through the inverter, the distribution system
performance on the real and reactive power losses as well as the bus voltage was analyzed](https://image.slidesharecdn.com/integrationofsolarphotovoltaicdistributedgeneratorsin-230123105512-dcc97fc0/75/Integration-of-Solar-Photovoltaic-Distributed-Generators-in-pdf-2-2048.jpg)
![Solar 2022, 2 54
and compared with similar works of literature. The remaining sections of this paper are
organized as follows: credible information of relevant concepts on optimal integration of
distributed generators is discussed under Section 2, and the adopted mathematical and
optimization models and methods are described under Section 3. The simulation results
are discussed in Section 4, and the report is concluded in Section 5.
2. Review of Relevant Concepts on Optimal Integration of Distributed Generators
On the basis of real and reactive power generation ability, distributed generator units
are categorized into four types [14]: Type 1 DGs such as solar PV systems, microturbines that
deliver only active power P—this type of DG unit ensures MWh profitability for distribution
network operators (DNOs) but may lack voltage support capability, especially if the DN
is not able to supply the necessary reactive power. Type 2 DGs include synchronous
generators and a voltage source inverter (VSI) based PV array, which delivers both active
power P and reactive power Q. Type 3 DGs include synchronous compensators, static
capacitors etc., which delivers only reactive power Q. Type 4 DGs, such as wind turbines
with induction generators, require reactive power for the magnetization of the rotor circuit
and therefore consume reactive power but deliver active power. Depending on the inherent
capacity of the type of DG to be integrated to the grid, especially at the distribution side,
the DG can be modeled as either a PV or PQ bus. Due to the capacity of DGs which are
normally of smaller size compared to the traditional power sources, the constant PQ model
is usually adequate for the distribution system load flow analysis [15].
Quite a number of optimization tools have been presented in the literature for deter-
mining the optimal location and sizing of DG in the distribution network for improved net-
work performance; these can be broadly divided into analytical, numerical, meta-heuristic,
and hybrids of any of these methods. The analytical methods are gaining the interest of
researchers owing to their straightforwardness, accuracy and the fact that the analytical
techniques require less computational time since it does not involve many iterations [16].
The major drawback of this method is that it is not efficient for solving large and complex
systems with a large number of state variables. The numerical approaches are easy to
implement, efficient in computation and the objectives are met on time. However, the
application of this technique is limited to linear systems, failure to meet the global optimal
and is not effective for a high amount of load flow computation [17].
The metaheuristic methods are also known as evolutionary algorithms, and they
are based on the implementation of artificial intelligence (AI) techniques such as Genetic
algorithm (GA), Particle Swarm Optimization (PSO), Tabu Search (TS), etc. Their relative
advantages such as computational robustness, ability to explore a large space for global
optimal solution and high efficiency for solving multi-objective problems makes them the
frequently adopted tool for optimal solution of DG planning problems in recent time. These
algorithms are employed for multiple DG placements and single and varying power load
models. However, they can also fail to give definite and completely accurate results if the
parameters are not properly tuned [18]. Due to the nature of the design variables in this
study, which entails a discrete nature on one hand (DG site identification) and continuous
nature on the other hand (PV DG size optimization including the time-dependent site’s
irradiance), the particle swam optimization approach was deployed for optimal sizing
alongside the loss sensitivity index approach [19] for suitable site (bus) identification.
3. Models and Methods
Unlike in the transmission systems, the characteristics of the conductors deployed in
distribution systems such as high resistance to reactance ratio and a radial form with many
nodes, branches, DGs, and complex configuration are not favorable to be addressed using
the conventional iterative approaches [20,21]. A backward-forward sweep is an efficient
approach mainly developed for load flow solutions in RDN. It has the benefits of great
computational performance, ease of implementation, stable convergence and low memory](https://image.slidesharecdn.com/integrationofsolarphotovoltaicdistributedgeneratorsin-230123105512-dcc97fc0/75/Integration-of-Solar-Photovoltaic-Distributed-Generators-in-pdf-3-2048.jpg)
![Solar 2022, 2 55
usage [22,23]. As a result, the load flow solution is executed using the Backward-Forward
Sweep technique in this study.
3.1. Backward/Forward Sweep Load Flow for a Radial Distribution System
This work takes into consideration the inherent characteristics of the radial network as
analyzed using the backward/forward sweep (BFS) load flow algorithm [24]. Considering
a simple radial distribution network (RDN) of Figure 1, the real and reactive power flows
and losses are as expressed by Equations (1)–(4) [20,25].
Figure 1. Single line diagram of a radial distribution network [19].
Pi = P
0
i+1 + rik
(P
02
i+1 + Q
02
i+1)
V
02
i+1
, (1)
Qi = Q
0
i+1 + xik
(P
02
i+1 + Q
02
i+1)
V
02
i+1
, (2)
Equations (1) and (2) represent the active and reactive powers (Pi and Qi) flowing
through the branch ‘j’ from node ‘i’ to ‘i+1’ calculated backwards.
The real and reactive power losses of branch ‘j’ are calculated using Equations (3)
and (4) as follows:
Plossj = rik
(P2
i + Q2
i )
V2
i
, (3)
Qlossj = xik
(P2
i + Q2
i )
V2
i
, (4)
The above equations represent the active and reactive power losses along the branch
‘j’ (Plossj and Qlossj) from node ‘i’ to ‘i + 1’ using the backward calculation. Vi is the voltage
at node ‘i’, rik and xik are the resistance and reactance of the branch ‘j’ between any two
nodes ‘i’ and ‘k’. The total real and reactive losses in the RDN are thus calculated as:
PTloss =
Nbr.
∑
j=1
Plossj
(5)
QTloss =
Nbr.
∑
j=1
Qlossj
(6)
where Nbr. is the total number of branches. The superiority of this load flow analysis
method is such that, regardless of the original network topology, the distribution network
is first converted to a radial network. In addition, a node and branch-oriented approach is
incorporated using an efficient numbering scheme to enhance the numerical performance
of the solution method as described with details in [21].](https://image.slidesharecdn.com/integrationofsolarphotovoltaicdistributedgeneratorsin-230123105512-dcc97fc0/75/Integration-of-Solar-Photovoltaic-Distributed-Generators-in-pdf-4-2048.jpg)
![Solar 2022, 2 56
3.2. Solar PV Modelling and DG Injection Approach
The DG model deployed in this work is the Solar Photovoltaic model The PV output
at any instantaneous time (t) is modeled considering the effect of the time-varying solar
irradiance in the solar PV DG sizing. The capacity factor approach is deployed to obtain an
estimate of the net power injectable from the solar PV DGs, and the output power of the
PV system at a time, t, which is a function of the size/rated power of the DG, is calculated
accordingly [26]:
Ppv(t) =
Ppvrated
G2
t
GstdRc
for 0 ≤ Gt ≤ Rc
Ppvrated
Gt
Gstd
for Gt Rc.
(7)
where Ppv(t) is the power generated by the photovoltaic panel at any time instance, which
is calculated on an hourly average. Ppvrated is the rated capacity of the chosen PV panel, Gt
is the instantaneous solar radiation, Gstd is standard irradiance (1000 Wm−2) and Rc is the
radiation threshold/setpoint (150 Wm−2).
The capacity factor is introduced in this work to measure the performance of the PV
system. By definition, the capacity factor of a solar PV facility is a measure of the energy
production efficiency of that facility over a period of time, usually a year, based on the solar
resource potential of the site. Since the power flow analysis is often calculated as per hour
simulation of the steady-state condition of the power system, the maximum available a.c.
power injection into the RDN from the solar PV DG units in per hour equivalent can be
obtained as a function of the site’s capacity factor (C fpv) and inverter’s efficiency (ηinv.) as
described [27]:
PPV = Npv × Ppv × C fpv (8)
where the capacity factor is calculated as:
C fpv =
∑8760
t=1 Ppv(t)
Ppvrated × 8760
(9)
The capacity factor of a good site with sufficient solar potential is considered to be
20% and above [28], where C fpv is the capacity factor, Npv is the conversion efficiency or
derating factor and PPV is the size of the DG that will be integrated into the system. The
inverter efficiency ηinv. is obtained as:
ηinv. =
PAC
PPV
× 100% (10)
where PAC is the output of the inverter. The resultant (effective) active and reactive loads
after the injection of DG power at the selected buses are obtained as:
PDe f f,i = PDi − ηinv.PPV; (11)
QDe f f,i = QDi − Qinv. (12)
where PDi and QDi are the active and reactive load demands at bus i without DG, and Qinv.
is the reactive power from the inverter output.
3.3. Problem Formulation and DG Modelling
The active power and reactive power losses and the voltage at each node in the RDN
are evaluated using a Backward-Forward Sweep Approach. The considered objective
function is the minimization of the active and reactive power losses in the RDN as defined
below:
minimize F = ω1 × PTloss + ω2 × QTloss; ω1 + ω2 = 1. (13)](https://image.slidesharecdn.com/integrationofsolarphotovoltaicdistributedgeneratorsin-230123105512-dcc97fc0/75/Integration-of-Solar-Photovoltaic-Distributed-Generators-in-pdf-5-2048.jpg)
![Solar 2022, 2 57
The constraints considered are:
• Power balance constraint:
Nbus
∑
i=1
PDGi =
Nbus
∑
i=1
PDe f f,i + PTloss;
Nbus
∑
i=1
QDGi =
Nbus
∑
i=1
QDe f f,i + QTloss; ∀i ∈ Nbus (14)
• Voltage magnitude limit:
|Vi|min
≤ |Vi| ≤ |Vi|max
; ∀i ∈ Nbus (15)
• Current limit constraint:
0 ≤ Ij ≤ Imax
j ; ∀j ∈ Nbr. (16)
• DG Capacity Limit:
Pmin
DGi ≤ PDGi ≤ Pmax
DGi ; Qmin
DGi ≤ QDGi ≤ Qmax
DGi; ∀i ∈ NDG. (17)
where Nbr. is the total number of lines/branches, Nbus is the number of buses/nodes, NDG
is the number of DG injection nodes, PDGi and QDGi signify active (true) and reactive power
available at bus i due to the location of DG, PDi and QDi signify the active and reactive
power demand at bus i, Vmin
i and Vmax
i are the lowest and highest voltage limits of the
system and Imax
j is the maximum allowable current in the network branch. The voltage
magnitude limit is set to 0.90 pu and 1.00 pu [29].
3.4. Evolutionary Optimization Algorithm
Particle swarm optimization (PSO) is adopted in this research because it has been
found as an effective method for solving diverse complex nonlinear optimization
problems [30,31]. The modification of the particle’s velocity is considered as shown below:
Vk+1
i = w · Vk
i + c1 · r1 · (Pbestk
i − Xk
i ) + c2 · r2 · (Gbestk
− Xk
i ) (18)
The velocity is the factor for updating the particle’s position as obtained below:
Xk+1
i = Xk
i + Vk+1
i (19)
where w is the weighting function, c1 and c2 are the acceleration coefficients, r1 and r2
are random numbers between 0 and 1, Vk
i and Xk
i are the current velocity and position of
particle i at iteration k, Vk+1
i and Xk+1
i are the modified velocity and position of particle
i and Pk
besti and Gk
besti are the personal and global bests of particle i. The dynamically
changing inertia weight or weighting factor is employed because it guides the exploration
and utilization of the search space, and it is expressed as [32]:
w = wmax −
wmax − wmin
maxit
× It (20)
where wmax and wmin are the inertia weight’s final and initial values, respectively, It and
maxit are current and maximum iteration number, respectively. wmax and wmin are taken to
be 0.4 and 0.9, respectively [33]. The flowchart illustration of the adopted PSO algorithm is
shown in Figure 2.](https://image.slidesharecdn.com/integrationofsolarphotovoltaicdistributedgeneratorsin-230123105512-dcc97fc0/75/Integration-of-Solar-Photovoltaic-Distributed-Generators-in-pdf-6-2048.jpg)
![Solar 2022, 2 58
Figure 2. Particle swarm optimization flowchart.
4. Simulation Results and Discussion
To demonstrate the effectiveness of the discussed technique, it was applied to IEEE
33-bus standard RDN. The IEEE 33-bus radial distribution system as shown in Figure 3
consists of thirty-three buses operated at a voltage level of 12.66 kV and thirty-two lines. The
maximum and minimum voltage deviations are constrained to ±5% at all the buses, and
the total real and reactive loads at all the buses are 3.715 MW and 2.3 MVar, respectively [34].
The base MVA is considered as 100 MVA, and the base voltage is taken to be 12.66 kV. In
the base scenario, the system’s overall real and reactive power losses are 202.66 kW (5.45%)
and 135.22 kVar (5.9%), respectively. Tables 1 and 2 demonstrate the simulation results for
the DG locations, bus voltage magnitude, active power loss reduction, and reactive power
loss reduction utilizing PSO, as well as a comparison with the results of different methods
reported in the literature.](https://image.slidesharecdn.com/integrationofsolarphotovoltaicdistributedgeneratorsin-230123105512-dcc97fc0/75/Integration-of-Solar-Photovoltaic-Distributed-Generators-in-pdf-7-2048.jpg)
![Solar 2022, 2 59
Figure 3. IEEE 33-bus radial distribution network.
Table 1. Simulation Results.
Case Base Case 1 DG 2 DGs 3 DGs
Optimal Location - [8] [8; 30] [8; 19; 30]
Installed DG (kW) - [1725] [1129; 721] [1245; 950; 655]
Total DG Size (kW) - 1725 1850 2850
Total Real Power Loss 202.66 119.26 101.94 98.94
Total Real Power Loss Reduction - 83.39 100.72 103.72
Real Power Loss Reduction - 41.2% 49.7 51.2%
Total Reactive Power Loss 135.22 80.38 68.45 66.75
Total Reactive Power Loss Reduction - 54.84 66.78 68.48
Reactive Power Loss Reduction - 40.6% 49.4 50.6%
Min. Bus Voltage 0.9131 0.9376 0.9405 0.9416
Table 2. Results comparison with various approaches for 3 DGs.
SOS [35] GA [2] TLBO [36] QOTLBO [36] HAS [35] GAPSO [36]
Real Power Loss (kW) 104.26 106.30 124.70 103.41 135.69 103.40
Total DG Size (MW) 3.13 2.99 3.56 3.47 0.99 2.98
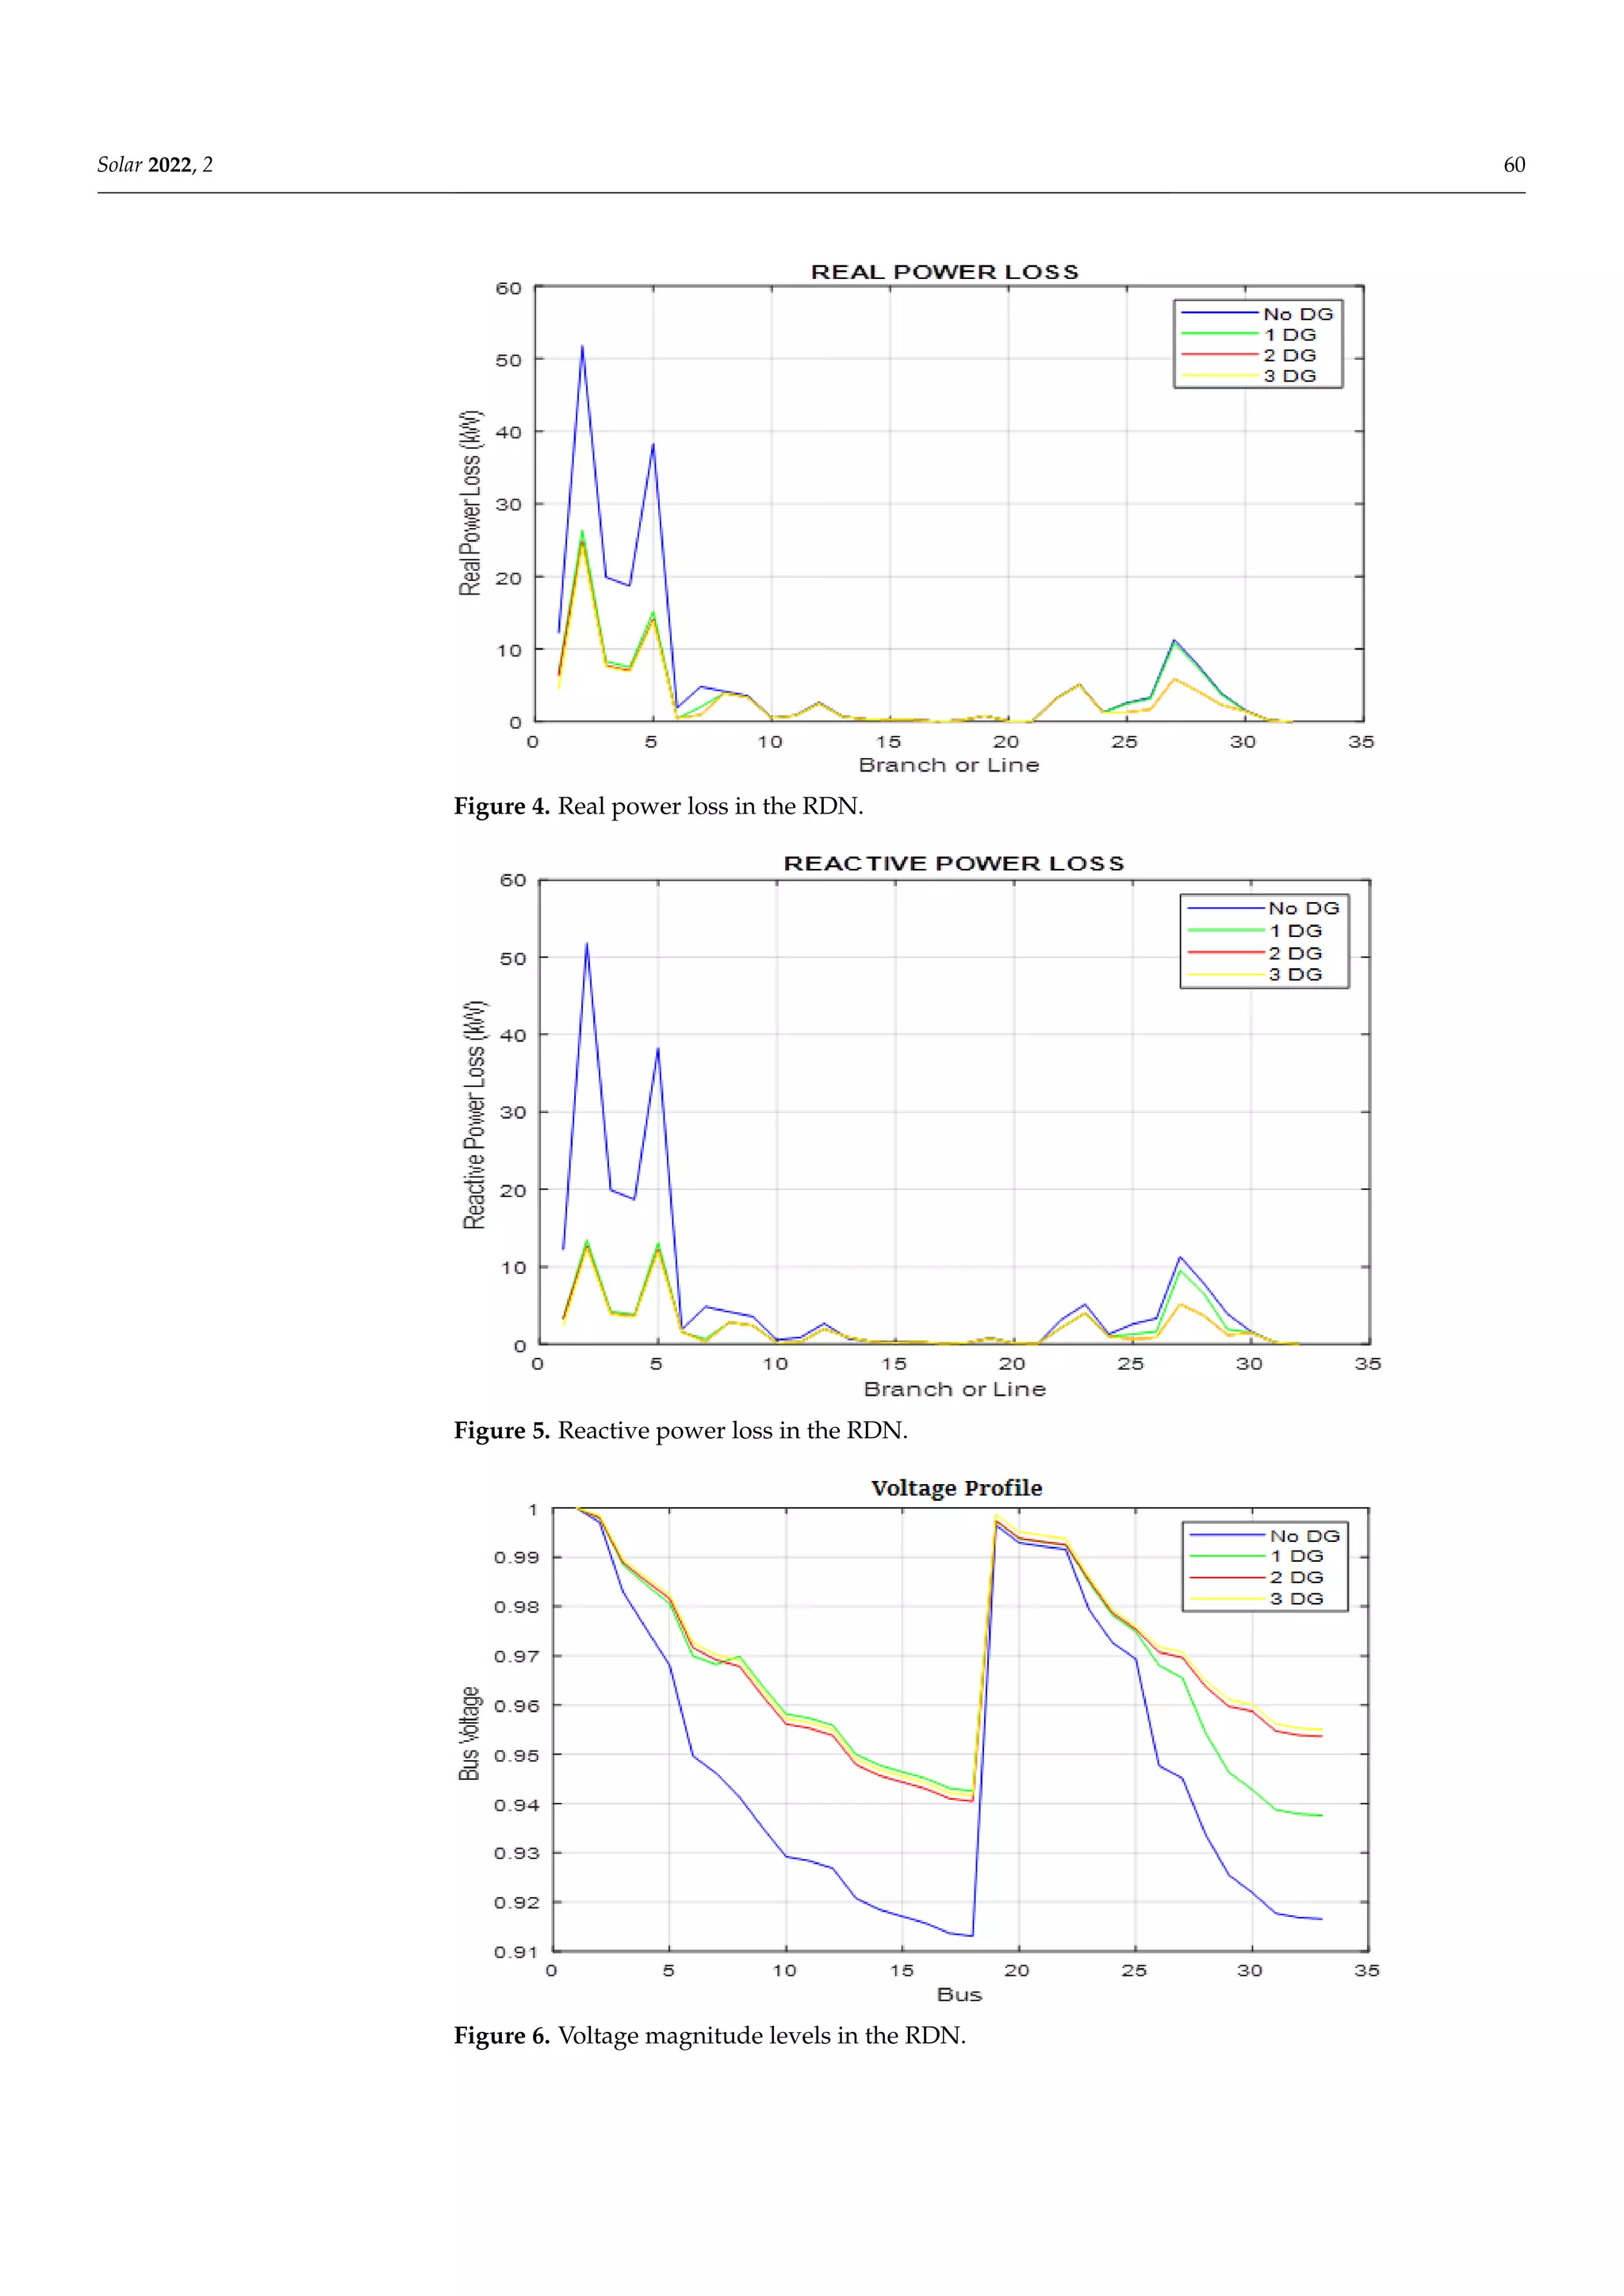
The ‘actual’ penetration level of solar PV DG power is kept within 30–35% of the total
load and the average instantaneous power injected from the solar PV DGs is calculated as a
fraction of the optimal DG sizes based on the irradiance per time and the site capacity factor
as discussed under the methodology. For results comparison, the maximum number of DG
injection points considered in this study is three in line with a number of works available
in the literature. Based on the loss sensitivity approach discussed in [19], the identified
DG injection points are buses 8, 19, and 30 in the order of priority as indicated in Figure 3.
The simulation was carried out for three scenarios involving 1 DG, 2 DGs, and 3 DGs,
respectively; without DG, the actual power loss is 202.66 kW, and the reactive power loss is
135.22 kVar, according to Table 2. In addition, the minimum voltage is 0.9131 per unit, and
this occurs at bus 18; the minimum voltage increases to 0.9376, 0.9405 and 0.9416 for single,
double and triple DGs, respectively. Placing a single DG at bus 8 in the network reduces
active and reactive power losses by 119.28 (41.2%) and 80.38 (40.6%), respectively; when
two DGs are installed at the same time, active and reactive power losses were reduced by
49.7% and 49.4%, respectively. When three DGs are installed at the same time, active and
reactive power losses decrease by 51.2 percent and 50.6 percent, respectively. The active
and reactive power losses, apparent power flow in each line, and bus voltage at different
buses for varying numbers of DGs included in the network are shown in Figures 4–6.](https://image.slidesharecdn.com/integrationofsolarphotovoltaicdistributedgeneratorsin-230123105512-dcc97fc0/75/Integration-of-Solar-Photovoltaic-Distributed-Generators-in-pdf-8-2048.jpg)
![Solar 2022, 2 61
5. Conclusions
The performance of a power system can be essentially assessed by the customers
at the distribution end of the network. Thus, several research efforts are being devoted
to improving the quality and reliability of power supply to the consumers’ loads by
the optimal deployment of distributed generators (DGs). In this study, an approach for
optimally integrating solar PV distributed generators into radial distribution networks
based on the solar capacity factor has been discussed. The heuristic optimization approach
was utilized in this research to solve the problem of optimal DG location and size in
the considered electric power distribution network using a particle swarm optimization
algorithm. The technique was used to place and size the DG on an IEEE 33-bus network
to reduce the power (active and reactive) losses and improve the voltage profile. The
loss sensitivity factor was used to create a priority list of prospective locations for DG
units, and the buses with the lowest sensitivity values were deemed suitable for DG
installation. Compared to the base condition, installing a single DG yielded a reduction
in real and reactive power loss of 41.2% and 40.6%, respectively; installing two DGs
simultaneously yielded an active and reactive power losses reduction of 49.7% and 49.4%,
respectively, and with the simultaneous installation of three DGs, the active and reactive
power losses decreased by 51.2% and 50.6%, respectively. The obtained results using PSO
for DG placement considering the site capacity factor were compared to Genetic Algorithm
(GA), Symbiotic Organism Search (SOS), Teaching Learning Based Optimization, Quasi-
Oppositional Teaching Learning Based Optimization, and GAPSO to demonstrate the
effectiveness of the deployed methodology for the improvement of the performance of
distribution networks.
Author Contributions: A.P.A.—conceptualization, resource, modelling and writing; F.K.A.—validation
and supervision; K.A.M.—resource and writing of reviews; S.A.S.—resource and validation; O.B.A.—
modelling, writing, editing, funding acquisition; O.K.A.—resource and proofreading. All authors
have read and agreed to the published version of the manuscript.
Funding: This research received no external funding.
Institutional Review Board Statement: Not applicable.
Informed Consent Statement: Not applicable.
Data Availability Statement: The main data used for this work are the bus and line parameters for
the standard IEEE 33 bus radial distribution network [37].
Acknowledgments: Special thanks to F. K. Ariyo and O. B. Adewuyi for their invaluable contributions
to this work.
Conflicts of Interest: The authors declare no conflict of interest.
References
1. Ali, E.S.; El-Sehiemy, R.A.; El-Ela, A.; Adel, A.; Mahmoud, K.; Lehtonen, M.; Darwish, M.M. An Effective Bi-Stage Method for
Renewable Energy Sources Integration into Unbalanced Distribution Systems Considering Uncertainty. Processes 2021, 9, 471.
[CrossRef]
2. Moradi, M.H.; Abedini, M. A combination of genetic algorithm and particle swarm optimization for optimal DG location and
sizing in distribution systems. Int. J. Electr. Power Energy Syst. 2012, 34, 66–74. [CrossRef]
3. Zsiborács, H.; Pintér, G.; Vincze, A.; Birkner, Z.; Baranyai, N.H. Grid balancing challenges illustrated by two European examples:
Interactions of electric grids, photovoltaic power generation, energy storage and power generation forecasting. Energy Rep. 2021,
7, 3805–3818. [CrossRef]
4. Essallah, S.; Khedher, A. Optimal multi-Type DG integration and distribution system reconfiguration for active power loss
minimization using CPSO algorithm. In Proceedings of the 2019 International Conference on Control, Automation and Diagnosis
(ICCAD), Grenoble, France, 2–4 July 2019; pp. 1–6.
5. Ahmadi, M.; Adewuyi, O.B.; Danish, M.S.S.; Mandal, P.; Yona, A.; Senjyu, T. Optimum coordination of centralized and distributed
renewable power generation incorporating battery storage system into the electric distribution network. Int. J. Electr. Power
Energy Syst. 2021, 125, 106458. [CrossRef]](https://image.slidesharecdn.com/integrationofsolarphotovoltaicdistributedgeneratorsin-230123105512-dcc97fc0/75/Integration-of-Solar-Photovoltaic-Distributed-Generators-in-pdf-10-2048.jpg)
![Solar 2022, 2 62
6. Reddy, A.S.; Reddy, D.M.D. Application of whale optimization algorithm for distribution feeder reconfiguration. Imanager’s J.
Electr. Eng. 2018, 11, 17–24.
7. Jahromi, M.H.M.; Dehghanian, P.; Khademi, M.R.M.; Jahromi, M.Z. Reactive power compensation and power loss reduction
using optimal capacitor placement. In Proceedings of the 2021 IEEE Texas Power and Energy Conference (TPEC), College Station,
TX, USA, 2–5 February 2021; pp. 1–6.
8. Ogunjuyigbe, A.; Ayodele, T.; Akinola, O. Impact of distributed generators on the power loss and voltage profile of sub-
transmission network. J. Electr. Syst. Inf. Technol. 2016, 3, 94–107. [CrossRef]
9. Emara, D.; Ezzat, M.; Abdelaziz, A.Y.; Mahmoud, K.; Lehtonen, M.; Darwish, M.M. Novel Control Strategy for Enhancing
Microgrid Operation Connected to Photovoltaic Generation and Energy Storage Systems. Electronics 2021, 10, 1261. [CrossRef]
10. Ahmadi, M.; Lotfy, M.E.; Shigenobu, R.; Howlader, A.M.; Senjyu, T. Optimal Sizing of Multiple Renewable Energy Resources
and PV Inverter Reactive Power Control Encompassing Environmental, Technical, and Economic Issues. IEEE Syst. J. 2019,
13, 3026–3037. [CrossRef]
11. Wei, Y.M.; Kang, J.N.; Yu, B.Y.; Liao, H.; Du, Y.F. A dynamic forward-citation full path model for technology monitoring: An
empirical study from shale gas industry. Appl. Energy 2017, 205, 769–780. [CrossRef]
12. Adeagbo, A.; Olaniyi, E.; Ofoegbu, E.; Abolarin, A. Solar photo-voltaic system efficiency improvement using unitary-axis active
tracking system. Int. J. Sci. Eng. Res. 2020, 11, 502–508.
13. Adewuyi, O.B.; Ahmadi, M.; Olaniyi, I.O.; Senjyu, T.; Olowu, T.O.; Mandal, P. Voltage security-constrained optimal generation
rescheduling for available transfer capacity enhancement in deregulated electricity markets. Energies 2019, 12, 4371. [CrossRef]
14. Ochoa, L.F.; Keane, A.; Harrison, G.P. Minimizing the reactive support for distributed generation: Enhanced passive operation
and smart distribution networks. IEEE Trans. Power Syst. 2011, 26, 2134–2142. [CrossRef]
15. Ali, Z.M.; Diaaeldin, I.M.; HE Abdel Aleem, S.; El-Rafei, A.; Abdelaziz, A.Y.; Jurado, F. Scenario-based network reconfiguration
and renewable energy resources integration in large-scale distribution systems considering parameters uncertainty. Mathematics
2021, 9, 26. [CrossRef]
16. Nawaz, S.; Bansal, A.K.; Sharma, M.P. A novel DG allocation method for power loss reduction in radial distribution system. In
Proceedings of the 2016 IEEE 7th Power India International Conference (PIICON), Bikaner, India, 25–27 November 2016; pp. 1–4.
17. Suvarchala, K.; Yuvaraj, T.; Balamurugan, P. A brief review on optimal allocation of Distributed Generation in distribution
network. In Proceedings of the 2018 4th International Conference on Electrical Energy Systems (ICEES), Chennai, India, 7–9
February 2018; pp. 391–396.
18. Karunarathne, E.; Pasupuleti, J.; Ekanayake, J.; Almeida, D. Optimal Placement and Sizing of DGs in Distribution Networks
Using MLPSO Algorithm. Energies 2020, 13, 6185. [CrossRef]
19. Adewuyi, O.B.; Adeagbo, A.P.; Adebayo, I.G.; Howlader, H.O.R.; Sun, Y. Modified Analytical Approach for PV-DGs Integration
into a Radial Distribution Network Considering Loss Sensitivity and Voltage Stability. Energies 2021, 14, 7775. [CrossRef]
20. Ouali, S.; Cherkaoui, A. An improved backward/forward sweep power flow method based on a new network information
organization for radial distribution systems. J. Electr. Comput. Eng. 2020, 2020, 5643410. [CrossRef]
21. Rupa, J.A.M.; Ganesh, S. Power Flow Analysis for Radial Distribution System Using Backward/Forward Sweep Method. Int. J.
Electr. Comput. Eng. 2014, 8, 1628–1632.
22. Chang, G.W.; Chu, S.Y.; Wang, H.L. An Improved Backward/Forward Sweep Load Flow Algorithm for Radial Distribution
Systems. IEEE Trans. Power Syst. 2007, 22, 882–884. [CrossRef]
23. Salimon, S.A.; Adepoju, G.A.; Adebayo, I.G.; Adewuyi, O.B.; Amuda, S.O. Simultaneous Placement and Sizing of Distributed
Generation Units and Shunt Capacitors on Radial Distribution Systems Using Cuckoo Search Algorithm. Curr. J. Appl. Sci.
Technol. 2021, 40, 43–58. [CrossRef]
24. Bompard, E.; Carpaneto, E.; Chicco, G.; Napoli, R. Convergence of the backward/forward sweep method for the load-flow
analysis of radial distribution systems. Int. J. Electr. Power Energy Syst. 2000, 22, 521–530. [CrossRef]
25. Amara, T.; Asefi, S.; Adewuyi, O.B.; Ahmadi, M.; Yona, A.; Senjyu, T. Technical and economic performance evaluation for efficient
capacitors sizing and placement in a real distribution network. In Proceedings of the 2019 IEEE Student Conference on Research
and Development (SCOReD), Bandar Seri Iskandar, Malaysia, 15–17 October 2019; pp. 100–105. [CrossRef]
26. Adewuyi, O.B.; Shigenobu, R.; Senjyu, T.; Lotfy, M.E.; Howlader, A.M. Multiobjective mix generation planning considering
utility-scale solar PV system and voltage stability: Nigerian case study. Electr. Power Syst. Res. 2019, 168, 269–282. [CrossRef]
27. Adewuyi, O.B.; Lotfy, M.E.; Akinloye, B.O.; Howlader, H.O.R.; Senjyu, T.; Narayanan, K. Security-constrained optimal utility-scale
solar PV investment planning for weak grids: Short reviews and techno-economic analysis. Appl. Energy 2019, 245, 16–30.
[CrossRef]
28. Moraes, L., Jr.; Bussar, C.; Stoecker, P.; Jacqué, K.; Chang, M.; Sauer, D. Comparison of long-term wind and photovoltaic power
capacity factor datasets with open-license. Appl. Energy 2018, 225, 209–220. [CrossRef]
29. Salimon, S.A.; Aderinko, H.A.; Fajuke, F.I.; Suuti, K.A. Load flow analysis of Nigerian radial distribution network using
backward/forward sweep technique. J. VLSI Des. Adv. 2019, 2, 1–11.
30. Valle, Y.D.; Venayagamoorthy, G.K.; Mohagheghi, S.; Hernandez, J.C.; Harley, R.G. Particle swarm optimization: Basic concepts,
variants and applications in power systems. IEEE Trans. Evol. Comput. 2008, 12, 171–195. [CrossRef]
31. Adewuyi, O.B.; Howlader, H.O.R.; Olaniyi, I.O.; Konneh, D.A.; Senjyu, T. Comparative analysis of a new VSC-optimal power
flow formulation for power system security planning. Int. Trans. Electr. Energy Syst. 2020, 30, e12250. [CrossRef]](https://image.slidesharecdn.com/integrationofsolarphotovoltaicdistributedgeneratorsin-230123105512-dcc97fc0/75/Integration-of-Solar-Photovoltaic-Distributed-Generators-in-pdf-11-2048.jpg)
![Solar 2022, 2 63
32. Talukder, S. Mathematical Modelling and Applications of Particle Swarm Optimization. Ph.D. Thesis, School of Engineering
Blekinge Institute of Technology, Karlskrona, Sweden, 2011.
33. Rathore, A.; Sharma, H. Review on inertia weight strategies for particle swarm optimization. In Proceedings of the Sixth
International Conference on Soft Computing for Problem Solving, School of Mathematics, Thapar University, Patiala, India, 13
April 2017; Springer: Singapore, 2017; pp. 76–86.
34. Vita, V. Development of a decision-making algorithm for the optimum size and placement of distributed generation units in
distribution networks. Energies 2017, 10, 1433. [CrossRef]
35. Nguyen, T.P.; Vo, D.N. Optimal number, location, and size of distributed generators in distribution systems by symbiotic
organism search based method. Adv. Electr. Electron. Eng. 2018, 15, 724–735. [CrossRef]
36. Sultana, S.; Roy, P.K. Multi-objective quasi-oppositional teaching learning based optimization for optimal location of distributed
generator in radial distribution systems. Int. J. Electr. Power Energy Syst. 2014, 63, 534–545. [CrossRef]
37. Dolatabadi, S.H.; Ghorbanian, M.; Siano, P.; Hatziargyriou, N.D. An Enhanced IEEE 33 Bus Benchmark Test System for
Distribution System Studies. IEEE Trans. Power Syst. 2020, 36, 2565–2572. [CrossRef]](https://image.slidesharecdn.com/integrationofsolarphotovoltaicdistributedgeneratorsin-230123105512-dcc97fc0/75/Integration-of-Solar-Photovoltaic-Distributed-Generators-in-pdf-12-2048.jpg)