Download to read offline


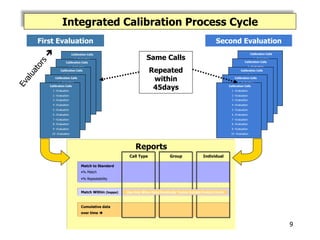


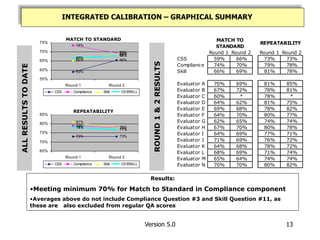


The document describes an integrated calibration process implemented by a contact center to improve the accuracy and efficiency of their quality assurance measurements. Key points: - The original QA process involved separate calibration sessions with different focuses that duplicated efforts. An integrated process was proposed to address this. - The new process involves evaluators calibrating to a set of 12 recorded calls over 45 days. Data is collected and reports generated to identify areas for improvement. - Initial results found a statistically significant improvement in match to standard scores while maintaining efficiency gains. Evaluator consistency and understanding of standards also improved. - Benefits included increased sample size and representation, validated coaching impacts, and a consistent method for assessing performance and developing evaluation standards.


