Instructions for your #kir assignments rules 1
•Download as DOCX, PDF•
0 likes•76 views
Instructions for your #kir assignments rules 1
Report
Share
Report
Share

Recommended
Recommended
More Related Content
What's hot
What's hot (19)
Slide Makeover #91: Comparing Revenue components to previous year
Slide Makeover #91: Comparing Revenue components to previous year
Slide Makeover #90: Showing the timing of steps in a project
Slide Makeover #90: Showing the timing of steps in a project
FinancialViz Makeover: Putting comparisons side-by-side
FinancialViz Makeover: Putting comparisons side-by-side
GO16_XL_CH01_GRADER_1E_HW - Gym Sales 1.1 (completed solution)
GO16_XL_CH01_GRADER_1E_HW - Gym Sales 1.1 (completed solution)
Similar to Instructions for your #kir assignments rules 1
Similar to Instructions for your #kir assignments rules 1 (20)
READING ASSIGNMENTEach element of your project must be submitted.docx
READING ASSIGNMENTEach element of your project must be submitted.docx
MemoStart Word and create a new blank document.Create .docx
MemoStart Word and create a new blank document.Create .docx
Excel Project 3 – MS Excel Use the project description H.docx
Excel Project 3 – MS Excel Use the project description H.docx
Computer Applications Microsoft Excel2016 Graded Project.docx
Computer Applications Microsoft Excel2016 Graded Project.docx
Project 2 Presentation - How to Write the Career Guide
Project 2 Presentation - How to Write the Career Guide
Choose a journal article related to project status reporting, budg
Choose a journal article related to project status reporting, budg
Excel Project 2 – MS Excel (Summer 2019) Use the pro.docx
Excel Project 2 – MS Excel (Summer 2019) Use the pro.docx
CHEE 4520 HW 06 Assigned on 21717 Due by 22417 .docx
CHEE 4520 HW 06 Assigned on 21717 Due by 22417 .docx
Week 1 Assignment InstructionsGOAL Create the initial element o.docx
Week 1 Assignment InstructionsGOAL Create the initial element o.docx
Since the instructions for the final project are standardized and .docx
Since the instructions for the final project are standardized and .docx
© PENN FOSTER, INC. 2016Graded ProjectExcel 2016.docx
© PENN FOSTER, INC. 2016Graded ProjectExcel 2016.docx
THE DATA GEEKHere’s the perfect infographic template.docx
THE DATA GEEKHere’s the perfect infographic template.docx
Median Housing Price Model for D. M. Pan National Real Estate Comp
Median Housing Price Model for D. M. Pan National Real Estate Comp
Shelly Cashman Word 2016 Module 7 SAM Project 1aShelly Ca.docx
Shelly Cashman Word 2016 Module 7 SAM Project 1aShelly Ca.docx
Excel Project 3 – MS Excel (Fall 2018)Use the project descriptio
Excel Project 3 – MS Excel (Fall 2018)Use the project descriptio
Page 1 of 6 Microsoft Excel Project Purpose Th.docx
Page 1 of 6 Microsoft Excel Project Purpose Th.docx
Excel Project 2 – MS Excel Summer 2018 Use the project.docx
Excel Project 2 – MS Excel Summer 2018 Use the project.docx
More from sherni1
More from sherni1 (20)
Part 1 Think an example speak up anythingPart 2 exampleInte.docx
Part 1 Think an example speak up anythingPart 2 exampleInte.docx
Part 1 Progress NoteUsing the client from your Week 3 Assignmen.docx
Part 1 Progress NoteUsing the client from your Week 3 Assignmen.docx
Part 1 Older Adult InterviewInterview an older adult of you.docx
Part 1 Older Adult InterviewInterview an older adult of you.docx
PART 1 OVERVIEWIn this project you are asked to conduct your own.docx
PART 1 OVERVIEWIn this project you are asked to conduct your own.docx
Part 1 Financial AcumenKeeping abreast of the financial mea.docx
Part 1 Financial AcumenKeeping abreast of the financial mea.docx
Part 1 Legislation GridBased on the health-related bill (pr.docx
Part 1 Legislation GridBased on the health-related bill (pr.docx
Part 1 Financial Acumen1. Review at least three (3) articles on.docx
Part 1 Financial Acumen1. Review at least three (3) articles on.docx
Part 1 Parent NewsletterAn article explaining the school’s po.docx
Part 1 Parent NewsletterAn article explaining the school’s po.docx
Part 1 ResearchConduct some independent research. Using Rasmus.docx
Part 1 ResearchConduct some independent research. Using Rasmus.docx
Part 1 What are some challenges with syndromic surveillance P.docx
Part 1 What are some challenges with syndromic surveillance P.docx
Part 1 Procedure and purpose 10.0 Procedures are well-develop.docx
Part 1 Procedure and purpose 10.0 Procedures are well-develop.docx
Part 1 Post your own definition of school readiness (and offer .docx
Part 1 Post your own definition of school readiness (and offer .docx
Part 1 Post a ResponseVarious reform groups with various causes.docx
Part 1 Post a ResponseVarious reform groups with various causes.docx
Part 1 Assessment SummaryIn 500-750-words, summarize the fo.docx
Part 1 Assessment SummaryIn 500-750-words, summarize the fo.docx
Part 1 Post a ResponseDuring the Reconstruction Era, the So.docx
Part 1 Post a ResponseDuring the Reconstruction Era, the So.docx
Part 1 Financial AcumenKeeping abreast of the financial measure.docx
Part 1 Financial AcumenKeeping abreast of the financial measure.docx
Part 1 Do an independently guided tour of news and media coverage.docx
Part 1 Do an independently guided tour of news and media coverage.docx
Part 1 Describe the scopescale of the problem. Problemado.docx
Part 1 Describe the scopescale of the problem. Problemado.docx
Part 1 Art CreationSelect one of the visual art pieces from Cha.docx
Part 1 Art CreationSelect one of the visual art pieces from Cha.docx
Recently uploaded
https://app.box.com/s/7hlvjxjalkrik7fb082xx3jk7xd7liz3TỔNG ÔN TẬP THI VÀO LỚP 10 MÔN TIẾNG ANH NĂM HỌC 2023 - 2024 CÓ ĐÁP ÁN (NGỮ Â...
TỔNG ÔN TẬP THI VÀO LỚP 10 MÔN TIẾNG ANH NĂM HỌC 2023 - 2024 CÓ ĐÁP ÁN (NGỮ Â...Nguyen Thanh Tu Collection
https://app.box.com/s/x7vf0j7xaxl2hlczxm3ny497y4yto33i80 ĐỀ THI THỬ TUYỂN SINH TIẾNG ANH VÀO 10 SỞ GD – ĐT THÀNH PHỐ HỒ CHÍ MINH NĂ...
80 ĐỀ THI THỬ TUYỂN SINH TIẾNG ANH VÀO 10 SỞ GD – ĐT THÀNH PHỐ HỒ CHÍ MINH NĂ...Nguyen Thanh Tu Collection
Recently uploaded (20)
TỔNG ÔN TẬP THI VÀO LỚP 10 MÔN TIẾNG ANH NĂM HỌC 2023 - 2024 CÓ ĐÁP ÁN (NGỮ Â...
TỔNG ÔN TẬP THI VÀO LỚP 10 MÔN TIẾNG ANH NĂM HỌC 2023 - 2024 CÓ ĐÁP ÁN (NGỮ Â...
Plant propagation: Sexual and Asexual propapagation.pptx
Plant propagation: Sexual and Asexual propapagation.pptx
Basic Civil Engineering first year Notes- Chapter 4 Building.pptx
Basic Civil Engineering first year Notes- Chapter 4 Building.pptx
NO1 Top Black Magic Specialist In Lahore Black magic In Pakistan Kala Ilam Ex...
NO1 Top Black Magic Specialist In Lahore Black magic In Pakistan Kala Ilam Ex...
Interdisciplinary_Insights_Data_Collection_Methods.pptx
Interdisciplinary_Insights_Data_Collection_Methods.pptx
Salient Features of India constitution especially power and functions
Salient Features of India constitution especially power and functions
ICT Role in 21st Century Education & its Challenges.pptx
ICT Role in 21st Century Education & its Challenges.pptx
Sensory_Experience_and_Emotional_Resonance_in_Gabriel_Okaras_The_Piano_and_Th...
Sensory_Experience_and_Emotional_Resonance_in_Gabriel_Okaras_The_Piano_and_Th...
80 ĐỀ THI THỬ TUYỂN SINH TIẾNG ANH VÀO 10 SỞ GD – ĐT THÀNH PHỐ HỒ CHÍ MINH NĂ...
80 ĐỀ THI THỬ TUYỂN SINH TIẾNG ANH VÀO 10 SỞ GD – ĐT THÀNH PHỐ HỒ CHÍ MINH NĂ...
ICT role in 21st century education and it's challenges.
ICT role in 21st century education and it's challenges.
Instructions for your #kir assignments rules 1
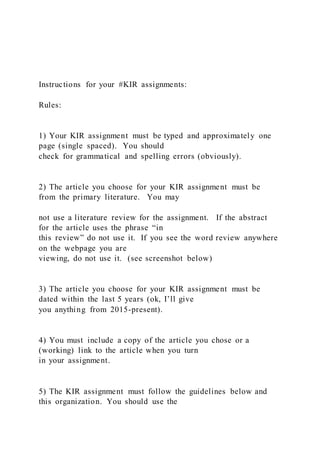
- 1. Instructions for your #KIR assignments: Rules: 1) Your KIR assignment must be typed and approximately one page (single spaced). You should check for grammatical and spelling errors (obviously). 2) The article you choose for your KIR assignment must be from the primary literature. You may not use a literature review for the assignment. If the abstract for the article uses the phrase “in this review” do not use it. If you see the word review anywhere on the webpage you are viewing, do not use it. (see screenshot below) 3) The article you choose for your KIR assignment must be dated within the last 5 years (ok, I’ll give you anything from 2015-present). 4) You must include a copy of the article you chose or a (working) link to the article when you turn in your assignment. 5) The KIR assignment must follow the guidelines below and this organization. You should use the
- 2. headings shown here (underlined) to format your paper: Research Question: What were the research questions being addressed in the article? (do not write them in question form, but in a narrative….ex. “This article addresses whether glucose uptake is increased in muscle cells in response to an insulin signal”) Experimental Approach: Describe the experimental approach used to answer the research question(s). You do not need to include experimental details or a description of the technique used but should focus on the technique used and how it relates to answering the research question. This should NOT simply be a list of biochemical techniques. Answer to Research Question: What were the results? This section should provide a brief summary of the results and describe how they relate to the original research question. Like/Learn: Provide a reason why you chose the article or if you learned something interesting from the article. If you are really into this, answer both!! 6) The article you choose must relate to biochemistry in some way. I will give you specific instructions on what topics to focus on for each assignment. If I do not provide instructions, you are free to choose whatever biochemistry topic you want!
- 3. Grader - Instructions Excel 2019 ProjectExp19_Excel_Ch03_CapAssessment_Movies Project Description: You are an assistant manager at Premiere Movie Source, an online company that enables customers to download movies for a fee. You need to track movie download sales by genre. You gathered the data for April 2021 and organized it in an Excel workbook. You are ready to create charts to help represent the data so that you can make a presentation to your manager later this week. Steps to Perform: Step Instructions Points Possible 1 Start Excel. Download and open the file named Exp19_Excel_Ch03_CapAssessment_Movies.xlsx. Grader has automatically added your last name to the beginning of the filename. 0 2 You want to create a pie chart to show the percentage each category contributes to the monthly movie downloads. Select the ranges A5:A10 and F5:F10. Create a pie chart and move it to a chart sheet named April Pie Chart. 6 3 The chart needs a descriptive title that is easy to read.
- 4. Type April 2021 Downloads by Genre as the chart title, apply bold, 18 pt font size, and Black, Text 1 font color. 5 4 Percentage and category data labels will provide identification information for the pie chart. Add category and percentage data labels in the Inside End position. Remove value data labels and the legend. Apply 14 pt font size and Black, Text 1 font color. 5 5 You want to focus on the comedy movies by exploding it and changing its fill color. Explode the Comedy slice by 7% and apply Dark Red fill color. 4 6 A best practice is to include Alt Text for accessibility compliance. Add Alt Text: The pie chart shows percentage of downloads by genre for April 2021. (including the period) 2 7 Next you want to create a combo chart to depict the monthly totals and percentages by category. Display the Data sheet, select the ranges A4:A10 and F4:G10, and then create a Clustered Column – Line on Secondary Axis combo chart. 4 8 You want to position the chart below the data source.
- 5. Cut the chart and paste it in cell A13. Change the height to 3.5" and the width to 6". 5 9 Change the combo chart title to April 2021 Downloads. Apply Black, Text 1 font color to the chart title. 3 10 Axis titles will help distinguish the number and percentage of downloads. Add a primary value axis title and type Number of Downloads. Add a secondary value axis title and type Percentage of Monthly Downloads. Apply Black, Text 1 font color to both value axis titles. 6 11 Now that you added an axis title for each vertical axis, you can remove the legend and format the secondary value axis to display whole percentages. Remove the legend for the combo chart. Display 0 decimal places for the secondary value axis. 1 12 You want to add some color to the plot area for the combo chart. Apply Light Gradient – Accent 1 gradient fill color for the plot area. 5 13 A best practice is to include Alt Text for accessibility compliance.
- 6. Add Alt Text: The combo chart shows the number and percentage of downloads by genre for April 2021. (including the period). 2 14 To provide a visual summary of the weekly totals for each genre, you will insert sparklines. Select the range B5:E11. Insert Line Sparklines in the range H5:H11. Apply Black, Sparkline Style Dark #4 10 15 Displaying the markers helps identify the specific points on the sparklines. You will also change the high point to a different color to stand out. Show the high point and markers for the sparklines. Change the high point marker color to Red. 5 16 Your last major task is to create a bar chart for weekly downloads. Select the range A4:E10. Create a stacked bar chart. Move the chart to new chart sheet. Type Weekly Downloads for the sheet name. Apply Style 8 chart style. 14 17 Add a chart title above the bar chart and type April 2021 Weekly Downloads by Genre. 4 18 Increasing the font size will make the chart elements easier to read. Apply 11 pt font size to the category axis, value axis, and the
- 7. legend for the bar chart. 6 19 Because the largest value is less than 9,000, you can reduce the maximum bound in the chart. In addition, you want to display the category labels in the same order that they are in the worksheet. Change the maximum bounds for the value axis to 9000 and set the Major Units to 500 for the bar chart. Use the Axis Options to format the category axis so that the category labels are in reverse order in the bar chart. 5 20 Although the bar chart displays major gridlines, minor gridlines could improve the appearance. Add primary minor vertical gridlines to the bar chart. 0 21 A best practice is to include Alt Text for accessibility compliance for the bar chart. Add Alt Text: The stacked bar chart shows downloads by each week for each genre. (including the period). 4 22 Insert a footer with Exploring Series on the left, the sheet name code in the center, and the file name code on the right on all the sheets. Change to Normal view. 4 23 Save and close Exp19_Excel_Ch03_CapAssessment_Movies.xlsx. Exit Excel. Submit the file as directed. 0
- 8. Total Points 100 Created On: 02/08/2021 1 Exp19_Excel_Ch03_CapAssessment - Movies 1.5