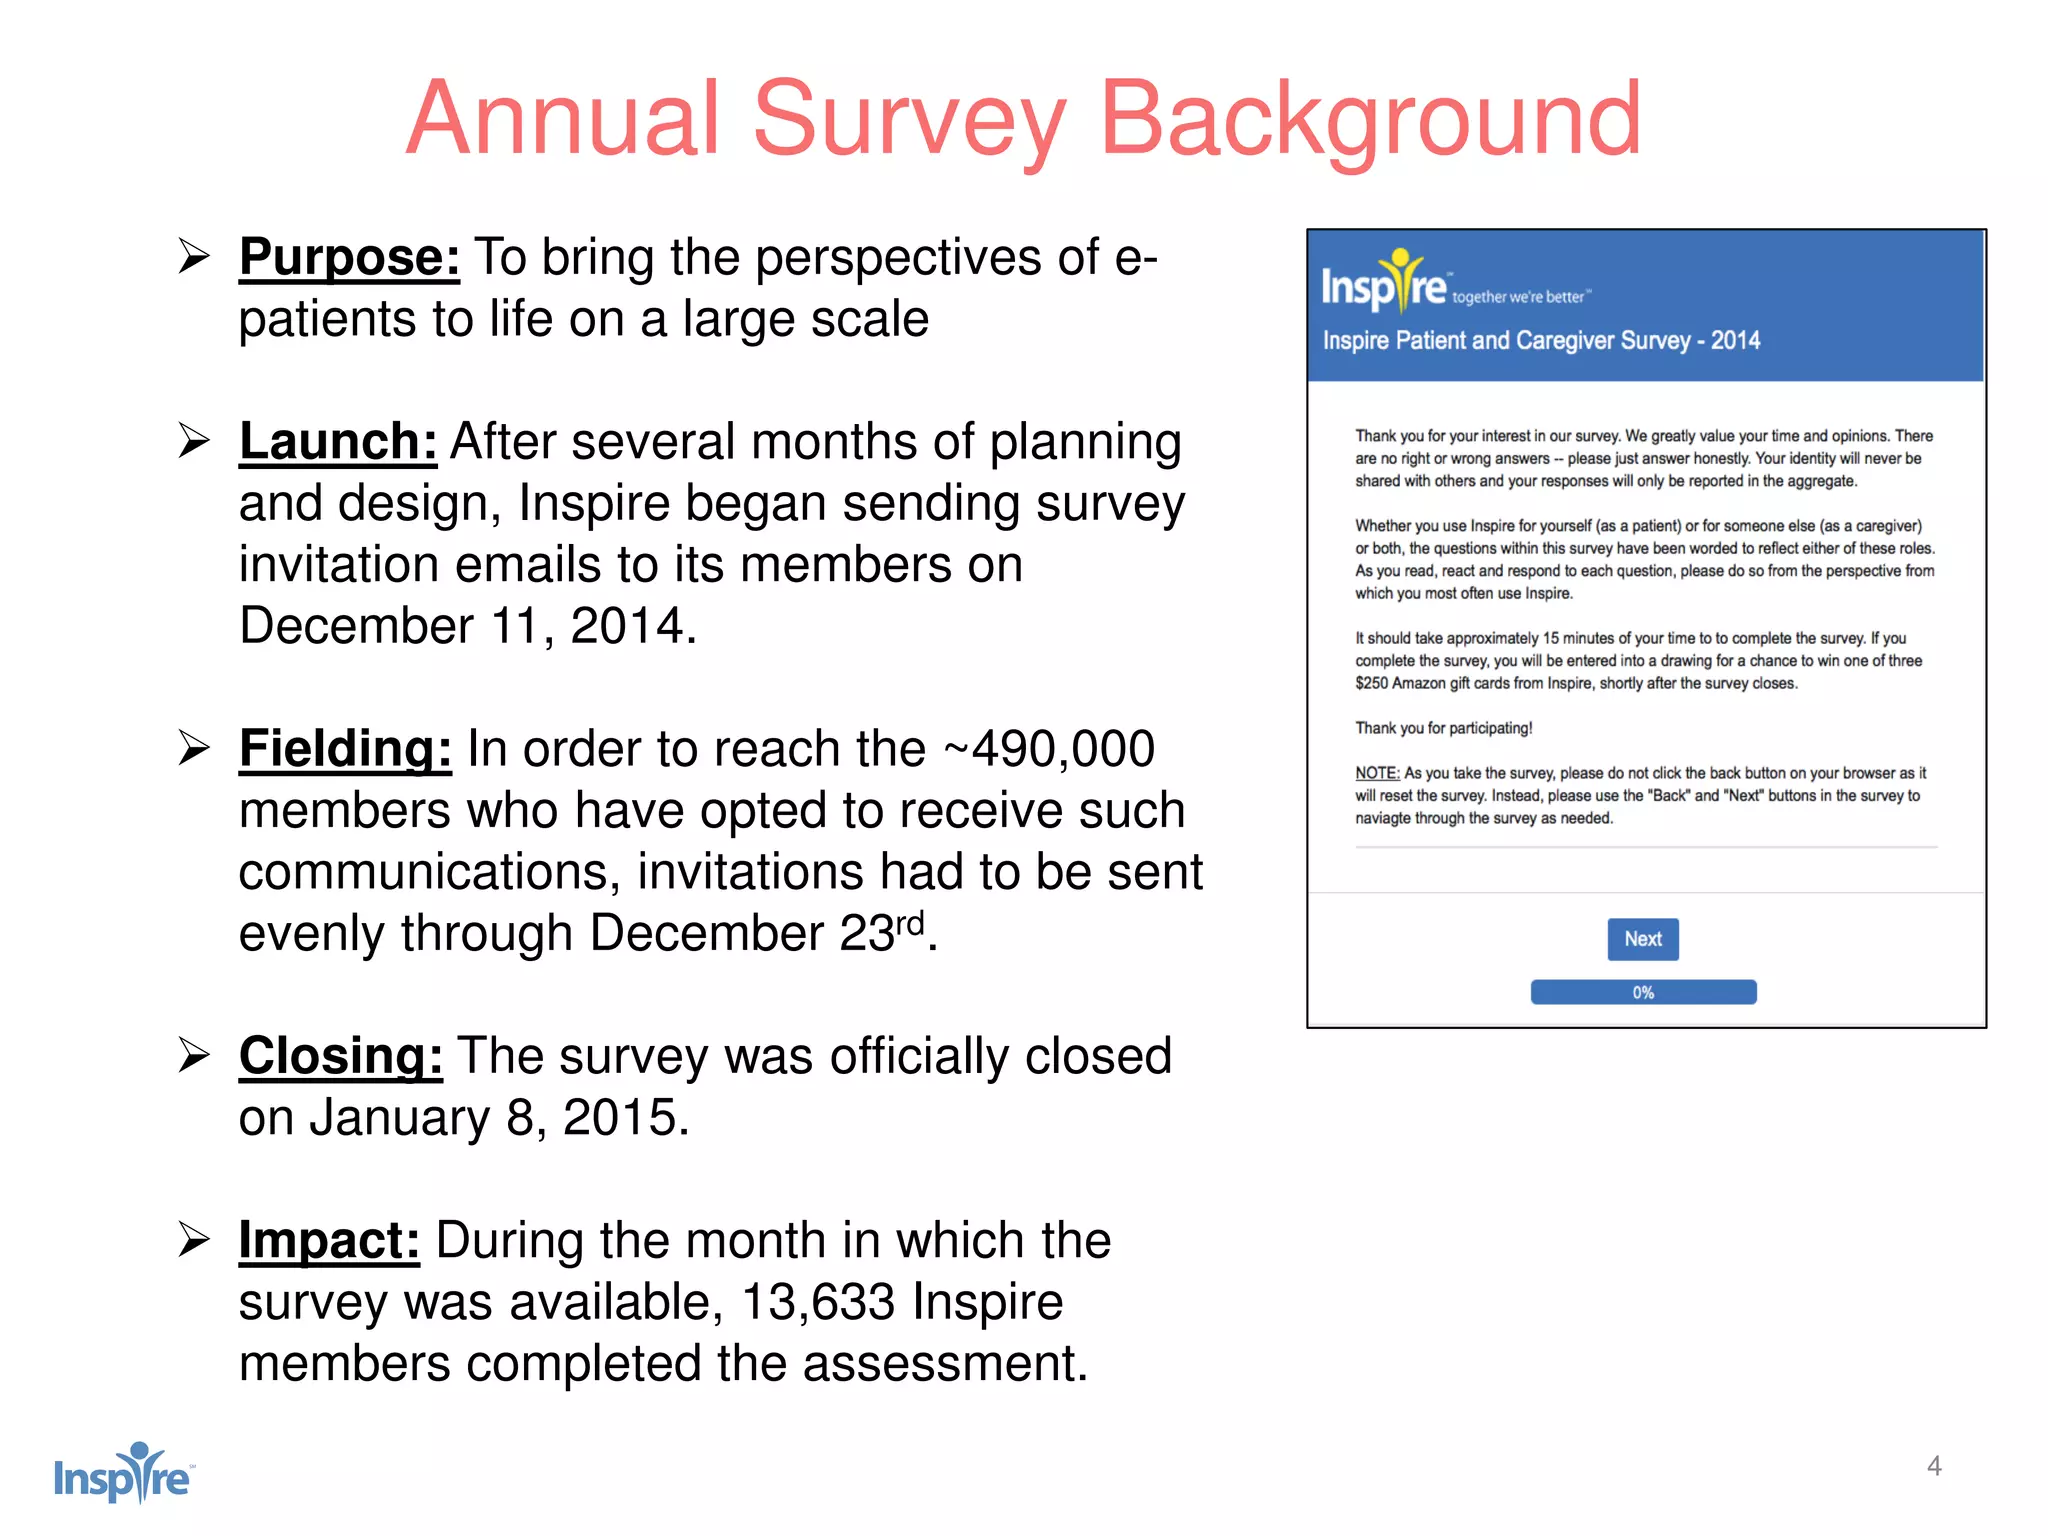
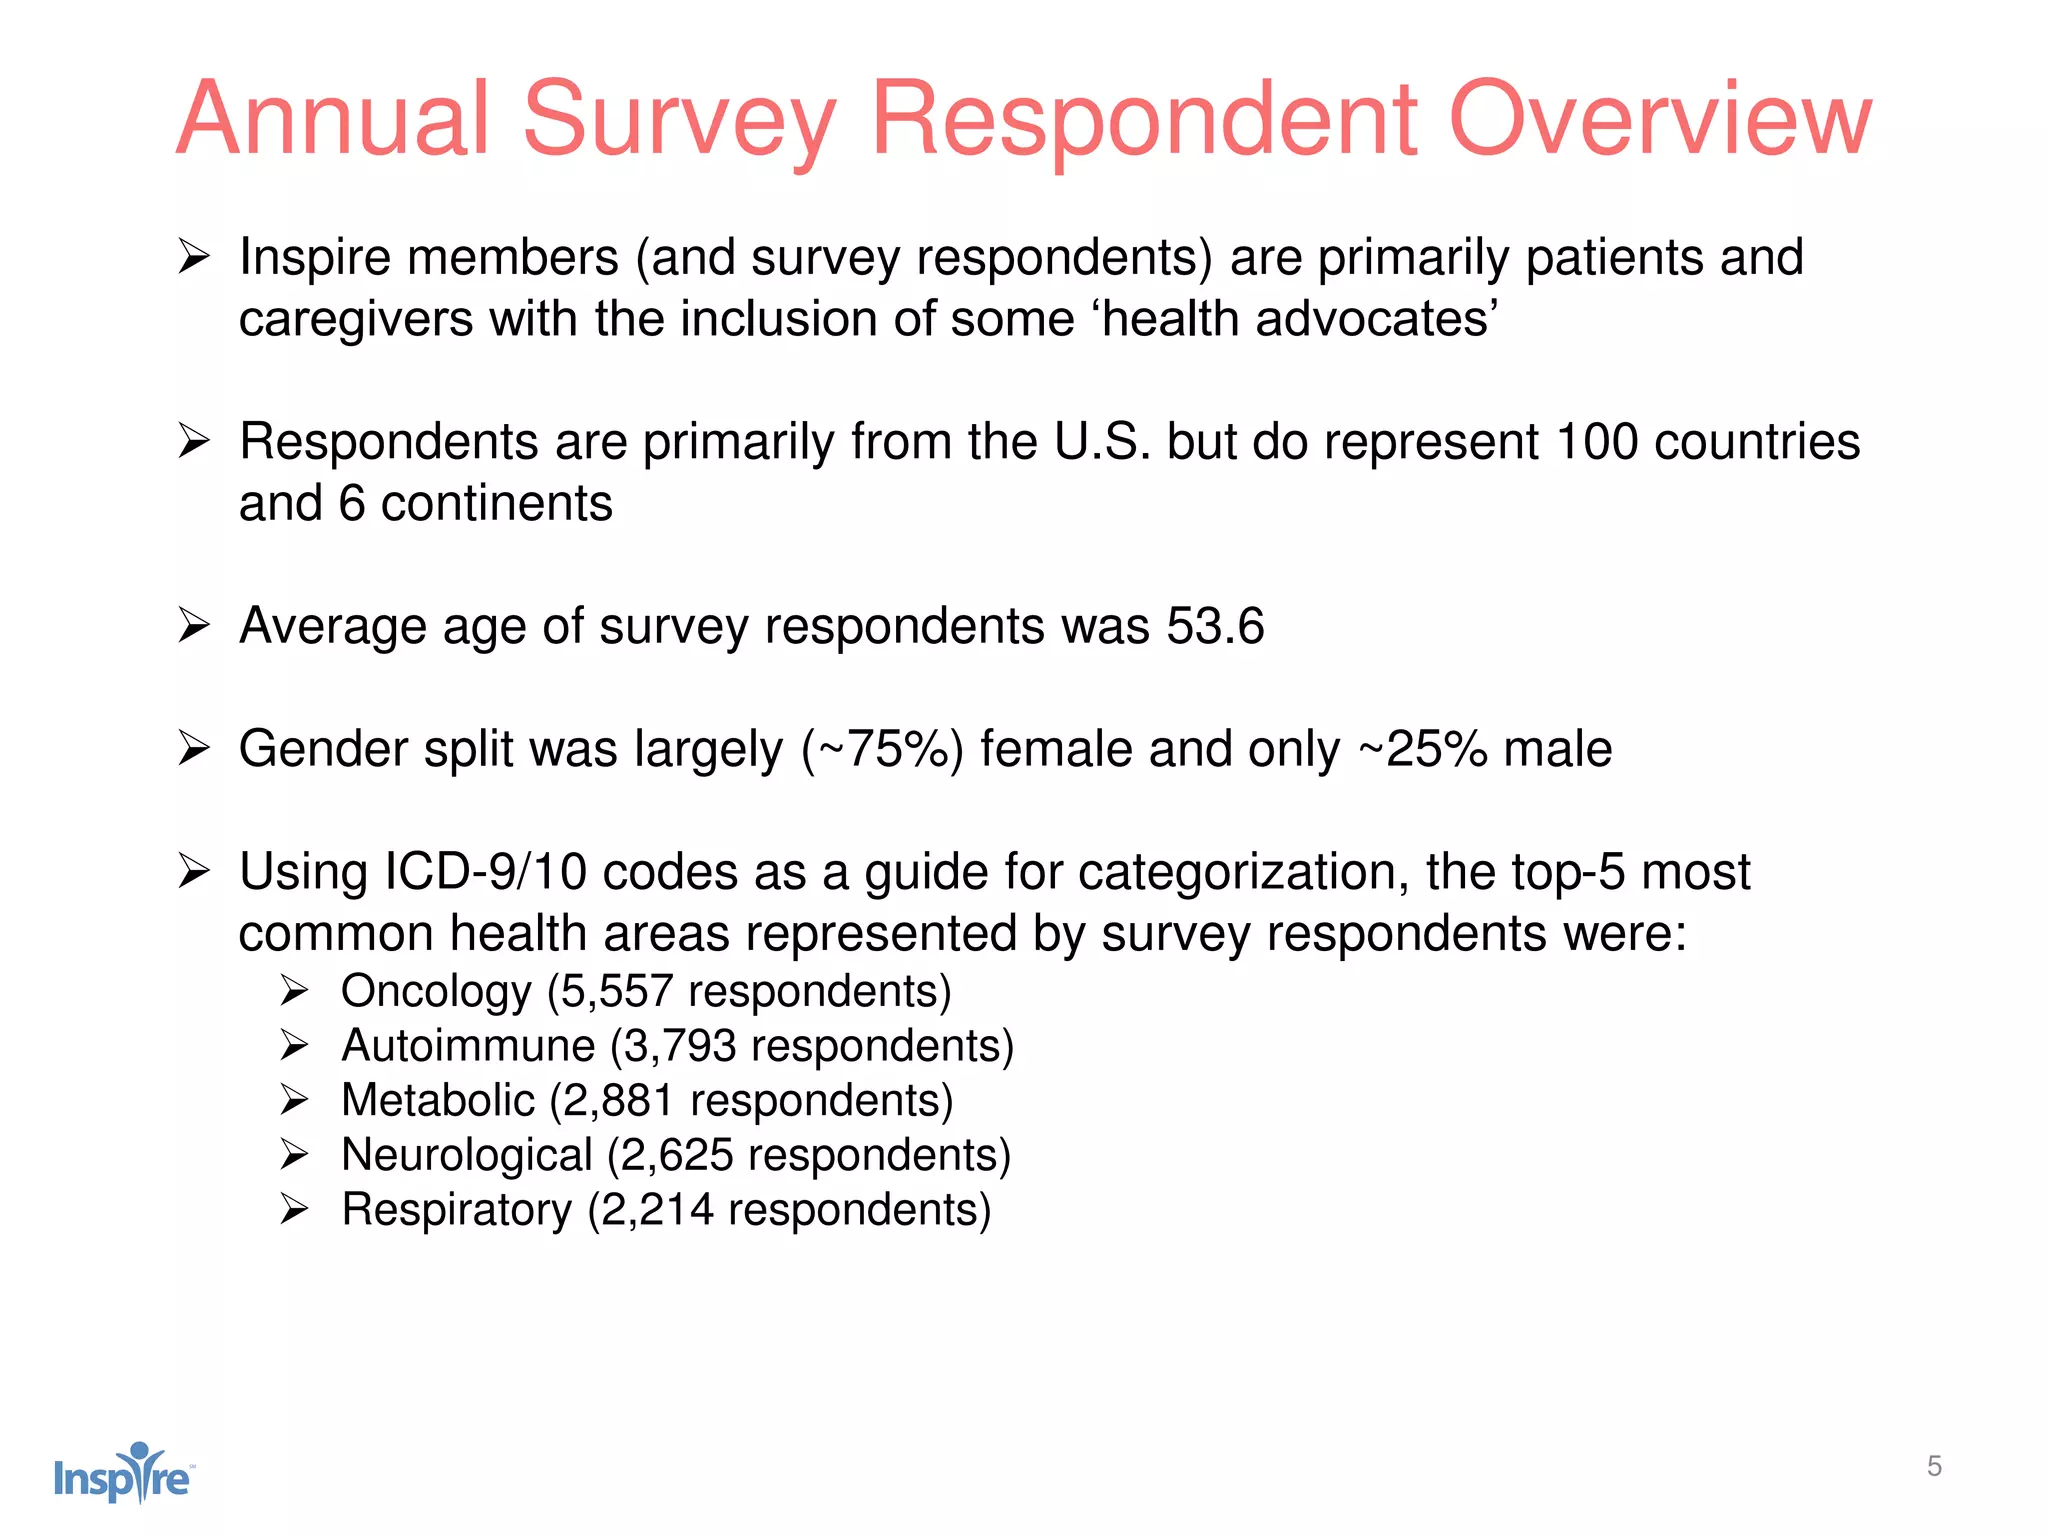
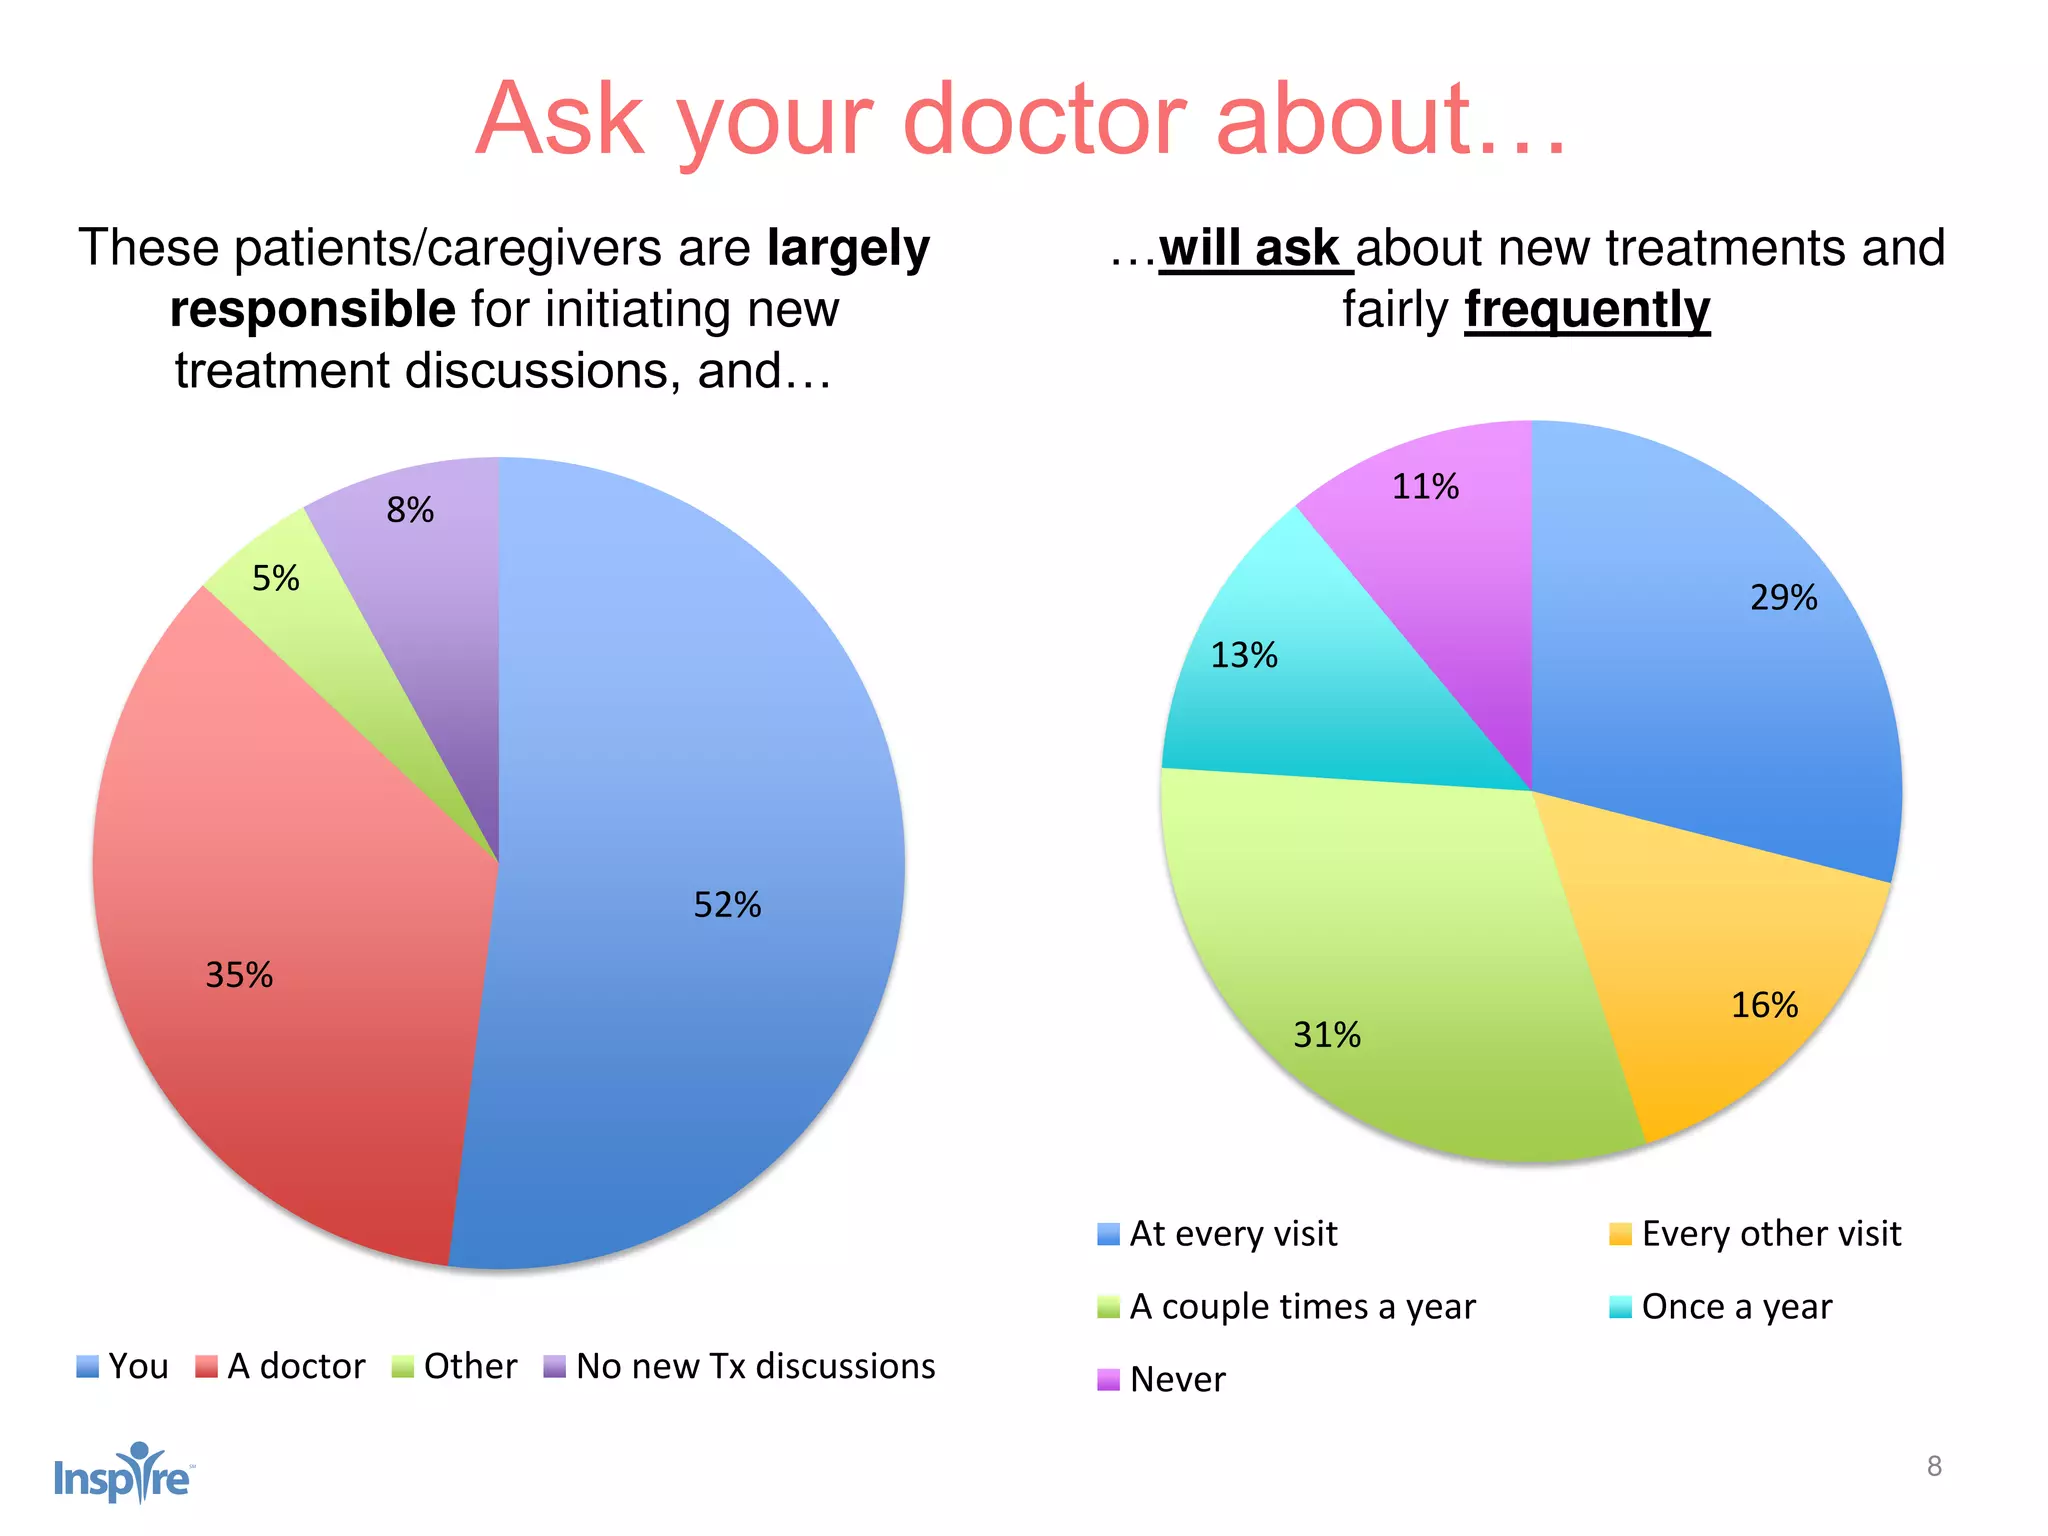
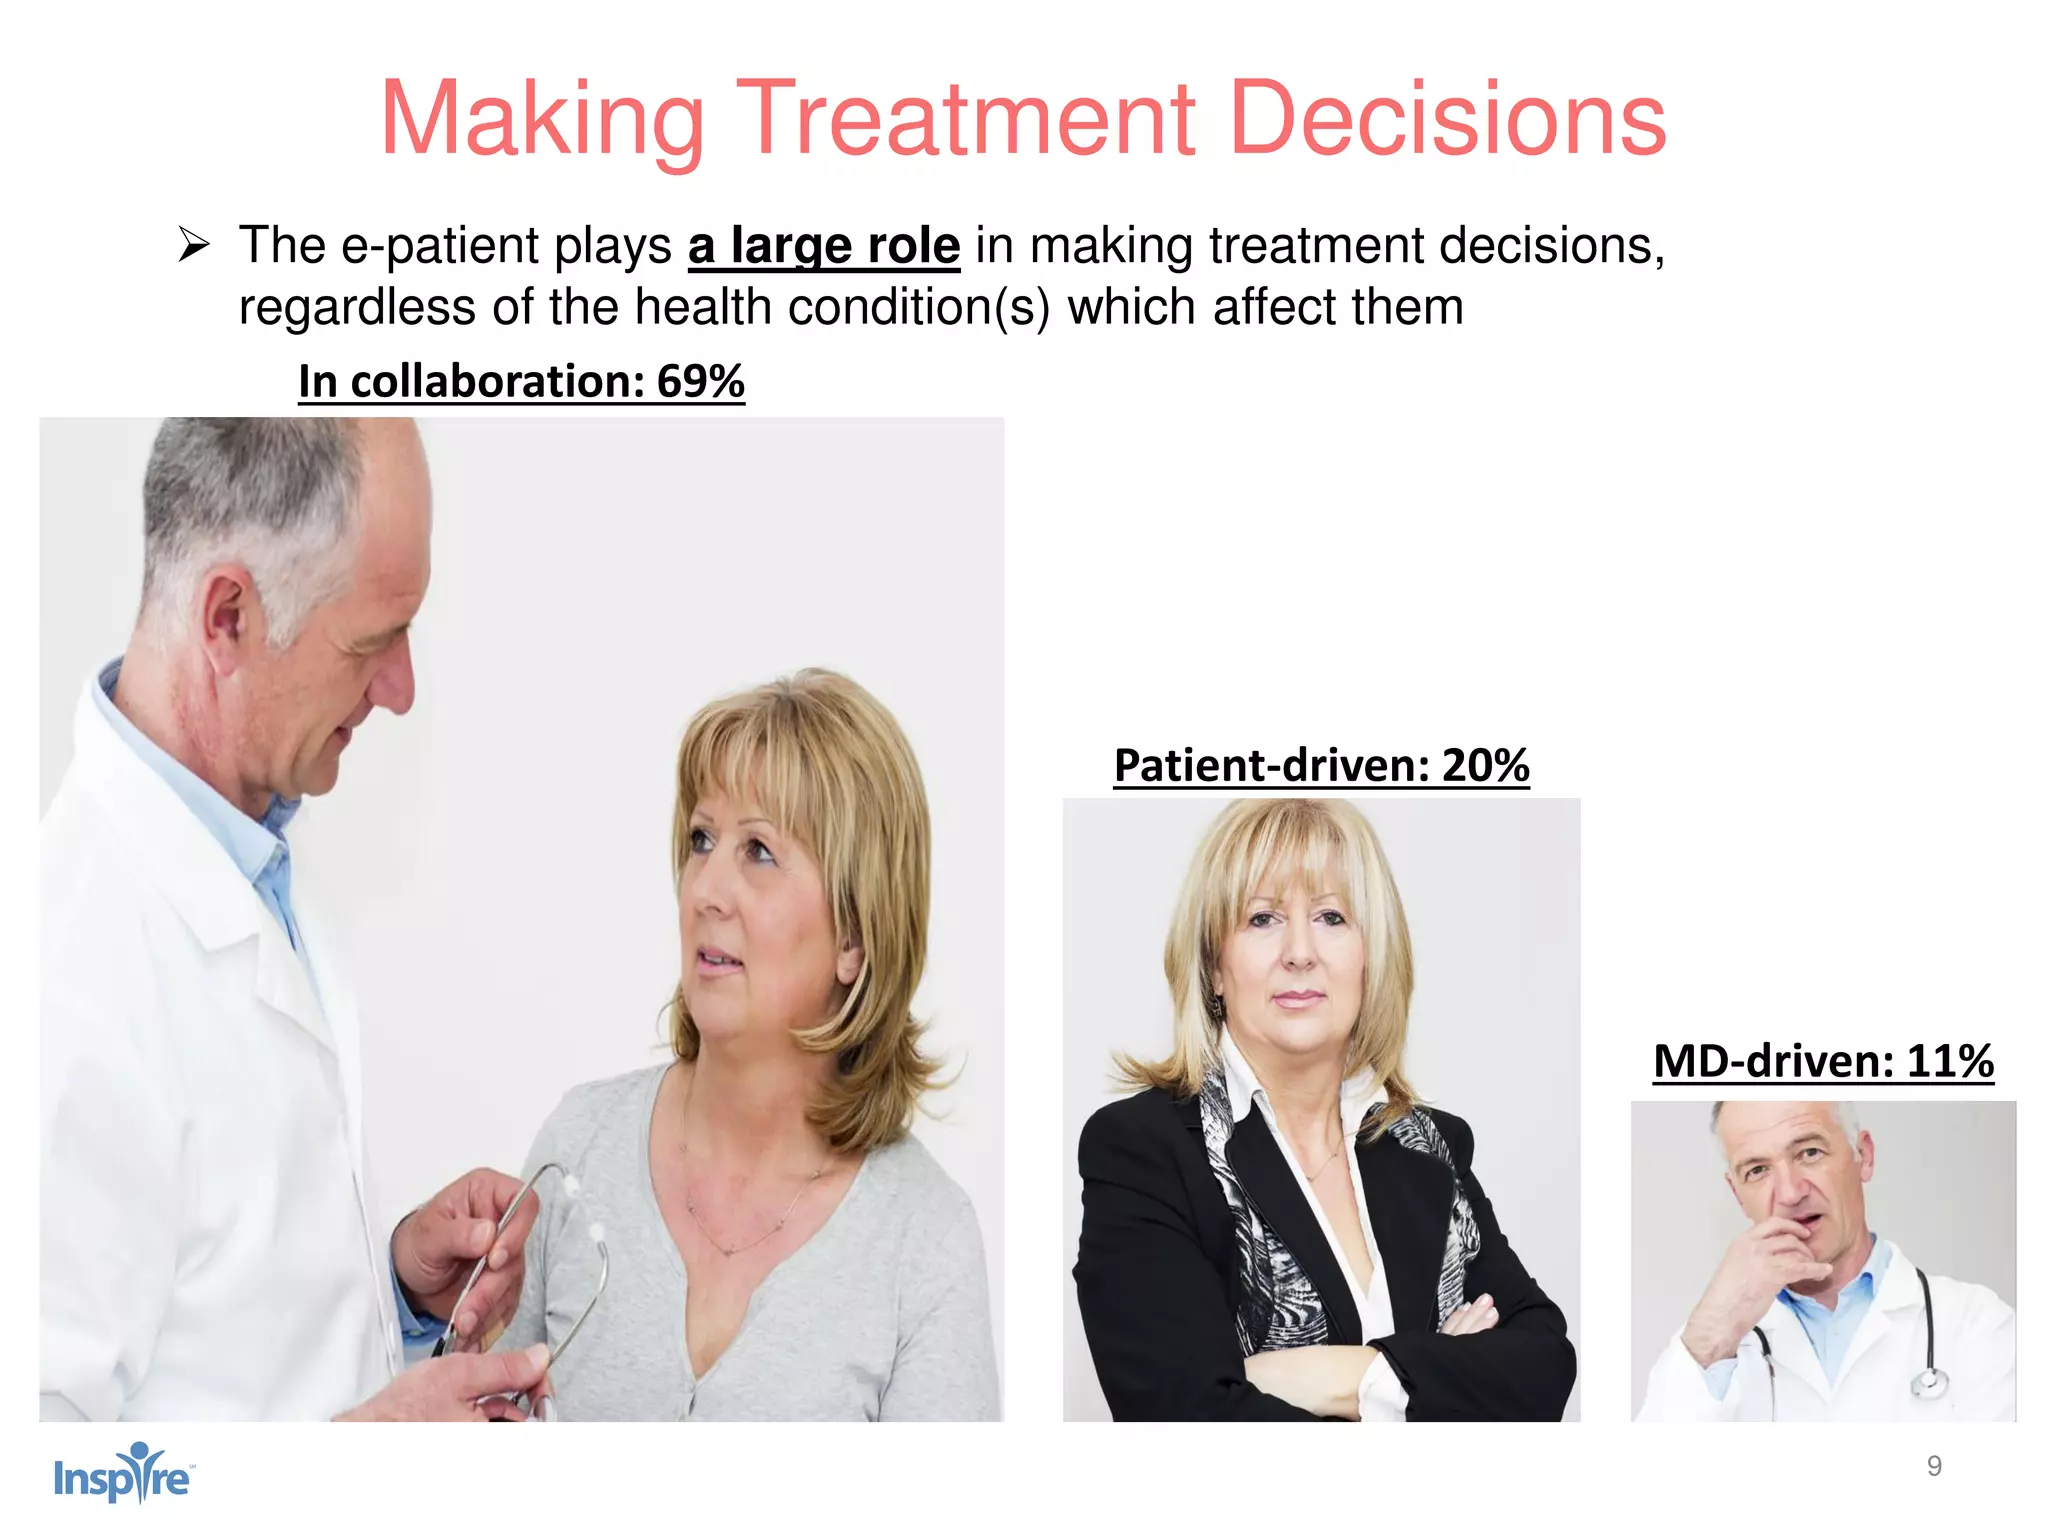
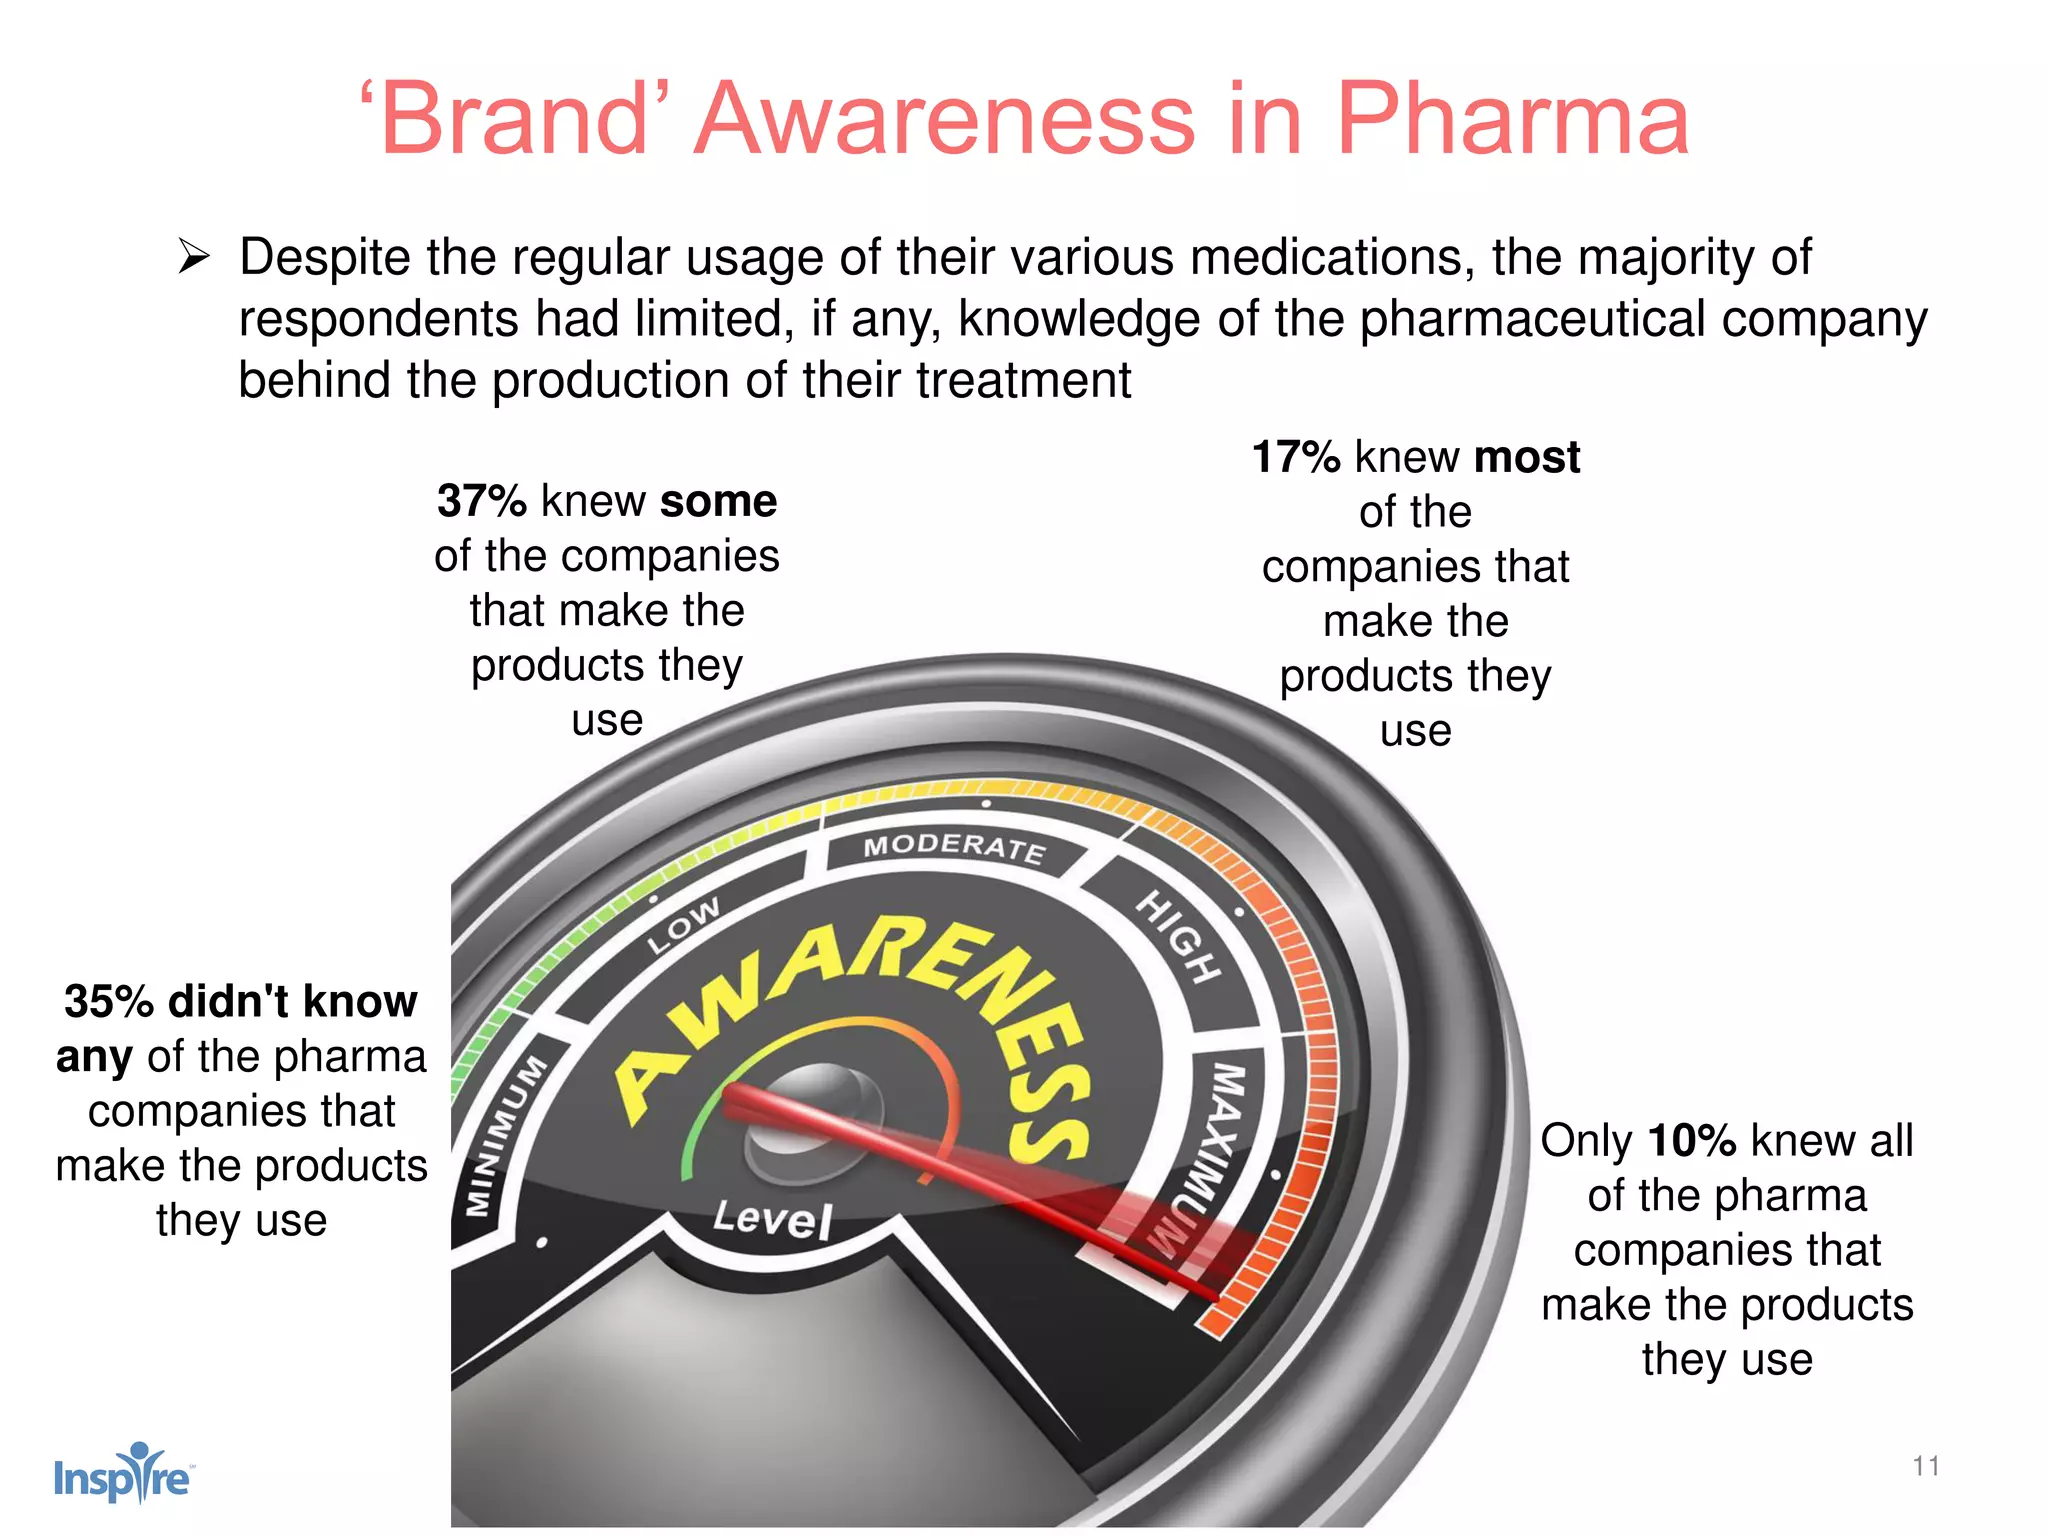
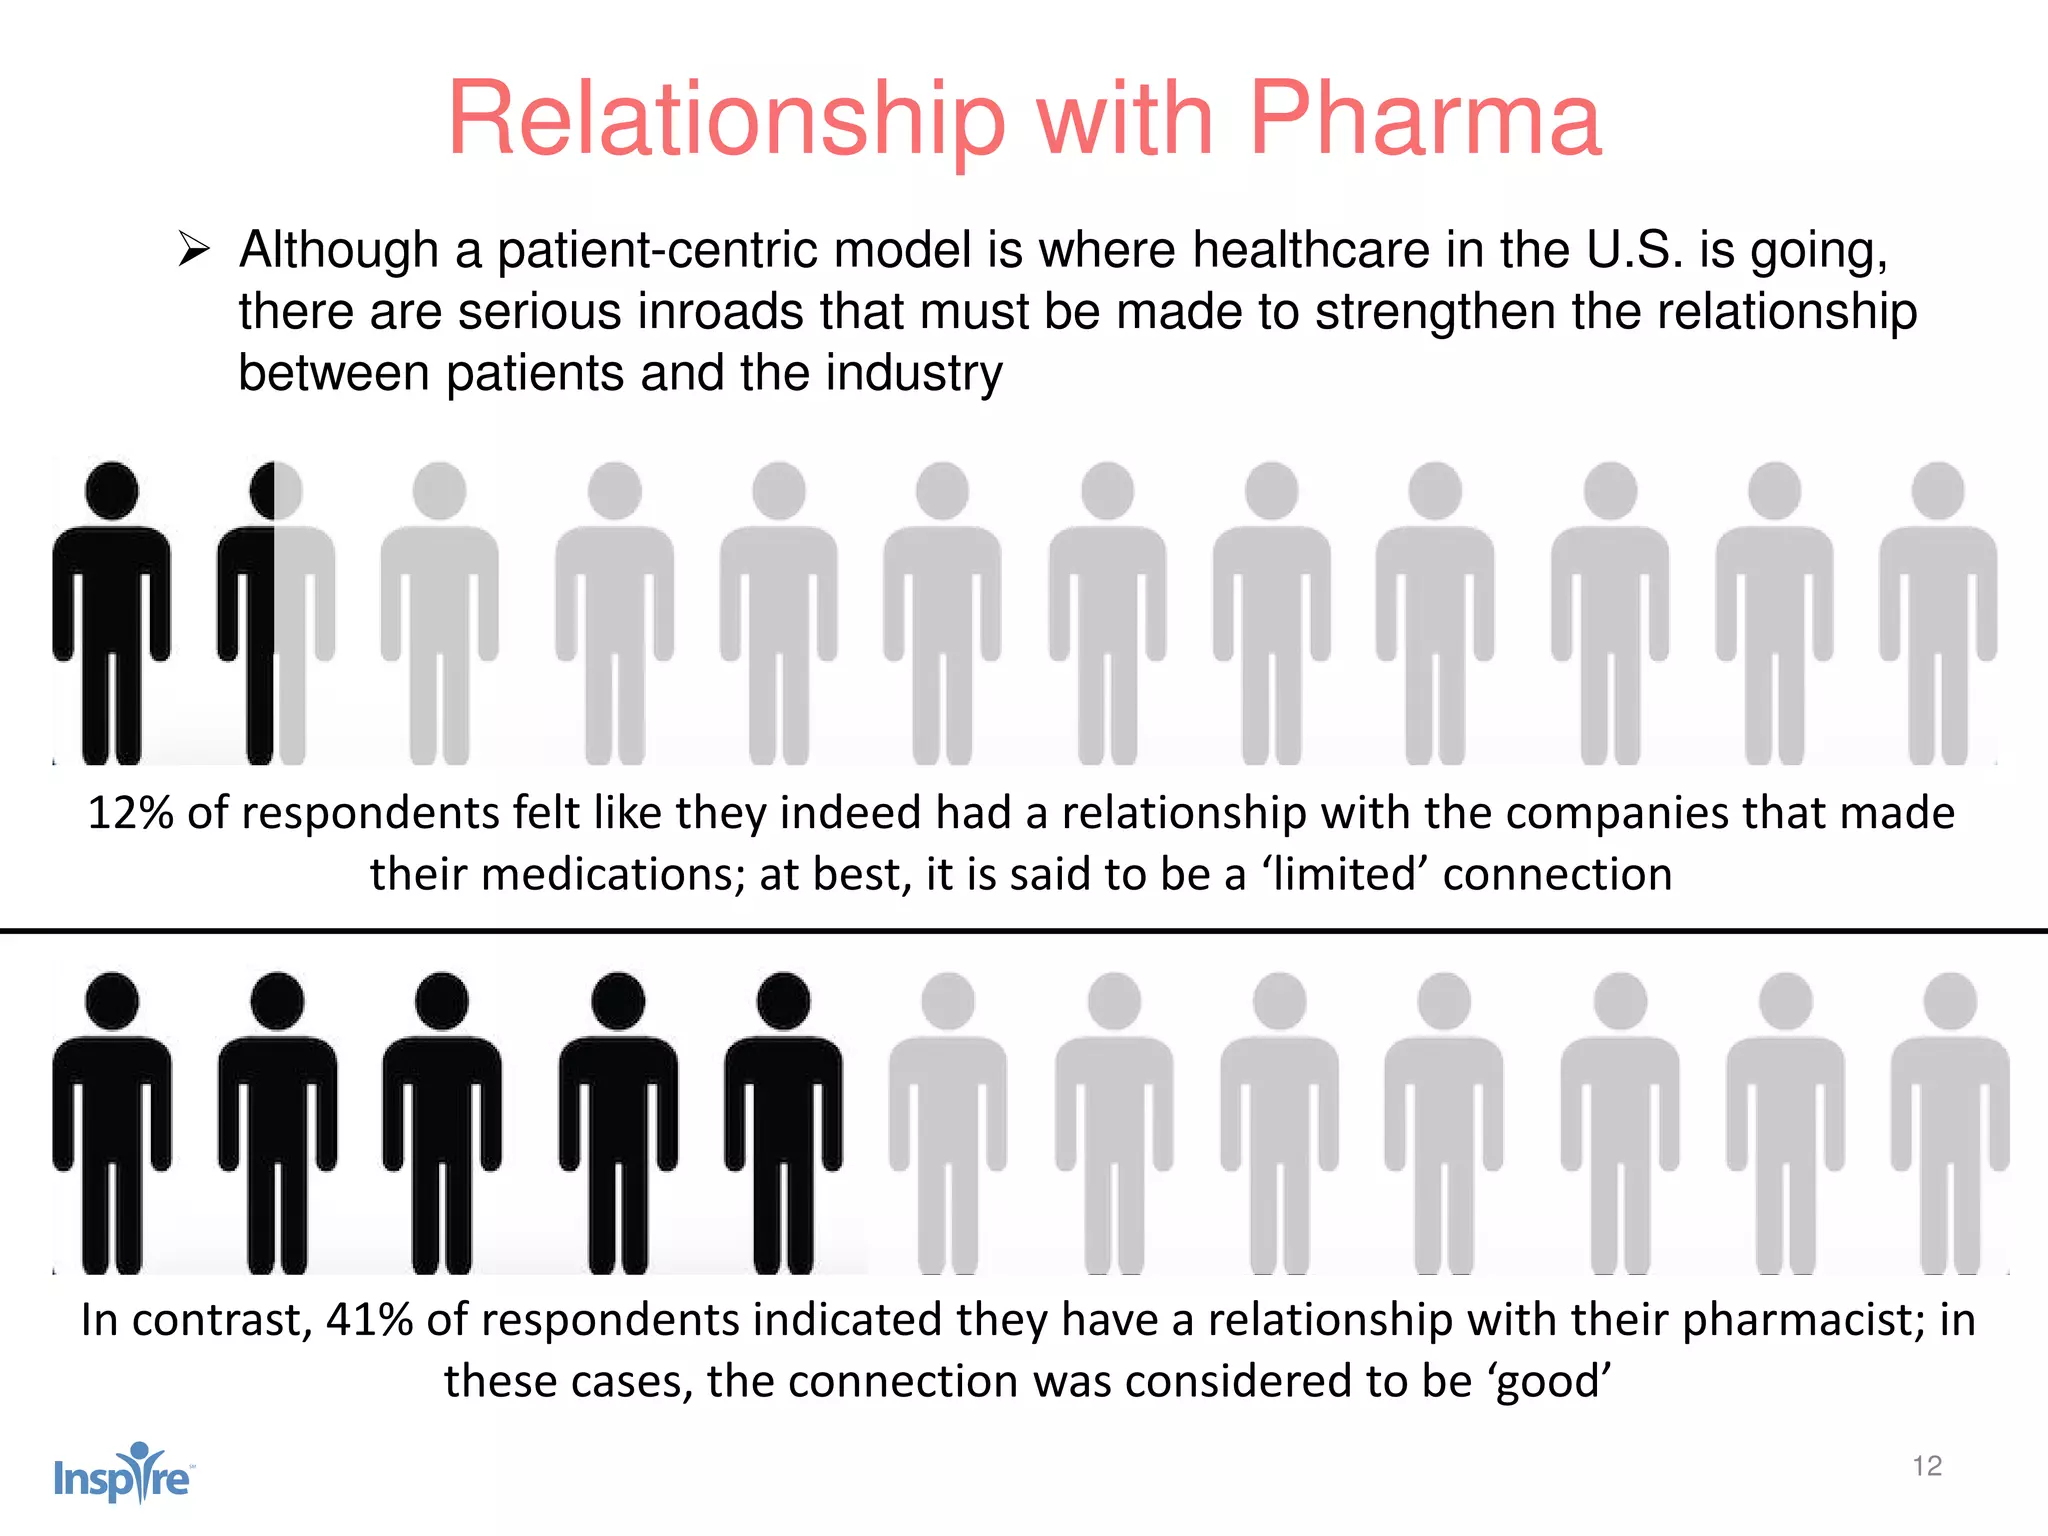
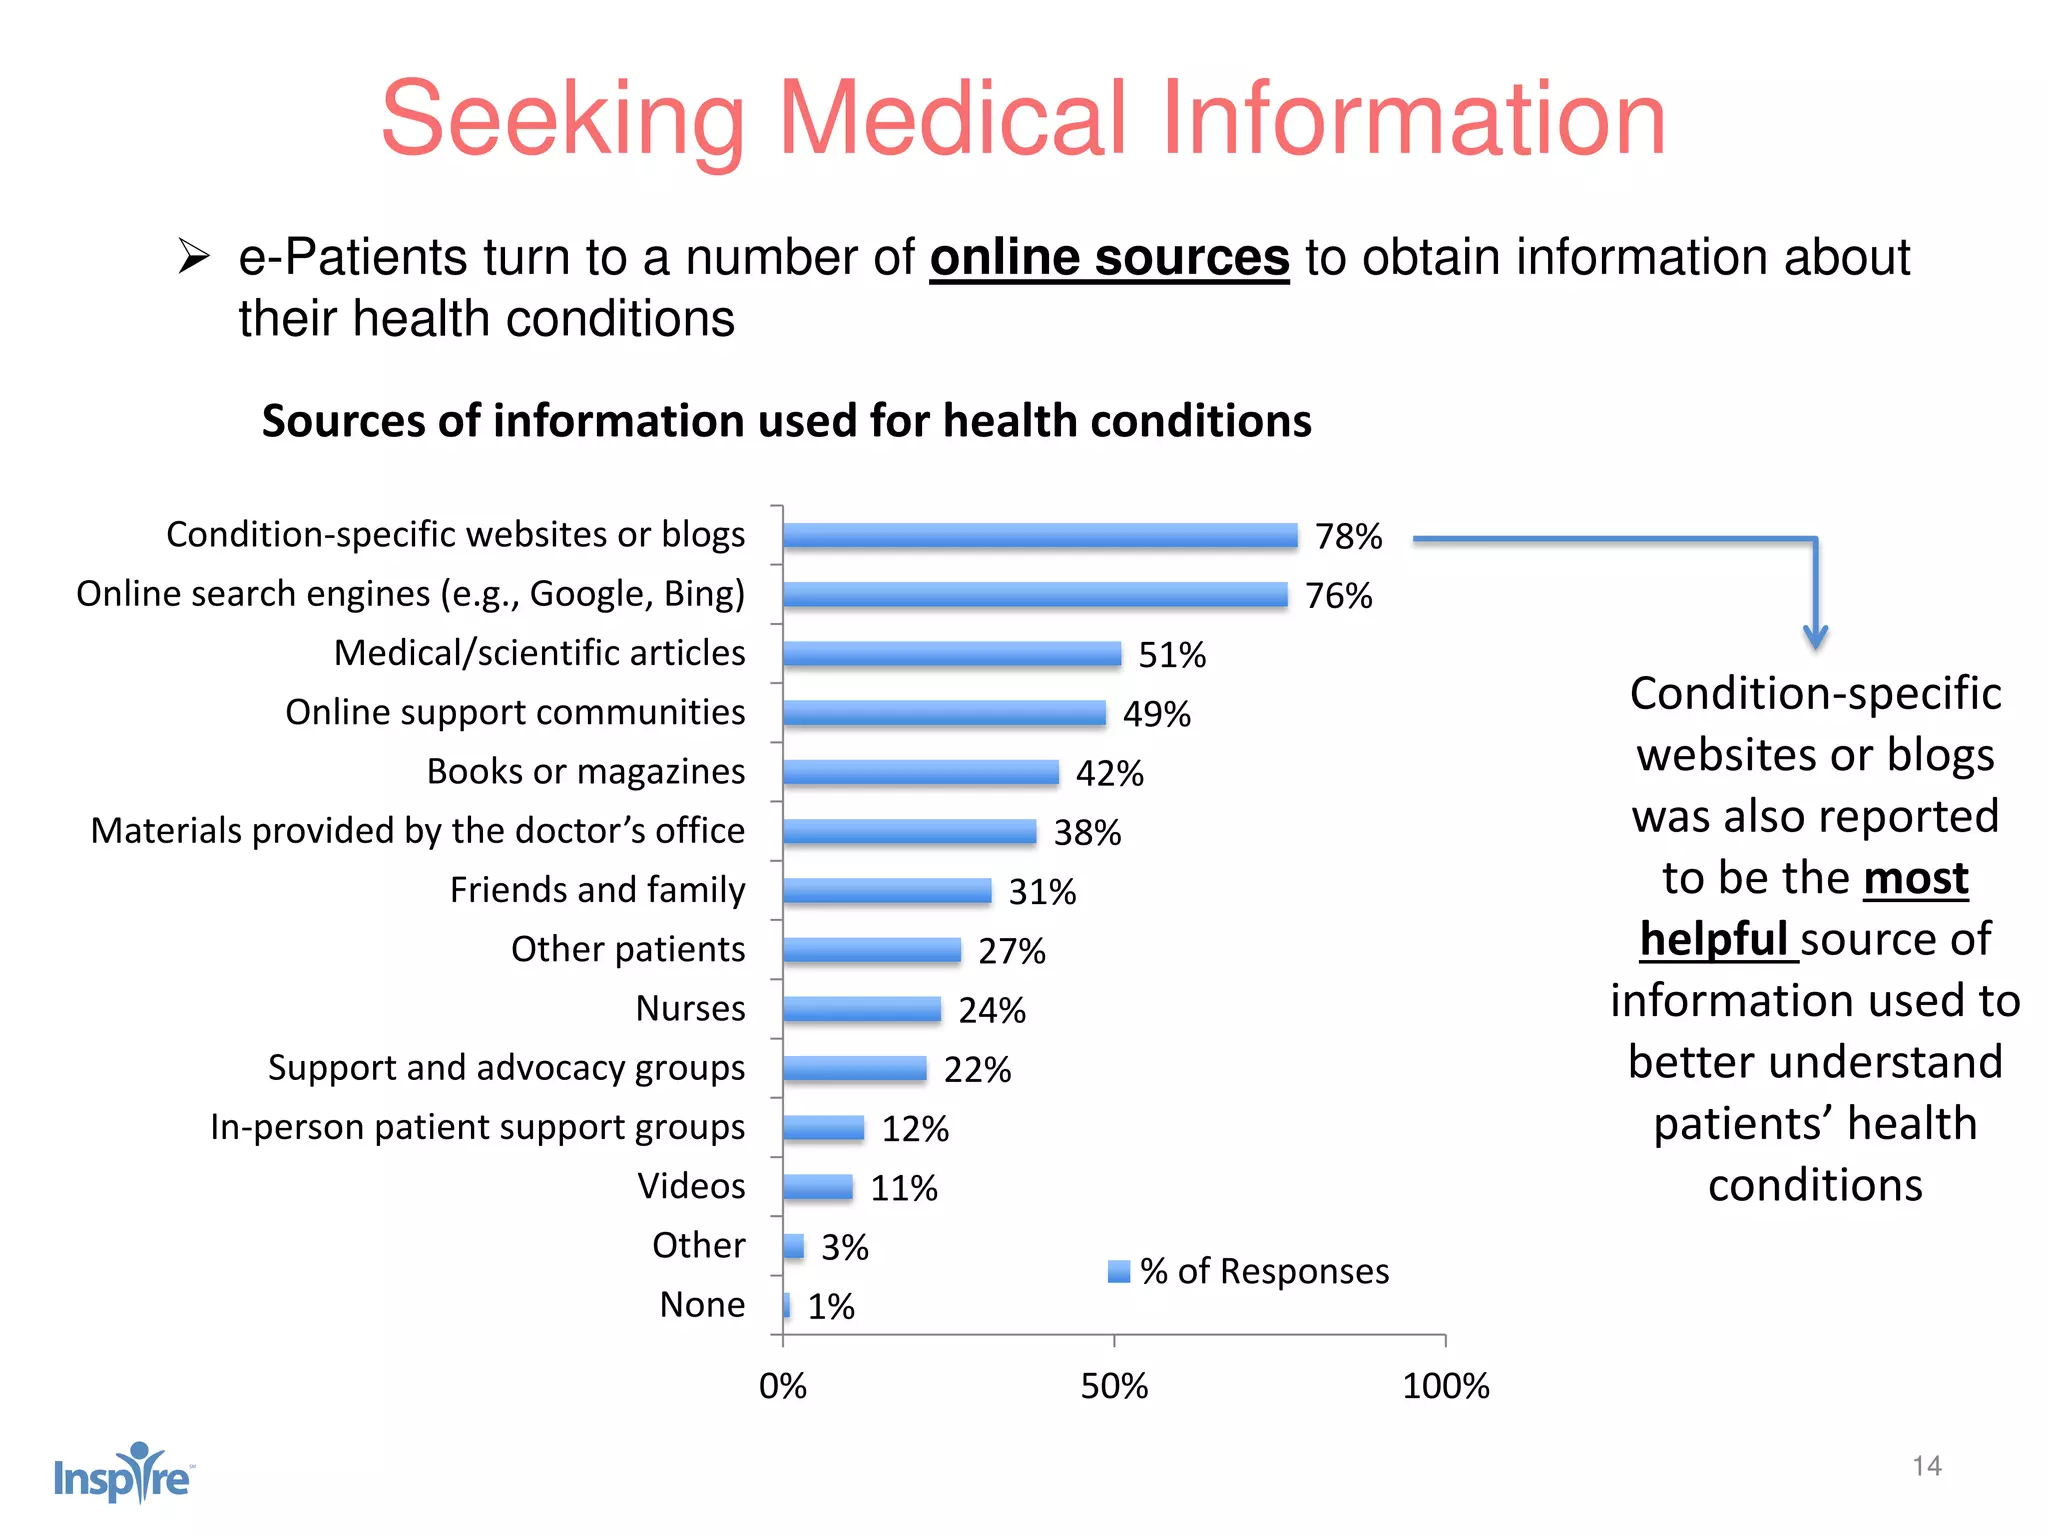
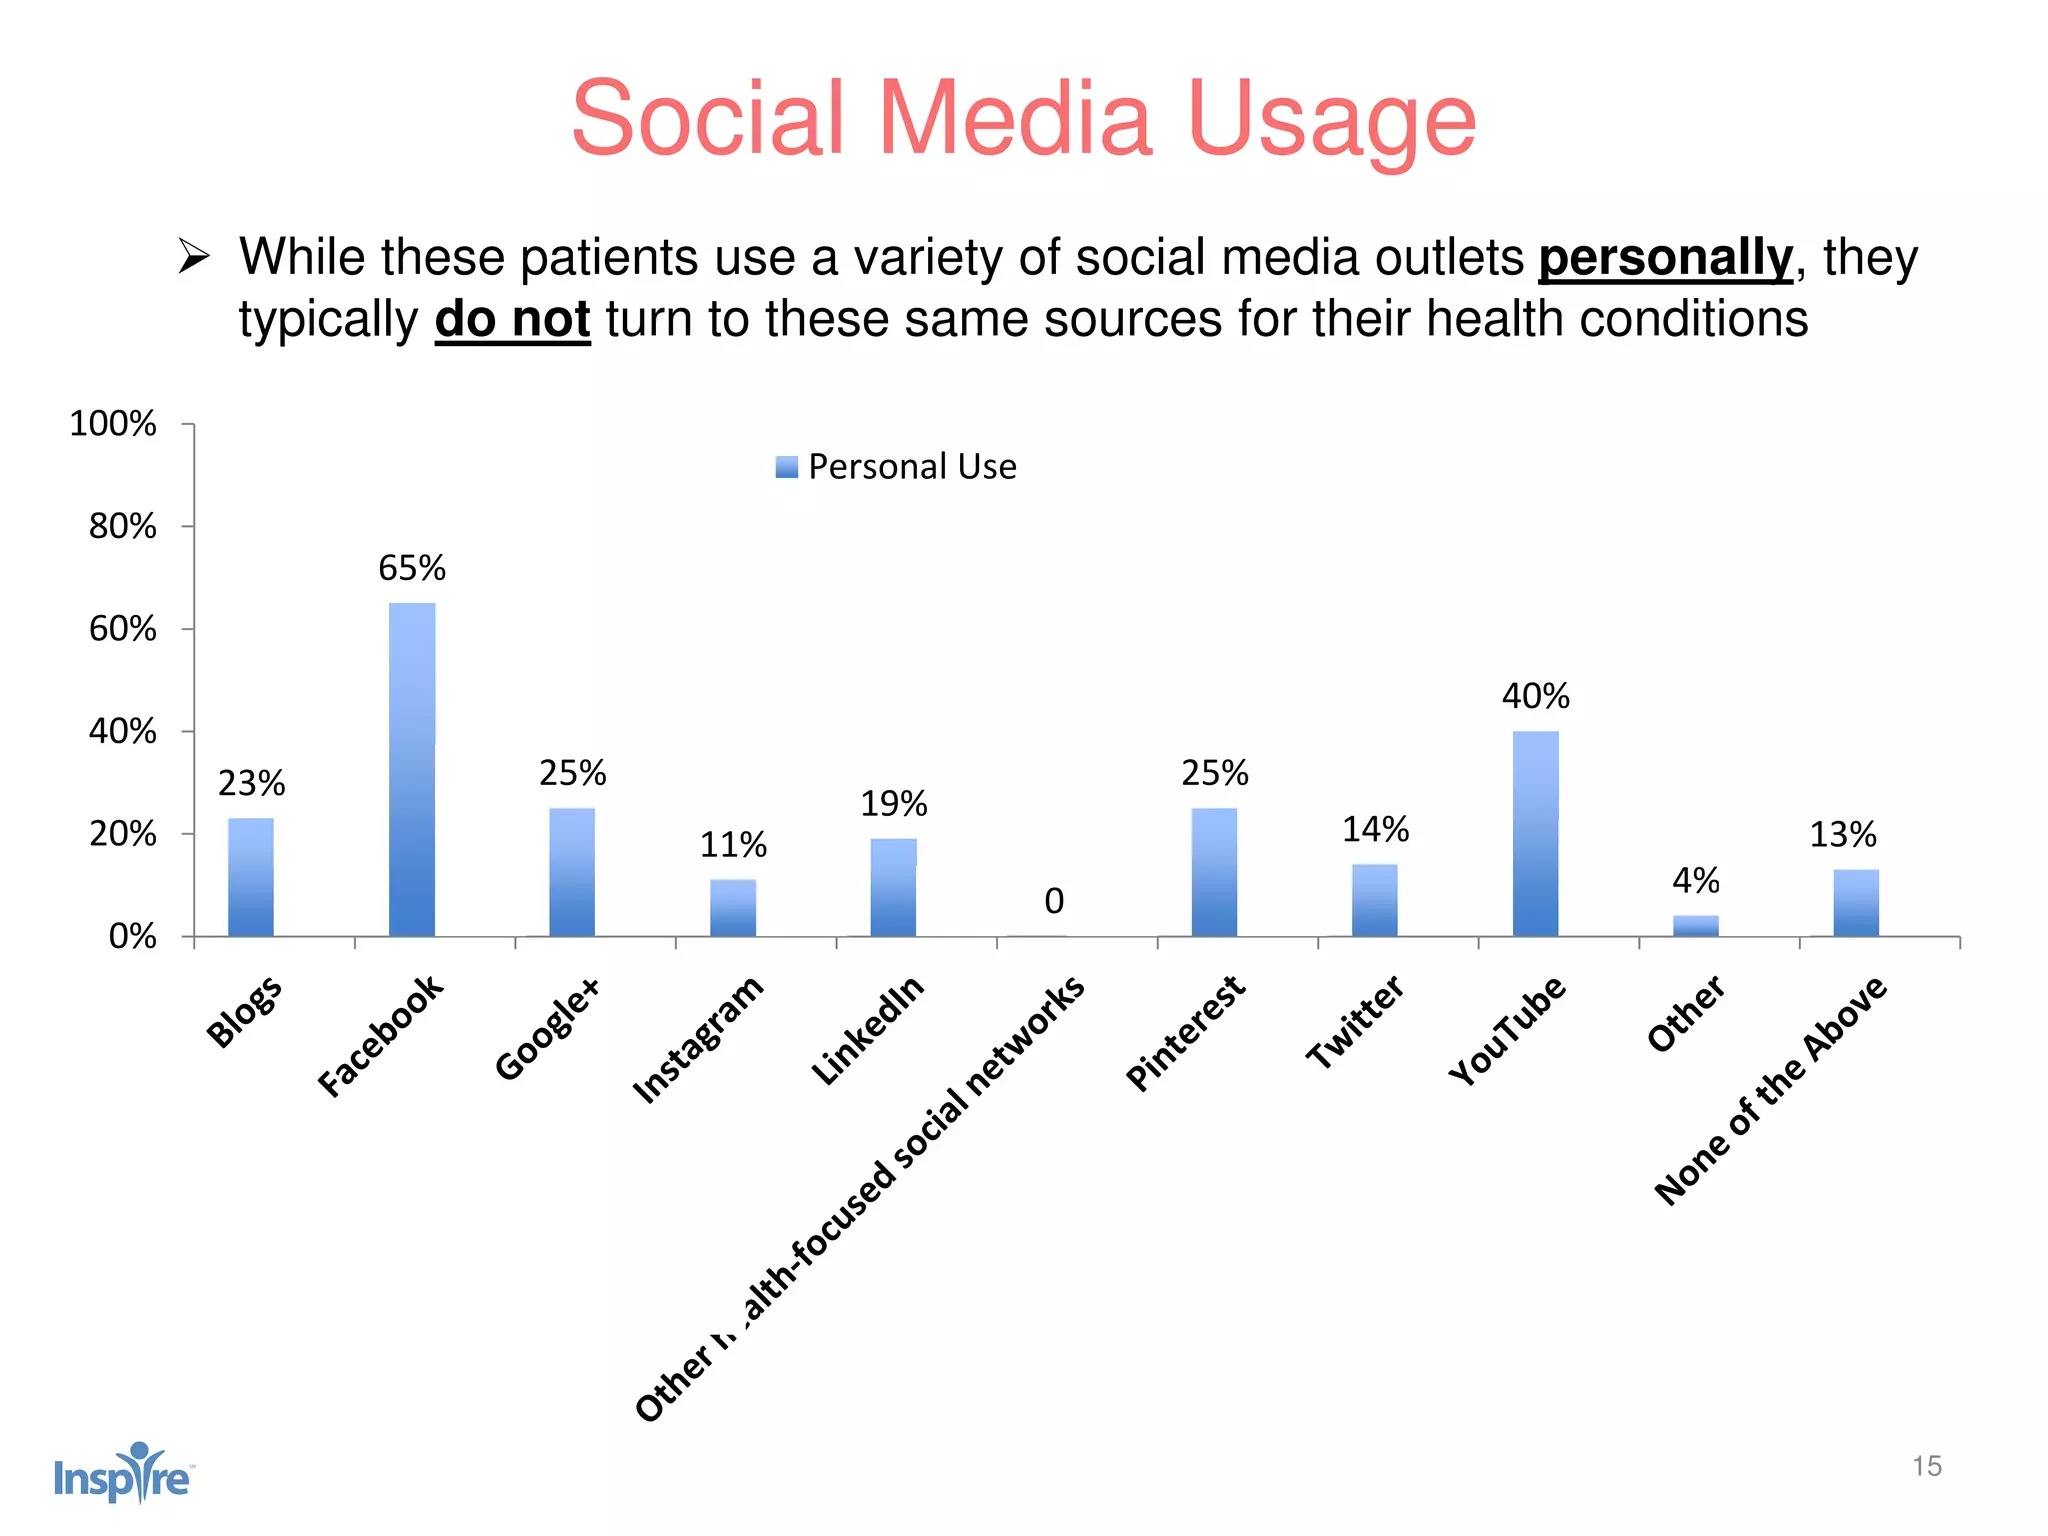
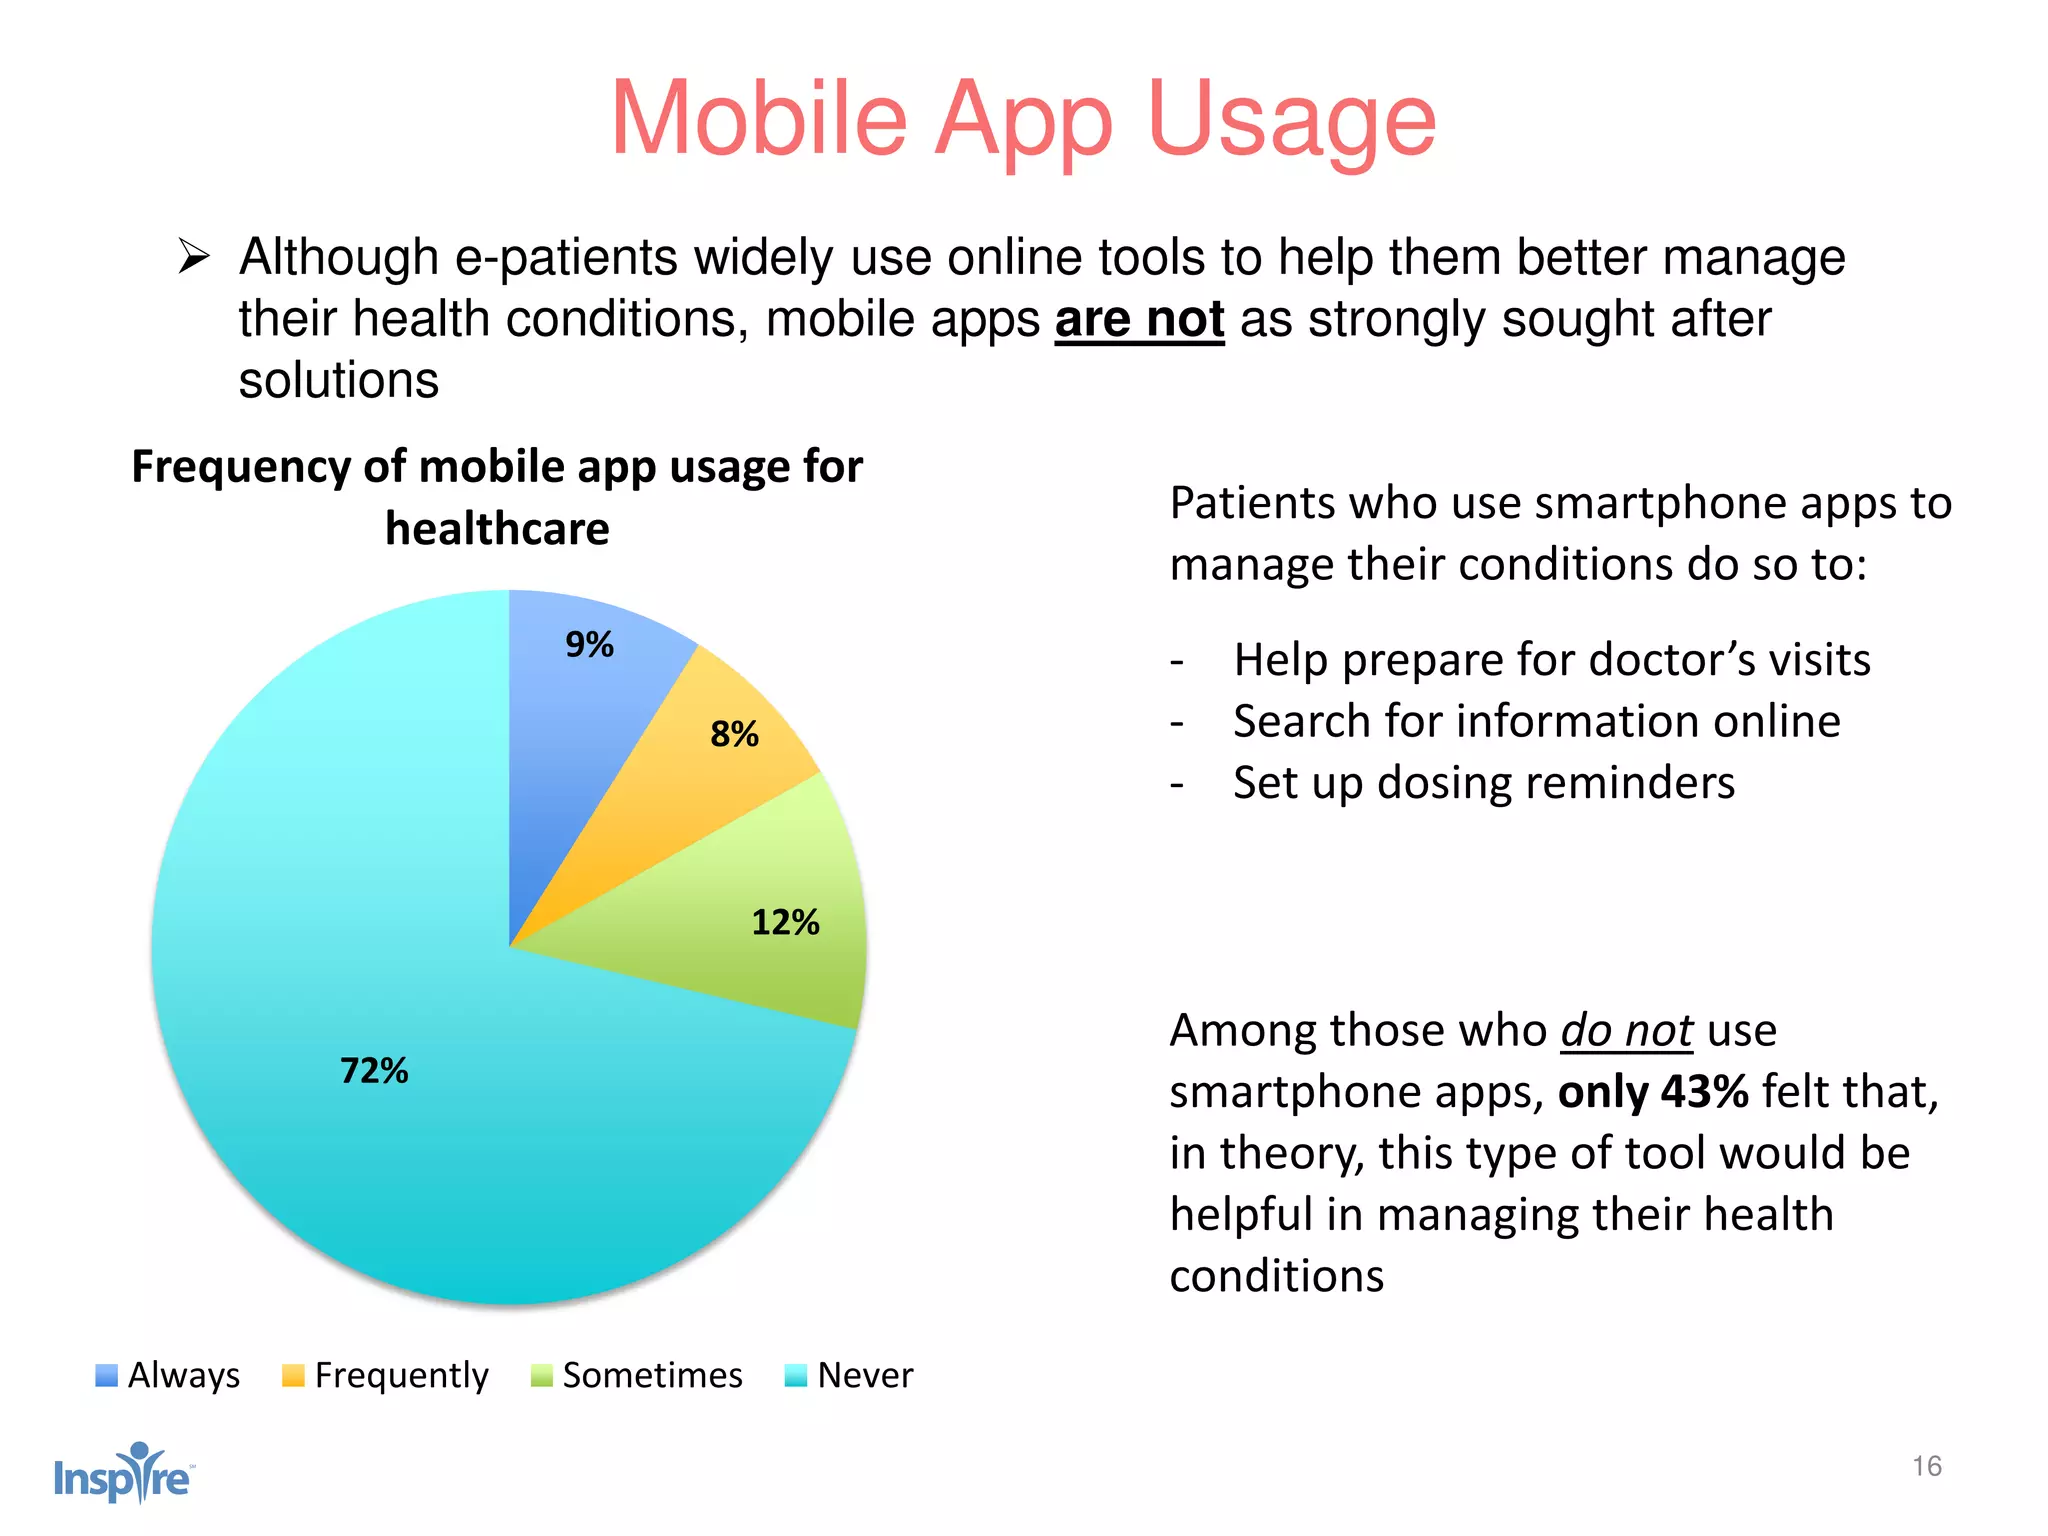
Insights into the e-Patient:
An Analysis of the Inspire Annual Survey
iPharma
May 15, 2015
2
► 2014 Inspire Annual Patient and Caregiver Survey
Background
► Survey Insights
• The Role of Patients (and other Stakeholders)
• Current Gaps between Patients and the Industry
• Possible New Marketing Channels for Increased
Patient Engagement
► Q & A
Agenda
5 minutes
25 minutes
10 minutes
2014 Inspire Annual Patient and
Caregiver Survey Background
4
 Purpose: To bring the perspectives of e-
patients to life on a large scale
 Launch: After several months of planning
and design, Inspire began sending survey
invitation emails to its members on
December 11, 2014.
 Fielding: In order to reach the ~490,000
members who have opted to receive such
communications, invitations had to be sent
evenly through December 23rd.
 Closing: The survey was officially closed
on January 8, 2015.
 Impact: During the month in which the
survey was available, 13,633 Inspire
members completed the assessment.
Annual Survey Background
5
 Inspire members (and survey respondents) are primarily patients and
caregivers with the inclusion of some ‘health advocates’
 Respondents are primarily from the U.S. but do represent 100 countries
and 6 continents
 Average age of survey respondents was 53.6
 Gender split was largely (~75%) female and only ~25% male
 Using ICD-9/10 codes as a guide for categorization, the top-5 most
common health areas represented by survey respondents were:
 Oncology (5,557 respondents)
 Autoimmune (3,793 respondents)
 Metabolic (2,881 respondents)
 Neurological (2,625 respondents)
 Respiratory (2,214 respondents)
Annual Survey Respondent Overview
Survey Insights: The Role of Patients
(and other Stakeholders)
7
 Those with ‘more serious’
health conditions (Oncology,
Neurological, Respiratory)
attend doctor’s visits with
someone else more
frequently than those with
chronic health issues such
as Autoimmune or
Metabolic-related disorders
Doctor Visit Dynamics
30% ALWAYS go to doctor’s
appointments with someone else
25% FREQUENTLY go to
doctor’s appointments with
someone else
31% SOMETIMES go to doctor’s
appointments with someone else
14% NEVER go to doctor’s
appointments with someone else
 When going to see their doctor, these patients regularly attend their
appointments with someone else
8
These patients/caregivers are largely
responsible for initiating new
treatment discussions, and…
Ask your doctor about…
52%
35%
5%
8%
You A doctor Other No new Tx discussions
29%
16%
31%
13%
11%
At every visit Every other visit
A couple times a year Once a year
Never
…will ask about new treatments and
fairly frequently
9
 The e-patient plays a large role in making treatment decisions,
regardless of the health condition(s) which affect them
Making Treatment Decisions
In collaboration: 69%
Patient-driven: 20%
MD-driven: 11%
Survey Insights: Current Gaps
between e-Patients and the Industry
11
 Despite the regular usage of their various medications, the majority of
respondents had limited, if any, knowledge of the pharmaceutical company
behind the production of their treatment
‘Brand’ Awareness in Pharma
35% didn't know
any of the pharma
companies that
make the products
they use
37% knew some
of the companies
that make the
products they
use
Only 10% knew all
of the pharma
companies that
make the products
they use
17% knew most
of the
companies that
make the
products they
use
12
 Although a patient-centric model is where healthcare in the U.S. is going,
there are serious inroads that must be made to strengthen the relationship
between patients and the industry
Relationship with Pharma
12% of respondents felt like they indeed had a relationship with the companies that made
their medications; at best, it is said to be a ‘limited’ connection
In contrast, 41% of respondents indicated they have a relationship with their pharmacist; in
these cases, the connection was considered to be ‘good’
Survey Insights: Possible New
Marketing Channels for Increased
Patient Engagement
14
 e-Patients turn to a number of online sources to obtain information about
their health conditions
Seeking Medical Information
1%
3%
11%
12%
22%
24%
27%
31%
38%
42%
49%
51%
76%
78%
0% 50% 100%
None
Other
Videos
In-person patient support groups
Support and advocacy groups
Nurses
Other patients
Friends and family
Materials provided by the doctor’s office
Books or magazines
Online support communities
Medical/scientific articles
Online search engines (e.g., Google, Bing)
Condition-specific websites or blogs
Sources of information used for health conditions
% of Responses
Condition-specific
websites or blogs
was also reported
to be the most
helpful source of
information used to
better understand
patients’ health
conditions
15
 While these patients use a variety of social media outlets personally, they
typically do not turn to these same sources for their health conditions
Social Media Usage
23%
65%
25%
11%
19%
0
25%
14%
40%
4%
13%
21% 25%
18%
1% 2%
28%
4% 2%
14%
4%
33%
0%
20%
40%
60%
80%
100%
Personal Use Medical Use
16
 Although e-patients widely use online tools to help them better manage
their health conditions, mobile apps are not as strongly sought after
solutions
Mobile App Usage
9%
8%
12%
72%
Frequency of mobile app usage for
healthcare
Always Frequently Sometimes Never
Patients who use smartphone apps to
manage their conditions do so to:
- Help prepare for doctor’s visits
- Search for information online
- Set up dosing reminders
Among those who do not use
smartphone apps, only 43% felt that,
in theory, this type of tool would be
helpful in managing their health
conditions
17
 While they are open to a variety of tools/materials to use with their
physicians, e-patients most widely preferred what they are most comfortable
with: electronic/online materials
Suggested Tools for Improved Healthcare
59% 57%
47%
42% 40%
0%
20%
40%
60%
80%
100%
Electronic, Detailed
Symptom Tracker
Access to online
webinars or in-person
conferences/speaker
sessions to learn
more about your
condition
Support materials for
friends/family
members detailing
your condition and its
symptoms
Printed, Detailed
Symptom Tracker
Tips/tactics around
better ways to
communicate with
your physician(s)
Recommended tools to help patients during doctor’s visits
% Responses
Q & A

Insights into the e-Patient: An Analysis of the Inspire Annual Survey

  • 1.
    Insights into thee-Patient: An Analysis of the Inspire Annual Survey iPharma May 15, 2015
  • 2.
    2 ► 2014 InspireAnnual Patient and Caregiver Survey Background ► Survey Insights • The Role of Patients (and other Stakeholders) • Current Gaps between Patients and the Industry • Possible New Marketing Channels for Increased Patient Engagement ► Q & A Agenda 5 minutes 25 minutes 10 minutes
  • 3.
    2014 Inspire AnnualPatient and Caregiver Survey Background
  • 4.
    4  Purpose: Tobring the perspectives of e- patients to life on a large scale  Launch: After several months of planning and design, Inspire began sending survey invitation emails to its members on December 11, 2014.  Fielding: In order to reach the ~490,000 members who have opted to receive such communications, invitations had to be sent evenly through December 23rd.  Closing: The survey was officially closed on January 8, 2015.  Impact: During the month in which the survey was available, 13,633 Inspire members completed the assessment. Annual Survey Background
  • 5.
    5  Inspire members(and survey respondents) are primarily patients and caregivers with the inclusion of some ‘health advocates’  Respondents are primarily from the U.S. but do represent 100 countries and 6 continents  Average age of survey respondents was 53.6  Gender split was largely (~75%) female and only ~25% male  Using ICD-9/10 codes as a guide for categorization, the top-5 most common health areas represented by survey respondents were:  Oncology (5,557 respondents)  Autoimmune (3,793 respondents)  Metabolic (2,881 respondents)  Neurological (2,625 respondents)  Respiratory (2,214 respondents) Annual Survey Respondent Overview
  • 6.
    Survey Insights: TheRole of Patients (and other Stakeholders)
  • 7.
    7  Those with‘more serious’ health conditions (Oncology, Neurological, Respiratory) attend doctor’s visits with someone else more frequently than those with chronic health issues such as Autoimmune or Metabolic-related disorders Doctor Visit Dynamics 30% ALWAYS go to doctor’s appointments with someone else 25% FREQUENTLY go to doctor’s appointments with someone else 31% SOMETIMES go to doctor’s appointments with someone else 14% NEVER go to doctor’s appointments with someone else  When going to see their doctor, these patients regularly attend their appointments with someone else
  • 8.
    8 These patients/caregivers arelargely responsible for initiating new treatment discussions, and… Ask your doctor about… 52% 35% 5% 8% You A doctor Other No new Tx discussions 29% 16% 31% 13% 11% At every visit Every other visit A couple times a year Once a year Never …will ask about new treatments and fairly frequently
  • 9.
    9  The e-patientplays a large role in making treatment decisions, regardless of the health condition(s) which affect them Making Treatment Decisions In collaboration: 69% Patient-driven: 20% MD-driven: 11%
  • 10.
    Survey Insights: CurrentGaps between e-Patients and the Industry
  • 11.
    11  Despite theregular usage of their various medications, the majority of respondents had limited, if any, knowledge of the pharmaceutical company behind the production of their treatment ‘Brand’ Awareness in Pharma 35% didn't know any of the pharma companies that make the products they use 37% knew some of the companies that make the products they use Only 10% knew all of the pharma companies that make the products they use 17% knew most of the companies that make the products they use
  • 12.
    12  Although apatient-centric model is where healthcare in the U.S. is going, there are serious inroads that must be made to strengthen the relationship between patients and the industry Relationship with Pharma 12% of respondents felt like they indeed had a relationship with the companies that made their medications; at best, it is said to be a ‘limited’ connection In contrast, 41% of respondents indicated they have a relationship with their pharmacist; in these cases, the connection was considered to be ‘good’
  • 13.
    Survey Insights: PossibleNew Marketing Channels for Increased Patient Engagement
  • 14.
    14  e-Patients turnto a number of online sources to obtain information about their health conditions Seeking Medical Information 1% 3% 11% 12% 22% 24% 27% 31% 38% 42% 49% 51% 76% 78% 0% 50% 100% None Other Videos In-person patient support groups Support and advocacy groups Nurses Other patients Friends and family Materials provided by the doctor’s office Books or magazines Online support communities Medical/scientific articles Online search engines (e.g., Google, Bing) Condition-specific websites or blogs Sources of information used for health conditions % of Responses Condition-specific websites or blogs was also reported to be the most helpful source of information used to better understand patients’ health conditions
  • 15.
    15  While thesepatients use a variety of social media outlets personally, they typically do not turn to these same sources for their health conditions Social Media Usage 23% 65% 25% 11% 19% 0 25% 14% 40% 4% 13% 21% 25% 18% 1% 2% 28% 4% 2% 14% 4% 33% 0% 20% 40% 60% 80% 100% Personal Use Medical Use
  • 16.
    16  Although e-patientswidely use online tools to help them better manage their health conditions, mobile apps are not as strongly sought after solutions Mobile App Usage 9% 8% 12% 72% Frequency of mobile app usage for healthcare Always Frequently Sometimes Never Patients who use smartphone apps to manage their conditions do so to: - Help prepare for doctor’s visits - Search for information online - Set up dosing reminders Among those who do not use smartphone apps, only 43% felt that, in theory, this type of tool would be helpful in managing their health conditions
  • 17.
    17  While theyare open to a variety of tools/materials to use with their physicians, e-patients most widely preferred what they are most comfortable with: electronic/online materials Suggested Tools for Improved Healthcare 59% 57% 47% 42% 40% 0% 20% 40% 60% 80% 100% Electronic, Detailed Symptom Tracker Access to online webinars or in-person conferences/speaker sessions to learn more about your condition Support materials for friends/family members detailing your condition and its symptoms Printed, Detailed Symptom Tracker Tips/tactics around better ways to communicate with your physician(s) Recommended tools to help patients during doctor’s visits % Responses
  • 18.

Editor's Notes

  • #8 55% of members go with someone else to doctor appointments on a regular basis While the frequency of using ‘the buddy system’ increases among older patients (41-50, 51-64, and 65+), it is not an overwhelming swing as one might expect
  • #9 52% of members said they typically initiate the discussion around new treatment options; doctors were responsible for this discussion in 35% of responses Patients with Neurologic Disorders are most likely to initiate new Tx discussions while MDs are most likely to start this convo for ONC patients 45% of members ask about other potential treatment options fairly frequently; in total, almost 90% of patients ask about other medications at least once a year Frequency of asking for new treatments does not vary notably between health issue groups Female patients are more likely to start the conversation around new Tx options than Male patients who are more willing to let their MD lead the discussion (54% vs. 47%) Patients at either end of the age spectrum (<30 y/o and >65 y/o) are more likely to let the MD guide the new Tx discussion while there is stronger PT direction among those between these two endpoints Younger patients (< 30 and 31-40) more frequently ask about new Tx options than older patients
  • #10 69% of members said they make treatment decisions in collaboration with their doctor 20% of members said that treatment decisions are made either “Entirely” or “Mostly” by them The remaining 11% of members said treatment decisions are made either “Entirely” or “Mostly” by their doctor Younger patients claim they play more of a role in driving Tx decisions; however, as the population ages, there is more of a focus on collaborative decision making
  • #12 There is slightly better, overall awareness of pharma manufacturers among Respiratory and Autoimmune patients Male patients have better awareness of which company(ies) make their treatments than Female patients
  • #13 Autoimmune patients were most likely to indicate that they have a relationship with the companies that make their medications (17% vs. 12% avg.) While the incidence of those who said that they felt they had a relationship with pharma didn’t increase with age, the ‘quality’ of these relationships improved, likely driven by increased utilization of various patient assistance programs Respiratory patients were most likely to indicate that they have a relationship with their pharmacist and more of them indicated that it was a ‘good’ relationship Female patients more frequently indicated they have a ‘relationship’ with their pharmacist than Male patients; the quality of these relationships is also slightly better among women While the quality of patients’ relationships with their pharmacist doesn’t improve over time, the amount of patients who do have a relationship with their pharmacist does – likely driven by an increased frequency of visits to pharmacy and increased medication regimens
  • #15 Interestingly, the overall usage of Condition-specific websites or blogs INCREASES among older patient populations
  • #16 Usage of social media is much greater among women than men, both personally and for health purposes. There are only a few outlets where Men are just as, if not more, active than women LinkedIn and Google+ Personal, social media usage is also strongest among younger patients with steep drop offs occurring with older age groups starting at 41+ Social media usage for health purposes, stays relatively consistent as patients age, until you get to the 65+ age group.
  • #17 While mobile app usage is more common among younger patients than older ones, (42% - <30 y/o; 18% - >65 y/o), this is still a largely untapped frontier in healthcare Among the key drivers of why patient’s don’t/won’t use a mobile app for healthcare are 1) lack of ownership of a smartphone (finances) and 2) privacy concerns – not only with what information they are putting out there on their phone, but also the concern of someone picking up their phone and accessing sensitive information via the app
  • #18 Consistent with the previous slides, as patients age, there is less insistence on an electronic symptom tracker; however, all other solutions remain viable options