Infographic - Macedonia - 2015 Annual Report on the State of Philanthropy
•
0 likes•78 views

Infographic for Macedonia 2015 Annual Report.
Recommended

Recommended
More Related Content
Similar to Infographic - Macedonia - 2015 Annual Report on the State of Philanthropy
Similar to Infographic - Macedonia - 2015 Annual Report on the State of Philanthropy (20)
More from Catalyst Balkans
More from Catalyst Balkans (20)
Recently uploaded
Recently uploaded (20)
Infographic - Macedonia - 2015 Annual Report on the State of Philanthropy
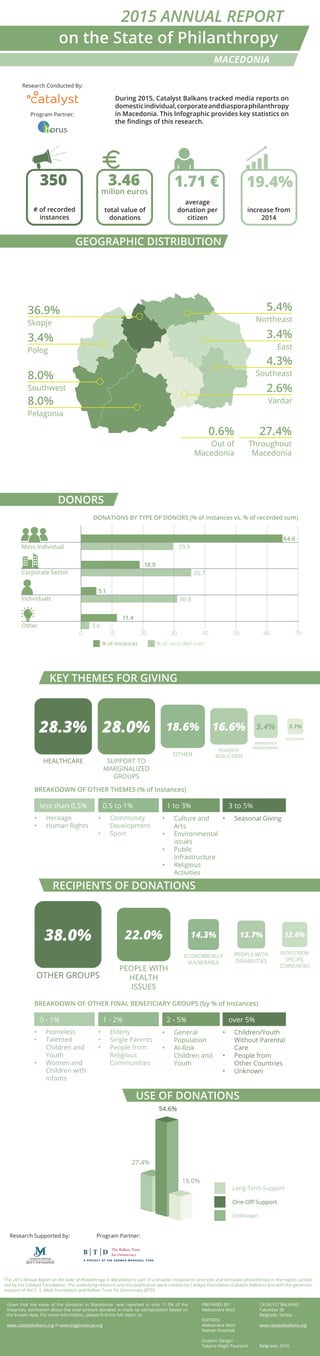
- 1. on the State of Philanthropy MACEDONIA 2015 ANNUAL REPORT During 2015, Catalyst Balkans tracked media reports on domesticindividual,corporateanddiasporaphilanthropy in Macedonia. This Infographic provides key statistics on the findings of this research. GEOGRAPHIC DISTRIBUTION DONORS KEY THEMES FOR GIVING RECIPIENTS OF DONATIONS USE OF DONATIONS Given that the value of the donation in Macedonia was reported in only 11.9% of the instances, estimation about the total amount donated is made by extrapolation based on the known data. For more information, please find the full report at: www.catalystbalkans.org ili www.tragfondacija.org PREPARED BY: Aleksandra Vesić EDITORS: Aleksandra Vesić Nathan Koeshall Graphic Design: Tatjana Negić Paunović CATALYST BALKANS Takovska 38 Belgrade, Serbia www.catalystbalkans.org Belgrade, 2016 DONATIONS BY TYPE OF DONORS (% of instances vs. % of recorded sum) 3.46 total value of donations milion euros 19.4% increase from 2014 350 # of recorded instances 1.71 € average donation per citizen The 2015 Annual Report on the State of Philanthropy in Macedonia is part of a broader initiative to promote and stimulate philanthropy in the region carried out by the Catalyst Foundation. The underlying research and this publication were created by Catalyst Foundation (Catalyst Balkans) and with the generous support of the C. S. Mott Foundation and Balkan Trust for Democracy (BTD). 5.4% Northeast 3.4% East 4.3% Southeast 2.6% Vardar 36.9% Skopje 3.4% Polog 8.0% Southwest 8.0% Pelagonia 27.4% Throughout Macedonia 0.6% Out of Macedonia Individuals Other Corporate Sector Mass Individual 64.6 0 10 20 30 40 50 60 70 29.9 18.9 35.7 5.1 11.4 30.8 3.6 % of recorded sum% of instances HEALTHCARE 28.3% SUPPORT TO MARGINALIZED GROUPS 28.0% OTHER 18.6% EMERGENCY MENAGEMENT 5.4% POVERTY REDUCTION 16.6% EDUCATION 3.1% BREAKDOWN OF OTHER THEMES (% of Instances) less than 0.5% • Heritage • Human Rights 0.5 to 1% • Community Development • Sport 1 to 3% • Culture and Arts • Environmental issues • Public Infrastructure • Religious Activities 3 to 5% • Seasonal Giving ECONOMICALLY VULNERABLE 14.3% PEOPLE WITH DISABILITIES 13.7% PEOPLE FROM SPEC.IFIC COMMUNITIES 12.6% OTHER GROUPS 38.0% PEOPLE WITH HEALTH ISSUES 22.0% BREAKDOWN OF OTHER FINAL BENEFICIARY GROUPS (by % of Instances) 0 - 1% • Homeless • Talented Children and Youth • Women and Children with Infants 1 - 2% • Elderly • Single Parents • People from Religious Communities 2 - 5% • General Population • At-Risk Children and Youth over 5% • Children/Youth Without Parental Care • People from Other Countries • Unknown 54.6% 18.0% 27.4% Unknown One-Off Support Long-Term Support Research Supported by: Program Partner: Research Conducted By: horushorus Program Partner: