Download to read offline
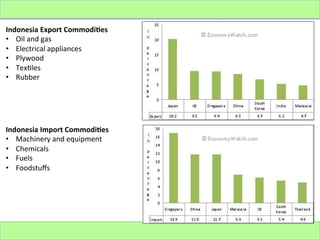
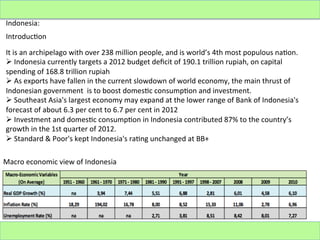
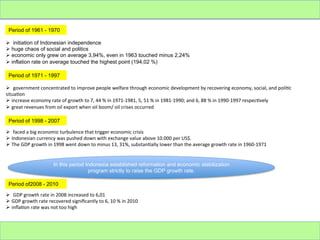
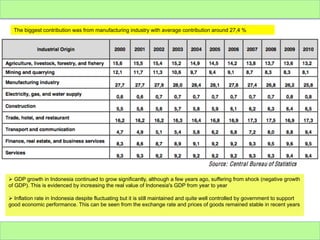

Indonesia is an archipelago nation with over 238 million people and is a major exporter of oil, gas, electrical appliances, plywood, and textiles. It imports machinery, chemicals, fuels, and foodstuffs. While Indonesia has experienced periods of economic turmoil, its GDP growth has continued to increase in recent years, averaging around 6% annually. However, challenges remain such as corruption, unemployment, and reducing dependence on exports for economic growth.


