SlideShare a Scribd company logo
1 of 83
Individual Strategic Analysis
Royal Dutch/Shell Group
Table of Contents
I. Introduction
A. Business Case
B. Problem Statement
C. Mission Statement
D. Vision Statement
II. External Assessment
A. General Environment
1. Economic
2. Demographic
3. Socio-cultural
4. Technological
5. Regulatory/Political
6. Global
7. Environmental
B. Competitive Environment
1. Industry Analysis
a. Economic Structure
b. Life Cycle Stage
c. Porter 5 Forces Model
d. Industry Attractiveness
2. Competitor Analysis
a. Key Success Factors
b. Strategic Group Analysis
c. Competitor Analysis Model
III. Internal Assessment
A. Nature of the Firm
1. Culture & Leadership
2. Corporate Makeover
3. Organizational Structure
B. Value Chain Analysis
1. Inbound Logistics
2. Operations
3. Outbound Logistics
4. Marketing & Sales
5. Service
C. Core Competence
D. Financial Ratio Analysis
IV. Strategic Choice
A. SWOT Analysis
1. General Strategic Orientation
2. Grand Strategy Clusters
3. Grand Strategy Selection Matrix
B. Generic Strategy
C. Recommendations
1. Corporate Level Strategy
2. Business Level Strategy
V. Managerial Implications
A. Implementation Issues
Reference Section
I. Introduction
A. Business Case
In a most unique arrangement, the Royal Dutch/Shell Group of
Companies consists of two publicly traded companies that
maintain their own distinct identities. The Royal Dutch
Petroleum Company merged with the Shell Transport & Trading
Company, p.l.c. in 1907 to contest the overwhelming power of
John D. Rockefeller’s Standard Oil.
This Anglo-Dutch alliance has grown into the second largest
integrated oil firm in the world behind Exxon, and is the market
leader in Europe.
Today, the Royal Dutch/Shell Group (hereafter, referred to as
The Group) has operations in oil, natural gas, chemicals, coal
and other businesses. Neither Royal Dutch nor Shell is directly
involved in the Group’s operations but own interests in the
Group’s holdings on a 60:40 basis, respectively.
The Group’s total revenue, or Net Proceeds, totaled ₤82.1
billion (pounds) or $128.3 billion (US dollars).
Competing in such a vertically integrated industry, the Group
is involved in everything from discovering and producing their
own raw materials (upstream operations) to converting them
into useful products and bringing them to consumers all over
the world (downstream operations). With over 101,000
employees operating in 129 countries
, Royal Dutch/Shell is emblematic of what it means to truly be a
global company.
B. Problem Statement
Royal Dutch/Shell is faced with the same epidemic that other
oil companies are currently facing in Europe: over-capacity.
The problem for these firms is how to maintain growth and
improve profitability in a mature market. Additionally, the
Royal Dutch/Shell Group has their own individual corporate
dilemma, which revolves around their cash flows and
efficiencies. The Group indeed has a strong balance sheet and
is financially sound but must decide what to do with their
immense surplus of cash. Also, they are determined to increase
their most coveted measure of operational success: Return on
Average Capital Employed.
C. Mission Statement
The Royal Dutch/Shell Group does not have a distinct mission
statement. Throughout my research of the company’s
operations, performance, and culture, I would recommend the
following as a fitting mission statement:
“Our mission is to provide the world with sustainable forms of
energy. Our global workforce is dedicated to providing above-
average returns to our investors through continued operational
excellence. We will continue to adapt to the evolving global
economy, technological advances, and the ever-changing
resources of the Earth with the utmost regard for the greater
good of the environment and society at large.”
C. Vision Statement
Likewise, there is no official vision statement for the Royal
Dutch/Shell Group. Based on my knowledge of the company, I
would recommend the following as its vision statement:
“To become the world’s preeminent energy company.”
II. External Assessment
A. General Environment
1. Economic
Opportunities:
· Oil prices increased during 1996.
1. Benefits integrated oil companies overall.
2. Specifically helps Exploration & Production companies.
3. Increased oil prices hurt Refining & Marketing profits.
· European Intergovernmental Conference held this year (1996)
could lead to some economic recovery; two main issues to be
covered will be:
4. Review of the Maastricht Treaty
5. Expansion of the European Union to both the east and south
· Some potential signs of a modest economic upturn in European
Union.
· GDP increased 0.5% in 1st Quarter of 1996 in 15 EU States.
· Exports have grown larger than imports over the last five
years.
Threats:
· Slow economic growth throughout European Union
· Growth rate is down from 4% to 2.5% per year over last two
decades.
· Gross Domestic Product of fifteen EU countries is 6,910,477.
· GDP/PPS (purchasing power standards) per head is 18,446;
which accounts for discrepancies in currencies.
· Consistently high unemployment
· Average of the fifteen European Union countries is 10.8%.
· Average of the eleven EU states in the “eurozone” is 11.5%.
· Country-specific inflation problems across Europe.
· Productivity growth is steadily declining.
· Difficulty financing new projects.
2. Demographic
Opportunities:
· Population of 15 EU countries is 372.7million people.
· Industry Breakdown
· 6.9 million employed in agriculture
· 45.4 million employed in industry
· 102.7 million employed in services
Threats:
· 55% of consumers choose oil and gas based on location and
convenience.
· Many low-income families
· 36% of single parents with children live in low-income
housing.
· 17% of total population lives in low-income housing.
· Monthly net income and purchasing power of two manual
workers with average salaries ranges has decreased from 1995
to 1996.
· Population growth rate has dropped 2.5% over last two years
(1995-96).
3. Socio-cultural
Opportunities:
· Creation of the ICEM (International Federation of Chemical,
Energy, Mine and General Workers’ Union)
· Equal opportunities for men and women
· Creation of jobs-first priority
Threats:
· Europeans drive more fuel-efficient cars than Americans. The
mini-car market is the most crowded in Europe.
· New European culture discourages wastefulness of any kind.
4. Technological
Opportunities:
· New refining catalysts increase selectivity, and plant and
process reliability.
· Due to technological advances in the areas of exploration and
production, the cost of finding and developing a barrel of oil,
known as the reserve replacement cost, is decreasing for those
firms that exploit the new technologies. “These costs should
drop further due to technological advances that enhance
ultimate recoveries of oil and gas from existing wells, as well as
more efficient methods of finding new reserves.”
· New Drilling Systems, new wireline tools, new drilling muds
and cements, coiled tubing, increasingly sophisticated seismic
analysis, improved data management, and new developments in
rig maintenance.
Threats:
· Development of coal, liquefied natural gas, and nuclear power
as substitute energy sources.
· Improved technology of wind generators, solar power, and
nuclear power
5. Regulatory/Political
Opportunities:
· Maastricht Treaty
· Unifies EU countries for free trade.
· Individual member states’ retain unique economic identities.
· Thus far, European Union cooperation shows early signs of
success.
· European Commission introducing the creation of the “euro”
· Through enlargement, the European Commission wants to
extend stability, increase competition and grow in general in all
areas.
Threats:
· Potential Currency Implementation Risks
· Single currency could fail and hurt the overall economy and
governments of the nations involved in the European
Commission.
· Disinterest in the euro may hurt its circulation altogether.
Some companies may not want to be involved in using the euro.
· Any significant changes in fundamental values between union
states or conflicts could potentially weaken the EU’s
cohesiveness.
· Some policies favor coal and other energy sources over oil
(i.e. heavy taxes).
6. Global
Opportunities:
· North American SUV’s becoming popular and are less fuel-
efficient.
· Latin American has stable inflation helping economic activity
and petroleum consumption.
· Relaxation of control over markets in China and Asia will
boost demand for oil.
· Once restructuring and deregulation happen in Japan, greater
competition will occur stimulating more consumption, and thus
more oil.
Threats
· North American economy becoming more efficient which
means there is less energy needed for businesses to perform
same operations.
· Japan only uses fuel for 30% of energy (most common are
coal, natural gas, and nuclear); competition will put downward
pressure on price of oil.
· Former Soviet Union is in shambles and energy consumption
is falling.
· Political turmoil in Africa and the Middle East has blocked
significant economic growth.
7. Environmental
Opportunities:
· There are no identifiable opportunities at this time. The
European Union is continuing to strengthen their environmental
protection policies.
Threats:
· Environmental consciousness has risen worldwide.
· The EU has extremely high air quality standards and enormous
investments are needed to meet these standards.
· The main threats to Europe’s air quality are nitrogen oxide,
carbon monoxide, benzene and carbon dioxide.
· The Auto-Oil is a study with a target of long-term pollution
cuts.
.
The oil industry is facing many viable threats in the general
environment. Mature economies have made use of the latest
technologies to become more efficient and thus require less oil
consumption. It is becoming more costly for oil companies to
keep up with new environmental legislations. The European
economy is continuing to decline with slow growth and
consistently high unemployment. European consumers are
purchasing oil and gas based on location and convenience rather
than brand equity. However, the recent formation of the
European Union and the anticipated introduction of their single
monetary currency, the ‘euro’, will hopefully open the door to
increased trade between member states and boost the European
economy.
B. Competitive Environment1. Industry Analysis
Economic Structure
The Royal Dutch/Shell Group competes with the other major
international integrated oil firms that dominate the world oil
market. Included in this strategic group are Exxon, Mobil,
Chevron, Texaco, Amoco, and British Petroleum.
This industry’s economic structure is an archetypal tight
oligopoly that is entering its second phase of consolidation.
Life Cycle Stage
The integrated oil industry is clearly in maturity, as indicative
of the problematic overcapacities where demand has failed to
match supply and profit margins are dropping in Europe as well
as many other developed economies.
The industry is also beginning its second phase of
consolidation where the larger integrated companies are
acquiring various smaller national and regional oil companies to
gain market share and achieve higher economies of scale.
PORTER 5 FORCES MODEL
Threat of New Entrants
· High Capital Requirements: “Opening a new refinery took a
long time and cost billions of dollars.”
The vast amount of expenses related to exploring, drilling,
refining, and marketing would deter most new entrants.
· Economies of Scale: For every gallon of oil a company
produces, the price goes down until the market reaches an
equilibrium price. Most new entrants would not be able to
remain profitable because the larger oil conglomerates have the
advantage of the most efficient profit margins.
· Expected Retaliation: If a new entrant were to enter the
market, the major international integrated oil companies could
cut prices and incur short-term losses to edge new competitors
out of the market.
· Highly Regulated Industry: Federal Energy Regulatory
Commission (FERC) regulates oil industry within the United
States. European Commission regulates economic concerns in
Europe. Organization of Petroleum Exporting Countries
(OPEC) influences world supply and pricing of oil. Brussels
European Petroleum Industry Association as well as London’s
Exploration and Production Forum are both involved with
regulating the oil industry in Europe.
· Low Differentiation: It is difficult for consumers to
differentiate between oil, making the industry’s end product a
commodity. The only method of differentiation that exists is in
creating brand equity at gas stations based on cleanliness,
space, and service. This opens the door to the growing amount
of supermarkets offering gas based on price and convenience.
Summary: With respect to the nature of competition within the
integrated international oil conglomerates, the barriers to entry
are very high. A new entrant would have an extremely difficult
time establishing new refineries, exploration and drilling sites,
and so forth. However, the growing number of supermarkets
entering the market on the retail level is a microcosm of the
industry’s problems in Europe. In this particular market, the
barriers to entry are lower and supermarkets (although not
within BP & Mobil’s strategic group) have certainly threatened
the retail market share of oil in Europe.
Bargaining Power of Suppliers
· Buyer Importance: All of these major oil conglomerates would
make up a large portion of a supplier’s total sales because of the
sheer size of their organization’s needs.
· Low Threat of Forward Integration: It is highly unlikely for
one of Royal Dutch’s suppliers to pose a serious threat of
acquiring a major international integrated oil conglomerate in
an effort to integrate forward.
· Suppliers’ Products Have Few Substitutes: Unless there is
some unforeseeable technological advance that replaces the
need for drilling machines and oil rigs, oil companies have little
choice in finding a substitute for suppliers’ products.
· Power of OPEC: OPEC controls 40% of the world’s oil
production and about two-thirds of the world’s oil reserves.
The supply of oil from member countries within OPEC is
controlled and regulated so that the benefit lies with those
countries. While British Petroleum and Mobil are not directly
supplied with oil from OPEC in the physical sense, OPEC
controls the production levels and pricing of oil. In an effort to
protect their own interests, OPEC member countries strive to
gain “a fair return on capital to those investing in the petroleum
industry.”
Whereas the non-OPEC countries, particularly those in the
Organization of Economic Cooperation and Development, are
the primary consumers of most of the world’s oil supply.
Summary: Because the oil industry is such a highly vertically
integrated industry, it has less reliance on suppliers than a
traditional company that puts their product on the shelf of a
store. Therefore, the physical suppliers of machinery and tools
to major integrated oil companies have little overall power.
However, OPEC’s presence plays a significant role in the
supply (more importantly, the pricing) of oil extracted from
these member countries. “OPEC’s degree of success in
balancing the market will be a key to prices.”
As an indirect supplier, OPEC has an overwhelmingly
important role in the production, pricing, and overall supply of
oil to the world.
Bargaining Power of Buyers
· Product is Undifferentiated: To the buyers’ advantage, oil and
its byproducts are commodities and cannot be highly
differentiated. While many gas stations at the retail level may
try to differentiate their stations based on space, cleanliness,
and overall quality of service, the end product (gasoline) that
consumers put in their cars are homogeneous.
· Buyers Face Few Switching Costs: There are relatively few
switching costs involved in the oil industry. At the retail level,
a buyer (who is actually a consumer at the same time) can
switch from Shell to Mobil with no switching costs. At the
wholesale level, utility companies have some contractual
obligations to satisfy but switching between oil companies is
not drastically difficult.
· Low Threat of Backward Integration: It is highly unlikely that
buyers could have the power (and cash) to vertically integrate
backwards and acquire Royal Dutch. For example, during both
oil shocks of the 1970’s, gasoline prices were through the roof
and cars were lined up around the corner from the gas stations.
Consumers and corporations could not and did not band together
and demand lower prices or higher quality because the power
lied with the oil companies. An asset to these large oil firms is
that the demand for their product is relatively inelastic. When
the economy is in a recession and money is tight, consumers
will stop buying luxury items, but they still fill their cars with
gas and heat their homes.
· Buyers Do Not Make Up Large Fraction of Suppliers’ Sales:
The amazing scope of Royal Dutch’s sales reach millions of
industries, corporations, and individuals all over the world.
Their size and diversification works to their advantage because
they do not rely heavily on one specific buyer for a large
percentage of their overall sales.
· Worldwide Demand for Oil: As the graph depicts, trends
indicate that the world demand for oil is steadily rising each
year.
Short-term volatility exists in the energy market but the graph
illustrates the world’s continued reliance on oil.
Summary: The overall bargaining power of buyers in this
industry is relatively low. Buyers of these oil conglomerates do
not have the power to bargain down prices or force higher
quality. Generally, a buyer does not have the bargaining power
to have competing oil firms continually fight over a customer
because no one customer makes up that large fraction of sales.
The only serious potential threat that buyers pose in this
industry is the overall worldwide demand for oil. Although the
demand for oil is still increasing, the potential threat of these
buyers would lie solely with the overall need and demand for
oil. For example, if worldwide demand for oil plummeted
because of some new substitute for oil (to be discussed next),
this would have a powerful effect on the oil industry.
Threat of Substitute Products
· Alternative Forms of Energy
· Natural Gas: Many companies and countries, specifically in
the West, are diversifying their energy sources by increasing the
levels of natural gas to offset the volatility of oil prices. “In
terms of market share, natural gas has grown from 19% to 23%
in the past 20 years, while oil has declined from 49% to 40%,
and coal from 30% to 27%.”
Natural gas is more environmentally sound than oil and is also
cheaper to produce. “In the foreseeable future, we expect
natural gas consumption worldwide to grow at about three times
the rate of crude oil usage.”
· Gasification: Integrated Gasification Combined Cycle (IGCC)
is a process that transforms a solid, gas, or liquid into a useful
form of energy through an oxidation process. Additionally,
gasification does not have the heavy cleanup costs that current
energy producing systems have because “the wasted heat from
the turbines raises steam, which may be put into a steam turbine
to make more electricity.”
· Wind Power: While not as dominating as natural gas, the
introduction of wind power as an alternative source of energy
has been increasing greatly, particularly in Europe. “After
surpassing the US in 1994, European production has been
growing at breakneck speed. As a result, the Brussels project
that had aimed at providing 2 percent of the European energy
needs with Aeolian or “wind” energy by the year 2005 has been
amply exceeded.”
· Solar Power: It is clear to scientists that the power provided
by the sun is a major alternative source of energy. “In just half
an hour enough of the sun’s energy is received by the earth to
power mankind’s activities for a whole year.”
However, the ability to capture this energy and make it
compatible is easier said than done. There has been an
increasing number of solar panel additions for home heating,
but less of a spark over the once popular innovative idea of
solar powered cars.
· Long-term Vision of Potential Market Threats: In an effort to
avoid self-indulgence, large internationally integrated oil
companies cannot be naive to the fact that some day the world
will run out of oil. There is a finite amount of oil in this world,
which cannot be recycled, and our society continues to rely
heavily on oil as a primary resource. In order to effectively
strategize for the future, major oil companies must keep this in
the back of their heads so they will not dissolve when the oil
industry reaches decline. Rather, they must be thinking about
solutions to alternative forms of power now.
Summary: The overall threat of substitute products for the
foreseeable future is moderate. Despite what some have
speculated, oil is expected to remain the main energy source in
Europe and the rest of the world. There have been suggestions
that the oil industry should be aware of the threat of substitute
products, such as alternative fuels and energy sources. These
warnings, however, have been disregarded for the foreseeable
future, although many believe the threat of substitute products
will become eminent sometime in the 21st Century.
Level of Competitive Rivalry – Cutthroat Competition
· Slow Growth Industry in a Tight Oligopoly: As mentioned, BP
& Mobil are competing in a tight oligopoly of firms that are
very balanced and diversified with deep pockets. Additionally,
being in the maturity phase of the life cycle provides for smaller
growth throughout the industry since supply has begun to
outstrip demand.
· High Storage Costs: There are high costs involved in storing
oil and its byproducts. As the industry continues to struggle
with overproduction in the European oil market, reliance on
storage has become more and more expensive.
· Lack of Differentiation: The oil market is undifferentiated on
product quality because oil is a commodity. The only source of
differentiation for these companies is with support services but
not the direct product itself.
· Price Wars: There is intense price competition between service
stations and the growing number of supermarket stations. These
supermarket stations are capitalizing on the overcapacity of oil
producers and using this to their advantage. With overcapacity
in Europe, the supply curve shifts to the right, hence lowering
the price supermarkets pay for their gasoline. The large
integrated oil firms such as Royal Dutch/Shell continue to
produce a large amount of oil because if they produce any less
it will be cost inefficient. Additionally, the supermarkets were
wise enough to sell their gas at cheaper prices in order to gain
market share over the integrated oil companies.
· Capacity Added in Large Increments: The clear-cut problem
facing the oil industry, particularly in Europe, is the
overcapacity of oil firms where demand has failed to match
supply.
· Diverse Competitors: Participating in a global industry, these
international integrated oil companies focus on various aspects
of what is referred to as the “oil business”. These oil
conglomerates focus on everything from exploration and
production, to drilling, refining and marketing. This once again
illustrates how vertically integrated the oil industry has become.
· High Strategic Stakes: An industry that is in the earlier stages
of its life cycle experiencing low levels of competitive rivalry
would have less at stake when making a strategic shift. The oil
industry, however, has very intense rivalry between firms; and
therefore there are very high strategic stakes involved with each
managerial decision and strategic move.
· High Exit Barriers:
· Specialized Assets: Specialized assets in this industry include
expensive oil rigs and refineries that would likely be difficult to
sell. Because of this difficulty, a company leaving the industry
would suffer a substantial loss when ridding themselves of these
assets.
· High Fixed Cost of Exit/Government Regulation: “Some
companies might abandon Europe were it not for the
extraordinary high cleanup costs involved.”
Europe has strict regulations on the cleanup of industrial sites.
Industry experts have described the cost of complying with
these regulations horrendous. “And the benefits of closing a
refinery will accrue to the whole industry, i.e., to a firm’s
rivals: as European output falls, their margins should rise.
Therefore, while moaning about overcapacity, the oil companies
prefer to hope that others will cut back first.”
· Emotional Barriers: “But, on top of any rational case for
holding on to refineries, Western oilmen may also be suffering
form a touch of nostalgia. For decades, being an oil major has
meant controlling the flow of oil at all stages from well to
petrol pump…They are being asked to drop a once-vital link in
their much-cherished chain.”
Summary: The international integrated oil industry is clearly in
cutthroat competition as it enters into its second phase of
consolidation in the maturity phase. Overcapacity, a weak
demand, and slow growth in the industry have been the source
of Europe’s oil dilemma. The growing population of
supermarket service stations and their price wars with the major
integrated oil companies further fuels this intense rivalry.
Closing shop and leaving the European market might appear to
be an attractive solution to this problem but the enormous
exiting costs and emotional barriers make it extremely difficult
to do so.
INDUSTRY ATTRACTIVENESS
Being that the international integrated oil industry is already in
maturity with a tight oligopoly, the attractiveness for new
entrants is very low on the global scale. However, the
supermarket service stations in Europe have successfully
entered the retail gas market but have by no means established
themselves as a credible threat of entering the global market of
integrated oil conglomerates. For incumbent oil companies it is
more attractive for them to remain in the European market
rather than leave because of the overwhelming exiting costs.
Established firms are facing lower profitability due to
overcapacity, making the overall attractiveness for incumbents
lackluster at best. As the industry enters its second phase of
consolidation, many oil conglomerates are acquiring smaller
companies, merging with others, and forming strategic alliances
in an effort to survive the stalling growth in the European oil
industry. Royal Dutch’s ultimate advantage over smaller oil
companies is to capitalize on economies of scale and achieve
more efficient production costs. Being that the Royal
Dutch/Shell Group has a dominant position in the European oil
market, the industry is more attractive than their incumbent
competitors. The power in the industry lies with the suppliers
in a unique relationship in which OPEC indirectly regulates the
production levels and pricing of oil. There is a moderate threat
of substitute forms of energy, more so with respect to long-term
future strategies.
2. Competitor Analysis
Strategic Group Analysis
The Royal Dutch/Shell Group competes within the international
integrated oil industry, which is composed of the largest and
most diversified oil companies. Their diversification is twofold
- both geographically as well as their scope of operations.
Their closest competitors include Mobil, BP, Exxon, Amoco,
Texaco, and Chevron.
0
10
20
30
40
50
60
70
80
DEMAND
(billions of
barrels per
day)
1992
1993
1994
1995
E1996
YEAR
WORLD OIL DEMAND
Non-OECD
OECD
Royal Dutch Petroleum Co.
Netherlands
Shell Transport & Trading Co.
United Kingdom
P. D. S. Hadfield
Human Resources
S. M. G. Hodge
Treasurer
C. J. Knight
Corporate Advice Unit
J. A. de Kreij
Controller
J. H. Schraven
Legal
P. B. Watts
Planning, Environment
& External Affairs
J. A. Colligan
Regional Business
Asia-Pacific & S. America
H. J. M. Roels
Regional Business
Middle East & Africa
C. E. Fay
Regional Business
Europe
R. M. Sprague
Strategy & Business
Services
A. J Parsley
New Business
Development
T. N. Warren
Research & Technical
Services
Exploration & Production
W. A. Loader
South Zone
P. D. Skinner
President
Shell Int'l.Trading
& Shipping Co. Ltd.
L. E. SLoan
East Zone
G. J. van Luijk
Research & Technical
Services
D. Varney
Europe Zone
P. D. Skinner
Strategy & Business
Services
Oil Products
J. W. Dawson
Specialties
J-P Meurin
President
Shell Chemicals
Europe Ltd.
G. M. Ferris
Petrochemicals
outside Europe
B. Stouthamer
Research & Technical
Services
E. Henkes
Strategy & Business
Services
Chemicals
H. G. Dijkgraaf
Chief Executive
Shell International Gas Ltd.,
Shell Coal International Ltd.
Gas & Coal
C. A. J. Herkstroter
President
ROYAL DUTCH/SHELL GROUP
Royal Dutch Petroleum Co.
Netherlands
Shell Transport & Trading Co.
United Kingdom
P. D. S. Hadfield
Human Resources
S. M. G. Hodge
Treasurer
C. J. Knight
Corporate Advice Unit
J. A. de Kreij
Controller
J. H. Schraven
Legal
P. B. Watts
Planning, Environment
& External Affairs
J. A. Colligan
Regional Business
Asia-Pacific & S. America
H. J. M. Roels
Regional Business
Middle East & Africa
C. E. Fay
Regional Business
Europe
R. M. Sprague
Strategy & Business
Services
A. J Parsley
New Business
Development
T. N. Warren
Research & Technical
Services
Exploration & Production
W. A. Loader
South Zone
P. D. Skinner
President
Shell Int'l.Trading
& Shipping Co. Ltd.
L. E. SLoan
East Zone
G. J. van Luijk
Research & Technical
Services
D. Varney
Europe Zone
P. D. Skinner
Strategy & Business
Services
Oil Products
J. W. Dawson
Specialties
J-P Meurin
President
Shell Chemicals
Europe Ltd.
G. M. Ferris
Petrochemicals
outside Europe
B. Stouthamer
Research & Technical
Services
E. Henkes
Strategy & Business
Services
Chemicals
H. G. Dijkgraaf
Chief Executive
Shell International Gas Ltd.,
Shell Coal International Ltd.
Gas & Coal
C. A. J. Herkstroter
President
ROYAL DUTCH/SHELL GROUPKey Success Factors
Company
Technology
Globalization
Operational Excellence
RD/Shell
4
5
3
Exxon
5
4
5
Amoco
4
3
3
Exxon and Amoco were selected for the competitor analysis
because they are both world leaders in the oil industry and are
within Royal Dutch/Shell’s strategic group. The three firms
were rated (not ranked) on a scale from 1-5, with 1 representing
poor performance in the category and 5 indicating excellent
performance in the category. Technology, globalization, and
operational excellence were chosen because they are, above and
beyond, the most integral elements to success in the global oil
market. In today’s dynamic and ever-changing economy, the
latest technologies must be developed and employed to find new
ways of discovering oil, refining the crude, and transporting it
across the globe. As the name might suggest, being apart of an
extremely competitive “international” integrated oil industry
requires these firms to expand their base of operations in an
effective manner to developing countries and emerging markets
around the world. Finally, operational excellence was chosen
because as mentioned in the Porter 5 Forces Analysis, the
distinguishable aspect of the oil industry that every company is
facing is the looming idea that there is a finite amount of
resources on Earth. Having the foresight to realize this and act
on this notion is what drives operational excellence; firms must
operate as efficiently and effectively as possible in order to
squeeze as much as possible from their profit margins.
Competitor Analysis
Exxon
Amoco
Goals
*Develop & employ best technologies.
*Maintain strong financial position.
*Pursue opportunities and expand base of operations home and
abroad.
*Inc. market share & improve profitability & efficiency in
Europe downstream market.
Assumptions
*Industry remains in slow growth.
*Continue to benefit from cost reduction programs.
*Industry is in slow growth.
*Restructuring will have positive long-term effects on all
sectors.
Capabilities
*Strong technical background.
*Strong production & asset management.
*Strong technology.
*Excellent profit margins & ROA compared to competitors.
Strategies
*Expansion into emerging markets.
*Identify quality investments.
*Evaluate and divest marginal properties and under-performing
assets while expanding into emerging markets.
Satisfaction
*Somewhat, room for improvement with financial performance.
*No, European downstream market is suffering.
Next Move
*Continue expansion.
*Solidify position as #1 oil company in the world.
*Joint Venture with other oil company and/or supermarket to
regain market share.
Vulnerability
*Weak profit margins.
*Lack of brand equity in Europe.
*Weak efficiencies upstream.
Retaliation
*Potential merging of competitors could take away market
share.
*Mergers, acquisitions, joint ventures from
competitors.RESPONSE – RED THREAD FOR COMPETITOR
ANALYSIS
Royal Dutch/Shell’s response to their competitors’ actions is to
maintain their position as the market leader in Europe and use
their new innovative management to their advantage. By this,
the Group should continue to not only defend their position but
also innovate new technologies and form new partnerships to
maintain a high percentage of market share in the industry.
III. Internal Assessment
A. Nature of the Firm
Understanding the character of the Royal Dutch/Shell Group is
a complex and articulate process. The firm is made up of two
publicly traded companies, the Royal Dutch Petroleum
Company and the Shell Transport & Trading Company, and in
such a vertically integrated industry, an organization of this
scope takes on a persona of its own. “It operates in 130
countries around the world and controls every aspect of oil
production from the ground to the gas pump. With headquarters
in both London and The Hague, the company oversees 101,000
employees, 54 refineries, and 47,000 gas stations.”
To add to the perplexity, Royal Dutch/Shell is undergoing a
major restructuring of the entire organization and a drastic
change in their global strategy. The Internal Analysis that
follows examines both the old culture and management as well
as the new organization of the Group that was born on January
1, 1996.
1. Leadership & Culture
The upper echelon of the Group’s executive management is the
Supervisory Board. The Supervisory Board meets every month
with the Royal Dutch Managing Directors and the Directors of
the Shell Transport and Trading Company.
Additionally, the Supervisory Board meets with the Royal
Dutch’s Board of Management to maintain a direct relationship
with the executive management of the Group.
Supervisory Board
The Supervisory Board of the Royal Dutch/Shell Group is lead
by L. C. van Wachem, who has been the Chairman since 1992.
Prior to being Chairman, he was a Managing Director of the
Company from 1977-82 and President from 1982-92.
T. C. Braakman has been a member of the Supervisory Board
since 1989 and was Chairman of the Board of Management of
Nationale-Nederlanden N.V. K. V. Cassani has also been a
member of the Board since 1989 and was previously was Vice-
Chairman of the Board of Directors of IBM Corporation.
The fourth member of the Supervisory Board is J. M. H. van
Engelshoven, who has served since 1991. Prior to serving on
the Board, he was a Managing Director of the Company since
1982. K. O. Pohl has been on the Board since 1992. Before
coming to Royal Dutch, Mr. Pohl was a partner in Sal.
Oppenheim Jr. & Cie. and was also the President of Deutsche
Bundesbank. H. de Ruiter has served on the Supervisory Board
since 1994. The final member of the Supervisory Board is Mr.
J. D. Timmer. Before joining the Board in 1996, he was the
President and Chairman of the Board of Management of Philips
Electronics N.V.
Royal Dutch Petroleum Company
The Board of Management for Royal Dutch Petroleum Company
is spearheaded by C. A. J. Herkstroter, President of the Group
since 1992. Prior to being named President, Herkstroter was a
Managing Director of the Company since 1989.
The second member of the Board of Management is M. A vand
don Bergh, who has been a Managing Director of the Company
since 1992. The last member of the Board of Management is S.
L. Miller. Mr. Miller has been a Managing Director since July,
1996. The General Attorney for the Group is R. van der Vlist.
Shell Transport & Trading Company, p.l.c.
The Shell Transport & Trading Company consists of six
directors and is lead by John Jennings, the Chairman and
Managing Director.
Mr. Jennings has been Managing Director since 1987 and
Chairman of Shell since 1993.
His exceptional leadership of Shell will end next year when he
is scheduled to retire on July 1, 1997. Elected to take his place
is Mark Moody-Stuart, who has been a Group Managing
Director of Shell since 1991.
Sir Antony Acland, a Director of Shell, has been a non-
executive Director since 1991 and has extensive diplomatic
experience and was H. M. Ambassador to the USA from 198-91.
The Lord Armstrong of Ilminster has been a non-executive
Director since 1988. Prior to being on the Board of Directors
he served as a director for various other companies, including
BAT Industries and RTZ Corporation.
Sir Peter Holmes is one of the longest serving Directors who
has been on the Board since 1982 and was a Group Managing
Director the eleven years prior. Professor Robert O’Neill of
Oxford has been a non-executive Director of Shell since 1992.
Sir Ronald Oxburgh has been a non-executive Director of
Shell since 1996. Prior to joining Shell, he was the Chief
Scientific Adviser of the Ministry of Defense from 1988-983.
The final member of the Board of Directors, Sir William
Purves, has been on the Board since 1993. He is also currently
the Chairman of HSBC Holdings p.l.c. and the British Bank of
the Middle East.
2. Corporate Makeover
Leadership Seminar
Prior to the introduction of their colossal corporate makeover,
the Royal Dutch/Shell Group has been revered for years for its
continued excellence in the oil industry. Perhaps the thought on
everyone’s mind is ‘If it aint’ broken, don’t fix it’. The Group
has been ranked in the Fortune Magazine’s Global 500 year in
and year out, while they have spent three consecutive years as
the world’s leader in total profits.
The Group’s superb functional leadership trickles down from
their President, C. A. J. Herkstroter. It’s not Mr. Herkstroter’s
perfectionism that makes him an astounding leader, rather his
prudence to recognize that his seemingly ‘perfect’ firm (in the
eyes of everyone else) was losing touch with the evolving
society. “The oil company was too inward looking, had missed
the information revolution, and had failed in its outward
communication.”
The Group suffered a great deal of negative press after their
decision to sink the Brent Spar, a large oil storage rig in the
Atlantic. Furthermore, the Group’s operations and involvement
in Nigeria were chastised after Nigerian government killed Ken
Saro Wiwa, a leader of a political opposition group. Managing
a global giant can obviously encounter various environmental
and political problems across different cultural bounds.
Herkstroter demonstrated the resolve and agility to admit to
some poor ethical decisions and has reshaped the company into
a much flatter organization with a much more innovative culture
and higher regard for ethical concerns. “If an entrepreneur is
someone who builds a company to fill a need in the
marketplace, perhaps Herkstroter can be described as a new
kind of entrepreneur – one who rebuilds a company to address
changes in the marketplace.”
Cultural Revolution
“This is IBM before Gerstner, GE before Welch, Coke before
Coizueta,” writes Fortune Magazine’s Janet Guyon’s in an
impressive analysis of what she refers to as “Shell’s mid-life
crisis.”
The oil giant’s decay is a result of their culture: “Shell is also
an insular company, saddled with introverted control freaks, a
Byzantine organizational structure, and a controversial public
image. Many of its managers rarely talk to the rank and file.”
In order to pull a corporate 180, CEO Cornelius Herkstroter
gathered every global executive together for what appeared as a
congregation of conservative geniuses at a corporate retreat,
many of which had never met before.
After an American consulting overhaul consisting of Myers-
Briggs personality tests and leadership games, the Group has
discovered the only way to change their global corporation is to
start with the top. It has become the mission of Cornelius
Herkstroter and the rest of the Royal Dutch/Shell Group to lose
that reputation and turn this old-fashioned European firm into a
“fast, flexible, environmentally aware organization that runs
more efficiently, is more innovative, and is capable of moving
Shell into profitable new business.”
3. Organizational Structure
The Royal Dutch/Shell Group is a holding company made up of
the two publicly traded companies: Royal Dutch Petroleum
Company (60%) based in the Netherlands; and the Shell
Transport & Trading Company (40%) based in the United
Kingdom.
While the Royal Dutch/Shell Group is indeed a holding
company, their organizational structure is a Multi-divisional
Structure with a Related-Linked Strategy, not a Holding
Company Strategy as one might automatically assume.
“At the beginning of 1996, Anglo-Dutch oil and chemicals giant
Royal Dutch/Shell pulled into place a newly reorganized
structure that abolished its former complex matrix of regional,
functional and business-sector organizations.”
Royal Dutch/Shell has a unique structure in that they
simultaneously have a centralized and decentralized strategy.
There is a small Corporate Center that advises the President
with managing the overall corporate strategies. This is the main
strategic control used by the Supervisory Board and the Board
of Management to control the individual firms’ strategies.
Within this large organization they have consolidated their
organization into four separate business entities: Exploration &
Production, Oil Products, Chemicals, and Gas & Coal.
Within the Group there are eleven Service Companies whose
primary function is to advise and assist the subsidiaries of the
Royal Dutch/Shell Group.
The Operating Companies are the physical business units that
discover, produce, and market the oil, natural gas, chemicals,
coal and other businesses throughout more than 120 countries of
operation.
“In the new structure, also devised with advice from McKinsey,
the operating companies will have a single line of command and
report only to a functional boss.”
The Group’s old structure was far too complicated and each
employee would have to report to several managers. Shell
Transports & Trading Company’s Chairman, John Jennings,
said, “The new organization will enable us to operate better at
regional and local levels, but it will be a few years before the
full impact is felt. This year we expect results to get through to
the bottom line.”
B. Value Chain AnalysisPrimary Activities
1. INBOUND LOGISTICS
For such a highly vertically integrated industry like that of the
oil industry, inbound logistics includes all of the processes that
Royal Dutch/Shell takes in order to attain the resources it needs
(primarily, crude oil) before it refines it into the final product.
The inbound logistics for an integrated oil firm is the equivalent
of their upstream operations and includes exploration,
production, drilling, labor costs, and other overhead costs used
to extract crude oil from the resources.
· Technology
Opportunities:
· Troll gas platform was finished in 1995 in Norway and is the
largest concrete structure in the world.
· Draugen platform was renovated during 1995 and its
production capacity increased by 30%.
· “The world’s largest seismic survey was completed in the
Kazakh sector of the Caspian Sea.”
· Procurement
Neutral:
· Purchase of oil rigs, ships, drilling equipment, and various
platforms.
· Investments for drilling in emerging markets.
· Working together with Exxon to build three large natural gas
storage sites underground in Germany and the Netherlands,
costing about $1.2 billion.
Threats:
· Environmental costs to upgrade operations in Nigeria, as well
as “improved community relations” activities.
2. OPERATIONS
The following aspect of downstream activities is the refining
process, which transforms crude oil into fuels, lubricants, and
petrochemicals. The refining process begins with distillation,
which brings the crude oil to a boiling point and separates the
different grades of oil. Next, the crude goes through a series of
advanced refining processes called coking, catalytic cracking,
hydrocracking, hydrofining, and finally reforming to produce
the highest quality of oil.
· General Operations
Threats:
· Below-average Return on Average Capital Employed, which is
the primary indicator of how efficient an oil company is
operating.
· Human Resources
Threats:
· Shell Chemical cut 700 jobs in order to trim costs and improve
productivity.
· Technology
Opportunities:
· PER+ project in the Netherlands will be fully operational by
1997 and will be a huge improvement of the Pernis refinery.
· World’s largest producer of natural gas.
· Procurement
Neutral:
· Purchase of refining machines, buildings, and facilities.
Threats:
· Renovating the Nanterre lubricants plant and plan to cut back
on refining at the Berre plant in France.
3. OUTBOUND LOGISTICS
The next aspect of the downstream activities is the
transportation of the finished product to consumers around the
world. The major elements of outbound logistics include
pipelines, tankers, trucks, and other methods of transportation
and storage of petroleum and chemicals.
· General Outbound Logistics
Opportunities:
· Shell International Trading Company and Shell International
Shipping Company Limited were joined on April 1, 1995.
· Human Resources
Opportunities:
· Shell International Trading & Shipping Company set a new
safety record with “4.52 million hours worked without a
recordable injury accident.”
· Procurement
Neutral:
· Purchase tankers, pipelines, trucks, and other equipment for
transportation.
4. MARKETING & SALES
The marketing of finished oil products is performed on the
retail level at your local gasoline stations. Wholesale buyers
include utility companies and large industries. The final forms
of energy produced from refining include lubricants, greases,
marine fuels, jet fuels, diesel oil, kerosene, asphalts, waxes, and
liquefied petroleum gas.
· General Marketing & Sales
Opportunities:
· Royal Dutch/Shell is the “largest marketer of branded
gasoline”.
· Branding their retail image in more than 8,000 sties in 85
countries.
Threats:
· Profit margins in Europe are falling.· Technology
Opportunities:
· In order to protect the environment, new underground
instillations are being improved at retail gas stations.
· Procurement
Neutral:
· Purchase of new retail gas stations.
· Acquired 44 gas stations from Total in Germany.
5. SERVICE
Since oil is indeed a commodity and most purchases are
transaction-based and not relationship-based, there is minimal
customer relationship compared with other products and
services. However, there is after-sale customer relationship
management with the larger wholesale buyers.
· General Service
Opportunities:
· There is very little customer service involved with building
relationships outside after the sale except for the Group’s larger
wholesale clients.
Secondary Activities (across the board)
INFRASTRUCTURE
Opportunities:
· As mentioned in the Culture & Leadership section earlier, the
excellent leadership by Herkstroter, CEO, is transforming the
company into a more innovative company that is responsive to
changes in the global market.
· Globalization: “The most profitable company for the second
year in a row, Royal Dutch/Shell credits a presence in 120
countries for its performance.”
· Brilliant strategic thinkers and use of scenario planning.
“Scenarios are plausible and challenging stories, not forecasts.
They do not extrapolate from the past to predict what will
happen in the future, but instead offer two very different stories
of how the future might look.”
· “Shell’s country managers have enormous freedom. And yet
they’re bound together, and to the center, by a sort of corporate
glue that ensures coherence and consistency both culturally and
in terms of business processes.”
– Brian March of Shell
Threats:
· Horrific public relations disasters over the last few years.
· Decided to sink the Brent Spar, an old oil storage rig, into the
Atlantic Ocean. After persistent protests by environmentalists
such as Greenpeace, they decided against sinking the rig.
· The Nigerian government murdered Ken Saro-Wiwa, who
criticized Shell’s environmental ethics, or lack thereof, in
Nigeria.
HUMAN RESOURCES
Opportunities:
· Excellent compensation for workers. “To compensate
expatriate staff, Royal Dutch Shell uses what it calls a
‘modified balance sheet’, basing its calculations no a north
European standard of living. In effect, Shell has decided that
all expatriates deserve to live like the Dutch.”
Threats:
· Selling off refineries in Europe with the hopes of boosting
profit margins in the crowded European oil market.
· As apart of their reorganization, the Group plans to cut their
staff at the headquarters by 25%.
TECHNOLOGY
Opportunities:
· “The Royal Dutch Shell Group is Europe’s 2nd-largest IS
spender… This is creating focused business units within its 3
core activities of exploration, oil, and chemicals.”
C. Core Competence & Competitive Advantage
The Royal Dutch/Shell Group’s primary core competence lies in
their globalization. The Group is diversified both
geographically in 129 countries and operationally through their
extensive scope of products they produce. Leading the Global
Fortune 500 List in total profits in 1995, “Shell’s ‘greater
spread’ and its strong base in booming East Asia, says Jennings,
give it ‘a platform for growth’ a level above its rivals.”
Directly related to the Group’s ability to expand into budding
economies is the creative genius behind each strategic move.
Their new leadership and culture that has evolved from their
corporate makeover a la McKinsey and other American
consulting firms is more innovative, efficient, and responsive.
The Royal Dutch/Shell Group has a competitive advantage
because they earn above-average returns compared to their
closest competitors in their strategic group. The graph below
depicts the three-year average of return to shareholders from
1994 through 1996.
0
2
4
6
8
10
12
14
16
18
20
Return
Exxon
RD/Shell
BP
Amoco
Mobil
Texaco
Chevron
Company
Average Shareholder Return 1994-96
D. Financial Ratio Analysis
All of the original values from the Group’s financial statements
were in guilders for Royal Dutch and British pounds for Shell.
I used the exchange rate of the day the results were completed
(last day of the fiscal year) to translate them into U.S. dollars.
Additionally, the combination of both publicly traded
companies, Royal Dutch Petroleum and Shell Transport &
Trading Company, were used on their stated 60-40 ratio,
respectively; therefore, all figures have been accurately
translated into U.S. dollars on a weighted average basis.
Company
Net Income
Quick Ratio
ROA
Debt to Equity
Profit Margin
ROACERD/Shell
8,886
1.05
7.8%
0.97
6.9%
13.2%
Exxon
7,510
0.69
8.0%
1.19
5.6%
16.0%
Mobil
2,964
0.65
6.4%
1.40
3.6%
12.7%
Amoco
2,834
0.98
8.8%
0.95
8.8%
13.8%
BP
2,552
0.73
7.8%
1.54
5.7%
17.1%
Chevron
2,607
0.73
7.5%
1.23
6.1%
12.7%
Texaco
2,018
1.22
7.5%
1.60
4.4%
14.9%
* Net Income listed in millions of U.S. dollars.
The oil industry as a whole was able to capitalize on higher oil
prices during 1996. Net income was chosen first because it is
an appropriate indicator of how much money a firm makes and
is a good basis for benchmarking the size of competitors.
While Exxon was the largest international integrated oil firm in
the world (based on revenues), Royal Dutch/Shell had a higher
net income. The quick ratio is a more accurate measure of
liquidity for an oil company rather than the current ratio
because it excludes inventory. Oil firms of this size carry a
large amount of non-cash short-term assets, as well as a
substantial amount of oil reserves. While these reserves may be
classified under inventory, they are not very ‘liquid’ in the
sense that they cannot be quickly converted into cash. Royal
Dutch/Shell has a near perfect 1.05 quick ratio. Return on
assets is an excellent indicator of how much money a firm
makes, given the scope of their operations. The Group’s ROA
was average compared to their competitors. A significant
financial element of a company in its maturity phase is how
much debt it takes on. Royal Dutch/Shell’s debt-to-equity is
0.97, illustrating the Group finances its assets with almost as
much debt as it does equity. As with any company, profit
margin is an integral measure of not only how much money a
firm makes, but how effectively a firm brings in revenue on
each additional item sold. The Group’s profit margin was 6.9%,
which was consistent with its peers in the oil industry. Last,
but certainly not least, I chose the Return on Average Capital
Employed (ROACE) to analyze the efficiency of the firm’s
operations. As mentioned when analyzing the Key Success
Factors of the oil industry, the ROACE is quite possibly the
most effective measurement of how efficient an oil firm’s
operations are. With a finite amount of resources in the world,
oil companies must make the most efficient use of their crude
oil. Jumping from 10.6% in 1995, Royal Dutch/Shell had an
ROACE of 13.2% in 1996, which was a positive sign. However,
this remains the Group’s main weakness and will be revisited in
determining the appropriate strategy in order to improve this
integral indicator of operational excellence.
Stock Price Chart
This is a chart illustrating the stock price of Royal Dutch
Petroleum Company (RD) and Shell Transport & Trading
Company (SC) from 1994 through 1996.
The graph illustrates the positive correlation between both
separately traded companies. This strong correlation is because
both Royal Dutch and Shell are principally incorporated within
the same parent group of companies.
IV. Strategic Choice
A. SWOT Analysis
1. General SWOT Analysis
Strengths
Globalization
Expansion into emerging markets
Largest marketer of branded gas
Superb leadership
Healthy liquidity
Technology
Largest producer of natural gas
Shell Transport & Shipping
Opportunities
Technological Advances
Emerging economies
Oil remains main source of energy
Formation of European Union
Introduction of the “euro”Weaknesses
Slow growth
Weak efficiencies (ROACE)
Holding too much cash
Horrific public relations scandalsThreats
Costly environmental regulations
Substitute products
Power of OPEC
Overcapacity in mature markets
European economic problems
Supermarkets inc. market share
Brand equity not important in Europe
2. General Strategic Orientation
The oil industry is definitely being threatened by overcapacity
and a struggling economy and it therefore not classified as an
‘opportunity’. Overall, the Royal Dutch/Shell Group has many
strengths and is not a company struggling to keep up with the
industry, but rather an excellent company struggling with the
slow growth of a mature economy.
Weakness
TurnaroundDefensiveAggressiveDiversification
Strength
3. Grand Strategy Clusters
The European oil market is definitely a slow growth market. As
the market leader in the European market, the Group is coming
from a strengthening competitive position.
Weakening
Competitive Position
Turnaround
Concentrated Growth
Vertical Integration
Horizontal Integration
DivestmentRetrenchment
Merge with Competitor
LiquidationConcentrated Growth
Vertical Integration
Related DiversificationRelated Diversification
Unrelated Diversification
Joint Venture & Strategic Alliance
Vertical Integration
Horizontal Integration
Concentrated Growth
Strengthening
Competitive Position
4. Grand Strategy Selection Matrix
Weakness
CONSERVATIVE
Turnaround
Retrenchment
Divestiture
LiquidationOVERCOMMITTED
Strategic Alliance
Merge with Competitor
Unrelated DiversificationSOLIDIFY POSITION
Concentrated Growth
InnovationEXPAND BASE
OF OPERATIONS
Vertical Integration
Horizontal Integration
Related Diversification
Joint Venture
Strategic AllianceStrength
5. Generic Strategy
The Group has a competitive advantage because they achieve
above-average returns compared to their strategic group. The
scope of their target market is colossal, seeing as they serve
people around the globe and do not specifically target one
demographic segment. They achieve their advantage through
cost leadership because their product is a commodity and cannot
be differentiated.
Cost LeadershipDifferentiationFocused Cost LeadershipFocused
DiversificationC. Recommendations
As mentioned, Royal Dutch/Shell is definitely guided by their
strengths and not their weaknesses. The Grand Strategy
Selection Matrix has a dotted-line through “Expand Base of
Operations’ quadrant because for the most part, Royal
Dutch/Shell is trying to defend its position as the market leader
in Europe. However, it is my opinion that some times the best
defense is a powerful offense. In order to remain #1 in this
cutthroat competitive market, I believe Royal Dutch/Shell
requires more than the traditional concentrated growth and
innovation. I’d like to revisit not only the problem facing the
industry but especially the Group’s main problem with their old
corporate culture. Shell’s director, John Jennings, said of their
old culture, “We were bureaucratic, inward looking,
complacent, self-satisfied, arrogant.”
Sometimes staying on top requires more action than reaction;
and leaving their competitive position idle would indeed be a
return to complacency. The European oil industry is more
attractive for Royal Dutch/Shell than other incumbents and they
should take advantage of this. With a heavy presence there
now, this enables them to prepare for the future.
1. Corporate Level Strategy (Global Scale)
On the global scale, they should continue to expand into
emerging markets to bring what they do best to new markets.
Budding economies in Asia, Latin America, Eastern Europe, and
South America will be integral for their successful expansion.
Making prudent strategic investment decisions is one of the
Group’s core strengths. Their early expansion into new markets
(i.e. Asia/Pacific) has allowed them to capture market share
early on in a market’s growth.
2. Business Level Strategy (European Market)
In the specific European market, Royal Dutch/Shell must first
defend their position as the market leader in the European oil
market. Focusing on improving operational efficiency through
the latest innovative technology will improve their hopes for
growth. However, I think the Group needs to make a move that
is one step further. The Group should form a joint venture with
some of the major supermarkets that have been gaining market
share. If a mutual joint venture can not be reached, the Group
can use its excess cash to acquire supermarket service stations
if needed.
As mentioned earlier, the Group’s excellent strategic
management uses what is called “Global Scenarios” to
determine what they think will happen next based on innovative
possibilities and not just looking at the past. I am not basing
my strategic recommendation on this underlying assumption;
this is rather a very good possibility of what could happen.
While the European economy is currently a threat to the
industry, I think in the long-term, the European market will
boom again once the EU becomes solid and the euro is a
success. An improved economy in the long-run would put more
disposable income in the hands of consumers, who would be
more likely to purchase based on brand equity than just location
and convenience. Royal Dutch/Shell will then be perfectly
situated to capture market share based on convenience, location,
and brand equity.
IV. Managerial Implications
A. Implementation Issues
The Group should target the larger supermarkets, or
hypermarkets as Europeans call them, in an effort to gain more
market share. All new service stations will be branded with the
Shell logo, as they continue their branding effort. All
employees will remain at the original service stations but will
undergo Royal Dutch/Shell’s training program in order to
achieve congruence throughout corporate culture.
Through both expansion into emerging markets on the global
scale, and continuous improvement in the European market,
Royal Dutch/Shell will be able to improve their profitability and
operational efficiency in this slow growth market. The Group’s
improved leadership has opened their eyes to the ever-changing
global marketplace that is revolutionizing all aspects of
business. Remaining responsive to these changes and
employing the latest technologies will be extremely important
for the Group to remain a leader in the industry.
Reference Section
Aquino, N., Oct. 1996. “Alternative Energy”, Europe:
Issue(360):pg.44.
August 1, 1994, “Warning Sounded on European Emissions
Cutback”, Oil & Gas Journal: Vol.92.
Ball, J, 1996. “The European Union: The Road To Nowhere”,
European Business Journal: Vol(8):pg.8.
Bassman, R., Nov. 1994. “Oil: Europe’s Power Industry”,
Europe: Vol(341):pg.14.
Beck, R., Jan. 31, 1994. “Worldwide Outlook Clouded By
Market Slump of Late 1993”, The Oil and Gas Journal:
Vol(92):pg.72.
Begg, I, 1996. “Wrong Questions, Wrong Answers: The EU
Economic Policy Debate Since ‘Maastricht’”, European
Business Journal: Vol(8)pg.37-44.
Clark, K., Aug. 5, 1996, “A Bigger, Richer World”, Fortune:
Vol(134): pg. 102.
Cool, K, Gee, F, Montgomery, I, Reuer, J, 1999. “BP-MOBIL
and the Restructuring of the Oil Refining Industry”, in Hitt, M,
Hoskisson, R, Ireland, R (ED’s) STRATEGIC MANAGEMENT:
COMPETITIVENESS AND GLOBALIZATION Edition 4,
Cincinnati: South-Western College Publishing, pg.C-174.
Deacon, R., March 28, 1996. Oil & Gas, in Nugent, T. (ED)
STANDARD & POOR’S INDUSTRY SURVEYS, New York:
McGraw Hill
Dec. 11, 1996, “Shell to Revamp European Refineries”, New
York Times: pg.4.
Dispenza, D., March 13, 1995. “Europe’s Need For Gas
Imports Destined To Grow”, Oil & Gas Journal: Vol(93):pg.45.
Eade, P., Nov. 1996. “The Shape of Things to Come”,
Euromoney: Issue 331, pg.69-74
“EUROSTAT Yearbook 2001: The Statistical Guide to Europe,
Data 1989-1999” published by Eurostat.
http://www.europa.eu.int/comm/eurostat
Feb. 1997. “Economic Outlook: Europe”, Economic Outlook:
Vol(21):pg.36.
Fitzgerald, N., January 1997. “Tomorrow’s Europe”, European
Business Journal.
“Global Scenarios 1995-200”, published by Royal Dutch/Shell
in 1995.
Graves, E., July 21, 1994. “Oil”, in Nugent, T. (ED)
STANDARD & POOR”S INDUSTRY SURVEYS, New York:
McGraw Hill, pg. O27-O28.
http://www.BigCharts.com
Hunter, D., Sep. 18, 1996, “Shell Chemical Thinks Growth”,
Chemical Week: Vol(158): pg.34.
Jansenn, R., March, 1997. “The Hague: A New Breed of
Entrepreneur”, Europe: Issue(364):pg.38.
July 15, 1995. “Over-refined Europeans: Oil Industry”, The
Economist: Vol(336):pg 47
June 24, 1995. “Shell On The Rocks”, The Economist:
Vol(335):pg.57.
Knapp, B., March 1995. “A Historical View of Recycling”,
World Wastes: Vol(38).
Knott, D., March 25, 1996. “Shakeout Gathers Momentum in
Europe’s Refining Sector”, Oil & Gas Journal: Vol. 94.
Knott, D., May 27, 1996. “Shell’s Microscope Focused On
Refining”, Oil & Gas Journal: Vol(94):pg.30.
Layman, P., July 29, 1996. “Shell Reorganized To Better Focus
Its Portfolio On Global Markets”, Chemical & Engineering
News: Vol(74):pg.25.
March 23, 1995. “More Gusto For Wind Power”, Machine
Design: v(67): pg.18.
Monthly net earnings of a couple, 1996. Eurostat Yearbook
2002: pg.16. http://www.europa.eu.int/comm/eurostat
Murphy, C., March 7, 1996. “Why Sites Are Key to Fuel
Fight”. Marketing: pgs.16-17.
Nov. 1996. “Economic Outlook: Europe”, Economic Outlook:
Vol.(21): pg.34.
Nov. 9, 1996. “Smaller Cars, Bigger Profits?”, The Economist:
Vol(341).
Oct. 16, 1995, “Exxon-Shell Team to Develop North Europe
Gas Storage”, Oil & Gas Journal: Vol(93): pg.38.
Oct. 22, 1997, “At Shell, Everyone is Dutch”, Business Europe:
Vol(37):pg.9.
Parkinson, G., March 1996. “Gasification: New Life for an Old
Technology”, Chemical Engineering: Vol(103):pg.37.
Rhodes, A. Oct. 30, 1995. “Improved Catalysts, Process
Reliability are Key Refining Trends”, Oil & Gas Journal.
Royal Dutch Petroleum Company, Annual Report to
Shareholders 1995.
Royal Dutch Petroleum Company, Annual Report to
Shareholders 1996.
Sept. 29, 1995, “Conference Report: World Oil Conference”,
European Energy Report.
Shell Transport and Trading Company, p.l.c., Annual Report to
Shareholders 1995.
Shell Transport and Trading Company, p.l.c., Annual Report to
Shareholders 1996.
Simpson, D., Mar/Apr 1995, “Planning In A Global Business”,
Planning Review: Vol(23): pg.25.
Sweet, P., April 1996. “Solar Systems”, Accountancy:
Vol(117):pgs.51-54.
Taste, P., Dec. 11, 1995, “On The Cutting Edge: Shell”,
InformationWeek: Issue(557): pg.45.
Thomas Murray
Regional
National
Global
Global, Parker, Rowan, Sedcos
Baker Hughes, Schlumberger, McDermott
Mesa, Anadarko, Oryx, Louisiana
Mobil, BP, Exxon, Royal Dutch/Shell, Amoco, Texaco, Chevron
Hess, Occidental, Pennzoil, Unocal, Sun Co
Specialized Slightly Integrated Fully
Integrated
� EMBED OrgPlusWOPX.4 ���
Opportunity
Threat
Rapid Growth
Slow Growth
Internal
Development
External
Development
BROAD
UNIQUENESS
COST
NARROW
� Royal Dutch Petroleum Company, Annual Report 1996
� Cool, K, Gee, F, Montgomery, I, Reuer, J, 1999. BP-MOBIL
and the Restructuring of the Oil Refining Industry, in Hitt, M,
Hoskisson, R, Ireland, R (ED’s) STRATEGIC MANAGEMENT:
COMPETITIVENESS AND GLOBALIZATION Edition 4,
Cincinnati: South-Western College Publishing, pg.C-106.
� Royal Dutch Petroleum Company, Annual Report 1996
� Ibid.
� Ibid.
� Ball, J, 1996. “The European Union: The Road To Nowhere”,
European Business Journal: Vol(8):pg.8.
� Nov. 1996. “Economic Outlook: Europe”, Economic
Outlook: Vol.(21): pg.34.
� “EUROSTAT Yearbook 2001: The Statistical Guide to
Europe, Data 1989-1999” published by Eurostat.
http://www.europa.eu.int/comm/eurostat
� Begg, I, 1996. “Wrong Questions, Wrong Answers: The EU
Economic Policy Debate Since ‘Maastricht’”, European
Business Journal: Vol(8)pg.37-44.
� “EUROSTAT Yearbook 2001: The Statistical Guide to
Europe, Data 1989-1999” published by Eurostat.
http://www.europa.eu.int/comm/eurostat
� Ibid.
� “EUROSTAT Yearbook 2001: The Statistical Guide to
Europe, Data 1989-1999” published by Eurostat.
http://www.europa.eu.int/comm/eurostat
� Ibid.
� Feb. 1997. “Economic Outlook: Europe”, Economic Outlook:
Vol(21):pg.36.
� Total Population, 1996. Eurostat Yearbook 2001: pg.3
http://www.europa.eu.int/comm/eurostat
� Persons in employment: men and women, 1996. Eurostat
Yearbook 2001: pg.12. http://www.europa.eu.int/comm/eurostat
� Murphy, C., March 7, 1996. “Why Sites Are Key to Fuel
Fight”. Marketing: pgs.16-17.
� Total area and population density, 1996. Eurostat Yearbook
2001: pg.19. http://www.europa.eu.int/comm/eurostat
� Ibid.
� Monthly net earnings of a couple, 1996. Eurostat Yearbook
2002: pg.16. http://www.europa.eu.int/comm/eurostat
� Population growth rate. Population & Social Conditions:
http://www.europa.eu.int/comm/eurostat
� Nov. 9, 1996. “Smaller Cars, Bigger Profits?”, The
Economist: Vol(341).
� Knapp, B., March 1995. “A Historical View of Recycling”,
World Wastes: Vol(38).
� Rhodes, A. Oct. 30, 1995. “Improved Catalysts, Process
Reliability are Key Refining Trends”, Oil & Gas Journal.
� Graves, E., July 21, 1994. “Oil”, in Nugent, T. (ED)
STANDARD & POOR’S INDUSTRY SURVEYS, New York:
McGraw Hill, p.O32-O36.
� Cool, K., J. Reur, I. Montgomery & F. Gee. “BP-Mobil and
the Restructuring of the Oil Refining Industry” in Hitt, M., R.
Ireland & R. Hoskisson, 2001. Strategic Management:
Competitiveness & Globalization Cases. South-Western
College Publishing: United States.
� Bassman, R. Nov 1994. “Oil: Europe’s Power Industry”.
Europe v(341): pg.14. and
March 23, 1995. “More Gusto For Wind Power”, Machine
Design: v(67): pg.18.
� Eade, P., Nov. 1996. “The Shape of Things to Come”,
Euromoney: Issue 331, pg.69-74
� Fitzgerald, N., January 1997. “Tomorrow’s Europe”,
European Business Journal.
� Ibid.
� Sept. 29, 1995, “Conference Report: World Oil Conference”,
European Energy Report.
� Graves, E., July 21, 1994. “Oil”, in Nugent, T. (ED)
STANDARD & POOR”S INDUSTRY SURVEYS, New York:
McGraw Hill, pg. O27-O28.
� Graves, E., July 21, 1994. “Oil”, in Nugent, T. (ED)
STANDARD & POOR”S INDUSTRY SURVEYS, New York:
McGraw Hill, pg. O27-O28.
� Knapp, B., March 1995. “A Historical View of Recycling”,
World Wastes: Vol(38).
� Knott, D., March 25, 1996. “Shakeout Gathers Momentum in
Europe’s Refining Sector”, Oil & Gas Journal: Vol. 94.
� August 1, 1994, “Warning Sounded on European Emissions
Cutback”, Oil & Gas Journal: Vol.92.
� Knott, D., March 25, 1996. “Shakeout Gathers Momentum in
Europe’s Refining Sector”, Oil & Gas Journal: Vol. 94.
� Graves, E., July 21, 1994. Oil, in Nugent, T. (ED)
STANDARD & POOR’S INDUSTRY SURVEYS, New York:
McGraw Hill, pg.O17.
� Deacon, R., March 28, 1996. Oil & Gas, in Nugent, T. (ED)
STANDARD & POOR’S INDUSTRY SURVEYS, New York:
McGraw Hill, pg.O21.
� Deacon, R., June 29, 1995. Oil in Nugent, T. (ED)
STANDARD & POOR’S INDUSTRY SURVEYS, New York:
McGraw Hill, pg.O4.
� Cool, K, Gee, F, Montgomery, I, Reuer, J, 1999. BP-MOBIL
and the Restructuring of the Oil Refining Industry, in Hitt, M,
Hoskisson, R, Ireland, R (ED’s) STRATEGIC MANAGEMENT:
COMPETITIVENESS AND GLOBALIZATION Edition 4,
Cincinnati: South-Western College Publishing, pg.C-106.
� Cool, K, Gee, F, Montgomery, I, Reuer, J, 1999. BP-MOBIL
and the Restructuring of the Oil Refining Industry, in Hitt, M,
Hoskisson, R, Ireland, R (ED’s) STRATEGIC MANAGEMENT:
COMPETITIVENESS AND GLOBALIZATION Edition 4,
Cincinnati: South-Western College Publishing, pg.C-106.
� Deacon, R., March 28, 1996. Oil & Gas, in Nugent, T. (ED)
STANDARD & POOR’S INDUSTRY SURVEYS, New York:
McGraw Hill, pg.O20, O29.
� Deacon, R., March 28, 1996. Oil & Gas, in Nugent, T. (ED)
STANDARD & POOR’S INDUSTRY SURVEYS, New York:
McGraw Hill, pg.O20, O29.
� Beck, R., Jan. 31, 1994. “Worldwide Outlook Clouded By
Market Slump of Late 1993”, The Oil and Gas Journal:
Vol(92):pg.72.
� Graves, E., July 21, 1994. Oil, in Nugent, T. (ED)
STANDARD & POOR’S INDUSTRY SURVEYS, New York:
McGraw Hill, pg.O25. Deacon, R., March 28, 1996. Oil &
Gas, in Nugent, T. (ED) STANDARD & POOR’S INDUSTRY
SURVEYS, New York: McGraw Hill, pg.O25.
� Dispenza, D., March 13, 1995. “Europe’s Need For Gas
Imports Destined To Grow”, Oil & Gas Journal: Vol(93):pg.45.
� Deacon, R., March 28, 1996. Oil & Gas, in Nugent, T. (ED)
STANDARD & POOR’S INDUSTRY SURVEYS, New York:
McGraw Hill, pg.O28.
� Parkinson, G., March 1996. “Gasification: New Life for an
Old Technology”, Chemical Engineering: Vol(103):pg.37.
� Aquino, N., Oct. 1996. “Alternative Energy”, Europe:
Issue(360):pg.44.
� Sweet, P., April 1996. “Solar Systems”, Accountancy:
Vol(117):pgs.51-54.
� Bassman, R., Nov. 1994. “Oil: Europe’s Power Industry”,
Europe: Vol(341):pg.14.
� Cool, K, Gee, F, Montgomery, I, Reuer, J, 1999. BP-MOBIL
and the Restructuring of the Oil Refining Industry, in Hitt, M,
Hoskisson, R, Ireland, R (ED’s) STRATEGIC MANAGEMENT:
COMPETITIVENESS AND GLOBALIZATION Edition 4,
Cincinnati: South-Western College Publishing, pg.C-174.
� July 15, 1995. “Over-refined Europeans: Oil Industry”, The
Economist: Vol(336):pg 47
� Ibid
� Ibid
� Guyton, J., Aug. 4, 1997. “Why Is The World’s Most
Profitable Company Turning Itself Inside Out?” Fortune:
Vol(136):pg.120-125.
� Royal Dutch Petroleum Company, Annual Report to
Shareholders 1996.
� Ibid.
� Ibid.
� Royal Dutch Petroleum Company, Annual Report to
Shareholders 1996.
� Ibid.
� Ibid.
� Royal Dutch Petroleum Company, Annual Report to
Shareholders 1996.
� Ibid.
� Shell Transport and Trading Company, p.l.c., Annual Report
to Shareholders 1996.
� Ibid.
� Ibid.
� Ibid.
� Ibid.
� Shell Transport and Trading Company, p.l.c., Annual Report
to Shareholders 1996.
� Ibid.
� Ibid.
� Guyton, J., Aug. 4, 1997. “Why Is The World’s Most
Profitable Company Turning Itself Inside Out?” Fortune:
Vol(136):pg.120-125.
� Jansenn, R., March, 1997. “The Hague: A New Breed of
Entrepreneur”, Europe: Issue(364):pg.38.
� Ibid.
� Guyton, J., Aug. 4, 1997. “Why Is The World’s Most
Profitable Company Turning Itself Inside Out?” Fortune:
Vol(136):pg.120-125.
� Ibid.
� Ibid.
� Ibid.
� Royal Dutch Petroleum Company Annual Report to
Shareholders 1996.
� Layman, P., July 29, 1996. “Shell Reorganized To Better
Focus Its Portfolio On Global Markets”, Chemical &
Engineering News: Vol(74):pg.25.
� Royal Dutch Petroleum Company, Annual Report to
Shareholders 1996
� Ibid.
� Ibid.
� June 24, 1995. “Shell On The Rocks”, The Economist:
Vol(335):pg.57.
� Knott, D., May 27, 1996. “Shell’s Microscope Focused On
Refining”, Oil & Gas Journal: Vol(94):pg.30.
� Royal Dutch Petroleum Company, Annual Report to
Shareholders 1995.
� Royal Dutch Petroleum Company, Annual Report to
Shareholders 1995.
� Royal Dutch Petroleum Company, Annual Report to
Shareholders 1996.
� Oct. 16, 1995, “Exxon-Shell Team to Develop North Europe
Gas Storage”, Oil & Gas Journal: Vol(93): pg.38.
� Royal Dutch Petroleum Company, Annual Report to
Shareholders 1996.
� Hunter, D., Sep. 18, 1996, “Shell Chemical Thinks Growth”,
Chemical Week: Vol(158): pg.34.
� Royal Dutch Petroleum Company, Annual Report to
Shareholders 1995.
� Royal Dutch Petroleum Company, Annual Report to
Shareholders 1995.
� Ibid.
� Ibid.
� Ibid.
� Royal Dutch Petroleum Company, Annual Report to
Shareholders 1996.
� Ibid.
� Clark, K., Aug. 5, 1996, “A Bigger, Richer World”, Fortune:
Vol(134): pg.102.
� “Global Scenarios 1995-200”, published by Royal
Dutch/Shell in 1995.
� Simpson, D., Mar/Apr 1995, “Planning In A Global
Business”, Planning Review: Vol(23): pg.25.
� Jun 24, 1995, “Shell On The Rocks”, The Economist:
Vol(335): pg.57.
� Guyton, J., Aug. 4, 1997. “Why Is The World’s Most
Profitable Company Turning Itself Inside Out?” Fortune:
Vol(136):pg.120-125.
� Oct. 22, 1997, “At Shell, Everyone is Dutch”, Business
Europe: Vol(37):pg.9.
� Dec. 11, 1996, “Shell to Revamp European Refineries”, New
York Times: pg.4.
� Taste, P., Dec. 11, 1995, “On The Cutting Edge: Shell”,
InformationWeek: Issue(557): pg.45.
� Clark, K., Aug. 5, 1996, “A Bigger, Richer World”, Fortune:
Vol(134): pg. 102.
� http://www.BigCharts.com
� Guyon, J., Aug. 4, 1997, “Why Is The World’s Most
Profitable Company Turning Itself Inside Out?”, Fortune:
Vol(136): pg.120-125.
_1079733329.bin
_1080311692.xls
Chart2ExxonRD/ShellBPAmocoMobilTexacoChevron
Company
Return
Average Shareholder Return 1994-96
18.9
17.9
15.2
14.5
13.3
12.6
11.9
Sheet1CompanyAverageExxon18.9RD/Shell17.9BP15.2Amoco1
4.5Mobil13.3Texaco12.6Chevron11.9
Sheet1
Company
Return
Average Shareholder Return 1994-96
Sheet2
Sheet3
_1079732871.xls
Chart119921992199319931994199419951995E1996E1996
OECD
Non-OECD
YEAR
DEMAND (billions of barrels per day)
WORLD OIL DEMAND
38.9
28.2
39.1
28
40
28.7
40.4
29.6
41
30.6
Sheet1YEAROECDnon-
OECDWORLD199238.928.267.1199339.12867.219944028.768.
6199540.429.670E19964130.671.6
Sheet10000000000
h
OECD
Non-OECD
YEAR
DEMAND (billions of barrels per day)
WORLD OIL DEMAND
Sheet2
Sheet3
Due 4/17/2020
Directions for the Individual Internal Analysis
Your boss has given you the assignment to understand a
company. You should choose a company that is not being done
by anyone else in your group. You need to do the following:
a. Identify the company’s business model ( how they make
money). Give a short history and overview of the firm’s
products.
b. You need to do an internal analysis of the firm. Identify their
resources and capabilities, and describe their leadership,
culture, organization structure, and core competencies.
c. Analyze their current position in the market (market share)
and determine what they have in their “luggage or not.” Discuss
the major issues facing the company internally. Use the models
of Value Chain, Business Model Canvas, VIRO and RBV
perspective.
d. Tie the company’s performance using financial and other
measures that to the abilities of the firm. You will need to
utilize your financial analysis for some of the data necessary to
understand how well the firm is doing.
Exhibits that should be attached to the report Value Chain, and
VRIO for the firm. It is the quality of data and interpretation
which matters. Exhibits should be referred to and discussed in
the report. Do not just repeat data, instead analyze and tell your
boss what the data means. Use headings to help organize your
report. Please make sure you use terms developed in class and
from the book. You need to cite your sources of data. Use end
notes to cite your sources. Be consistent in your format. You
may also include a reference page. The Maximum length is 8
pages with and additional 5 pages of exhibits. What you turn in
for this assignment you should be proud to give to any boss.
The report is for a business audience and needs to fit a more
business style of writing. Use the following web site for help if
you are unsure about business writing style. Use headings to
organize your work.
http://oregonstate.edu/dept/eli/buswrite/Business_Writing_Help.
html
Exhibits, preliminaries, bibliography, footnotes and endnotes,
and appendices are not included in the suggested page count.
Note that in several instances the Professor/Boss expects the use
of exhibits, e.g., financial statements. There are multiple points
at which “a graph will speak volumes.” Or a summary exhibit
will efficiently summarize a discussion. The page count
assumes 12-Point Times Roman font or equivalent, with one-
inch margins. Double spacing is easier for the professor to read
and make comments. However, generally a professional report
will be single (or perhaps one and a half) spacing.
A google.com search is certainly a beginning, but is NOT
sufficient. You must use sources such as Hoovers, Standard and
Poor’s Net Advantage, Business Insight, Morningstar,
ABI/INFORM, Books in Print (any books on the company, its
competitors or industry?), Business Source Premier, EDGAR,
Wall Street Journal, Business Week, Forbes, Fortune,
LexisNexis, Marquis Who's Who, New York Times Article,
Mergent, IBISWorld, and Wilson Business Full Text. There are
also hard copy references and specialty data bases at the library
as well as other sources at local libraries. Please make
Limestone’s Business Reference Librarian one of your best
friends. Use either MLA or APA format for your Bibliography
and make sure you include title, publication, and date.
Certainly the firm is more complex than we can do justice to
given our time frame and limitations on our data/information
sources. As indicated in the introduction, the purpose of the
overall project is to pull on as much of the perspectives as we
have learned throughout our formal business training as
possible in order to develop a robust understanding of a firm
and its environment. As the strategic consultant you are
working at very high levels in the firm to help the organization
consider its current situation and what it can and should do to
be better at achieving its vision/mission/ goals/objectives, an
improved strategy, and a sustainable competitive advantage. In
actuality such a task would draw on both primary and secondary
data and might take a consultant 18 months.
Suggested Outline of Report Content
(Suggested pages of text, about 10-15)
Introduction
· Purpose of analysis
· Overview/outline of written report
· Description of the company
I. Company/Organization/Internal Environment ( 6-8 pages)
**** Major thrust of the paper should be this
section)************
· Brief history (suggest including a Time Line as an exhibit)
· Vision/mission statements/strategic objectives
· Describe products/services/technologies
· Organization:
· Culture (1/2-1)
Leadership (1-2) remember to include analysis of
the board.
· Value Chain Analysis -
· Operations, Marketing, Supply Chain, Distribution
· Core competencies and Comparison
·
· Exhibits
· References
Individual Internal Analysis Report
Name:___________________________________
Firm: __________________
Strategic Analysis (90%)
Category (Weight)
1
2
3
4
Score
Overview of the firm history and product, current competitive
position. (10%)
Did not provide an overview of the Firm and Historical
Perspective and current situation.
Provided limited provide an overview of the firm and
Historical Perspective and current situation.
Some details and appropriate facts gave a good general
overview of the firm and Historical Perspective and current
situation.
Included good details and appropriate facts for an overview of
the firm, Historical Perspective and current situation.
Internal Environment – Mission, Vision, Leadership Culture,
(25%)
Analysis did not identify many of the components of an internal
analysis or major trends in the company’s abilities and
behavior. Limited application of concepts.
Analysis identified and evaluated some components of the
internal analysis, but mainly reported information rather than
analysis of the trends and issues in the industry. It is unclear if
they understood the company’s leadership, culture or
organization structure Data was superficial and they lacked
quality and breadth.
Analysis identified and evaluated most of the major trends and
issues utilizing a majority of the internal models. Ability to
integrate and synthesize the breadth of data. Analysis began to
show depth and quality.
Analysis indicates a comprehensive understanding of the
internal operations and the the ability to utilize the models to
build a good thesis of the internal abilities of the firm. They
understood the company’s leadership, culture or organization
structure It is clear that they understand and could apply the
concepts and model.
Internal Environment Value Chain and VIRO (30%)
Analysis did not correctly identify the firms abilities or use the
models.
Analysis superficially identified and evaluated some of
components involved in the Value chain.
Analysis correctly identified and evaluated most of firm’s value
chian, but limited understanding of the weaknesses of the firm.
Analysis indicates a thorough understanding of the firm’s
abilities both strengths and weaknesses .Accurately
demonstrated an understanding of how the models.
Quality of Data and Analysis
25%
Report provided little specific industry and firm data. Few
observations. Narrow scope. The analysis did not provide a
strengths and weakness Limited data sources used and logic is
not complete. Lack of understanding of the material. Many logic
errors that made following the logic of the write-up difficult.
Some data, but very superficial. Few observations and little if
any interpretation. Identified few abilities and opportunities and
threats. The logic was incomplete and had some major holes.
Limited understanding of the models. Some logic errors and
resulting argument was weak. Few sources.
Some non-obvious observations, sometimes interpreted well.
Good Data and observations, but needs more analysis.
Identified some elements The analysis provided adequate
rationale for the these. Few logic holes with the beginnings of
comprehensive understanding of the firm. Strong argument.
Good data.
Excellent data and well researched, Many issues observed in
depth. Reasonable interpretations of observations. Identified a
number of abilities and external factors.. The analysis used
well-reasoned supporting arguments. Strong understanding of
the concepts and the organization. Virtually no logic errors and
resulting excellent arguments. Wide variety of sources
Sub-total for Analysis
Writing (10%)
Category (Weight)
1
2
3
4
Score
Grammar/spel-ling
5 %
Many errors that interfered with understanding the write-up.
Many errors, but the write-up was generally understandable.
Some errors, but the write-up was very understandable.
Very few errors and very understandable.
Use of exhibits and bibliography, presentation
5%
No exhibits included. Disorganized and not clearly labeled
sections
Few exhibits included, but only general reference made to the
exhibits. Some organization (headings, labels, table of contents,
framing paragraphs)
Appropriate exhibits included each of which was referred at an
appropriate point in the write-up. Good organization (headings,
labels, table of contents, framing and summary paragraphs )
Included exhibits that were very well designed and each was
skillfully used in reinforcing the arguments in the write-up.
Good organization (headings, labels, table of contents, framing
and summary paragraphs )
Sub-total for Writing
Total
PAGE
3
MEMO
TO: BA 452 Students
RE: Directions for Individual Financial Analysis Report
You need to place yourself in the role of a financial analyst who
has been hired to help your firm identify its financial
weaknesses and strengths. The point of a financial analysis is
to discuss the financial health and how the firm using its
money. Examine if the firm is operating efficiently in
comparison to the industry. Find out if the firm has the
flexibility to invest in itself. Note what has been changing for
the firm. You need to compare the company to its competitors.
Indicate whether the firm has a competitive advantage. Make
use your knowledge from your previous accounting and finance
courses.
The deliverable is no more than 5 pages of text plus additional
pages for bibliography and exhibits. You must utilize and refer
to your exhibits in the report. Remember that your audience is
the top executives of the company. The data (numbers and
charts) go into tables and figures, write your analysis referring
to the data. It is the interpretation which matters. You need to
cite your sources of financial data. The report is for a business
audience and needs to fit a more business style of writing. Use
the following web site for help if you are unsure about business
writing style.
http://owl.english.purdue.edu/owl/resource/590/1/ . (Hint start
by looking at the firms’ 10Ks particularly the description and
managerial discussion of financials will help you understand
how the firm operates. SHARE your financials with your team
members to help with comparisons)
The outline of the financial analysis:
1. Title
2. Introduce the company and frame your report (make sure you
state the purpose of the report)
3. Discuss the Income statement and balance sheet ( must
include 5 years as exhibits)
a. Discuss the trends for the company
b. Do these trends echo the industry? If not discuss reasons
why. Do the numbers differ from the competitors and why.
c. Is there anything to be concerned about?
4. Discuss the Common sized income statement (3-5 years must
include as an exhibit)
a. Discuss the trends
b. Identify any changes
c. Discuss if their common sized numbers differ from their
competitors and why?
d. Is there anything to be concerned about?
5. Do the Ratio Analysis (profitability, liquidity, operating/asset
management, debt, industry specific) for the last 3 years. I want
numbers.
a. Compare to industry averages for the last 3 years (identify
who is in your average and must include ratios as an exhibit).
b. Identify the best and worst performing firm in the industry.
Explain why.
6. What has earnings been and how has this effected share price.
What do analysts say about the firm meeting its target earnings.
What about other firms in the industry?
7. Identify business units and product categories contribution to
revenues and growth or decrease of contribution.
8. Has the firm announced any moves which will change their
cash/debt position. (e.g. acquisitions, licensing deals,
divestitures).
9. Summarize the strengths and weakness based on the analysis.
10. At the end attach Bibliography and Exhibits. Cite the
sources for your numbers.
Remember – Headings, summaries, roadmaps, page numbers.
Spelling and grammar count!
Financial Analysis Rubric
Name:___________________________________
Company: __________________
Strategic Analysis (75%)
Category (Weight)
1
2
3
4
Score
Income Statement Analysis and Quarter Performance
(15%)
Analysis did not identify and evaluate major trends or changes
in the income statement or quarters.
Analysis identified and some of the major trends in the income
statement.
Analysis identified and evaluated most of the major trends in
the Income Statement and Quarters. Another Firm was used for
comparison.
Analysis thoroughly identified major trends and evaluated
reasons for changes or the lack of changes. Industry was used as
a comparison. Demonstrated that they understood why changes
occurred.
Balance Sheet Analysis
(15%)
Analysis did not identify and evaluate major trends or changes
in the Balance Sheet.
Analysis identified and some of the major trends in the Balance
Sheet.
Analysis identified and evaluated most of the major trends in
the Balance Sheet. Another Firm was used for comparison.
Analysis thoroughly identified major trends and evaluated
reasons for changes or the lack of changes. Industry was used as
a comparison. Demonstrated that they understood why changes
occurred.
Ratio
Analysis & Industry Comparison
(20%)
Analysis did not fully identify and evaluate the firm’s ratios.
Analysis identified and some of the major trends in the Ratios.
Analysis identified and evaluated most of the major trends in
the Ratios. Another Firm was used for comparison.
Analysis thoroughly identified major trends and evaluated
reasons for changes or the lack of changes. Industry was used as
a comparison. Demonstrated that they understood why changes
occurred and what the numbers meant to the firm.
Share Price and Business Unit Analysis (10%)
Analysis identified the share price, but did not account for
Business unit analysis.
Analysis identified trend in share price.
Analysis considered multiple indicators for share price
movement or lack. Discussion of analysts opinion was
included.
Analysis clearly identified what was happening in the share
prices and what was happening in the strategic business units.
Strategic Discussion of Financial Data
(15%)
The analysis did not provide a strengths and weakness or
opinion and/or recommendation.
The analysis provided a weak discussion of strengths and
weakness, opinion and/or recommendation.
The analysis provided an adequate rationale for the findings
from the financial analysis.
The analysis provided well-reasoned supporting arguments in
the discussion of strengths and weakness, opinion, and/or
recommendation.
Sub-total for Analysis
Writing and Logic (25%)
Category (Weight)
1
2
3
4
Score
Grammar/spel-ling/writing style (5%)
Many errors that interfered with understanding the write-up.
Writing flow was incomprehensible.
Many errors, but the write-up was generally understandable.
Writing flow was difficult.
Some errors, but the write-up was very understandable.
Very few errors and very understandable.
Logic
(10%)
Many logic errors that made following the logic of the write-up
difficult. Poor understanding of the Financial Analysis.
Many errors, but the general argument and finding were
understandable. Students just reported numbers.
Some logic errors, but there was little difficulty understanding
the arguments and findings. Students interpreted numbers.
Virtually no logic errors and resulting argument and findings
were very strong. Students used numbers to make arguments and
indicate findings.
Use of exhibits
(10 %)
Not all exhibits included.
Appropriate exhibits included, but only general reference made
to the exhibits.
Appropriate exhibits included each of which was referred at an
appropriate point in the write-up.
Included exhibits that were very well designed and each was
skillfully used in reinforcing the arguments in the write-up
Sub-total for Writing
Total
PAGE
3

More Related Content

Similar to Individual Strategic AnalysisRoyal DutchShell GroupTable of C.docx

Lesson6 whoaretheplayersppt
Lesson6 whoaretheplayerspptLesson6 whoaretheplayersppt
Lesson6 whoaretheplayerspptSarah Marks
 
Refining Forum 150615 Energy Union Follow up ExxonMobil_nn
Refining Forum 150615 Energy Union Follow up ExxonMobil_nnRefining Forum 150615 Energy Union Follow up ExxonMobil_nn
Refining Forum 150615 Energy Union Follow up ExxonMobil_nnKoen Slegers
 
Strategic Analysis - Statoil
Strategic Analysis - StatoilStrategic Analysis - Statoil
Strategic Analysis - StatoilGeorge Demiris
 
EY’s Petroleum Society Maturity Index
EY’s Petroleum Society Maturity IndexEY’s Petroleum Society Maturity Index
EY’s Petroleum Society Maturity IndexEY
 
Free Trade Economics
Free Trade EconomicsFree Trade Economics
Free Trade Economicstutor2u
 
Green Investing: Towards a Clean Energy Infrastructure
Green Investing: Towards a Clean Energy InfrastructureGreen Investing: Towards a Clean Energy Infrastructure
Green Investing: Towards a Clean Energy InfrastructureAndy Dabydeen
 
Case Competition Slides- Raw Image LLC
Case Competition Slides- Raw Image LLCCase Competition Slides- Raw Image LLC
Case Competition Slides- Raw Image LLCBridget Stokes
 
OBU – Oxford Brookes University BSc Honours in Applied Accounting.
OBU – Oxford Brookes University BSc Honours in Applied Accounting.OBU – Oxford Brookes University BSc Honours in Applied Accounting.
OBU – Oxford Brookes University BSc Honours in Applied Accounting.Academic Mania
 
Executive Resume of the Hydrocarbon Services Business Profile (2006)
Executive Resume of the Hydrocarbon Services Business Profile (2006)Executive Resume of the Hydrocarbon Services Business Profile (2006)
Executive Resume of the Hydrocarbon Services Business Profile (2006)CONAPRI
 
Risk management and financial reporting for commodity trading 2013
Risk management and financial reporting for commodity trading 2013Risk management and financial reporting for commodity trading 2013
Risk management and financial reporting for commodity trading 2013Jort Meijer (+31 651 083 840)
 
Opec - Organization of Petroleum Exporting Countries.
Opec - Organization of Petroleum Exporting Countries. Opec - Organization of Petroleum Exporting Countries.
Opec - Organization of Petroleum Exporting Countries. Vikas C
 

Similar to Individual Strategic AnalysisRoyal DutchShell GroupTable of C.docx (20)

Lesson6 whoaretheplayersppt
Lesson6 whoaretheplayerspptLesson6 whoaretheplayersppt
Lesson6 whoaretheplayersppt
 
Refining Forum 150615 Energy Union Follow up ExxonMobil_nn
Refining Forum 150615 Energy Union Follow up ExxonMobil_nnRefining Forum 150615 Energy Union Follow up ExxonMobil_nn
Refining Forum 150615 Energy Union Follow up ExxonMobil_nn
 
Strategic Analysis - Statoil
Strategic Analysis - StatoilStrategic Analysis - Statoil
Strategic Analysis - Statoil
 
EY’s Petroleum Society Maturity Index
EY’s Petroleum Society Maturity IndexEY’s Petroleum Society Maturity Index
EY’s Petroleum Society Maturity Index
 
Free Trade Economics
Free Trade EconomicsFree Trade Economics
Free Trade Economics
 
Green Investing Report
Green Investing ReportGreen Investing Report
Green Investing Report
 
Green Investing: Towards a Clean Energy Infrastructure
Green Investing: Towards a Clean Energy InfrastructureGreen Investing: Towards a Clean Energy Infrastructure
Green Investing: Towards a Clean Energy Infrastructure
 
Case Competition Slides- Raw Image LLC
Case Competition Slides- Raw Image LLCCase Competition Slides- Raw Image LLC
Case Competition Slides- Raw Image LLC
 
Exxon mobile company anaylsis
Exxon mobile company anaylsisExxon mobile company anaylsis
Exxon mobile company anaylsis
 
IE Application: Essay h
IE Application: Essay hIE Application: Essay h
IE Application: Essay h
 
IE Apllication: Essay H
IE Apllication: Essay HIE Apllication: Essay H
IE Apllication: Essay H
 
OBU – Oxford Brookes University BSc Honours in Applied Accounting.
OBU – Oxford Brookes University BSc Honours in Applied Accounting.OBU – Oxford Brookes University BSc Honours in Applied Accounting.
OBU – Oxford Brookes University BSc Honours in Applied Accounting.
 
161011cef.pptx
161011cef.pptx161011cef.pptx
161011cef.pptx
 
Eni SpA Case Analysis
Eni SpA Case AnalysisEni SpA Case Analysis
Eni SpA Case Analysis
 
GLOBAL LOGISTICS
GLOBAL LOGISTICSGLOBAL LOGISTICS
GLOBAL LOGISTICS
 
Executive Resume of the Hydrocarbon Services Business Profile (2006)
Executive Resume of the Hydrocarbon Services Business Profile (2006)Executive Resume of the Hydrocarbon Services Business Profile (2006)
Executive Resume of the Hydrocarbon Services Business Profile (2006)
 
Risk management and financial reporting for commodity trading 2013
Risk management and financial reporting for commodity trading 2013Risk management and financial reporting for commodity trading 2013
Risk management and financial reporting for commodity trading 2013
 
ELECTRIC CAR
ELECTRIC CARELECTRIC CAR
ELECTRIC CAR
 
Opec - Organization of Petroleum Exporting Countries.
Opec - Organization of Petroleum Exporting Countries. Opec - Organization of Petroleum Exporting Countries.
Opec - Organization of Petroleum Exporting Countries.
 
biodiesel_final3.ppt
biodiesel_final3.pptbiodiesel_final3.ppt
biodiesel_final3.ppt
 

More from annettsparrow

Initial Post  (250 words)Read and interpret the short story .docx
Initial Post  (250 words)Read and interpret the short story .docxInitial Post  (250 words)Read and interpret the short story .docx
Initial Post  (250 words)Read and interpret the short story .docxannettsparrow
 
initial post one paragraph intext citation and reference Require.docx
initial post one paragraph intext citation and reference Require.docxinitial post one paragraph intext citation and reference Require.docx
initial post one paragraph intext citation and reference Require.docxannettsparrow
 
Initial Post InstructionsTriggers are ethnocentric responses to .docx
Initial Post InstructionsTriggers are ethnocentric responses to .docxInitial Post InstructionsTriggers are ethnocentric responses to .docx
Initial Post InstructionsTriggers are ethnocentric responses to .docxannettsparrow
 
Initial Post InstructionsFor the initial post,consider thr.docx
Initial Post InstructionsFor the initial post,consider thr.docxInitial Post InstructionsFor the initial post,consider thr.docx
Initial Post InstructionsFor the initial post,consider thr.docxannettsparrow
 
Initial Post InstructionsFor the initial post, choose and ad.docx
Initial Post InstructionsFor the initial post, choose and ad.docxInitial Post InstructionsFor the initial post, choose and ad.docx
Initial Post InstructionsFor the initial post, choose and ad.docxannettsparrow
 
Initial Post InstructionsDiscuss the differences and similaritie.docx
Initial Post InstructionsDiscuss the differences and similaritie.docxInitial Post InstructionsDiscuss the differences and similaritie.docx
Initial Post InstructionsDiscuss the differences and similaritie.docxannettsparrow
 
Initial Post InstructionsAs we jump into the world of Alge.docx
Initial Post InstructionsAs we jump into the world of Alge.docxInitial Post InstructionsAs we jump into the world of Alge.docx
Initial Post InstructionsAs we jump into the world of Alge.docxannettsparrow
 
Initial Post InstructionsFor the initial post, respond to one .docx
Initial Post InstructionsFor the initial post, respond to one .docxInitial Post InstructionsFor the initial post, respond to one .docx
Initial Post InstructionsFor the initial post, respond to one .docxannettsparrow
 
Initial Post InstructionsAgenda setting can be a difficult t.docx
Initial Post InstructionsAgenda setting can be a difficult t.docxInitial Post InstructionsAgenda setting can be a difficult t.docx
Initial Post InstructionsAgenda setting can be a difficult t.docxannettsparrow
 
Initial Post Identify all the components of a cell. Describe the fu.docx
Initial Post Identify all the components of a cell. Describe the fu.docxInitial Post Identify all the components of a cell. Describe the fu.docx
Initial Post Identify all the components of a cell. Describe the fu.docxannettsparrow
 
Initial Discussion Board Post Compare and contrast life for col.docx
Initial Discussion Board Post Compare and contrast life for col.docxInitial Discussion Board Post Compare and contrast life for col.docx
Initial Discussion Board Post Compare and contrast life for col.docxannettsparrow
 
Infrastructure SecurityChapter 10Principles of Compute.docx
Infrastructure SecurityChapter 10Principles of Compute.docxInfrastructure SecurityChapter 10Principles of Compute.docx
Infrastructure SecurityChapter 10Principles of Compute.docxannettsparrow
 
Inital post please respond for the above post question one page with.docx
Inital post please respond for the above post question one page with.docxInital post please respond for the above post question one page with.docx
Inital post please respond for the above post question one page with.docxannettsparrow
 
Infornnation Technologyin Hunnan ResourceAnEmpirical .docx
Infornnation Technologyin Hunnan ResourceAnEmpirical .docxInfornnation Technologyin Hunnan ResourceAnEmpirical .docx
Infornnation Technologyin Hunnan ResourceAnEmpirical .docxannettsparrow
 
INFORMED CONSENT LETTER Page 1 of 2 SELF CONSENT .docx
INFORMED CONSENT LETTER  Page 1 of 2 SELF CONSENT .docxINFORMED CONSENT LETTER  Page 1 of 2 SELF CONSENT .docx
INFORMED CONSENT LETTER Page 1 of 2 SELF CONSENT .docxannettsparrow
 
INFORMATIONGOVERNANCEFounded in 1807, John W.docx
INFORMATIONGOVERNANCEFounded in 1807, John W.docxINFORMATIONGOVERNANCEFounded in 1807, John W.docx
INFORMATIONGOVERNANCEFounded in 1807, John W.docxannettsparrow
 
Informative Presentation Delivery OutlineI. HeaderSpeec.docx
Informative Presentation Delivery OutlineI.  HeaderSpeec.docxInformative Presentation Delivery OutlineI.  HeaderSpeec.docx
Informative Presentation Delivery OutlineI. HeaderSpeec.docxannettsparrow
 
Informed Consent FormBy the due date assigned, submit the Inform.docx
Informed Consent FormBy the due date assigned, submit the Inform.docxInformed Consent FormBy the due date assigned, submit the Inform.docx
Informed Consent FormBy the due date assigned, submit the Inform.docxannettsparrow
 
INFORMATION THAT SHOULD GO INTO PROCESS RECORDING FOR MICRO WORK.docx
INFORMATION THAT SHOULD GO INTO PROCESS RECORDING FOR MICRO WORK.docxINFORMATION THAT SHOULD GO INTO PROCESS RECORDING FOR MICRO WORK.docx
INFORMATION THAT SHOULD GO INTO PROCESS RECORDING FOR MICRO WORK.docxannettsparrow
 
Information Technology Capstone ProjectIn this course, learners .docx
Information Technology Capstone ProjectIn this course, learners .docxInformation Technology Capstone ProjectIn this course, learners .docx
Information Technology Capstone ProjectIn this course, learners .docxannettsparrow
 

More from annettsparrow (20)

Initial Post  (250 words)Read and interpret the short story .docx
Initial Post  (250 words)Read and interpret the short story .docxInitial Post  (250 words)Read and interpret the short story .docx
Initial Post  (250 words)Read and interpret the short story .docx
 
initial post one paragraph intext citation and reference Require.docx
initial post one paragraph intext citation and reference Require.docxinitial post one paragraph intext citation and reference Require.docx
initial post one paragraph intext citation and reference Require.docx
 
Initial Post InstructionsTriggers are ethnocentric responses to .docx
Initial Post InstructionsTriggers are ethnocentric responses to .docxInitial Post InstructionsTriggers are ethnocentric responses to .docx
Initial Post InstructionsTriggers are ethnocentric responses to .docx
 
Initial Post InstructionsFor the initial post,consider thr.docx
Initial Post InstructionsFor the initial post,consider thr.docxInitial Post InstructionsFor the initial post,consider thr.docx
Initial Post InstructionsFor the initial post,consider thr.docx
 
Initial Post InstructionsFor the initial post, choose and ad.docx
Initial Post InstructionsFor the initial post, choose and ad.docxInitial Post InstructionsFor the initial post, choose and ad.docx
Initial Post InstructionsFor the initial post, choose and ad.docx
 
Initial Post InstructionsDiscuss the differences and similaritie.docx
Initial Post InstructionsDiscuss the differences and similaritie.docxInitial Post InstructionsDiscuss the differences and similaritie.docx
Initial Post InstructionsDiscuss the differences and similaritie.docx
 
Initial Post InstructionsAs we jump into the world of Alge.docx
Initial Post InstructionsAs we jump into the world of Alge.docxInitial Post InstructionsAs we jump into the world of Alge.docx
Initial Post InstructionsAs we jump into the world of Alge.docx
 
Initial Post InstructionsFor the initial post, respond to one .docx
Initial Post InstructionsFor the initial post, respond to one .docxInitial Post InstructionsFor the initial post, respond to one .docx
Initial Post InstructionsFor the initial post, respond to one .docx
 
Initial Post InstructionsAgenda setting can be a difficult t.docx
Initial Post InstructionsAgenda setting can be a difficult t.docxInitial Post InstructionsAgenda setting can be a difficult t.docx
Initial Post InstructionsAgenda setting can be a difficult t.docx
 
Initial Post Identify all the components of a cell. Describe the fu.docx
Initial Post Identify all the components of a cell. Describe the fu.docxInitial Post Identify all the components of a cell. Describe the fu.docx
Initial Post Identify all the components of a cell. Describe the fu.docx
 
Initial Discussion Board Post Compare and contrast life for col.docx
Initial Discussion Board Post Compare and contrast life for col.docxInitial Discussion Board Post Compare and contrast life for col.docx
Initial Discussion Board Post Compare and contrast life for col.docx
 
Infrastructure SecurityChapter 10Principles of Compute.docx
Infrastructure SecurityChapter 10Principles of Compute.docxInfrastructure SecurityChapter 10Principles of Compute.docx
Infrastructure SecurityChapter 10Principles of Compute.docx
 
Inital post please respond for the above post question one page with.docx
Inital post please respond for the above post question one page with.docxInital post please respond for the above post question one page with.docx
Inital post please respond for the above post question one page with.docx
 
Infornnation Technologyin Hunnan ResourceAnEmpirical .docx
Infornnation Technologyin Hunnan ResourceAnEmpirical .docxInfornnation Technologyin Hunnan ResourceAnEmpirical .docx
Infornnation Technologyin Hunnan ResourceAnEmpirical .docx
 
INFORMED CONSENT LETTER Page 1 of 2 SELF CONSENT .docx
INFORMED CONSENT LETTER  Page 1 of 2 SELF CONSENT .docxINFORMED CONSENT LETTER  Page 1 of 2 SELF CONSENT .docx
INFORMED CONSENT LETTER Page 1 of 2 SELF CONSENT .docx
 
INFORMATIONGOVERNANCEFounded in 1807, John W.docx
INFORMATIONGOVERNANCEFounded in 1807, John W.docxINFORMATIONGOVERNANCEFounded in 1807, John W.docx
INFORMATIONGOVERNANCEFounded in 1807, John W.docx
 
Informative Presentation Delivery OutlineI. HeaderSpeec.docx
Informative Presentation Delivery OutlineI.  HeaderSpeec.docxInformative Presentation Delivery OutlineI.  HeaderSpeec.docx
Informative Presentation Delivery OutlineI. HeaderSpeec.docx
 
Informed Consent FormBy the due date assigned, submit the Inform.docx
Informed Consent FormBy the due date assigned, submit the Inform.docxInformed Consent FormBy the due date assigned, submit the Inform.docx
Informed Consent FormBy the due date assigned, submit the Inform.docx
 
INFORMATION THAT SHOULD GO INTO PROCESS RECORDING FOR MICRO WORK.docx
INFORMATION THAT SHOULD GO INTO PROCESS RECORDING FOR MICRO WORK.docxINFORMATION THAT SHOULD GO INTO PROCESS RECORDING FOR MICRO WORK.docx
INFORMATION THAT SHOULD GO INTO PROCESS RECORDING FOR MICRO WORK.docx
 
Information Technology Capstone ProjectIn this course, learners .docx
Information Technology Capstone ProjectIn this course, learners .docxInformation Technology Capstone ProjectIn this course, learners .docx
Information Technology Capstone ProjectIn this course, learners .docx
 

Recently uploaded

Introduction to AI in Higher Education_draft.pptx
Introduction to AI in Higher Education_draft.pptxIntroduction to AI in Higher Education_draft.pptx
Introduction to AI in Higher Education_draft.pptxpboyjonauth
 
Interactive Powerpoint_How to Master effective communication
Interactive Powerpoint_How to Master effective communicationInteractive Powerpoint_How to Master effective communication
Interactive Powerpoint_How to Master effective communicationnomboosow
 
Hybridoma Technology ( Production , Purification , and Application )
Hybridoma Technology  ( Production , Purification , and Application  ) Hybridoma Technology  ( Production , Purification , and Application  )
Hybridoma Technology ( Production , Purification , and Application ) Sakshi Ghasle
 
CARE OF CHILD IN INCUBATOR..........pptx
CARE OF CHILD IN INCUBATOR..........pptxCARE OF CHILD IN INCUBATOR..........pptx
CARE OF CHILD IN INCUBATOR..........pptxGaneshChakor2
 
Z Score,T Score, Percential Rank and Box Plot Graph
Z Score,T Score, Percential Rank and Box Plot GraphZ Score,T Score, Percential Rank and Box Plot Graph
Z Score,T Score, Percential Rank and Box Plot GraphThiyagu K
 
Web & Social Media Analytics Previous Year Question Paper.pdf
Web & Social Media Analytics Previous Year Question Paper.pdfWeb & Social Media Analytics Previous Year Question Paper.pdf
Web & Social Media Analytics Previous Year Question Paper.pdfJayanti Pande
 
1029-Danh muc Sach Giao Khoa khoi 6.pdf
1029-Danh muc Sach Giao Khoa khoi  6.pdf1029-Danh muc Sach Giao Khoa khoi  6.pdf
1029-Danh muc Sach Giao Khoa khoi 6.pdfQucHHunhnh
 
Sanyam Choudhary Chemistry practical.pdf
Sanyam Choudhary Chemistry practical.pdfSanyam Choudhary Chemistry practical.pdf
Sanyam Choudhary Chemistry practical.pdfsanyamsingh5019
 
1029 - Danh muc Sach Giao Khoa 10 . pdf
1029 -  Danh muc Sach Giao Khoa 10 . pdf1029 -  Danh muc Sach Giao Khoa 10 . pdf
1029 - Danh muc Sach Giao Khoa 10 . pdfQucHHunhnh
 
Measures of Central Tendency: Mean, Median and Mode
Measures of Central Tendency: Mean, Median and ModeMeasures of Central Tendency: Mean, Median and Mode
Measures of Central Tendency: Mean, Median and ModeThiyagu K
 
18-04-UA_REPORT_MEDIALITERAСY_INDEX-DM_23-1-final-eng.pdf
18-04-UA_REPORT_MEDIALITERAСY_INDEX-DM_23-1-final-eng.pdf18-04-UA_REPORT_MEDIALITERAСY_INDEX-DM_23-1-final-eng.pdf
18-04-UA_REPORT_MEDIALITERAСY_INDEX-DM_23-1-final-eng.pdfssuser54595a
 
Paris 2024 Olympic Geographies - an activity
Paris 2024 Olympic Geographies - an activityParis 2024 Olympic Geographies - an activity
Paris 2024 Olympic Geographies - an activityGeoBlogs
 
Arihant handbook biology for class 11 .pdf
Arihant handbook biology for class 11 .pdfArihant handbook biology for class 11 .pdf
Arihant handbook biology for class 11 .pdfchloefrazer622
 
Software Engineering Methodologies (overview)
Software Engineering Methodologies (overview)Software Engineering Methodologies (overview)
Software Engineering Methodologies (overview)eniolaolutunde
 
Student login on Anyboli platform.helpin
Student login on Anyboli platform.helpinStudent login on Anyboli platform.helpin
Student login on Anyboli platform.helpinRaunakKeshri1
 
Presentation by Andreas Schleicher Tackling the School Absenteeism Crisis 30 ...
Presentation by Andreas Schleicher Tackling the School Absenteeism Crisis 30 ...Presentation by Andreas Schleicher Tackling the School Absenteeism Crisis 30 ...
Presentation by Andreas Schleicher Tackling the School Absenteeism Crisis 30 ...EduSkills OECD
 
The basics of sentences session 2pptx copy.pptx
The basics of sentences session 2pptx copy.pptxThe basics of sentences session 2pptx copy.pptx
The basics of sentences session 2pptx copy.pptxheathfieldcps1
 
Organic Name Reactions for the students and aspirants of Chemistry12th.pptx
Organic Name Reactions  for the students and aspirants of Chemistry12th.pptxOrganic Name Reactions  for the students and aspirants of Chemistry12th.pptx
Organic Name Reactions for the students and aspirants of Chemistry12th.pptxVS Mahajan Coaching Centre
 

Recently uploaded (20)

Introduction to AI in Higher Education_draft.pptx
Introduction to AI in Higher Education_draft.pptxIntroduction to AI in Higher Education_draft.pptx
Introduction to AI in Higher Education_draft.pptx
 
Interactive Powerpoint_How to Master effective communication
Interactive Powerpoint_How to Master effective communicationInteractive Powerpoint_How to Master effective communication
Interactive Powerpoint_How to Master effective communication
 
INDIA QUIZ 2024 RLAC DELHI UNIVERSITY.pptx
INDIA QUIZ 2024 RLAC DELHI UNIVERSITY.pptxINDIA QUIZ 2024 RLAC DELHI UNIVERSITY.pptx
INDIA QUIZ 2024 RLAC DELHI UNIVERSITY.pptx
 
Hybridoma Technology ( Production , Purification , and Application )
Hybridoma Technology  ( Production , Purification , and Application  ) Hybridoma Technology  ( Production , Purification , and Application  )
Hybridoma Technology ( Production , Purification , and Application )
 
CARE OF CHILD IN INCUBATOR..........pptx
CARE OF CHILD IN INCUBATOR..........pptxCARE OF CHILD IN INCUBATOR..........pptx
CARE OF CHILD IN INCUBATOR..........pptx
 
Z Score,T Score, Percential Rank and Box Plot Graph
Z Score,T Score, Percential Rank and Box Plot GraphZ Score,T Score, Percential Rank and Box Plot Graph
Z Score,T Score, Percential Rank and Box Plot Graph
 
Web & Social Media Analytics Previous Year Question Paper.pdf
Web & Social Media Analytics Previous Year Question Paper.pdfWeb & Social Media Analytics Previous Year Question Paper.pdf
Web & Social Media Analytics Previous Year Question Paper.pdf
 
1029-Danh muc Sach Giao Khoa khoi 6.pdf
1029-Danh muc Sach Giao Khoa khoi  6.pdf1029-Danh muc Sach Giao Khoa khoi  6.pdf
1029-Danh muc Sach Giao Khoa khoi 6.pdf
 
Sanyam Choudhary Chemistry practical.pdf
Sanyam Choudhary Chemistry practical.pdfSanyam Choudhary Chemistry practical.pdf
Sanyam Choudhary Chemistry practical.pdf
 
1029 - Danh muc Sach Giao Khoa 10 . pdf
1029 -  Danh muc Sach Giao Khoa 10 . pdf1029 -  Danh muc Sach Giao Khoa 10 . pdf
1029 - Danh muc Sach Giao Khoa 10 . pdf
 
Mattingly "AI & Prompt Design: Structured Data, Assistants, & RAG"
Mattingly "AI & Prompt Design: Structured Data, Assistants, & RAG"Mattingly "AI & Prompt Design: Structured Data, Assistants, & RAG"
Mattingly "AI & Prompt Design: Structured Data, Assistants, & RAG"
 
Measures of Central Tendency: Mean, Median and Mode
Measures of Central Tendency: Mean, Median and ModeMeasures of Central Tendency: Mean, Median and Mode
Measures of Central Tendency: Mean, Median and Mode
 
18-04-UA_REPORT_MEDIALITERAСY_INDEX-DM_23-1-final-eng.pdf
18-04-UA_REPORT_MEDIALITERAСY_INDEX-DM_23-1-final-eng.pdf18-04-UA_REPORT_MEDIALITERAСY_INDEX-DM_23-1-final-eng.pdf
18-04-UA_REPORT_MEDIALITERAСY_INDEX-DM_23-1-final-eng.pdf
 
Paris 2024 Olympic Geographies - an activity
Paris 2024 Olympic Geographies - an activityParis 2024 Olympic Geographies - an activity
Paris 2024 Olympic Geographies - an activity
 
Arihant handbook biology for class 11 .pdf
Arihant handbook biology for class 11 .pdfArihant handbook biology for class 11 .pdf
Arihant handbook biology for class 11 .pdf
 
Software Engineering Methodologies (overview)
Software Engineering Methodologies (overview)Software Engineering Methodologies (overview)
Software Engineering Methodologies (overview)
 
Student login on Anyboli platform.helpin
Student login on Anyboli platform.helpinStudent login on Anyboli platform.helpin
Student login on Anyboli platform.helpin
 
Presentation by Andreas Schleicher Tackling the School Absenteeism Crisis 30 ...
Presentation by Andreas Schleicher Tackling the School Absenteeism Crisis 30 ...Presentation by Andreas Schleicher Tackling the School Absenteeism Crisis 30 ...
Presentation by Andreas Schleicher Tackling the School Absenteeism Crisis 30 ...
 
The basics of sentences session 2pptx copy.pptx
The basics of sentences session 2pptx copy.pptxThe basics of sentences session 2pptx copy.pptx
The basics of sentences session 2pptx copy.pptx
 
Organic Name Reactions for the students and aspirants of Chemistry12th.pptx
Organic Name Reactions  for the students and aspirants of Chemistry12th.pptxOrganic Name Reactions  for the students and aspirants of Chemistry12th.pptx
Organic Name Reactions for the students and aspirants of Chemistry12th.pptx
 

Individual Strategic AnalysisRoyal DutchShell GroupTable of C.docx

  • 1. Individual Strategic Analysis Royal Dutch/Shell Group Table of Contents I. Introduction A. Business Case B. Problem Statement C. Mission Statement D. Vision Statement II. External Assessment A. General Environment 1. Economic 2. Demographic 3. Socio-cultural 4. Technological 5. Regulatory/Political 6. Global 7. Environmental B. Competitive Environment 1. Industry Analysis
  • 2. a. Economic Structure b. Life Cycle Stage c. Porter 5 Forces Model d. Industry Attractiveness 2. Competitor Analysis a. Key Success Factors b. Strategic Group Analysis c. Competitor Analysis Model III. Internal Assessment A. Nature of the Firm 1. Culture & Leadership 2. Corporate Makeover 3. Organizational Structure B. Value Chain Analysis 1. Inbound Logistics 2. Operations 3. Outbound Logistics 4. Marketing & Sales 5. Service
  • 3. C. Core Competence D. Financial Ratio Analysis IV. Strategic Choice A. SWOT Analysis 1. General Strategic Orientation 2. Grand Strategy Clusters 3. Grand Strategy Selection Matrix B. Generic Strategy C. Recommendations 1. Corporate Level Strategy 2. Business Level Strategy V. Managerial Implications A. Implementation Issues Reference Section I. Introduction A. Business Case In a most unique arrangement, the Royal Dutch/Shell Group of Companies consists of two publicly traded companies that maintain their own distinct identities. The Royal Dutch Petroleum Company merged with the Shell Transport & Trading Company, p.l.c. in 1907 to contest the overwhelming power of John D. Rockefeller’s Standard Oil. This Anglo-Dutch alliance has grown into the second largest integrated oil firm in the world behind Exxon, and is the market
  • 4. leader in Europe. Today, the Royal Dutch/Shell Group (hereafter, referred to as The Group) has operations in oil, natural gas, chemicals, coal and other businesses. Neither Royal Dutch nor Shell is directly involved in the Group’s operations but own interests in the Group’s holdings on a 60:40 basis, respectively. The Group’s total revenue, or Net Proceeds, totaled ₤82.1 billion (pounds) or $128.3 billion (US dollars). Competing in such a vertically integrated industry, the Group is involved in everything from discovering and producing their own raw materials (upstream operations) to converting them into useful products and bringing them to consumers all over the world (downstream operations). With over 101,000 employees operating in 129 countries , Royal Dutch/Shell is emblematic of what it means to truly be a global company. B. Problem Statement Royal Dutch/Shell is faced with the same epidemic that other oil companies are currently facing in Europe: over-capacity. The problem for these firms is how to maintain growth and improve profitability in a mature market. Additionally, the Royal Dutch/Shell Group has their own individual corporate dilemma, which revolves around their cash flows and efficiencies. The Group indeed has a strong balance sheet and is financially sound but must decide what to do with their immense surplus of cash. Also, they are determined to increase their most coveted measure of operational success: Return on Average Capital Employed. C. Mission Statement The Royal Dutch/Shell Group does not have a distinct mission statement. Throughout my research of the company’s operations, performance, and culture, I would recommend the
  • 5. following as a fitting mission statement: “Our mission is to provide the world with sustainable forms of energy. Our global workforce is dedicated to providing above- average returns to our investors through continued operational excellence. We will continue to adapt to the evolving global economy, technological advances, and the ever-changing resources of the Earth with the utmost regard for the greater good of the environment and society at large.” C. Vision Statement Likewise, there is no official vision statement for the Royal Dutch/Shell Group. Based on my knowledge of the company, I would recommend the following as its vision statement: “To become the world’s preeminent energy company.” II. External Assessment A. General Environment 1. Economic Opportunities: · Oil prices increased during 1996. 1. Benefits integrated oil companies overall. 2. Specifically helps Exploration & Production companies. 3. Increased oil prices hurt Refining & Marketing profits. · European Intergovernmental Conference held this year (1996) could lead to some economic recovery; two main issues to be covered will be: 4. Review of the Maastricht Treaty
  • 6. 5. Expansion of the European Union to both the east and south · Some potential signs of a modest economic upturn in European Union. · GDP increased 0.5% in 1st Quarter of 1996 in 15 EU States. · Exports have grown larger than imports over the last five years. Threats: · Slow economic growth throughout European Union · Growth rate is down from 4% to 2.5% per year over last two decades. · Gross Domestic Product of fifteen EU countries is 6,910,477. · GDP/PPS (purchasing power standards) per head is 18,446; which accounts for discrepancies in currencies. · Consistently high unemployment · Average of the fifteen European Union countries is 10.8%. · Average of the eleven EU states in the “eurozone” is 11.5%. · Country-specific inflation problems across Europe. · Productivity growth is steadily declining. · Difficulty financing new projects. 2. Demographic Opportunities:
  • 7. · Population of 15 EU countries is 372.7million people. · Industry Breakdown · 6.9 million employed in agriculture · 45.4 million employed in industry · 102.7 million employed in services Threats: · 55% of consumers choose oil and gas based on location and convenience. · Many low-income families · 36% of single parents with children live in low-income housing. · 17% of total population lives in low-income housing. · Monthly net income and purchasing power of two manual workers with average salaries ranges has decreased from 1995 to 1996. · Population growth rate has dropped 2.5% over last two years (1995-96). 3. Socio-cultural Opportunities: · Creation of the ICEM (International Federation of Chemical, Energy, Mine and General Workers’ Union) · Equal opportunities for men and women
  • 8. · Creation of jobs-first priority Threats: · Europeans drive more fuel-efficient cars than Americans. The mini-car market is the most crowded in Europe. · New European culture discourages wastefulness of any kind. 4. Technological Opportunities: · New refining catalysts increase selectivity, and plant and process reliability. · Due to technological advances in the areas of exploration and production, the cost of finding and developing a barrel of oil, known as the reserve replacement cost, is decreasing for those firms that exploit the new technologies. “These costs should drop further due to technological advances that enhance ultimate recoveries of oil and gas from existing wells, as well as more efficient methods of finding new reserves.” · New Drilling Systems, new wireline tools, new drilling muds and cements, coiled tubing, increasingly sophisticated seismic analysis, improved data management, and new developments in rig maintenance. Threats: · Development of coal, liquefied natural gas, and nuclear power as substitute energy sources. · Improved technology of wind generators, solar power, and
  • 9. nuclear power 5. Regulatory/Political Opportunities: · Maastricht Treaty · Unifies EU countries for free trade. · Individual member states’ retain unique economic identities. · Thus far, European Union cooperation shows early signs of success. · European Commission introducing the creation of the “euro” · Through enlargement, the European Commission wants to extend stability, increase competition and grow in general in all areas. Threats: · Potential Currency Implementation Risks · Single currency could fail and hurt the overall economy and governments of the nations involved in the European Commission. · Disinterest in the euro may hurt its circulation altogether. Some companies may not want to be involved in using the euro. · Any significant changes in fundamental values between union states or conflicts could potentially weaken the EU’s cohesiveness. · Some policies favor coal and other energy sources over oil (i.e. heavy taxes). 6. Global
  • 10. Opportunities: · North American SUV’s becoming popular and are less fuel- efficient. · Latin American has stable inflation helping economic activity and petroleum consumption. · Relaxation of control over markets in China and Asia will boost demand for oil. · Once restructuring and deregulation happen in Japan, greater competition will occur stimulating more consumption, and thus more oil. Threats · North American economy becoming more efficient which means there is less energy needed for businesses to perform same operations. · Japan only uses fuel for 30% of energy (most common are coal, natural gas, and nuclear); competition will put downward pressure on price of oil. · Former Soviet Union is in shambles and energy consumption is falling. · Political turmoil in Africa and the Middle East has blocked significant economic growth. 7. Environmental Opportunities: · There are no identifiable opportunities at this time. The European Union is continuing to strengthen their environmental protection policies. Threats:
  • 11. · Environmental consciousness has risen worldwide. · The EU has extremely high air quality standards and enormous investments are needed to meet these standards. · The main threats to Europe’s air quality are nitrogen oxide, carbon monoxide, benzene and carbon dioxide. · The Auto-Oil is a study with a target of long-term pollution cuts. . The oil industry is facing many viable threats in the general environment. Mature economies have made use of the latest technologies to become more efficient and thus require less oil consumption. It is becoming more costly for oil companies to keep up with new environmental legislations. The European economy is continuing to decline with slow growth and consistently high unemployment. European consumers are purchasing oil and gas based on location and convenience rather than brand equity. However, the recent formation of the European Union and the anticipated introduction of their single monetary currency, the ‘euro’, will hopefully open the door to increased trade between member states and boost the European economy. B. Competitive Environment1. Industry Analysis Economic Structure The Royal Dutch/Shell Group competes with the other major international integrated oil firms that dominate the world oil market. Included in this strategic group are Exxon, Mobil, Chevron, Texaco, Amoco, and British Petroleum. This industry’s economic structure is an archetypal tight oligopoly that is entering its second phase of consolidation. Life Cycle Stage The integrated oil industry is clearly in maturity, as indicative of the problematic overcapacities where demand has failed to
  • 12. match supply and profit margins are dropping in Europe as well as many other developed economies. The industry is also beginning its second phase of consolidation where the larger integrated companies are acquiring various smaller national and regional oil companies to gain market share and achieve higher economies of scale. PORTER 5 FORCES MODEL Threat of New Entrants · High Capital Requirements: “Opening a new refinery took a long time and cost billions of dollars.” The vast amount of expenses related to exploring, drilling, refining, and marketing would deter most new entrants. · Economies of Scale: For every gallon of oil a company produces, the price goes down until the market reaches an equilibrium price. Most new entrants would not be able to remain profitable because the larger oil conglomerates have the advantage of the most efficient profit margins. · Expected Retaliation: If a new entrant were to enter the market, the major international integrated oil companies could cut prices and incur short-term losses to edge new competitors out of the market. · Highly Regulated Industry: Federal Energy Regulatory Commission (FERC) regulates oil industry within the United States. European Commission regulates economic concerns in Europe. Organization of Petroleum Exporting Countries (OPEC) influences world supply and pricing of oil. Brussels European Petroleum Industry Association as well as London’s Exploration and Production Forum are both involved with regulating the oil industry in Europe. · Low Differentiation: It is difficult for consumers to differentiate between oil, making the industry’s end product a commodity. The only method of differentiation that exists is in creating brand equity at gas stations based on cleanliness, space, and service. This opens the door to the growing amount
  • 13. of supermarkets offering gas based on price and convenience. Summary: With respect to the nature of competition within the integrated international oil conglomerates, the barriers to entry are very high. A new entrant would have an extremely difficult time establishing new refineries, exploration and drilling sites, and so forth. However, the growing number of supermarkets entering the market on the retail level is a microcosm of the industry’s problems in Europe. In this particular market, the barriers to entry are lower and supermarkets (although not within BP & Mobil’s strategic group) have certainly threatened the retail market share of oil in Europe. Bargaining Power of Suppliers · Buyer Importance: All of these major oil conglomerates would make up a large portion of a supplier’s total sales because of the sheer size of their organization’s needs. · Low Threat of Forward Integration: It is highly unlikely for one of Royal Dutch’s suppliers to pose a serious threat of acquiring a major international integrated oil conglomerate in an effort to integrate forward. · Suppliers’ Products Have Few Substitutes: Unless there is some unforeseeable technological advance that replaces the need for drilling machines and oil rigs, oil companies have little choice in finding a substitute for suppliers’ products. · Power of OPEC: OPEC controls 40% of the world’s oil production and about two-thirds of the world’s oil reserves. The supply of oil from member countries within OPEC is controlled and regulated so that the benefit lies with those countries. While British Petroleum and Mobil are not directly supplied with oil from OPEC in the physical sense, OPEC controls the production levels and pricing of oil. In an effort to protect their own interests, OPEC member countries strive to
  • 14. gain “a fair return on capital to those investing in the petroleum industry.” Whereas the non-OPEC countries, particularly those in the Organization of Economic Cooperation and Development, are the primary consumers of most of the world’s oil supply. Summary: Because the oil industry is such a highly vertically integrated industry, it has less reliance on suppliers than a traditional company that puts their product on the shelf of a store. Therefore, the physical suppliers of machinery and tools to major integrated oil companies have little overall power. However, OPEC’s presence plays a significant role in the supply (more importantly, the pricing) of oil extracted from these member countries. “OPEC’s degree of success in balancing the market will be a key to prices.” As an indirect supplier, OPEC has an overwhelmingly important role in the production, pricing, and overall supply of oil to the world. Bargaining Power of Buyers · Product is Undifferentiated: To the buyers’ advantage, oil and its byproducts are commodities and cannot be highly differentiated. While many gas stations at the retail level may try to differentiate their stations based on space, cleanliness, and overall quality of service, the end product (gasoline) that consumers put in their cars are homogeneous. · Buyers Face Few Switching Costs: There are relatively few switching costs involved in the oil industry. At the retail level, a buyer (who is actually a consumer at the same time) can switch from Shell to Mobil with no switching costs. At the wholesale level, utility companies have some contractual obligations to satisfy but switching between oil companies is not drastically difficult. · Low Threat of Backward Integration: It is highly unlikely that buyers could have the power (and cash) to vertically integrate backwards and acquire Royal Dutch. For example, during both
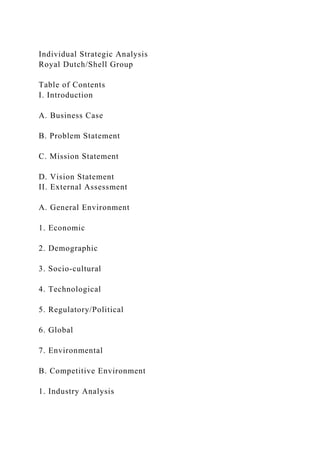
  • 15. oil shocks of the 1970’s, gasoline prices were through the roof and cars were lined up around the corner from the gas stations. Consumers and corporations could not and did not band together and demand lower prices or higher quality because the power lied with the oil companies. An asset to these large oil firms is that the demand for their product is relatively inelastic. When the economy is in a recession and money is tight, consumers will stop buying luxury items, but they still fill their cars with gas and heat their homes. · Buyers Do Not Make Up Large Fraction of Suppliers’ Sales: The amazing scope of Royal Dutch’s sales reach millions of industries, corporations, and individuals all over the world. Their size and diversification works to their advantage because they do not rely heavily on one specific buyer for a large percentage of their overall sales. · Worldwide Demand for Oil: As the graph depicts, trends indicate that the world demand for oil is steadily rising each year. Short-term volatility exists in the energy market but the graph illustrates the world’s continued reliance on oil. Summary: The overall bargaining power of buyers in this industry is relatively low. Buyers of these oil conglomerates do not have the power to bargain down prices or force higher quality. Generally, a buyer does not have the bargaining power to have competing oil firms continually fight over a customer because no one customer makes up that large fraction of sales. The only serious potential threat that buyers pose in this industry is the overall worldwide demand for oil. Although the demand for oil is still increasing, the potential threat of these buyers would lie solely with the overall need and demand for oil. For example, if worldwide demand for oil plummeted because of some new substitute for oil (to be discussed next), this would have a powerful effect on the oil industry.
  • 16. Threat of Substitute Products · Alternative Forms of Energy · Natural Gas: Many companies and countries, specifically in the West, are diversifying their energy sources by increasing the levels of natural gas to offset the volatility of oil prices. “In terms of market share, natural gas has grown from 19% to 23% in the past 20 years, while oil has declined from 49% to 40%, and coal from 30% to 27%.” Natural gas is more environmentally sound than oil and is also cheaper to produce. “In the foreseeable future, we expect natural gas consumption worldwide to grow at about three times the rate of crude oil usage.” · Gasification: Integrated Gasification Combined Cycle (IGCC) is a process that transforms a solid, gas, or liquid into a useful form of energy through an oxidation process. Additionally, gasification does not have the heavy cleanup costs that current energy producing systems have because “the wasted heat from the turbines raises steam, which may be put into a steam turbine to make more electricity.” · Wind Power: While not as dominating as natural gas, the introduction of wind power as an alternative source of energy has been increasing greatly, particularly in Europe. “After surpassing the US in 1994, European production has been growing at breakneck speed. As a result, the Brussels project that had aimed at providing 2 percent of the European energy needs with Aeolian or “wind” energy by the year 2005 has been amply exceeded.” · Solar Power: It is clear to scientists that the power provided by the sun is a major alternative source of energy. “In just half an hour enough of the sun’s energy is received by the earth to power mankind’s activities for a whole year.”
  • 17. However, the ability to capture this energy and make it compatible is easier said than done. There has been an increasing number of solar panel additions for home heating, but less of a spark over the once popular innovative idea of solar powered cars. · Long-term Vision of Potential Market Threats: In an effort to avoid self-indulgence, large internationally integrated oil companies cannot be naive to the fact that some day the world will run out of oil. There is a finite amount of oil in this world, which cannot be recycled, and our society continues to rely heavily on oil as a primary resource. In order to effectively strategize for the future, major oil companies must keep this in the back of their heads so they will not dissolve when the oil industry reaches decline. Rather, they must be thinking about solutions to alternative forms of power now. Summary: The overall threat of substitute products for the foreseeable future is moderate. Despite what some have speculated, oil is expected to remain the main energy source in Europe and the rest of the world. There have been suggestions that the oil industry should be aware of the threat of substitute products, such as alternative fuels and energy sources. These warnings, however, have been disregarded for the foreseeable future, although many believe the threat of substitute products will become eminent sometime in the 21st Century. Level of Competitive Rivalry – Cutthroat Competition · Slow Growth Industry in a Tight Oligopoly: As mentioned, BP & Mobil are competing in a tight oligopoly of firms that are very balanced and diversified with deep pockets. Additionally, being in the maturity phase of the life cycle provides for smaller growth throughout the industry since supply has begun to outstrip demand. · High Storage Costs: There are high costs involved in storing oil and its byproducts. As the industry continues to struggle with overproduction in the European oil market, reliance on
  • 18. storage has become more and more expensive. · Lack of Differentiation: The oil market is undifferentiated on product quality because oil is a commodity. The only source of differentiation for these companies is with support services but not the direct product itself. · Price Wars: There is intense price competition between service stations and the growing number of supermarket stations. These supermarket stations are capitalizing on the overcapacity of oil producers and using this to their advantage. With overcapacity in Europe, the supply curve shifts to the right, hence lowering the price supermarkets pay for their gasoline. The large integrated oil firms such as Royal Dutch/Shell continue to produce a large amount of oil because if they produce any less it will be cost inefficient. Additionally, the supermarkets were wise enough to sell their gas at cheaper prices in order to gain market share over the integrated oil companies. · Capacity Added in Large Increments: The clear-cut problem facing the oil industry, particularly in Europe, is the overcapacity of oil firms where demand has failed to match supply. · Diverse Competitors: Participating in a global industry, these international integrated oil companies focus on various aspects of what is referred to as the “oil business”. These oil conglomerates focus on everything from exploration and production, to drilling, refining and marketing. This once again illustrates how vertically integrated the oil industry has become. · High Strategic Stakes: An industry that is in the earlier stages of its life cycle experiencing low levels of competitive rivalry would have less at stake when making a strategic shift. The oil industry, however, has very intense rivalry between firms; and therefore there are very high strategic stakes involved with each managerial decision and strategic move. · High Exit Barriers: · Specialized Assets: Specialized assets in this industry include expensive oil rigs and refineries that would likely be difficult to
  • 19. sell. Because of this difficulty, a company leaving the industry would suffer a substantial loss when ridding themselves of these assets. · High Fixed Cost of Exit/Government Regulation: “Some companies might abandon Europe were it not for the extraordinary high cleanup costs involved.” Europe has strict regulations on the cleanup of industrial sites. Industry experts have described the cost of complying with these regulations horrendous. “And the benefits of closing a refinery will accrue to the whole industry, i.e., to a firm’s rivals: as European output falls, their margins should rise. Therefore, while moaning about overcapacity, the oil companies prefer to hope that others will cut back first.” · Emotional Barriers: “But, on top of any rational case for holding on to refineries, Western oilmen may also be suffering form a touch of nostalgia. For decades, being an oil major has meant controlling the flow of oil at all stages from well to petrol pump…They are being asked to drop a once-vital link in their much-cherished chain.” Summary: The international integrated oil industry is clearly in cutthroat competition as it enters into its second phase of consolidation in the maturity phase. Overcapacity, a weak demand, and slow growth in the industry have been the source of Europe’s oil dilemma. The growing population of supermarket service stations and their price wars with the major integrated oil companies further fuels this intense rivalry. Closing shop and leaving the European market might appear to be an attractive solution to this problem but the enormous exiting costs and emotional barriers make it extremely difficult to do so. INDUSTRY ATTRACTIVENESS Being that the international integrated oil industry is already in maturity with a tight oligopoly, the attractiveness for new
  • 20. entrants is very low on the global scale. However, the supermarket service stations in Europe have successfully entered the retail gas market but have by no means established themselves as a credible threat of entering the global market of integrated oil conglomerates. For incumbent oil companies it is more attractive for them to remain in the European market rather than leave because of the overwhelming exiting costs. Established firms are facing lower profitability due to overcapacity, making the overall attractiveness for incumbents lackluster at best. As the industry enters its second phase of consolidation, many oil conglomerates are acquiring smaller companies, merging with others, and forming strategic alliances in an effort to survive the stalling growth in the European oil industry. Royal Dutch’s ultimate advantage over smaller oil companies is to capitalize on economies of scale and achieve more efficient production costs. Being that the Royal Dutch/Shell Group has a dominant position in the European oil market, the industry is more attractive than their incumbent competitors. The power in the industry lies with the suppliers in a unique relationship in which OPEC indirectly regulates the production levels and pricing of oil. There is a moderate threat of substitute forms of energy, more so with respect to long-term future strategies. 2. Competitor Analysis Strategic Group Analysis The Royal Dutch/Shell Group competes within the international integrated oil industry, which is composed of the largest and most diversified oil companies. Their diversification is twofold - both geographically as well as their scope of operations. Their closest competitors include Mobil, BP, Exxon, Amoco, Texaco, and Chevron. 0
  • 21. 10 20 30 40 50 60 70 80 DEMAND (billions of barrels per day) 1992 1993 1994 1995 E1996 YEAR WORLD OIL DEMAND Non-OECD OECD Royal Dutch Petroleum Co. Netherlands Shell Transport & Trading Co. United Kingdom P. D. S. Hadfield Human Resources S. M. G. Hodge Treasurer C. J. Knight Corporate Advice Unit J. A. de Kreij Controller J. H. Schraven Legal P. B. Watts
  • 22. Planning, Environment & External Affairs J. A. Colligan Regional Business Asia-Pacific & S. America H. J. M. Roels Regional Business Middle East & Africa C. E. Fay Regional Business Europe R. M. Sprague Strategy & Business Services A. J Parsley New Business Development T. N. Warren Research & Technical Services Exploration & Production W. A. Loader South Zone P. D. Skinner President Shell Int'l.Trading & Shipping Co. Ltd. L. E. SLoan East Zone G. J. van Luijk Research & Technical Services D. Varney Europe Zone P. D. Skinner Strategy & Business
  • 23. Services Oil Products J. W. Dawson Specialties J-P Meurin President Shell Chemicals Europe Ltd. G. M. Ferris Petrochemicals outside Europe B. Stouthamer Research & Technical Services E. Henkes Strategy & Business Services Chemicals H. G. Dijkgraaf Chief Executive Shell International Gas Ltd., Shell Coal International Ltd. Gas & Coal C. A. J. Herkstroter President ROYAL DUTCH/SHELL GROUP Royal Dutch Petroleum Co. Netherlands Shell Transport & Trading Co. United Kingdom P. D. S. Hadfield Human Resources S. M. G. Hodge Treasurer C. J. Knight Corporate Advice Unit
  • 24. J. A. de Kreij Controller J. H. Schraven Legal P. B. Watts Planning, Environment & External Affairs J. A. Colligan Regional Business Asia-Pacific & S. America H. J. M. Roels Regional Business Middle East & Africa C. E. Fay Regional Business Europe R. M. Sprague Strategy & Business Services A. J Parsley New Business Development T. N. Warren Research & Technical Services Exploration & Production W. A. Loader South Zone P. D. Skinner President Shell Int'l.Trading & Shipping Co. Ltd. L. E. SLoan East Zone G. J. van Luijk Research & Technical
  • 25. Services D. Varney Europe Zone P. D. Skinner Strategy & Business Services Oil Products J. W. Dawson Specialties J-P Meurin President Shell Chemicals Europe Ltd. G. M. Ferris Petrochemicals outside Europe B. Stouthamer Research & Technical Services E. Henkes Strategy & Business Services Chemicals H. G. Dijkgraaf Chief Executive Shell International Gas Ltd., Shell Coal International Ltd. Gas & Coal C. A. J. Herkstroter President ROYAL DUTCH/SHELL GROUPKey Success Factors Company Technology Globalization Operational Excellence RD/Shell
  • 26. 4 5 3 Exxon 5 4 5 Amoco 4 3 3 Exxon and Amoco were selected for the competitor analysis because they are both world leaders in the oil industry and are within Royal Dutch/Shell’s strategic group. The three firms were rated (not ranked) on a scale from 1-5, with 1 representing poor performance in the category and 5 indicating excellent performance in the category. Technology, globalization, and operational excellence were chosen because they are, above and beyond, the most integral elements to success in the global oil market. In today’s dynamic and ever-changing economy, the latest technologies must be developed and employed to find new ways of discovering oil, refining the crude, and transporting it across the globe. As the name might suggest, being apart of an extremely competitive “international” integrated oil industry requires these firms to expand their base of operations in an effective manner to developing countries and emerging markets around the world. Finally, operational excellence was chosen because as mentioned in the Porter 5 Forces Analysis, the distinguishable aspect of the oil industry that every company is facing is the looming idea that there is a finite amount of resources on Earth. Having the foresight to realize this and act on this notion is what drives operational excellence; firms must operate as efficiently and effectively as possible in order to squeeze as much as possible from their profit margins. Competitor Analysis
  • 27. Exxon Amoco Goals *Develop & employ best technologies. *Maintain strong financial position. *Pursue opportunities and expand base of operations home and abroad. *Inc. market share & improve profitability & efficiency in Europe downstream market. Assumptions *Industry remains in slow growth. *Continue to benefit from cost reduction programs. *Industry is in slow growth. *Restructuring will have positive long-term effects on all sectors. Capabilities *Strong technical background. *Strong production & asset management. *Strong technology. *Excellent profit margins & ROA compared to competitors. Strategies *Expansion into emerging markets. *Identify quality investments. *Evaluate and divest marginal properties and under-performing assets while expanding into emerging markets. Satisfaction *Somewhat, room for improvement with financial performance. *No, European downstream market is suffering.
  • 28. Next Move *Continue expansion. *Solidify position as #1 oil company in the world. *Joint Venture with other oil company and/or supermarket to regain market share. Vulnerability *Weak profit margins. *Lack of brand equity in Europe. *Weak efficiencies upstream. Retaliation *Potential merging of competitors could take away market share. *Mergers, acquisitions, joint ventures from competitors.RESPONSE – RED THREAD FOR COMPETITOR ANALYSIS Royal Dutch/Shell’s response to their competitors’ actions is to maintain their position as the market leader in Europe and use their new innovative management to their advantage. By this, the Group should continue to not only defend their position but also innovate new technologies and form new partnerships to maintain a high percentage of market share in the industry. III. Internal Assessment A. Nature of the Firm Understanding the character of the Royal Dutch/Shell Group is a complex and articulate process. The firm is made up of two publicly traded companies, the Royal Dutch Petroleum Company and the Shell Transport & Trading Company, and in such a vertically integrated industry, an organization of this scope takes on a persona of its own. “It operates in 130 countries around the world and controls every aspect of oil production from the ground to the gas pump. With headquarters in both London and The Hague, the company oversees 101,000
  • 29. employees, 54 refineries, and 47,000 gas stations.” To add to the perplexity, Royal Dutch/Shell is undergoing a major restructuring of the entire organization and a drastic change in their global strategy. The Internal Analysis that follows examines both the old culture and management as well as the new organization of the Group that was born on January 1, 1996. 1. Leadership & Culture The upper echelon of the Group’s executive management is the Supervisory Board. The Supervisory Board meets every month with the Royal Dutch Managing Directors and the Directors of the Shell Transport and Trading Company. Additionally, the Supervisory Board meets with the Royal Dutch’s Board of Management to maintain a direct relationship with the executive management of the Group. Supervisory Board The Supervisory Board of the Royal Dutch/Shell Group is lead by L. C. van Wachem, who has been the Chairman since 1992. Prior to being Chairman, he was a Managing Director of the Company from 1977-82 and President from 1982-92. T. C. Braakman has been a member of the Supervisory Board since 1989 and was Chairman of the Board of Management of Nationale-Nederlanden N.V. K. V. Cassani has also been a member of the Board since 1989 and was previously was Vice- Chairman of the Board of Directors of IBM Corporation. The fourth member of the Supervisory Board is J. M. H. van Engelshoven, who has served since 1991. Prior to serving on the Board, he was a Managing Director of the Company since 1982. K. O. Pohl has been on the Board since 1992. Before coming to Royal Dutch, Mr. Pohl was a partner in Sal. Oppenheim Jr. & Cie. and was also the President of Deutsche Bundesbank. H. de Ruiter has served on the Supervisory Board since 1994. The final member of the Supervisory Board is Mr. J. D. Timmer. Before joining the Board in 1996, he was the
  • 30. President and Chairman of the Board of Management of Philips Electronics N.V. Royal Dutch Petroleum Company The Board of Management for Royal Dutch Petroleum Company is spearheaded by C. A. J. Herkstroter, President of the Group since 1992. Prior to being named President, Herkstroter was a Managing Director of the Company since 1989. The second member of the Board of Management is M. A vand don Bergh, who has been a Managing Director of the Company since 1992. The last member of the Board of Management is S. L. Miller. Mr. Miller has been a Managing Director since July, 1996. The General Attorney for the Group is R. van der Vlist. Shell Transport & Trading Company, p.l.c. The Shell Transport & Trading Company consists of six directors and is lead by John Jennings, the Chairman and Managing Director. Mr. Jennings has been Managing Director since 1987 and Chairman of Shell since 1993. His exceptional leadership of Shell will end next year when he is scheduled to retire on July 1, 1997. Elected to take his place is Mark Moody-Stuart, who has been a Group Managing Director of Shell since 1991. Sir Antony Acland, a Director of Shell, has been a non- executive Director since 1991 and has extensive diplomatic experience and was H. M. Ambassador to the USA from 198-91. The Lord Armstrong of Ilminster has been a non-executive Director since 1988. Prior to being on the Board of Directors he served as a director for various other companies, including BAT Industries and RTZ Corporation. Sir Peter Holmes is one of the longest serving Directors who has been on the Board since 1982 and was a Group Managing Director the eleven years prior. Professor Robert O’Neill of Oxford has been a non-executive Director of Shell since 1992.
  • 31. Sir Ronald Oxburgh has been a non-executive Director of Shell since 1996. Prior to joining Shell, he was the Chief Scientific Adviser of the Ministry of Defense from 1988-983. The final member of the Board of Directors, Sir William Purves, has been on the Board since 1993. He is also currently the Chairman of HSBC Holdings p.l.c. and the British Bank of the Middle East. 2. Corporate Makeover Leadership Seminar Prior to the introduction of their colossal corporate makeover, the Royal Dutch/Shell Group has been revered for years for its continued excellence in the oil industry. Perhaps the thought on everyone’s mind is ‘If it aint’ broken, don’t fix it’. The Group has been ranked in the Fortune Magazine’s Global 500 year in and year out, while they have spent three consecutive years as the world’s leader in total profits. The Group’s superb functional leadership trickles down from their President, C. A. J. Herkstroter. It’s not Mr. Herkstroter’s perfectionism that makes him an astounding leader, rather his prudence to recognize that his seemingly ‘perfect’ firm (in the eyes of everyone else) was losing touch with the evolving society. “The oil company was too inward looking, had missed the information revolution, and had failed in its outward communication.” The Group suffered a great deal of negative press after their decision to sink the Brent Spar, a large oil storage rig in the Atlantic. Furthermore, the Group’s operations and involvement in Nigeria were chastised after Nigerian government killed Ken Saro Wiwa, a leader of a political opposition group. Managing a global giant can obviously encounter various environmental and political problems across different cultural bounds. Herkstroter demonstrated the resolve and agility to admit to some poor ethical decisions and has reshaped the company into
  • 32. a much flatter organization with a much more innovative culture and higher regard for ethical concerns. “If an entrepreneur is someone who builds a company to fill a need in the marketplace, perhaps Herkstroter can be described as a new kind of entrepreneur – one who rebuilds a company to address changes in the marketplace.” Cultural Revolution “This is IBM before Gerstner, GE before Welch, Coke before Coizueta,” writes Fortune Magazine’s Janet Guyon’s in an impressive analysis of what she refers to as “Shell’s mid-life crisis.” The oil giant’s decay is a result of their culture: “Shell is also an insular company, saddled with introverted control freaks, a Byzantine organizational structure, and a controversial public image. Many of its managers rarely talk to the rank and file.” In order to pull a corporate 180, CEO Cornelius Herkstroter gathered every global executive together for what appeared as a congregation of conservative geniuses at a corporate retreat, many of which had never met before. After an American consulting overhaul consisting of Myers- Briggs personality tests and leadership games, the Group has discovered the only way to change their global corporation is to start with the top. It has become the mission of Cornelius Herkstroter and the rest of the Royal Dutch/Shell Group to lose that reputation and turn this old-fashioned European firm into a “fast, flexible, environmentally aware organization that runs more efficiently, is more innovative, and is capable of moving Shell into profitable new business.” 3. Organizational Structure The Royal Dutch/Shell Group is a holding company made up of the two publicly traded companies: Royal Dutch Petroleum Company (60%) based in the Netherlands; and the Shell Transport & Trading Company (40%) based in the United
  • 33. Kingdom. While the Royal Dutch/Shell Group is indeed a holding company, their organizational structure is a Multi-divisional Structure with a Related-Linked Strategy, not a Holding Company Strategy as one might automatically assume. “At the beginning of 1996, Anglo-Dutch oil and chemicals giant Royal Dutch/Shell pulled into place a newly reorganized structure that abolished its former complex matrix of regional, functional and business-sector organizations.” Royal Dutch/Shell has a unique structure in that they simultaneously have a centralized and decentralized strategy. There is a small Corporate Center that advises the President with managing the overall corporate strategies. This is the main strategic control used by the Supervisory Board and the Board of Management to control the individual firms’ strategies. Within this large organization they have consolidated their organization into four separate business entities: Exploration & Production, Oil Products, Chemicals, and Gas & Coal. Within the Group there are eleven Service Companies whose primary function is to advise and assist the subsidiaries of the Royal Dutch/Shell Group. The Operating Companies are the physical business units that discover, produce, and market the oil, natural gas, chemicals, coal and other businesses throughout more than 120 countries of operation. “In the new structure, also devised with advice from McKinsey, the operating companies will have a single line of command and report only to a functional boss.” The Group’s old structure was far too complicated and each employee would have to report to several managers. Shell Transports & Trading Company’s Chairman, John Jennings, said, “The new organization will enable us to operate better at regional and local levels, but it will be a few years before the
  • 34. full impact is felt. This year we expect results to get through to the bottom line.” B. Value Chain AnalysisPrimary Activities 1. INBOUND LOGISTICS For such a highly vertically integrated industry like that of the oil industry, inbound logistics includes all of the processes that Royal Dutch/Shell takes in order to attain the resources it needs (primarily, crude oil) before it refines it into the final product. The inbound logistics for an integrated oil firm is the equivalent of their upstream operations and includes exploration, production, drilling, labor costs, and other overhead costs used to extract crude oil from the resources. · Technology Opportunities: · Troll gas platform was finished in 1995 in Norway and is the largest concrete structure in the world. · Draugen platform was renovated during 1995 and its production capacity increased by 30%. · “The world’s largest seismic survey was completed in the Kazakh sector of the Caspian Sea.” · Procurement Neutral: · Purchase of oil rigs, ships, drilling equipment, and various platforms. · Investments for drilling in emerging markets. · Working together with Exxon to build three large natural gas storage sites underground in Germany and the Netherlands, costing about $1.2 billion.
  • 35. Threats: · Environmental costs to upgrade operations in Nigeria, as well as “improved community relations” activities. 2. OPERATIONS The following aspect of downstream activities is the refining process, which transforms crude oil into fuels, lubricants, and petrochemicals. The refining process begins with distillation, which brings the crude oil to a boiling point and separates the different grades of oil. Next, the crude goes through a series of advanced refining processes called coking, catalytic cracking, hydrocracking, hydrofining, and finally reforming to produce the highest quality of oil. · General Operations Threats: · Below-average Return on Average Capital Employed, which is the primary indicator of how efficient an oil company is operating. · Human Resources Threats: · Shell Chemical cut 700 jobs in order to trim costs and improve productivity. · Technology Opportunities: · PER+ project in the Netherlands will be fully operational by 1997 and will be a huge improvement of the Pernis refinery. · World’s largest producer of natural gas. · Procurement
  • 36. Neutral: · Purchase of refining machines, buildings, and facilities. Threats: · Renovating the Nanterre lubricants plant and plan to cut back on refining at the Berre plant in France. 3. OUTBOUND LOGISTICS The next aspect of the downstream activities is the transportation of the finished product to consumers around the world. The major elements of outbound logistics include pipelines, tankers, trucks, and other methods of transportation and storage of petroleum and chemicals. · General Outbound Logistics Opportunities: · Shell International Trading Company and Shell International Shipping Company Limited were joined on April 1, 1995. · Human Resources Opportunities: · Shell International Trading & Shipping Company set a new safety record with “4.52 million hours worked without a recordable injury accident.” · Procurement Neutral: · Purchase tankers, pipelines, trucks, and other equipment for transportation. 4. MARKETING & SALES The marketing of finished oil products is performed on the retail level at your local gasoline stations. Wholesale buyers include utility companies and large industries. The final forms of energy produced from refining include lubricants, greases,
  • 37. marine fuels, jet fuels, diesel oil, kerosene, asphalts, waxes, and liquefied petroleum gas. · General Marketing & Sales Opportunities: · Royal Dutch/Shell is the “largest marketer of branded gasoline”. · Branding their retail image in more than 8,000 sties in 85 countries. Threats: · Profit margins in Europe are falling.· Technology Opportunities: · In order to protect the environment, new underground instillations are being improved at retail gas stations. · Procurement Neutral: · Purchase of new retail gas stations. · Acquired 44 gas stations from Total in Germany. 5. SERVICE Since oil is indeed a commodity and most purchases are transaction-based and not relationship-based, there is minimal customer relationship compared with other products and services. However, there is after-sale customer relationship management with the larger wholesale buyers. · General Service Opportunities: · There is very little customer service involved with building relationships outside after the sale except for the Group’s larger
  • 38. wholesale clients. Secondary Activities (across the board) INFRASTRUCTURE Opportunities: · As mentioned in the Culture & Leadership section earlier, the excellent leadership by Herkstroter, CEO, is transforming the company into a more innovative company that is responsive to changes in the global market. · Globalization: “The most profitable company for the second year in a row, Royal Dutch/Shell credits a presence in 120 countries for its performance.” · Brilliant strategic thinkers and use of scenario planning. “Scenarios are plausible and challenging stories, not forecasts. They do not extrapolate from the past to predict what will happen in the future, but instead offer two very different stories of how the future might look.” · “Shell’s country managers have enormous freedom. And yet they’re bound together, and to the center, by a sort of corporate glue that ensures coherence and consistency both culturally and in terms of business processes.” – Brian March of Shell Threats: · Horrific public relations disasters over the last few years. · Decided to sink the Brent Spar, an old oil storage rig, into the Atlantic Ocean. After persistent protests by environmentalists such as Greenpeace, they decided against sinking the rig. · The Nigerian government murdered Ken Saro-Wiwa, who criticized Shell’s environmental ethics, or lack thereof, in Nigeria. HUMAN RESOURCES
  • 39. Opportunities: · Excellent compensation for workers. “To compensate expatriate staff, Royal Dutch Shell uses what it calls a ‘modified balance sheet’, basing its calculations no a north European standard of living. In effect, Shell has decided that all expatriates deserve to live like the Dutch.” Threats: · Selling off refineries in Europe with the hopes of boosting profit margins in the crowded European oil market. · As apart of their reorganization, the Group plans to cut their staff at the headquarters by 25%. TECHNOLOGY Opportunities: · “The Royal Dutch Shell Group is Europe’s 2nd-largest IS spender… This is creating focused business units within its 3 core activities of exploration, oil, and chemicals.” C. Core Competence & Competitive Advantage The Royal Dutch/Shell Group’s primary core competence lies in their globalization. The Group is diversified both geographically in 129 countries and operationally through their extensive scope of products they produce. Leading the Global Fortune 500 List in total profits in 1995, “Shell’s ‘greater spread’ and its strong base in booming East Asia, says Jennings, give it ‘a platform for growth’ a level above its rivals.” Directly related to the Group’s ability to expand into budding economies is the creative genius behind each strategic move. Their new leadership and culture that has evolved from their corporate makeover a la McKinsey and other American consulting firms is more innovative, efficient, and responsive. The Royal Dutch/Shell Group has a competitive advantage
  • 40. because they earn above-average returns compared to their closest competitors in their strategic group. The graph below depicts the three-year average of return to shareholders from 1994 through 1996. 0 2 4 6 8 10 12 14 16 18 20 Return Exxon RD/Shell BP Amoco Mobil Texaco Chevron Company Average Shareholder Return 1994-96 D. Financial Ratio Analysis All of the original values from the Group’s financial statements were in guilders for Royal Dutch and British pounds for Shell. I used the exchange rate of the day the results were completed (last day of the fiscal year) to translate them into U.S. dollars. Additionally, the combination of both publicly traded companies, Royal Dutch Petroleum and Shell Transport &
  • 41. Trading Company, were used on their stated 60-40 ratio, respectively; therefore, all figures have been accurately translated into U.S. dollars on a weighted average basis. Company Net Income Quick Ratio ROA Debt to Equity Profit Margin ROACERD/Shell 8,886 1.05 7.8% 0.97 6.9% 13.2% Exxon 7,510 0.69 8.0% 1.19 5.6% 16.0% Mobil 2,964 0.65 6.4% 1.40 3.6% 12.7% Amoco 2,834 0.98 8.8% 0.95
  • 42. 8.8% 13.8% BP 2,552 0.73 7.8% 1.54 5.7% 17.1% Chevron 2,607 0.73 7.5% 1.23 6.1% 12.7% Texaco 2,018 1.22 7.5% 1.60 4.4% 14.9% * Net Income listed in millions of U.S. dollars. The oil industry as a whole was able to capitalize on higher oil prices during 1996. Net income was chosen first because it is an appropriate indicator of how much money a firm makes and is a good basis for benchmarking the size of competitors. While Exxon was the largest international integrated oil firm in the world (based on revenues), Royal Dutch/Shell had a higher net income. The quick ratio is a more accurate measure of liquidity for an oil company rather than the current ratio because it excludes inventory. Oil firms of this size carry a large amount of non-cash short-term assets, as well as a substantial amount of oil reserves. While these reserves may be
  • 43. classified under inventory, they are not very ‘liquid’ in the sense that they cannot be quickly converted into cash. Royal Dutch/Shell has a near perfect 1.05 quick ratio. Return on assets is an excellent indicator of how much money a firm makes, given the scope of their operations. The Group’s ROA was average compared to their competitors. A significant financial element of a company in its maturity phase is how much debt it takes on. Royal Dutch/Shell’s debt-to-equity is 0.97, illustrating the Group finances its assets with almost as much debt as it does equity. As with any company, profit margin is an integral measure of not only how much money a firm makes, but how effectively a firm brings in revenue on each additional item sold. The Group’s profit margin was 6.9%, which was consistent with its peers in the oil industry. Last, but certainly not least, I chose the Return on Average Capital Employed (ROACE) to analyze the efficiency of the firm’s operations. As mentioned when analyzing the Key Success Factors of the oil industry, the ROACE is quite possibly the most effective measurement of how efficient an oil firm’s operations are. With a finite amount of resources in the world, oil companies must make the most efficient use of their crude oil. Jumping from 10.6% in 1995, Royal Dutch/Shell had an ROACE of 13.2% in 1996, which was a positive sign. However, this remains the Group’s main weakness and will be revisited in determining the appropriate strategy in order to improve this integral indicator of operational excellence. Stock Price Chart This is a chart illustrating the stock price of Royal Dutch Petroleum Company (RD) and Shell Transport & Trading Company (SC) from 1994 through 1996. The graph illustrates the positive correlation between both separately traded companies. This strong correlation is because both Royal Dutch and Shell are principally incorporated within the same parent group of companies.
  • 44. IV. Strategic Choice A. SWOT Analysis 1. General SWOT Analysis Strengths Globalization Expansion into emerging markets Largest marketer of branded gas Superb leadership Healthy liquidity Technology Largest producer of natural gas Shell Transport & Shipping Opportunities Technological Advances Emerging economies Oil remains main source of energy Formation of European Union Introduction of the “euro”Weaknesses Slow growth
  • 45. Weak efficiencies (ROACE) Holding too much cash Horrific public relations scandalsThreats Costly environmental regulations Substitute products Power of OPEC Overcapacity in mature markets European economic problems Supermarkets inc. market share Brand equity not important in Europe 2. General Strategic Orientation The oil industry is definitely being threatened by overcapacity and a struggling economy and it therefore not classified as an ‘opportunity’. Overall, the Royal Dutch/Shell Group has many strengths and is not a company struggling to keep up with the industry, but rather an excellent company struggling with the slow growth of a mature economy. Weakness TurnaroundDefensiveAggressiveDiversification Strength 3. Grand Strategy Clusters The European oil market is definitely a slow growth market. As the market leader in the European market, the Group is coming from a strengthening competitive position. Weakening
  • 46. Competitive Position Turnaround Concentrated Growth Vertical Integration Horizontal Integration DivestmentRetrenchment Merge with Competitor LiquidationConcentrated Growth Vertical Integration Related DiversificationRelated Diversification Unrelated Diversification Joint Venture & Strategic Alliance Vertical Integration Horizontal Integration Concentrated Growth Strengthening Competitive Position 4. Grand Strategy Selection Matrix Weakness CONSERVATIVE Turnaround
  • 47. Retrenchment Divestiture LiquidationOVERCOMMITTED Strategic Alliance Merge with Competitor Unrelated DiversificationSOLIDIFY POSITION Concentrated Growth InnovationEXPAND BASE OF OPERATIONS Vertical Integration Horizontal Integration Related Diversification Joint Venture Strategic AllianceStrength 5. Generic Strategy The Group has a competitive advantage because they achieve above-average returns compared to their strategic group. The scope of their target market is colossal, seeing as they serve people around the globe and do not specifically target one demographic segment. They achieve their advantage through cost leadership because their product is a commodity and cannot be differentiated. Cost LeadershipDifferentiationFocused Cost LeadershipFocused DiversificationC. Recommendations As mentioned, Royal Dutch/Shell is definitely guided by their
  • 48. strengths and not their weaknesses. The Grand Strategy Selection Matrix has a dotted-line through “Expand Base of Operations’ quadrant because for the most part, Royal Dutch/Shell is trying to defend its position as the market leader in Europe. However, it is my opinion that some times the best defense is a powerful offense. In order to remain #1 in this cutthroat competitive market, I believe Royal Dutch/Shell requires more than the traditional concentrated growth and innovation. I’d like to revisit not only the problem facing the industry but especially the Group’s main problem with their old corporate culture. Shell’s director, John Jennings, said of their old culture, “We were bureaucratic, inward looking, complacent, self-satisfied, arrogant.” Sometimes staying on top requires more action than reaction; and leaving their competitive position idle would indeed be a return to complacency. The European oil industry is more attractive for Royal Dutch/Shell than other incumbents and they should take advantage of this. With a heavy presence there now, this enables them to prepare for the future. 1. Corporate Level Strategy (Global Scale) On the global scale, they should continue to expand into emerging markets to bring what they do best to new markets. Budding economies in Asia, Latin America, Eastern Europe, and South America will be integral for their successful expansion. Making prudent strategic investment decisions is one of the Group’s core strengths. Their early expansion into new markets (i.e. Asia/Pacific) has allowed them to capture market share early on in a market’s growth. 2. Business Level Strategy (European Market) In the specific European market, Royal Dutch/Shell must first defend their position as the market leader in the European oil market. Focusing on improving operational efficiency through
  • 49. the latest innovative technology will improve their hopes for growth. However, I think the Group needs to make a move that is one step further. The Group should form a joint venture with some of the major supermarkets that have been gaining market share. If a mutual joint venture can not be reached, the Group can use its excess cash to acquire supermarket service stations if needed. As mentioned earlier, the Group’s excellent strategic management uses what is called “Global Scenarios” to determine what they think will happen next based on innovative possibilities and not just looking at the past. I am not basing my strategic recommendation on this underlying assumption; this is rather a very good possibility of what could happen. While the European economy is currently a threat to the industry, I think in the long-term, the European market will boom again once the EU becomes solid and the euro is a success. An improved economy in the long-run would put more disposable income in the hands of consumers, who would be more likely to purchase based on brand equity than just location and convenience. Royal Dutch/Shell will then be perfectly situated to capture market share based on convenience, location, and brand equity. IV. Managerial Implications A. Implementation Issues The Group should target the larger supermarkets, or hypermarkets as Europeans call them, in an effort to gain more market share. All new service stations will be branded with the Shell logo, as they continue their branding effort. All employees will remain at the original service stations but will undergo Royal Dutch/Shell’s training program in order to achieve congruence throughout corporate culture. Through both expansion into emerging markets on the global scale, and continuous improvement in the European market,
  • 50. Royal Dutch/Shell will be able to improve their profitability and operational efficiency in this slow growth market. The Group’s improved leadership has opened their eyes to the ever-changing global marketplace that is revolutionizing all aspects of business. Remaining responsive to these changes and employing the latest technologies will be extremely important for the Group to remain a leader in the industry. Reference Section Aquino, N., Oct. 1996. “Alternative Energy”, Europe: Issue(360):pg.44. August 1, 1994, “Warning Sounded on European Emissions Cutback”, Oil & Gas Journal: Vol.92. Ball, J, 1996. “The European Union: The Road To Nowhere”, European Business Journal: Vol(8):pg.8. Bassman, R., Nov. 1994. “Oil: Europe’s Power Industry”, Europe: Vol(341):pg.14. Beck, R., Jan. 31, 1994. “Worldwide Outlook Clouded By Market Slump of Late 1993”, The Oil and Gas Journal: Vol(92):pg.72. Begg, I, 1996. “Wrong Questions, Wrong Answers: The EU Economic Policy Debate Since ‘Maastricht’”, European Business Journal: Vol(8)pg.37-44. Clark, K., Aug. 5, 1996, “A Bigger, Richer World”, Fortune: Vol(134): pg. 102. Cool, K, Gee, F, Montgomery, I, Reuer, J, 1999. “BP-MOBIL and the Restructuring of the Oil Refining Industry”, in Hitt, M, Hoskisson, R, Ireland, R (ED’s) STRATEGIC MANAGEMENT:
  • 51. COMPETITIVENESS AND GLOBALIZATION Edition 4, Cincinnati: South-Western College Publishing, pg.C-174. Deacon, R., March 28, 1996. Oil & Gas, in Nugent, T. (ED) STANDARD & POOR’S INDUSTRY SURVEYS, New York: McGraw Hill Dec. 11, 1996, “Shell to Revamp European Refineries”, New York Times: pg.4. Dispenza, D., March 13, 1995. “Europe’s Need For Gas Imports Destined To Grow”, Oil & Gas Journal: Vol(93):pg.45. Eade, P., Nov. 1996. “The Shape of Things to Come”, Euromoney: Issue 331, pg.69-74 “EUROSTAT Yearbook 2001: The Statistical Guide to Europe, Data 1989-1999” published by Eurostat. http://www.europa.eu.int/comm/eurostat Feb. 1997. “Economic Outlook: Europe”, Economic Outlook: Vol(21):pg.36. Fitzgerald, N., January 1997. “Tomorrow’s Europe”, European Business Journal. “Global Scenarios 1995-200”, published by Royal Dutch/Shell in 1995. Graves, E., July 21, 1994. “Oil”, in Nugent, T. (ED) STANDARD & POOR”S INDUSTRY SURVEYS, New York: McGraw Hill, pg. O27-O28. http://www.BigCharts.com Hunter, D., Sep. 18, 1996, “Shell Chemical Thinks Growth”, Chemical Week: Vol(158): pg.34.
  • 52. Jansenn, R., March, 1997. “The Hague: A New Breed of Entrepreneur”, Europe: Issue(364):pg.38. July 15, 1995. “Over-refined Europeans: Oil Industry”, The Economist: Vol(336):pg 47 June 24, 1995. “Shell On The Rocks”, The Economist: Vol(335):pg.57. Knapp, B., March 1995. “A Historical View of Recycling”, World Wastes: Vol(38). Knott, D., March 25, 1996. “Shakeout Gathers Momentum in Europe’s Refining Sector”, Oil & Gas Journal: Vol. 94. Knott, D., May 27, 1996. “Shell’s Microscope Focused On Refining”, Oil & Gas Journal: Vol(94):pg.30. Layman, P., July 29, 1996. “Shell Reorganized To Better Focus Its Portfolio On Global Markets”, Chemical & Engineering News: Vol(74):pg.25. March 23, 1995. “More Gusto For Wind Power”, Machine Design: v(67): pg.18. Monthly net earnings of a couple, 1996. Eurostat Yearbook 2002: pg.16. http://www.europa.eu.int/comm/eurostat Murphy, C., March 7, 1996. “Why Sites Are Key to Fuel Fight”. Marketing: pgs.16-17. Nov. 1996. “Economic Outlook: Europe”, Economic Outlook: Vol.(21): pg.34. Nov. 9, 1996. “Smaller Cars, Bigger Profits?”, The Economist: Vol(341).
  • 53. Oct. 16, 1995, “Exxon-Shell Team to Develop North Europe Gas Storage”, Oil & Gas Journal: Vol(93): pg.38. Oct. 22, 1997, “At Shell, Everyone is Dutch”, Business Europe: Vol(37):pg.9. Parkinson, G., March 1996. “Gasification: New Life for an Old Technology”, Chemical Engineering: Vol(103):pg.37. Rhodes, A. Oct. 30, 1995. “Improved Catalysts, Process Reliability are Key Refining Trends”, Oil & Gas Journal. Royal Dutch Petroleum Company, Annual Report to Shareholders 1995. Royal Dutch Petroleum Company, Annual Report to Shareholders 1996. Sept. 29, 1995, “Conference Report: World Oil Conference”, European Energy Report. Shell Transport and Trading Company, p.l.c., Annual Report to Shareholders 1995. Shell Transport and Trading Company, p.l.c., Annual Report to Shareholders 1996. Simpson, D., Mar/Apr 1995, “Planning In A Global Business”, Planning Review: Vol(23): pg.25. Sweet, P., April 1996. “Solar Systems”, Accountancy: Vol(117):pgs.51-54. Taste, P., Dec. 11, 1995, “On The Cutting Edge: Shell”, InformationWeek: Issue(557): pg.45.
  • 54. Thomas Murray Regional National Global Global, Parker, Rowan, Sedcos Baker Hughes, Schlumberger, McDermott Mesa, Anadarko, Oryx, Louisiana Mobil, BP, Exxon, Royal Dutch/Shell, Amoco, Texaco, Chevron Hess, Occidental, Pennzoil, Unocal, Sun Co Specialized Slightly Integrated Fully Integrated
  • 55. � EMBED OrgPlusWOPX.4 ��� Opportunity Threat Rapid Growth Slow Growth Internal Development External Development
  • 56. BROAD UNIQUENESS COST NARROW � Royal Dutch Petroleum Company, Annual Report 1996 � Cool, K, Gee, F, Montgomery, I, Reuer, J, 1999. BP-MOBIL and the Restructuring of the Oil Refining Industry, in Hitt, M, Hoskisson, R, Ireland, R (ED’s) STRATEGIC MANAGEMENT: COMPETITIVENESS AND GLOBALIZATION Edition 4, Cincinnati: South-Western College Publishing, pg.C-106. � Royal Dutch Petroleum Company, Annual Report 1996 � Ibid. � Ibid.
  • 57. � Ball, J, 1996. “The European Union: The Road To Nowhere”, European Business Journal: Vol(8):pg.8. � Nov. 1996. “Economic Outlook: Europe”, Economic Outlook: Vol.(21): pg.34. � “EUROSTAT Yearbook 2001: The Statistical Guide to Europe, Data 1989-1999” published by Eurostat. http://www.europa.eu.int/comm/eurostat � Begg, I, 1996. “Wrong Questions, Wrong Answers: The EU Economic Policy Debate Since ‘Maastricht’”, European Business Journal: Vol(8)pg.37-44. � “EUROSTAT Yearbook 2001: The Statistical Guide to Europe, Data 1989-1999” published by Eurostat. http://www.europa.eu.int/comm/eurostat � Ibid. � “EUROSTAT Yearbook 2001: The Statistical Guide to Europe, Data 1989-1999” published by Eurostat. http://www.europa.eu.int/comm/eurostat � Ibid. � Feb. 1997. “Economic Outlook: Europe”, Economic Outlook: Vol(21):pg.36.
  • 58. � Total Population, 1996. Eurostat Yearbook 2001: pg.3 http://www.europa.eu.int/comm/eurostat � Persons in employment: men and women, 1996. Eurostat Yearbook 2001: pg.12. http://www.europa.eu.int/comm/eurostat � Murphy, C., March 7, 1996. “Why Sites Are Key to Fuel Fight”. Marketing: pgs.16-17. � Total area and population density, 1996. Eurostat Yearbook 2001: pg.19. http://www.europa.eu.int/comm/eurostat � Ibid. � Monthly net earnings of a couple, 1996. Eurostat Yearbook 2002: pg.16. http://www.europa.eu.int/comm/eurostat � Population growth rate. Population & Social Conditions: http://www.europa.eu.int/comm/eurostat � Nov. 9, 1996. “Smaller Cars, Bigger Profits?”, The Economist: Vol(341). � Knapp, B., March 1995. “A Historical View of Recycling”, World Wastes: Vol(38).
  • 59. � Rhodes, A. Oct. 30, 1995. “Improved Catalysts, Process Reliability are Key Refining Trends”, Oil & Gas Journal. � Graves, E., July 21, 1994. “Oil”, in Nugent, T. (ED) STANDARD & POOR’S INDUSTRY SURVEYS, New York: McGraw Hill, p.O32-O36. � Cool, K., J. Reur, I. Montgomery & F. Gee. “BP-Mobil and the Restructuring of the Oil Refining Industry” in Hitt, M., R. Ireland & R. Hoskisson, 2001. Strategic Management: Competitiveness & Globalization Cases. South-Western College Publishing: United States. � Bassman, R. Nov 1994. “Oil: Europe’s Power Industry”. Europe v(341): pg.14. and March 23, 1995. “More Gusto For Wind Power”, Machine Design: v(67): pg.18. � Eade, P., Nov. 1996. “The Shape of Things to Come”, Euromoney: Issue 331, pg.69-74 � Fitzgerald, N., January 1997. “Tomorrow’s Europe”, European Business Journal. � Ibid.
  • 60. � Sept. 29, 1995, “Conference Report: World Oil Conference”, European Energy Report. � Graves, E., July 21, 1994. “Oil”, in Nugent, T. (ED) STANDARD & POOR”S INDUSTRY SURVEYS, New York: McGraw Hill, pg. O27-O28. � Graves, E., July 21, 1994. “Oil”, in Nugent, T. (ED) STANDARD & POOR”S INDUSTRY SURVEYS, New York: McGraw Hill, pg. O27-O28. � Knapp, B., March 1995. “A Historical View of Recycling”, World Wastes: Vol(38). � Knott, D., March 25, 1996. “Shakeout Gathers Momentum in Europe’s Refining Sector”, Oil & Gas Journal: Vol. 94. � August 1, 1994, “Warning Sounded on European Emissions Cutback”, Oil & Gas Journal: Vol.92. � Knott, D., March 25, 1996. “Shakeout Gathers Momentum in Europe’s Refining Sector”, Oil & Gas Journal: Vol. 94. � Graves, E., July 21, 1994. Oil, in Nugent, T. (ED) STANDARD & POOR’S INDUSTRY SURVEYS, New York: McGraw Hill, pg.O17.
  • 61. � Deacon, R., March 28, 1996. Oil & Gas, in Nugent, T. (ED) STANDARD & POOR’S INDUSTRY SURVEYS, New York: McGraw Hill, pg.O21. � Deacon, R., June 29, 1995. Oil in Nugent, T. (ED) STANDARD & POOR’S INDUSTRY SURVEYS, New York: McGraw Hill, pg.O4. � Cool, K, Gee, F, Montgomery, I, Reuer, J, 1999. BP-MOBIL and the Restructuring of the Oil Refining Industry, in Hitt, M, Hoskisson, R, Ireland, R (ED’s) STRATEGIC MANAGEMENT: COMPETITIVENESS AND GLOBALIZATION Edition 4, Cincinnati: South-Western College Publishing, pg.C-106. � Cool, K, Gee, F, Montgomery, I, Reuer, J, 1999. BP-MOBIL and the Restructuring of the Oil Refining Industry, in Hitt, M, Hoskisson, R, Ireland, R (ED’s) STRATEGIC MANAGEMENT: COMPETITIVENESS AND GLOBALIZATION Edition 4, Cincinnati: South-Western College Publishing, pg.C-106. � Deacon, R., March 28, 1996. Oil & Gas, in Nugent, T. (ED) STANDARD & POOR’S INDUSTRY SURVEYS, New York: McGraw Hill, pg.O20, O29. � Deacon, R., March 28, 1996. Oil & Gas, in Nugent, T. (ED) STANDARD & POOR’S INDUSTRY SURVEYS, New York: McGraw Hill, pg.O20, O29. � Beck, R., Jan. 31, 1994. “Worldwide Outlook Clouded By Market Slump of Late 1993”, The Oil and Gas Journal:
  • 62. Vol(92):pg.72. � Graves, E., July 21, 1994. Oil, in Nugent, T. (ED) STANDARD & POOR’S INDUSTRY SURVEYS, New York: McGraw Hill, pg.O25. Deacon, R., March 28, 1996. Oil & Gas, in Nugent, T. (ED) STANDARD & POOR’S INDUSTRY SURVEYS, New York: McGraw Hill, pg.O25. � Dispenza, D., March 13, 1995. “Europe’s Need For Gas Imports Destined To Grow”, Oil & Gas Journal: Vol(93):pg.45. � Deacon, R., March 28, 1996. Oil & Gas, in Nugent, T. (ED) STANDARD & POOR’S INDUSTRY SURVEYS, New York: McGraw Hill, pg.O28. � Parkinson, G., March 1996. “Gasification: New Life for an Old Technology”, Chemical Engineering: Vol(103):pg.37. � Aquino, N., Oct. 1996. “Alternative Energy”, Europe: Issue(360):pg.44. � Sweet, P., April 1996. “Solar Systems”, Accountancy: Vol(117):pgs.51-54. � Bassman, R., Nov. 1994. “Oil: Europe’s Power Industry”, Europe: Vol(341):pg.14. � Cool, K, Gee, F, Montgomery, I, Reuer, J, 1999. BP-MOBIL
  • 63. and the Restructuring of the Oil Refining Industry, in Hitt, M, Hoskisson, R, Ireland, R (ED’s) STRATEGIC MANAGEMENT: COMPETITIVENESS AND GLOBALIZATION Edition 4, Cincinnati: South-Western College Publishing, pg.C-174. � July 15, 1995. “Over-refined Europeans: Oil Industry”, The Economist: Vol(336):pg 47 � Ibid � Ibid � Guyton, J., Aug. 4, 1997. “Why Is The World’s Most Profitable Company Turning Itself Inside Out?” Fortune: Vol(136):pg.120-125. � Royal Dutch Petroleum Company, Annual Report to Shareholders 1996. � Ibid. � Ibid. � Royal Dutch Petroleum Company, Annual Report to Shareholders 1996. � Ibid.
  • 64. � Ibid. � Royal Dutch Petroleum Company, Annual Report to Shareholders 1996. � Ibid. � Shell Transport and Trading Company, p.l.c., Annual Report to Shareholders 1996. � Ibid. � Ibid. � Ibid. � Ibid. � Shell Transport and Trading Company, p.l.c., Annual Report to Shareholders 1996. � Ibid. � Ibid.
  • 65. � Guyton, J., Aug. 4, 1997. “Why Is The World’s Most Profitable Company Turning Itself Inside Out?” Fortune: Vol(136):pg.120-125. � Jansenn, R., March, 1997. “The Hague: A New Breed of Entrepreneur”, Europe: Issue(364):pg.38. � Ibid. � Guyton, J., Aug. 4, 1997. “Why Is The World’s Most Profitable Company Turning Itself Inside Out?” Fortune: Vol(136):pg.120-125. � Ibid. � Ibid. � Ibid. � Royal Dutch Petroleum Company Annual Report to Shareholders 1996. � Layman, P., July 29, 1996. “Shell Reorganized To Better Focus Its Portfolio On Global Markets”, Chemical & Engineering News: Vol(74):pg.25.
  • 66. � Royal Dutch Petroleum Company, Annual Report to Shareholders 1996 � Ibid. � Ibid. � June 24, 1995. “Shell On The Rocks”, The Economist: Vol(335):pg.57. � Knott, D., May 27, 1996. “Shell’s Microscope Focused On Refining”, Oil & Gas Journal: Vol(94):pg.30. � Royal Dutch Petroleum Company, Annual Report to Shareholders 1995. � Royal Dutch Petroleum Company, Annual Report to Shareholders 1995. � Royal Dutch Petroleum Company, Annual Report to Shareholders 1996. � Oct. 16, 1995, “Exxon-Shell Team to Develop North Europe Gas Storage”, Oil & Gas Journal: Vol(93): pg.38. � Royal Dutch Petroleum Company, Annual Report to
  • 67. Shareholders 1996. � Hunter, D., Sep. 18, 1996, “Shell Chemical Thinks Growth”, Chemical Week: Vol(158): pg.34. � Royal Dutch Petroleum Company, Annual Report to Shareholders 1995. � Royal Dutch Petroleum Company, Annual Report to Shareholders 1995. � Ibid. � Ibid. � Ibid. � Royal Dutch Petroleum Company, Annual Report to Shareholders 1996. � Ibid. � Clark, K., Aug. 5, 1996, “A Bigger, Richer World”, Fortune: Vol(134): pg.102. � “Global Scenarios 1995-200”, published by Royal
  • 68. Dutch/Shell in 1995. � Simpson, D., Mar/Apr 1995, “Planning In A Global Business”, Planning Review: Vol(23): pg.25. � Jun 24, 1995, “Shell On The Rocks”, The Economist: Vol(335): pg.57. � Guyton, J., Aug. 4, 1997. “Why Is The World’s Most Profitable Company Turning Itself Inside Out?” Fortune: Vol(136):pg.120-125. � Oct. 22, 1997, “At Shell, Everyone is Dutch”, Business Europe: Vol(37):pg.9. � Dec. 11, 1996, “Shell to Revamp European Refineries”, New York Times: pg.4. � Taste, P., Dec. 11, 1995, “On The Cutting Edge: Shell”, InformationWeek: Issue(557): pg.45. � Clark, K., Aug. 5, 1996, “A Bigger, Richer World”, Fortune: Vol(134): pg. 102. � http://www.BigCharts.com � Guyon, J., Aug. 4, 1997, “Why Is The World’s Most
  • 69. Profitable Company Turning Itself Inside Out?”, Fortune: Vol(136): pg.120-125. _1079733329.bin _1080311692.xls Chart2ExxonRD/ShellBPAmocoMobilTexacoChevron Company Return Average Shareholder Return 1994-96 18.9 17.9 15.2 14.5 13.3 12.6 11.9 Sheet1CompanyAverageExxon18.9RD/Shell17.9BP15.2Amoco1 4.5Mobil13.3Texaco12.6Chevron11.9 Sheet1 Company Return Average Shareholder Return 1994-96 Sheet2 Sheet3 _1079732871.xls Chart119921992199319931994199419951995E1996E1996 OECD Non-OECD YEAR DEMAND (billions of barrels per day) WORLD OIL DEMAND 38.9 28.2 39.1
  • 70. 28 40 28.7 40.4 29.6 41 30.6 Sheet1YEAROECDnon- OECDWORLD199238.928.267.1199339.12867.219944028.768. 6199540.429.670E19964130.671.6 Sheet10000000000 h OECD Non-OECD YEAR DEMAND (billions of barrels per day) WORLD OIL DEMAND Sheet2 Sheet3 Due 4/17/2020 Directions for the Individual Internal Analysis Your boss has given you the assignment to understand a company. You should choose a company that is not being done by anyone else in your group. You need to do the following: a. Identify the company’s business model ( how they make money). Give a short history and overview of the firm’s products. b. You need to do an internal analysis of the firm. Identify their resources and capabilities, and describe their leadership, culture, organization structure, and core competencies. c. Analyze their current position in the market (market share) and determine what they have in their “luggage or not.” Discuss the major issues facing the company internally. Use the models
  • 71. of Value Chain, Business Model Canvas, VIRO and RBV perspective. d. Tie the company’s performance using financial and other measures that to the abilities of the firm. You will need to utilize your financial analysis for some of the data necessary to understand how well the firm is doing. Exhibits that should be attached to the report Value Chain, and VRIO for the firm. It is the quality of data and interpretation which matters. Exhibits should be referred to and discussed in the report. Do not just repeat data, instead analyze and tell your boss what the data means. Use headings to help organize your report. Please make sure you use terms developed in class and from the book. You need to cite your sources of data. Use end notes to cite your sources. Be consistent in your format. You may also include a reference page. The Maximum length is 8 pages with and additional 5 pages of exhibits. What you turn in for this assignment you should be proud to give to any boss. The report is for a business audience and needs to fit a more business style of writing. Use the following web site for help if you are unsure about business writing style. Use headings to organize your work. http://oregonstate.edu/dept/eli/buswrite/Business_Writing_Help. html Exhibits, preliminaries, bibliography, footnotes and endnotes, and appendices are not included in the suggested page count. Note that in several instances the Professor/Boss expects the use of exhibits, e.g., financial statements. There are multiple points at which “a graph will speak volumes.” Or a summary exhibit will efficiently summarize a discussion. The page count assumes 12-Point Times Roman font or equivalent, with one- inch margins. Double spacing is easier for the professor to read and make comments. However, generally a professional report will be single (or perhaps one and a half) spacing. A google.com search is certainly a beginning, but is NOT sufficient. You must use sources such as Hoovers, Standard and
  • 72. Poor’s Net Advantage, Business Insight, Morningstar, ABI/INFORM, Books in Print (any books on the company, its competitors or industry?), Business Source Premier, EDGAR, Wall Street Journal, Business Week, Forbes, Fortune, LexisNexis, Marquis Who's Who, New York Times Article, Mergent, IBISWorld, and Wilson Business Full Text. There are also hard copy references and specialty data bases at the library as well as other sources at local libraries. Please make Limestone’s Business Reference Librarian one of your best friends. Use either MLA or APA format for your Bibliography and make sure you include title, publication, and date. Certainly the firm is more complex than we can do justice to given our time frame and limitations on our data/information sources. As indicated in the introduction, the purpose of the overall project is to pull on as much of the perspectives as we have learned throughout our formal business training as possible in order to develop a robust understanding of a firm and its environment. As the strategic consultant you are working at very high levels in the firm to help the organization consider its current situation and what it can and should do to be better at achieving its vision/mission/ goals/objectives, an improved strategy, and a sustainable competitive advantage. In actuality such a task would draw on both primary and secondary data and might take a consultant 18 months. Suggested Outline of Report Content (Suggested pages of text, about 10-15) Introduction · Purpose of analysis · Overview/outline of written report · Description of the company I. Company/Organization/Internal Environment ( 6-8 pages) **** Major thrust of the paper should be this section)************
  • 73. · Brief history (suggest including a Time Line as an exhibit) · Vision/mission statements/strategic objectives · Describe products/services/technologies · Organization: · Culture (1/2-1) Leadership (1-2) remember to include analysis of the board. · Value Chain Analysis - · Operations, Marketing, Supply Chain, Distribution · Core competencies and Comparison · · Exhibits · References Individual Internal Analysis Report Name:___________________________________ Firm: __________________ Strategic Analysis (90%) Category (Weight) 1 2 3 4 Score Overview of the firm history and product, current competitive position. (10%) Did not provide an overview of the Firm and Historical
  • 74. Perspective and current situation. Provided limited provide an overview of the firm and Historical Perspective and current situation. Some details and appropriate facts gave a good general overview of the firm and Historical Perspective and current situation. Included good details and appropriate facts for an overview of the firm, Historical Perspective and current situation. Internal Environment – Mission, Vision, Leadership Culture, (25%) Analysis did not identify many of the components of an internal analysis or major trends in the company’s abilities and behavior. Limited application of concepts. Analysis identified and evaluated some components of the internal analysis, but mainly reported information rather than analysis of the trends and issues in the industry. It is unclear if they understood the company’s leadership, culture or organization structure Data was superficial and they lacked quality and breadth. Analysis identified and evaluated most of the major trends and issues utilizing a majority of the internal models. Ability to integrate and synthesize the breadth of data. Analysis began to show depth and quality. Analysis indicates a comprehensive understanding of the internal operations and the the ability to utilize the models to build a good thesis of the internal abilities of the firm. They understood the company’s leadership, culture or organization structure It is clear that they understand and could apply the concepts and model.
  • 75. Internal Environment Value Chain and VIRO (30%) Analysis did not correctly identify the firms abilities or use the models. Analysis superficially identified and evaluated some of components involved in the Value chain. Analysis correctly identified and evaluated most of firm’s value chian, but limited understanding of the weaknesses of the firm. Analysis indicates a thorough understanding of the firm’s abilities both strengths and weaknesses .Accurately demonstrated an understanding of how the models. Quality of Data and Analysis 25% Report provided little specific industry and firm data. Few observations. Narrow scope. The analysis did not provide a strengths and weakness Limited data sources used and logic is not complete. Lack of understanding of the material. Many logic errors that made following the logic of the write-up difficult. Some data, but very superficial. Few observations and little if any interpretation. Identified few abilities and opportunities and threats. The logic was incomplete and had some major holes. Limited understanding of the models. Some logic errors and resulting argument was weak. Few sources.
  • 76. Some non-obvious observations, sometimes interpreted well. Good Data and observations, but needs more analysis. Identified some elements The analysis provided adequate rationale for the these. Few logic holes with the beginnings of comprehensive understanding of the firm. Strong argument. Good data. Excellent data and well researched, Many issues observed in depth. Reasonable interpretations of observations. Identified a number of abilities and external factors.. The analysis used well-reasoned supporting arguments. Strong understanding of the concepts and the organization. Virtually no logic errors and resulting excellent arguments. Wide variety of sources Sub-total for Analysis Writing (10%) Category (Weight) 1 2 3 4 Score Grammar/spel-ling 5 % Many errors that interfered with understanding the write-up. Many errors, but the write-up was generally understandable. Some errors, but the write-up was very understandable.
  • 77. Very few errors and very understandable. Use of exhibits and bibliography, presentation 5% No exhibits included. Disorganized and not clearly labeled sections Few exhibits included, but only general reference made to the exhibits. Some organization (headings, labels, table of contents, framing paragraphs) Appropriate exhibits included each of which was referred at an appropriate point in the write-up. Good organization (headings, labels, table of contents, framing and summary paragraphs ) Included exhibits that were very well designed and each was skillfully used in reinforcing the arguments in the write-up. Good organization (headings, labels, table of contents, framing and summary paragraphs ) Sub-total for Writing Total PAGE
  • 78. 3 MEMO TO: BA 452 Students RE: Directions for Individual Financial Analysis Report You need to place yourself in the role of a financial analyst who has been hired to help your firm identify its financial weaknesses and strengths. The point of a financial analysis is to discuss the financial health and how the firm using its money. Examine if the firm is operating efficiently in comparison to the industry. Find out if the firm has the flexibility to invest in itself. Note what has been changing for the firm. You need to compare the company to its competitors. Indicate whether the firm has a competitive advantage. Make use your knowledge from your previous accounting and finance courses. The deliverable is no more than 5 pages of text plus additional pages for bibliography and exhibits. You must utilize and refer to your exhibits in the report. Remember that your audience is the top executives of the company. The data (numbers and charts) go into tables and figures, write your analysis referring to the data. It is the interpretation which matters. You need to cite your sources of financial data. The report is for a business audience and needs to fit a more business style of writing. Use the following web site for help if you are unsure about business writing style. http://owl.english.purdue.edu/owl/resource/590/1/ . (Hint start by looking at the firms’ 10Ks particularly the description and managerial discussion of financials will help you understand how the firm operates. SHARE your financials with your team members to help with comparisons) The outline of the financial analysis: 1. Title 2. Introduce the company and frame your report (make sure you state the purpose of the report)
  • 79. 3. Discuss the Income statement and balance sheet ( must include 5 years as exhibits) a. Discuss the trends for the company b. Do these trends echo the industry? If not discuss reasons why. Do the numbers differ from the competitors and why. c. Is there anything to be concerned about? 4. Discuss the Common sized income statement (3-5 years must include as an exhibit) a. Discuss the trends b. Identify any changes c. Discuss if their common sized numbers differ from their competitors and why? d. Is there anything to be concerned about? 5. Do the Ratio Analysis (profitability, liquidity, operating/asset management, debt, industry specific) for the last 3 years. I want numbers. a. Compare to industry averages for the last 3 years (identify who is in your average and must include ratios as an exhibit). b. Identify the best and worst performing firm in the industry. Explain why. 6. What has earnings been and how has this effected share price. What do analysts say about the firm meeting its target earnings. What about other firms in the industry? 7. Identify business units and product categories contribution to revenues and growth or decrease of contribution. 8. Has the firm announced any moves which will change their cash/debt position. (e.g. acquisitions, licensing deals,
  • 80. divestitures). 9. Summarize the strengths and weakness based on the analysis. 10. At the end attach Bibliography and Exhibits. Cite the sources for your numbers. Remember – Headings, summaries, roadmaps, page numbers. Spelling and grammar count! Financial Analysis Rubric Name:___________________________________ Company: __________________ Strategic Analysis (75%) Category (Weight) 1 2 3 4 Score Income Statement Analysis and Quarter Performance (15%) Analysis did not identify and evaluate major trends or changes in the income statement or quarters. Analysis identified and some of the major trends in the income statement. Analysis identified and evaluated most of the major trends in the Income Statement and Quarters. Another Firm was used for comparison. Analysis thoroughly identified major trends and evaluated reasons for changes or the lack of changes. Industry was used as a comparison. Demonstrated that they understood why changes occurred.
  • 81. Balance Sheet Analysis (15%) Analysis did not identify and evaluate major trends or changes in the Balance Sheet. Analysis identified and some of the major trends in the Balance Sheet. Analysis identified and evaluated most of the major trends in the Balance Sheet. Another Firm was used for comparison. Analysis thoroughly identified major trends and evaluated reasons for changes or the lack of changes. Industry was used as a comparison. Demonstrated that they understood why changes occurred. Ratio Analysis & Industry Comparison (20%) Analysis did not fully identify and evaluate the firm’s ratios. Analysis identified and some of the major trends in the Ratios. Analysis identified and evaluated most of the major trends in the Ratios. Another Firm was used for comparison. Analysis thoroughly identified major trends and evaluated reasons for changes or the lack of changes. Industry was used as a comparison. Demonstrated that they understood why changes occurred and what the numbers meant to the firm. Share Price and Business Unit Analysis (10%) Analysis identified the share price, but did not account for Business unit analysis. Analysis identified trend in share price. Analysis considered multiple indicators for share price movement or lack. Discussion of analysts opinion was
  • 82. included. Analysis clearly identified what was happening in the share prices and what was happening in the strategic business units. Strategic Discussion of Financial Data (15%) The analysis did not provide a strengths and weakness or opinion and/or recommendation. The analysis provided a weak discussion of strengths and weakness, opinion and/or recommendation. The analysis provided an adequate rationale for the findings from the financial analysis. The analysis provided well-reasoned supporting arguments in the discussion of strengths and weakness, opinion, and/or recommendation. Sub-total for Analysis Writing and Logic (25%) Category (Weight) 1 2 3 4 Score Grammar/spel-ling/writing style (5%) Many errors that interfered with understanding the write-up. Writing flow was incomprehensible. Many errors, but the write-up was generally understandable. Writing flow was difficult. Some errors, but the write-up was very understandable. Very few errors and very understandable. Logic (10%)
  • 83. Many logic errors that made following the logic of the write-up difficult. Poor understanding of the Financial Analysis. Many errors, but the general argument and finding were understandable. Students just reported numbers. Some logic errors, but there was little difficulty understanding the arguments and findings. Students interpreted numbers. Virtually no logic errors and resulting argument and findings were very strong. Students used numbers to make arguments and indicate findings. Use of exhibits (10 %) Not all exhibits included. Appropriate exhibits included, but only general reference made to the exhibits. Appropriate exhibits included each of which was referred at an appropriate point in the write-up. Included exhibits that were very well designed and each was skillfully used in reinforcing the arguments in the write-up Sub-total for Writing Total PAGE 3