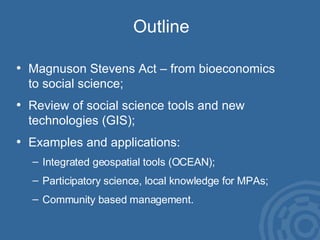
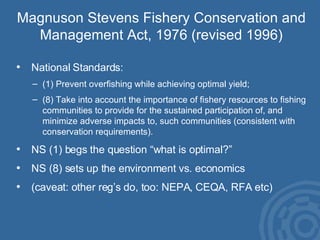
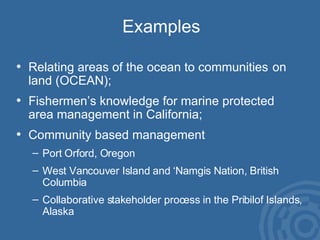
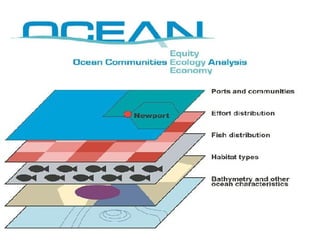
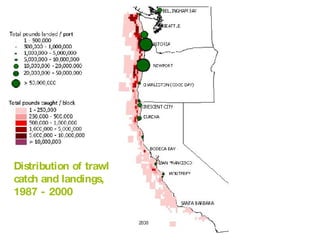
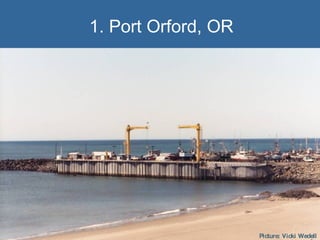
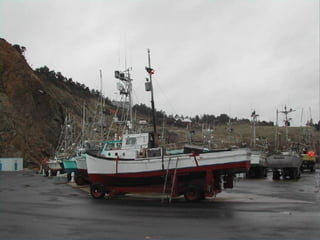
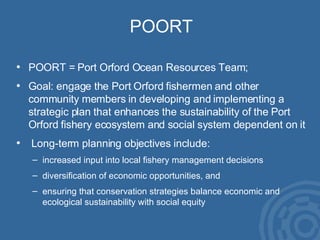
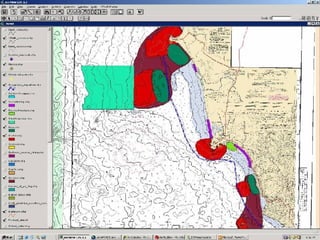
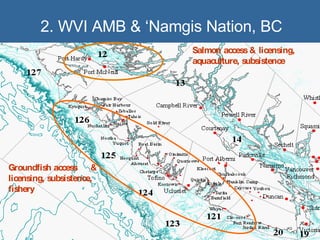
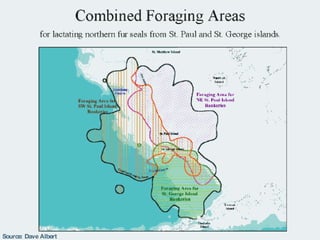
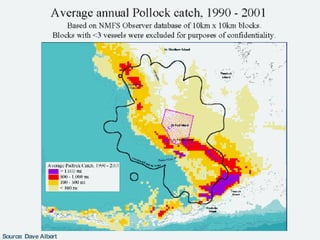
Socioeconomic considerations in marine resource management  Or, how to deal with people, places and communities  FISH 693 Management of Renewable Marine Resources  19 March 2004 Astrid Scholz
Introduction Ecotrust is a non-profit think tank and community development organization; Working to build Salmon Nation—where economy, ecology, and equity are in balance;  Sector programs in Fisheries, Food & Farm, First Nations, Forestry; In-house GIS department and research; Collaborate with federal and state agencies, universities, industry, tribes & NGOs For more info, see  www.ecotrust.org
Outline Magnuson Stevens Act – from bioeconomics  to social science; Review of social science tools and new  technologies (GIS);  Examples and applications: Integrated geospatial tools (OCEAN); Participatory science, local knowledge for MPAs; Community based management.
Magnuson Stevens Fishery Conservation and Management Act, 1976 (revised 1996) National Standards: (1) Prevent overfishing while achieving optimal yield; (8) Take into account the importance of fishery resources to fishing communities to provide for the sustained participation of, and minimize adverse impacts to, such communities (consistent with conservation requirements). NS (1) begs the question “what is optimal?” NS (8) sets up the environment vs. economics (caveat: other reg’s do, too: NEPA, CEQA, RFA etc)
Bioeconomics
Logistic population growth Pop. growth (G) time Biomass ( x ) x “ Carrying Capacity” x MSY Stock that gives “maximum sustainable yield”
Harvest Harvest depends on effort, stock size, and technology; for any given effort, sustainable harvest level is H=G,  i.e. “skimming the cream off the top”; yield curve gives the sustainable harvest level as a  function of effort level. x kE H x kE L x H H = k*E*x k = technology “catchability” E = effort (e.g. fishing days) x = biomass or stock Harvest for low effort Harvest for high effort G,
Fishery Economics Harvest, or yield, has a per-unit-effort cost (w), and total cost, TC = w*E; Revenues from harvesting, TR = p*H(E), where  p=price; From Microeconomics, revenues are maximized where marginal costs = marginal revenues, MC=MR;  This is the economically optimal level of fishing; Under open access regime, those profits, or rents, attract new entrants to fishery until TR = TC (“open access equilibrium”).
Fishery Economics – cont’d So, does limiting entry result in economic  optimum?  Typically, fisheries are not managed for  economic optimum, but rather for MSY; MSY differs for different species;  most FMPs set TAC’s reflecting fishing mortalities (F) that preserve between 35–45% of virgin biomass, and  at levels lower than MSY; Recruitment overfishing (i.e., harvest  outpaces population growth) is thought to occur at ~F10%.
Fishery bioeconomics:  the Gordon-Schaefer model Source: adapted from Dick Allen Open Access equilibrium Source: adapted from Dick Allen (TC) F40%
So much for the economics… on to the “social” in socioeconomics
The “social” in socioeconomics People and communities depend on fishing for subsistence and livelihood Every management decision about fishing mortalities, catch (TAC’s, quotas), and effort controls (time and place of fishing, capacity) affects somebody’s stomach or pocket book Given the conservation mandate of the MSFCMA, potential for conflict abounds! Factoring people, places and communities into  decisions critical to the success of management First, some definitions
Socioeconomic analysis… … is the systematic study of people’s values, attitudes and experiences, and how they will be affected by management decisions; … uses economic, sociological, and other  social science tools to derive statements about the size and nature of relative changes and their effects on communities; … does not provide any guidance as to which decisions are the right ones.
Socioeconomic analysis… … helps identify likely obstacles to the  successful implementation of management  measures; … relies on the study of people: it tends to be more process-oriented and requires field work, whereas natural science relies on  experiments and laboratory work; … is contentious: it goes to the heart of what makes people tick and what they care about.
Tools Local knowledge interviews Participant observation Ethnographic interviews Surveys Focus groups Participatory and collaborative science, “joint fact finding” for management processes Shared information and data resources (GIS)
Examples Relating areas of the ocean to communities  on land (OCEAN);  Fishermen’s knowledge for marine protected  area management in California;  Community based management  Port Orford, Oregon West Vancouver Island and ‘Namgis Nation, British Columbia Collaborative stakeholder process in the Pribilof Islands, Alaska
 
Distribution of trawl catch and landings, 1987 - 2000
Fishermen’s knowledge for MPA planning in California Collaborative pilot project (summer 2002) to elicit  ecological and economic information from fishermen for MLPA process; Motivated by lessons from CINMS: Socioeconomic analysis: “too little, too late”; Process matters; “I felt like the socioeconomic panel took fishermen’s knowledge seriously”. 1st round of MLPA had already tripped up over  process…
Local knowledge — methods Participatory, field-based  research; Designed questions and  protocol with fishermen  advisors (gatekeepers); Semi-structured interviews in six ports, 28 fishermen; Focus:  historically productive areas; “ bread and butter” areas; Highly biodiverse areas; Important anchorages; (closure candidates) Nicole and Kate in action!
 
 
Results 41.7% overlap between critical economic areas and initial set of DFG MPA sites; 26.9% overlap between acceptable closure candidates and initial DFG sites; Sometimes they overlap with each other (~17%) – important to make visible which areas are important to whom and why; Other things matter: safe anchorages, temporal, seasonal and species variations, equity/access concerns, etc.
Results (continued) Participants liked this process; It’s cheap, effective, replicable; Information compatible with other databases and GIS used in marine resource processes – e.g. habitat maps; Fishermen asked for copies of maps, and may choose to use them in MLPA process; Currently expanding project to larger sample and other user groups.
Community based management Port Orford, Oregon West Vancouver Island and ‘Namgis Nation,  British Columbia Pribilof Islands, Alaska
1. Port Orford, OR Picture: Vicki Wedell
 
POORT POORT = Port Orford Ocean Resources Team; Goal: engage the Port Orford fishermen and other  community members in developing and implementing a strategic plan that enhances the sustainability of the Port Orford fishery ecosystem and social system dependent on it Long-term planning objectives include:  increased input into local fishery management decisions diversification of economic opportunities, and  ensuring that conservation strategies balance economic and ecological sustainability with social equity
 
2. WVI AMB & ‘Namgis Nation, BC Groundfish access  & licensing, subsistence, fishery Salmon access & licensing, aquaculture, subsistence
3. Pribilof Islands Collaborative The Pribilof Collaborative process is intended to establish a forum of stakeholders and controlling government agencies dedicated to identifying issues confronting the environment surrounding the Pribilof Islands and take decisive actions to address these concerns through methods and actions recommended by the collaborative. The collaborative recognizes the inhabitants of the Pribilofs as the primary stakeholders with respect to such issues and will advocate the equal contribution and importance of Western science and Traditional Environmental Knowledge in addressing these issues.
Issues of concern: subsistence harvest fur seal foraging interactions with  (pollock) fishery St. Paul St. George
Trawl effort is concentrated near or on subsistence halibut grounds.
Source: Dave Albert
Source: Dave Albert
Source: Dave Albert
Conclusion MSFCMA and other reg’s require that  socioeconomic issues be addressed alongside  environmental concerns; GIS tools and analyses can be used to  integrate social, economic and ecological data; Examples show the utility of this, for fishery  management (West Coast groundfish),  participatory decision-analysis (MPA planning in California), and community-driven processes from Oregon to Alaska.
Questions? Contact information: Astrid Scholz email: ajscholz@ecotrust.org Tel: 415-561-2433

Socioeconomic considerations in marine resource management

  • 1.
    Socioeconomic considerations inmarine resource management Or, how to deal with people, places and communities FISH 693 Management of Renewable Marine Resources 19 March 2004 Astrid Scholz
  • 2.
    Introduction Ecotrust isa non-profit think tank and community development organization; Working to build Salmon Nation—where economy, ecology, and equity are in balance; Sector programs in Fisheries, Food & Farm, First Nations, Forestry; In-house GIS department and research; Collaborate with federal and state agencies, universities, industry, tribes & NGOs For more info, see www.ecotrust.org
  • 3.
    Outline Magnuson StevensAct – from bioeconomics to social science; Review of social science tools and new technologies (GIS); Examples and applications: Integrated geospatial tools (OCEAN); Participatory science, local knowledge for MPAs; Community based management.
  • 4.
    Magnuson Stevens FisheryConservation and Management Act, 1976 (revised 1996) National Standards: (1) Prevent overfishing while achieving optimal yield; (8) Take into account the importance of fishery resources to fishing communities to provide for the sustained participation of, and minimize adverse impacts to, such communities (consistent with conservation requirements). NS (1) begs the question “what is optimal?” NS (8) sets up the environment vs. economics (caveat: other reg’s do, too: NEPA, CEQA, RFA etc)
  • 5.
  • 6.
    Logistic population growthPop. growth (G) time Biomass ( x ) x “ Carrying Capacity” x MSY Stock that gives “maximum sustainable yield”
  • 7.
    Harvest Harvest dependson effort, stock size, and technology; for any given effort, sustainable harvest level is H=G, i.e. “skimming the cream off the top”; yield curve gives the sustainable harvest level as a function of effort level. x kE H x kE L x H H = k*E*x k = technology “catchability” E = effort (e.g. fishing days) x = biomass or stock Harvest for low effort Harvest for high effort G,
  • 8.
    Fishery Economics Harvest,or yield, has a per-unit-effort cost (w), and total cost, TC = w*E; Revenues from harvesting, TR = p*H(E), where p=price; From Microeconomics, revenues are maximized where marginal costs = marginal revenues, MC=MR; This is the economically optimal level of fishing; Under open access regime, those profits, or rents, attract new entrants to fishery until TR = TC (“open access equilibrium”).
  • 9.
    Fishery Economics –cont’d So, does limiting entry result in economic optimum? Typically, fisheries are not managed for economic optimum, but rather for MSY; MSY differs for different species; most FMPs set TAC’s reflecting fishing mortalities (F) that preserve between 35–45% of virgin biomass, and at levels lower than MSY; Recruitment overfishing (i.e., harvest outpaces population growth) is thought to occur at ~F10%.
  • 10.
    Fishery bioeconomics: the Gordon-Schaefer model Source: adapted from Dick Allen Open Access equilibrium Source: adapted from Dick Allen (TC) F40%
  • 11.
    So much forthe economics… on to the “social” in socioeconomics
  • 12.
    The “social” insocioeconomics People and communities depend on fishing for subsistence and livelihood Every management decision about fishing mortalities, catch (TAC’s, quotas), and effort controls (time and place of fishing, capacity) affects somebody’s stomach or pocket book Given the conservation mandate of the MSFCMA, potential for conflict abounds! Factoring people, places and communities into decisions critical to the success of management First, some definitions
  • 13.
    Socioeconomic analysis… …is the systematic study of people’s values, attitudes and experiences, and how they will be affected by management decisions; … uses economic, sociological, and other social science tools to derive statements about the size and nature of relative changes and their effects on communities; … does not provide any guidance as to which decisions are the right ones.
  • 14.
    Socioeconomic analysis… …helps identify likely obstacles to the successful implementation of management measures; … relies on the study of people: it tends to be more process-oriented and requires field work, whereas natural science relies on experiments and laboratory work; … is contentious: it goes to the heart of what makes people tick and what they care about.
  • 15.
    Tools Local knowledgeinterviews Participant observation Ethnographic interviews Surveys Focus groups Participatory and collaborative science, “joint fact finding” for management processes Shared information and data resources (GIS)
  • 16.
    Examples Relating areasof the ocean to communities on land (OCEAN); Fishermen’s knowledge for marine protected area management in California; Community based management Port Orford, Oregon West Vancouver Island and ‘Namgis Nation, British Columbia Collaborative stakeholder process in the Pribilof Islands, Alaska
  • 17.
  • 18.
    Distribution of trawlcatch and landings, 1987 - 2000
  • 19.
    Fishermen’s knowledge forMPA planning in California Collaborative pilot project (summer 2002) to elicit ecological and economic information from fishermen for MLPA process; Motivated by lessons from CINMS: Socioeconomic analysis: “too little, too late”; Process matters; “I felt like the socioeconomic panel took fishermen’s knowledge seriously”. 1st round of MLPA had already tripped up over process…
  • 20.
    Local knowledge —methods Participatory, field-based research; Designed questions and protocol with fishermen advisors (gatekeepers); Semi-structured interviews in six ports, 28 fishermen; Focus: historically productive areas; “ bread and butter” areas; Highly biodiverse areas; Important anchorages; (closure candidates) Nicole and Kate in action!
  • 21.
  • 22.
  • 23.
    Results 41.7% overlapbetween critical economic areas and initial set of DFG MPA sites; 26.9% overlap between acceptable closure candidates and initial DFG sites; Sometimes they overlap with each other (~17%) – important to make visible which areas are important to whom and why; Other things matter: safe anchorages, temporal, seasonal and species variations, equity/access concerns, etc.
  • 24.
    Results (continued) Participantsliked this process; It’s cheap, effective, replicable; Information compatible with other databases and GIS used in marine resource processes – e.g. habitat maps; Fishermen asked for copies of maps, and may choose to use them in MLPA process; Currently expanding project to larger sample and other user groups.
  • 25.
    Community based managementPort Orford, Oregon West Vancouver Island and ‘Namgis Nation, British Columbia Pribilof Islands, Alaska
  • 26.
    1. Port Orford,OR Picture: Vicki Wedell
  • 27.
  • 28.
    POORT POORT =Port Orford Ocean Resources Team; Goal: engage the Port Orford fishermen and other community members in developing and implementing a strategic plan that enhances the sustainability of the Port Orford fishery ecosystem and social system dependent on it Long-term planning objectives include: increased input into local fishery management decisions diversification of economic opportunities, and ensuring that conservation strategies balance economic and ecological sustainability with social equity
  • 29.
  • 30.
    2. WVI AMB& ‘Namgis Nation, BC Groundfish access & licensing, subsistence, fishery Salmon access & licensing, aquaculture, subsistence
  • 31.
    3. Pribilof IslandsCollaborative The Pribilof Collaborative process is intended to establish a forum of stakeholders and controlling government agencies dedicated to identifying issues confronting the environment surrounding the Pribilof Islands and take decisive actions to address these concerns through methods and actions recommended by the collaborative. The collaborative recognizes the inhabitants of the Pribilofs as the primary stakeholders with respect to such issues and will advocate the equal contribution and importance of Western science and Traditional Environmental Knowledge in addressing these issues.
  • 32.
    Issues of concern:subsistence harvest fur seal foraging interactions with (pollock) fishery St. Paul St. George
  • 33.
    Trawl effort isconcentrated near or on subsistence halibut grounds.
  • 34.
  • 35.
  • 36.
  • 37.
    Conclusion MSFCMA andother reg’s require that socioeconomic issues be addressed alongside environmental concerns; GIS tools and analyses can be used to integrate social, economic and ecological data; Examples show the utility of this, for fishery management (West Coast groundfish), participatory decision-analysis (MPA planning in California), and community-driven processes from Oregon to Alaska.
  • 38.
    Questions? Contact information:Astrid Scholz email: ajscholz@ecotrust.org Tel: 415-561-2433