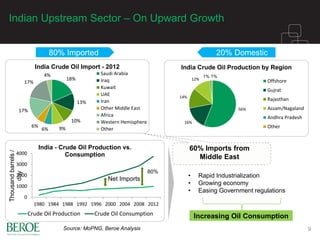
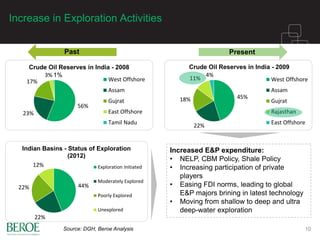
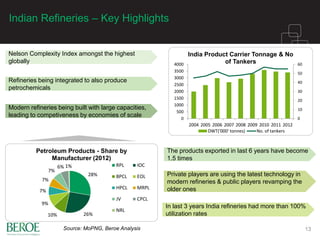
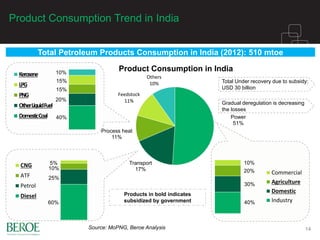
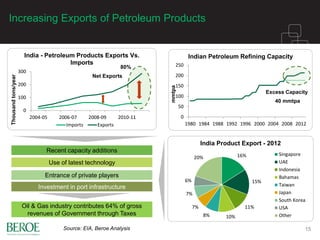
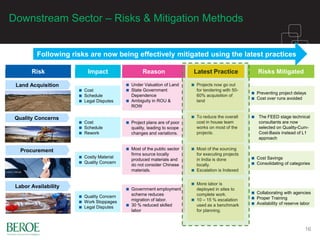
Indian Products Market, India as an Export
Hub: Myth or reality?
Argus East of Suez Products Conference
2013, Singapore
26th June 2013
About us
Beroe is unique in its exclusive focus on procurement. We enable procurement decision making
in Fortune 500 companies by providing access to category specific market intelligence, risk
management and green procurement services across the globe.
INTELLIGENCE
Deep Dive
Category Reports
Cost Models, Price
Forecasts
SOURCE
Category
Dashboards, Best
Practices
China, India, SEA
Eastern Europe,
Western Europe,
N.A
Latin America,
Middle East,
Africa
SUPPLY RISK
Supplier Risk
Assessments
Supply Chain Risk
Enterprise Risk
Management
ETHICAL RISK
Social
Responsibility
Endangered
Species
Illegal
Sourcing
GREEN
Environmental
Footprint
Agenda
3
Global Crude
Oil Demand
Scenario –
Emergence
of Asia
Rising
significance of
Indian E&P
sector
Trends in
Petrochemicals
& Refinery
sector in India
Rise of
exports of
petroleum
products
Adoption of world
class operational
best-practices and
KPIs for
downstream
Industries
Global Oil & Gas Scenario
Asia constitutes a significant part of Global spend, while India constitutes a important
part of Asian spend
4
Oil & Gas Spend in 2012 (in USD billion)
Global ASIA INDIA
Exploration | Development
Upstream
1230 238 80
Refining | Petrochemical 770 160 60
Downstream
Emerging Demand Pattern in Asia
China & India are leading the way in consumption of crude oil, as demand in these
regions are forecasted to be 4-8 times the global average
5
Strategic Shift in Demand of Crude Oil
4.1 %
By 2035
Demand
1.9 %
By 2035
Demand
1.2 %
Source: IEA, World Energy Outlook, 2012
By 2035
Demand
1.6 %
By 2035
Demand
1 %
By 2035
Demand
• Asia is steadily emerging as the global leader in crude oil consumption, primarily due to the fast growing
economies like China, India, Indonesia and Middle East Countries.
• Going forward crude oil dynamics would be dictated by the demand patterns in Asia, as it gains
significance both in supply and demand of crude oil.
Global
Demand
By 2035
0.5 %
Comparing India’s O&G Sector with Similar Developing
Economies
6
2613
267
559
3835
421
14641.61%
1.92%
4.09%
0%
1%
2%
3%
4%
5%
0
1000
2000
3000
4000
5000
China Brazil India
CAGR(%)
CrudeOilDemand(mtoe)
Crude Oil Demand & CAGR of China, Brazil & India (2011 & 2035)
2011 2035 Growth Rate
China’s economy will mature at a faster rate than India
India’s Growth: Rapid industrialization, increasing purchasing power and regulatory changes
The per capita energy consumption is one of the lowest in India, growing at a very rapid pace
Source: BP Statistical report, Beroe Analysis
India’s Energy Consumption – Overview
India's Energy Consumption is an indicator of its status as a developing economy
showing continuous growth.
• .
7
Coal
41%
Petroleum
23%
Solid
Biomass &
Waste
23%
Natural
Gas
8%
Renewable
Sources
5%
Source: EIA, Beroe Analysis
Major Constraints:
• Poor penetration of civil infrastructure
• Bureaucratic inertia
• Development not being even among
regions
Major Drivers:
• Steady Industrial and economic growth
• Easing FDI norms, resulting in increased
investment
• Higher standards of living
• Expected to rise to about 20% by
2025
• Will result in comparatively
cheaper feedstock for
petrochemical
• Usage of Biomass is slowly
decreasing as urbanization is
increasing
• Power sector continues
to dominate the coal
usage
• Having steady growth
due to increased
demand from across
industries
Indian Upstream Scenario
8
Indian Upstream Sector – On Upward Growth
9
18%
13%
10%
9%6%
6%
17%
17%
4%
India Crude Oil Import - 2012
Saudi Arabia
Iraq
Kuwait
UAE
Iran
Other Middle East
Africa
Western Hemisphere
Other
56%
16%
14%
12%
1% 1%
India Crude Oil Production by Region
Offshore
Gujrat
Rajasthan
Assam/Nagaland
Andhra Pradesh
Other
80% Imported 20% Domestic
0
1000
2000
3000
4000
1980 1984 1988 1992 1996 2000 2004 2008 2012
Thousandbarrels/
day
India - Crude Oil Production vs.
Consumption
Crude Oil Production Crude Oil Consumption
Net Imports
80%
• Rapid Industrialization
• Growing economy
• Easing Government regulations
Increasing Oil Consumption
60% Imports from
Middle East
Source: MoPNG, Beroe Analysis
Increase in Exploration Activities
10
56%
23%
17%
3% 1%
Crude Oil Reserves in India - 2008
West Offshore
Assam
Gujrat
East Offshore
Tamil Nadu
45%
22%
18%
11%
4%
Crude Oil Reserves in India - 2009
West Offshore
Assam
Gujrat
Rajasthan
East Offshore
PresentPast
44%
22%
22%
12%
Indian Basins - Status of Exploration
(2012)
Exploration Initiated
Moderately Explored
Poorly Explored
Unexplored
Increased E&P expenditure:
• NELP, CBM Policy, Shale Policy
• Increasing participation of private
players
• Easing FDI norms, leading to global
E&P majors brining in latest technology
• Moving from shallow to deep and ultra
deep-water exploration
Source: DGH, Beroe Analysis
Indian Downstream Scenario – Potential Export Hub
11
India – Asia's Leading Producer of Products
12
26%
49%
11%
1%
3%
3%
7% Production Pattern
Light Distillates
Middle Distillates
Total Fuel Oils
Lubes
Bitumen
Others
RBF & Losses/inventories
0
50
100
150
200
250
2004 2005 2006 2007 2008 2009 2010 2011
millionTonnes
Petroleum Products Throughput - By
Type
Light Distillates Middle Distillates Heavy Ends
• World’s 6th largest refining capacity
• India has a huge geographical advantage
• The refinery capacity addition recently has
been instrumental in India being a top exporter
in Asia
• New refineries match the global stringent
environmental and quality norms
• Introduction of PCPIR initiative by Government
• In the last 10 years that the change in mix of
products has not changed significantly
• Middle distillates, dominated by diesel and
industrial fuels comprise of about half of the
petroleum products, due to robust economic
growth
• The entry of private players have been
instrumental in this growth
Source: MoPNG, Beroe Analysis
Indian Refineries – Key Highlights
13
0
10
20
30
40
50
60
0
500
1000
1500
2000
2500
3000
3500
4000
2004 2005 2006 2007 2008 2009 2010 2011 2012
India Product Carrier Tonnage & No
of Tankers
DWT('000' tonnes) No. of tankers
28%
26%10%
9%
7%
7%
7%
6% 1%
Petroleum Products - Share by
Manufacturer (2012)
RPL IOC
BPCL EOL
HPCL MRPL
JV CPCL
NRL
Nelson Complexity Index amongst the highest
globally
Refineries being integrated to also produce
petrochemicals
Modern refineries being built with large capacities,
leading to competiveness by economies of scale
The products exported in last 6 years have become
1.5 times
Source: MoPNG, Beroe Analysis
In last 3 years India refineries had more than 100%
utilization rates
Private players are using the latest technology in
modern refineries & public players revamping the
older ones
Product Consumption Trend in India
14
Power
51%
Transport
17%
Process heat
11%
Feedstock
11%
Others
10%
Product Consumption in India
40%
30%
20%
10%
Commercial
Agriculture
Domestic
Industry
40%
20%
15%
15%
10%Kerosene
LPG
PNG
OtherLiquidFuel
DomesticCoal
Products in bold indicates
subsidized by government
Total Petroleum Products Consumption in India (2012): 510 mtoe
60%
25%
10%
5%CNG
ATF
Petrol
Diesel
Source: MoPNG, Beroe Analysis
Total Under recovery due to subsidy:
USD 30 billion
Gradual deregulation is decreasing
the losses
Increasing Exports of Petroleum Products
15
16%
15%
11%
10%8%
7%
7%
6%
20%
India Product Export - 2012
Singapore
UAE
Indonesia
Bahamas
Taiwan
Japan
South Korea
USA
Other
Recent capacity additions
Use of latest technology
Entrance of private players
Investment in port infrastructure
Oil & Gas industry contributes 64% of gross
revenues of Government through Taxes
0
50
100
150
200
250
1980 1984 1988 1992 1996 2000 2004 2008 2012
mmtpa
Indian Petroleum Refining Capacity
0
100
200
300
2004-05 2006-07 2008-09 2010-11
Thousandtons/year
India - Petroleum Products Exports Vs.
Imports
Imports Exports
Net Exports
Excess Capacity
Source: EIA, Beroe Analysis
40 mmtpa
80%
Downstream Sector – Risks & Mitigation Methods
16
16
Risk Impact Reason Latest Practice Risks Mitigated
Land Acquisition
 Preventing project delays
 Cost over runs avoided
Quality Concerns  The FEED stage technical
consultants are now
selected on Quality-Cum-
Cost-Basis instead of L1
approach
Procurement
 Cost Savings
 Consolidating of categories
Labor Availability
 Collaborating with agencies
 Proper Training
 Availability of reserve labor
 Cost
 Schedule
 Legal Disputes
 Cost
 Schedule
 Rework
 Costly Material
 Quality Concern
 Quality Concern
 Work Stoppages
 Legal Disputes
 Under Valuation of Land
 State Government
Dependence
 Ambiguity in ROU &
ROW
 Project plans are of poor
quality, leading to scope
changes and variations.
 Most of the public sector
firms source locally
produced materials and
do not consider Chinese
materials.
 Government employment
scheme reduces
migration of labor.
 30 % reduced skilled
labor
 Projects now go out
for tendering with 50-
60% acquisition of
land
 To reduce the overall
cost in house team
works on most of the
projects.
 Most of the sourcing
for executing projects
in India is done
locally.
 Escalation is Indexed
 More labor is
deployed in sites to
complete work.
 10 – 15 % escalation
used as a benchmark
for planning.
Following risks are now being effectively mitigated using the latest practices
Risk Impact Reason Latest Practice
KPIs for Oil & Gas Downstream Projects
17
The KPI helps to monitor, rate and report the performance of the supplier in
proactively managing the project.
Export Oriented Enablers for Indian Products Market
Low cost of construction and
local sourcing for greenfield &
brownfield projects
Investments in ports
infrastructure along the East &
West coast – Proximity to Gulf
Increasing Investment from
Public & Private Sector
18
Cheap and Easy Availability of
Labor
Low and favorable export duties
on petroleum products
20-25% over capacity of refining
products due to recent capacity
addition
2006-07 (mmtpa)
2012-13F
(mmtpa)
2012-13F Change
Refining Capacity 135 230-245 +95-110
Naphtha Supply 13.5 26-28 +11-13
Trends in Naphtha Usage
Petrochemicals 7
Fertilizers 3 60% Naphtha required for Fertilizer & Power
to reduce by 2.5 mmtpa
Power 2 40%
Net Exports 1.5 Exports will potentially rise
Indian Petrochemical Scenario
19
Projected Feedstock Availability (2012-13)
Note: Naphtha supply assumed 10% of refined products
Per Capita
Consumption
of Plastics
7 kg
45 kg
65 kg
Source: Beroe Analysis
Appendix
20
Features of the Indian Petrochemical Sector
21
• The close linkages between the
international and domestic market prices
• Adoption of the state-of-the-art
technology and high investment in the
R&D High elasticity of demand
• The country has 5 naphtha, 4 gas
cracker and 4 aromatic production
facilities
• The export duties on petrochemical
products are one of the lowest
• Feedstock availability
• Recent Economic Slowdown
• Capital intensive
Drivers & Constraints – Downstream Sector
22
Recovering
Economy:
Peaking out of
Interest Rates
Investment:
Huge allocation of
funds by government
Fiscal Deficit
Issues,
Persistent
Inflation
Increasing Input Costs
(Coal, Diesel, etc.)
End User:
Steady Industrial
growth is supported
by oil and gas
investment
High
Procurement:
To improve quality, Government
planning to introduce
department of procurement
Low
High
Impact
Low
High
Drivers
Restraints
Escalation
The Labour Wage
rate and material
price escalation
Average Project
Planning
Impact
Thank You

Indian Products Market

  • 1.
    Indian Products Market,India as an Export Hub: Myth or reality? Argus East of Suez Products Conference 2013, Singapore 26th June 2013
  • 2.
    About us Beroe isunique in its exclusive focus on procurement. We enable procurement decision making in Fortune 500 companies by providing access to category specific market intelligence, risk management and green procurement services across the globe. INTELLIGENCE Deep Dive Category Reports Cost Models, Price Forecasts SOURCE Category Dashboards, Best Practices China, India, SEA Eastern Europe, Western Europe, N.A Latin America, Middle East, Africa SUPPLY RISK Supplier Risk Assessments Supply Chain Risk Enterprise Risk Management ETHICAL RISK Social Responsibility Endangered Species Illegal Sourcing GREEN Environmental Footprint
  • 3.
    Agenda 3 Global Crude Oil Demand Scenario– Emergence of Asia Rising significance of Indian E&P sector Trends in Petrochemicals & Refinery sector in India Rise of exports of petroleum products Adoption of world class operational best-practices and KPIs for downstream Industries
  • 4.
    Global Oil &Gas Scenario Asia constitutes a significant part of Global spend, while India constitutes a important part of Asian spend 4 Oil & Gas Spend in 2012 (in USD billion) Global ASIA INDIA Exploration | Development Upstream 1230 238 80 Refining | Petrochemical 770 160 60 Downstream
  • 5.
    Emerging Demand Patternin Asia China & India are leading the way in consumption of crude oil, as demand in these regions are forecasted to be 4-8 times the global average 5 Strategic Shift in Demand of Crude Oil 4.1 % By 2035 Demand 1.9 % By 2035 Demand 1.2 % Source: IEA, World Energy Outlook, 2012 By 2035 Demand 1.6 % By 2035 Demand 1 % By 2035 Demand • Asia is steadily emerging as the global leader in crude oil consumption, primarily due to the fast growing economies like China, India, Indonesia and Middle East Countries. • Going forward crude oil dynamics would be dictated by the demand patterns in Asia, as it gains significance both in supply and demand of crude oil. Global Demand By 2035 0.5 %
  • 6.
    Comparing India’s O&GSector with Similar Developing Economies 6 2613 267 559 3835 421 14641.61% 1.92% 4.09% 0% 1% 2% 3% 4% 5% 0 1000 2000 3000 4000 5000 China Brazil India CAGR(%) CrudeOilDemand(mtoe) Crude Oil Demand & CAGR of China, Brazil & India (2011 & 2035) 2011 2035 Growth Rate China’s economy will mature at a faster rate than India India’s Growth: Rapid industrialization, increasing purchasing power and regulatory changes The per capita energy consumption is one of the lowest in India, growing at a very rapid pace Source: BP Statistical report, Beroe Analysis
  • 7.
    India’s Energy Consumption– Overview India's Energy Consumption is an indicator of its status as a developing economy showing continuous growth. • . 7 Coal 41% Petroleum 23% Solid Biomass & Waste 23% Natural Gas 8% Renewable Sources 5% Source: EIA, Beroe Analysis Major Constraints: • Poor penetration of civil infrastructure • Bureaucratic inertia • Development not being even among regions Major Drivers: • Steady Industrial and economic growth • Easing FDI norms, resulting in increased investment • Higher standards of living • Expected to rise to about 20% by 2025 • Will result in comparatively cheaper feedstock for petrochemical • Usage of Biomass is slowly decreasing as urbanization is increasing • Power sector continues to dominate the coal usage • Having steady growth due to increased demand from across industries
  • 8.
  • 9.
    Indian Upstream Sector– On Upward Growth 9 18% 13% 10% 9%6% 6% 17% 17% 4% India Crude Oil Import - 2012 Saudi Arabia Iraq Kuwait UAE Iran Other Middle East Africa Western Hemisphere Other 56% 16% 14% 12% 1% 1% India Crude Oil Production by Region Offshore Gujrat Rajasthan Assam/Nagaland Andhra Pradesh Other 80% Imported 20% Domestic 0 1000 2000 3000 4000 1980 1984 1988 1992 1996 2000 2004 2008 2012 Thousandbarrels/ day India - Crude Oil Production vs. Consumption Crude Oil Production Crude Oil Consumption Net Imports 80% • Rapid Industrialization • Growing economy • Easing Government regulations Increasing Oil Consumption 60% Imports from Middle East Source: MoPNG, Beroe Analysis
  • 10.
    Increase in ExplorationActivities 10 56% 23% 17% 3% 1% Crude Oil Reserves in India - 2008 West Offshore Assam Gujrat East Offshore Tamil Nadu 45% 22% 18% 11% 4% Crude Oil Reserves in India - 2009 West Offshore Assam Gujrat Rajasthan East Offshore PresentPast 44% 22% 22% 12% Indian Basins - Status of Exploration (2012) Exploration Initiated Moderately Explored Poorly Explored Unexplored Increased E&P expenditure: • NELP, CBM Policy, Shale Policy • Increasing participation of private players • Easing FDI norms, leading to global E&P majors brining in latest technology • Moving from shallow to deep and ultra deep-water exploration Source: DGH, Beroe Analysis
  • 11.
    Indian Downstream Scenario– Potential Export Hub 11
  • 12.
    India – Asia'sLeading Producer of Products 12 26% 49% 11% 1% 3% 3% 7% Production Pattern Light Distillates Middle Distillates Total Fuel Oils Lubes Bitumen Others RBF & Losses/inventories 0 50 100 150 200 250 2004 2005 2006 2007 2008 2009 2010 2011 millionTonnes Petroleum Products Throughput - By Type Light Distillates Middle Distillates Heavy Ends • World’s 6th largest refining capacity • India has a huge geographical advantage • The refinery capacity addition recently has been instrumental in India being a top exporter in Asia • New refineries match the global stringent environmental and quality norms • Introduction of PCPIR initiative by Government • In the last 10 years that the change in mix of products has not changed significantly • Middle distillates, dominated by diesel and industrial fuels comprise of about half of the petroleum products, due to robust economic growth • The entry of private players have been instrumental in this growth Source: MoPNG, Beroe Analysis
  • 13.
    Indian Refineries –Key Highlights 13 0 10 20 30 40 50 60 0 500 1000 1500 2000 2500 3000 3500 4000 2004 2005 2006 2007 2008 2009 2010 2011 2012 India Product Carrier Tonnage & No of Tankers DWT('000' tonnes) No. of tankers 28% 26%10% 9% 7% 7% 7% 6% 1% Petroleum Products - Share by Manufacturer (2012) RPL IOC BPCL EOL HPCL MRPL JV CPCL NRL Nelson Complexity Index amongst the highest globally Refineries being integrated to also produce petrochemicals Modern refineries being built with large capacities, leading to competiveness by economies of scale The products exported in last 6 years have become 1.5 times Source: MoPNG, Beroe Analysis In last 3 years India refineries had more than 100% utilization rates Private players are using the latest technology in modern refineries & public players revamping the older ones
  • 14.
    Product Consumption Trendin India 14 Power 51% Transport 17% Process heat 11% Feedstock 11% Others 10% Product Consumption in India 40% 30% 20% 10% Commercial Agriculture Domestic Industry 40% 20% 15% 15% 10%Kerosene LPG PNG OtherLiquidFuel DomesticCoal Products in bold indicates subsidized by government Total Petroleum Products Consumption in India (2012): 510 mtoe 60% 25% 10% 5%CNG ATF Petrol Diesel Source: MoPNG, Beroe Analysis Total Under recovery due to subsidy: USD 30 billion Gradual deregulation is decreasing the losses
  • 15.
    Increasing Exports ofPetroleum Products 15 16% 15% 11% 10%8% 7% 7% 6% 20% India Product Export - 2012 Singapore UAE Indonesia Bahamas Taiwan Japan South Korea USA Other Recent capacity additions Use of latest technology Entrance of private players Investment in port infrastructure Oil & Gas industry contributes 64% of gross revenues of Government through Taxes 0 50 100 150 200 250 1980 1984 1988 1992 1996 2000 2004 2008 2012 mmtpa Indian Petroleum Refining Capacity 0 100 200 300 2004-05 2006-07 2008-09 2010-11 Thousandtons/year India - Petroleum Products Exports Vs. Imports Imports Exports Net Exports Excess Capacity Source: EIA, Beroe Analysis 40 mmtpa 80%
  • 16.
    Downstream Sector –Risks & Mitigation Methods 16 16 Risk Impact Reason Latest Practice Risks Mitigated Land Acquisition  Preventing project delays  Cost over runs avoided Quality Concerns  The FEED stage technical consultants are now selected on Quality-Cum- Cost-Basis instead of L1 approach Procurement  Cost Savings  Consolidating of categories Labor Availability  Collaborating with agencies  Proper Training  Availability of reserve labor  Cost  Schedule  Legal Disputes  Cost  Schedule  Rework  Costly Material  Quality Concern  Quality Concern  Work Stoppages  Legal Disputes  Under Valuation of Land  State Government Dependence  Ambiguity in ROU & ROW  Project plans are of poor quality, leading to scope changes and variations.  Most of the public sector firms source locally produced materials and do not consider Chinese materials.  Government employment scheme reduces migration of labor.  30 % reduced skilled labor  Projects now go out for tendering with 50- 60% acquisition of land  To reduce the overall cost in house team works on most of the projects.  Most of the sourcing for executing projects in India is done locally.  Escalation is Indexed  More labor is deployed in sites to complete work.  10 – 15 % escalation used as a benchmark for planning. Following risks are now being effectively mitigated using the latest practices Risk Impact Reason Latest Practice
  • 17.
    KPIs for Oil& Gas Downstream Projects 17 The KPI helps to monitor, rate and report the performance of the supplier in proactively managing the project.
  • 18.
    Export Oriented Enablersfor Indian Products Market Low cost of construction and local sourcing for greenfield & brownfield projects Investments in ports infrastructure along the East & West coast – Proximity to Gulf Increasing Investment from Public & Private Sector 18 Cheap and Easy Availability of Labor Low and favorable export duties on petroleum products 20-25% over capacity of refining products due to recent capacity addition
  • 19.
    2006-07 (mmtpa) 2012-13F (mmtpa) 2012-13F Change RefiningCapacity 135 230-245 +95-110 Naphtha Supply 13.5 26-28 +11-13 Trends in Naphtha Usage Petrochemicals 7 Fertilizers 3 60% Naphtha required for Fertilizer & Power to reduce by 2.5 mmtpa Power 2 40% Net Exports 1.5 Exports will potentially rise Indian Petrochemical Scenario 19 Projected Feedstock Availability (2012-13) Note: Naphtha supply assumed 10% of refined products Per Capita Consumption of Plastics 7 kg 45 kg 65 kg Source: Beroe Analysis
  • 20.
  • 21.
    Features of theIndian Petrochemical Sector 21 • The close linkages between the international and domestic market prices • Adoption of the state-of-the-art technology and high investment in the R&D High elasticity of demand • The country has 5 naphtha, 4 gas cracker and 4 aromatic production facilities • The export duties on petrochemical products are one of the lowest • Feedstock availability • Recent Economic Slowdown • Capital intensive
  • 22.
    Drivers & Constraints– Downstream Sector 22 Recovering Economy: Peaking out of Interest Rates Investment: Huge allocation of funds by government Fiscal Deficit Issues, Persistent Inflation Increasing Input Costs (Coal, Diesel, etc.) End User: Steady Industrial growth is supported by oil and gas investment High Procurement: To improve quality, Government planning to introduce department of procurement Low High Impact Low High Drivers Restraints Escalation The Labour Wage rate and material price escalation Average Project Planning Impact
  • 23.