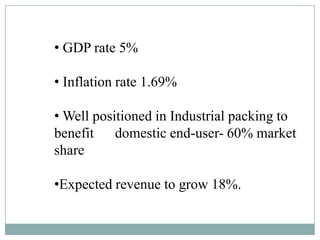
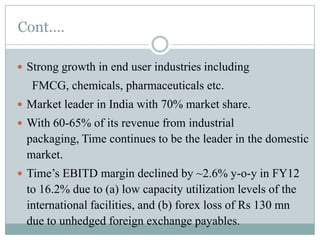
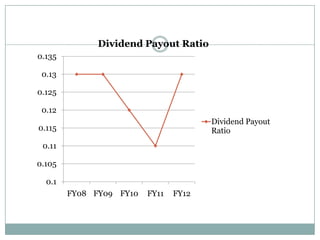
Equity Analysis

Presented by- Nilima Patil
Santosh Phad
Vaishali Chinchore
Harshada Patil
Snehal Vibhandik
Nilesh Sandhanshiv
About Time Technoplast Ltd;
 Time was Incorporated in the year 1989, started

its operations as a small scale unit in Daman in
1991.
 Mr. Anil Jain, Promoter and M.D of TTL.
 It started its production with the manufacture

of polymer drums.
 But now has a diverse product portfolio by

continuously adding newer products.
 It currently boasts of 46 Manufacturing facilities

across 13 countries like India, the Czech
Republic, Poland, UAE, China and etc.
 Product offered by TTL is under five broad

segments- Industrial packaging, Infrastructure
products, Automotive products, Lifestyle and
Healthcare products.
Industrial Packaging:
Auto component:
Healthcare:
Lifestyle:
Infrastructure:
Economic Analysis Of Plastic
Industry
• GDP rate 5%
• Inflation rate 1.69%
• Well positioned in Industrial packing to
benefit domestic end-user- 60% market
share
•Expected revenue to grow 18%.
• Operating margins to remain stable
• Has established footprints in Asia

•ROE under stress in short term
•Total foreign exchange earnings-

Rs. 275.30 Mn
•Total foreign exchange outgo-

Rs. 2507.68 Mn
ECONOMIC ANALYSIS OF TIME
TECHNOPLAST

REVENUE CONTRIBUTIONS ARE AS
FOLLOWSIndustrial
packaging

Infrastructure Lifestyle
product
product

62%

18%

20%
Cont.…
 Strong growth in end user industries including

FMCG, chemicals, pharmaceuticals etc.
 Market leader in India with 70% market share.
 With 60-65% of its revenue from industrial

packaging, Time continues to be the leader in the domestic
market.
 Time’s EBITD margin declined by ~2.6% y-o-y in FY12

to 16.2% due to (a) low capacity utilization levels of the
international facilities, and (b) forex loss of Rs 130 mn
due to unhedged foreign exchange payables.
Cont.…..
EBITD margin to stay low...
FY08- 21.5%
FY09- 19.9%
FY10- 19.5%
FY11 -18.8%
FY12 - 16.2%
Industry Analysis
Size of the Plastic Industry
 In India there are about 25000 plastic processing

units and about 250 plastic processing machinery
manufactures.
 The Machinery units supply over 2500 machineries

per annum.
Role of Plastic Industry in the Indian
Economy
2010
Consumption of Plastic polymer

6.7 Million Tonnes

Employment in Plastic Industry

4 Millions

Plastic Industry’s Turnover

Rs 50,ooo Crores

Export of Plastic Products

US$ 2500 Millions

Contribution of Polymers and Plastic Products
to the Exchequer

Rs. 7000
Crores

Source : Indian Plastics Industry
Polymer products/Industry
 India’s per capita consumption of polymer is

one of the lowest in the world at nearly 6kgs
compared to Asia’s per capita consumption of
nearly 18kgs.

 United States per capita consumption is nearly

28kgs.

 As India’s economy is growing at a rapid

pace, the industry has ample opportunities to
tap increased consumption levels.
Packaging Industry:
 Indian packaging industry is currently a US$14

billion market growing at 15% p.a.
 Industry is expected to double gradually in the

coming years.
Infrastructure:
 Development of numerous residential, commercial

& industrial project and vital infrastructures has
boosted the demand for primary raw material viz.
Cement, steel etc. as well as facilitating material &
equipment viz. glass, plastics.
 In the next five years, Government of India( GOI)

estimates investments to step up to $90 billion in
the infrastructure sector.
Automobile Sector:
 Indian Automobile component industry valued

above US$ 20 bn in terms of turnover.
 Automobile sector which is currently growing at

30% is also expected to continue the growth
momentum.
Composition of Indian Auto Component
Industry
Sales
10%

Engine Parts

8%

Others

40%

7%

Suspension &
Broking Parts
Equipment

12%
Electrical Parts
23%

Drive Transmission

Source: Crisil Research
Health Care:
 The Indian Healthcare Industry (i.e. health care

delivery, pharmaceuticals, medical and
diagnostic equipment) is estimated to be above
US$ 40.2 bn in terms of revenue of which above
10% is accounted for by medical consumables
viz. syringes, gloves, face masks and other
disposable items.

Source: E & Y Survey
Competitors of TTL:
Product/
Segment

Industrial
Packaging

Key
Competitors

Domestic:
Balmer Lawrie,
Van Leer,
Sintex
Industries.

Infrastructu
re Products
Pipes: Jain
Irrigation,
Supreme
Industries

Lifestyle
Products

Highly
fragmented
industry with
many
unorganized
Battery: HBL players
International Power, Amara
: Grief, Shutz
Raja, Exide
and Mauser
Industries.

Automotive
Component
s and others
Highly
fragmented
industry with
many
unorganized
players
Peer Comparison:
P/E

EBITDA

ROE(%)

Company

M Cap

FY
12

FY13E

FY 12

FY13E

FY12

FY13E

Time
Technoplast
Ltd.

9,140

10.2

8.4

6.8

6.0

12.2

13.1

Sintex
Industries
Ltd.

16,762

7.6

5.1

6.0

5.2

12.15

11.95

Supreme
Industries
Ltd.

31,852

13.2

11.7

7.5

6.9

38.8

34.8
Company Analysis
 To understanding the internal working of

the company and its relationship to its
external environment.
 Company’s Analysis can be done in

- Financial Analysis
- Non Financial Analysis
Ratio Analysis of TTL
Profitability Ratios:Gross Profit
Ratio
GP Ratio
17.5
17
16.5
16
15.5
15
14.5
14
13.5
FY08

FY09

FY10

FY11

FY12
Net Profit Ratio:
NP Ratio
16
14
12
10
8
6
4

2
0
FY08

FY09

FY10

FY11

FY12
Leverage Ratio: Debt Equity Ratio
Total Debt-Equity Ratio
0.7
0.6

0.5
0.4
0.3
0.2
0.1
0
FY08

FY09

FY10

FY11

FY12
Asset Management Ratio:
Fixed Assets Turnover Ratio
Fixed Asset Turnover Ratio
2
1.8
1.6
1.4
1.2
1
0.8
0.6
0.4
0.2
0
FY08

FY09

FY10

FY11

FY12
Liquidity Ratio: Current Ratio
Current Ratio
4.5
4
3.5
3
2.5
2

1.5
1
0.5
0
FY08

FY09

FY10

FY11

FY12
Quick Ratio:
Quick Ratio
3
2.5
2
1.5
1
0.5
0
FY08

FY09

FY10

FY11

FY12
Market Based Ratio:
Earning per share
Earning Per Share
30
25
20
15
10
5
0
FY08

FY09

FY10

FY11

FY12
Dividend Payout Ratio
0.135
0.13
0.125
0.12
Dividend Payout
Ratio

0.115
0.11
0.105
0.1
FY08 FY09 FY10

FY11

FY12
Profit and Loss A/c Statements
Particulars

FY’ 2011

FY’ 2012

Shift%

Net Sales

12,775

15,321

19.92%

EBITDA

2,383

2,470

3.65%

Profit Before Tax

1,525

1,229

-19.41%

Profit After Tax

1,169

921

-21.21%

59

23

-61.02%

1,110

898

-19.10%

Minority Interest
Net Profit
SWOT
ANALYSIS
Strengths:
 Unique business model

 Association with Mauser

 Wide Range of product Solutions:

Reputation of “ ONE STOP SHOP”
Weaknesses:
 Bulk of revenues come from packaging: The IP

division currently contributes above 65% of TTL’s
revenue and the emergence of a cost- competitive
substitute product could impact revenues and
profits.
 Profitability of International Operations
Opportunities:
 Spiraling Price of metal
 Bright prospects of end- user segments:

Sectors like telecom, chemicals, automobiles etc.
Demand for a product like batteries, high volume
polymer containers, fuel/radiator tanks etc.
Threats:
 Entire Manufacturing capacity is polymer based.
 Elongation of working capital cycle:

TTL enhances its scale of operations, the scope and
duration of working capital will go up. Strains the
company’s resource and leads to drop in profitability
of operations.
TECHNICAL ANALYSIS
Content
 Line Chart of Time Technoplast.
 Analysis with the help of Technical Indicator.
 Average Volatility of Time Technoplast.
 Share Price Movement of Technoplast.
 Conclusion & Prediction of Technoplast Share Prices.
One Month Chart for Time Technoplast Limited
Average Volatility of Time Technoplast Ltd
Date

Closing Prices

Returns

St. Dev

02-Sep-13
03-Sep-13
04-Sep-13
05-Sep-13
06-Sep-13
10-Sep-13
11-Sep-13
12-Sep-13
13-Sep-13
16-Sep-13
17-Sep-13
18-Sep-13
19-Sep-13
20-Sep-13
23-Sep-13
24-Sep-13
25-Sep-13
26-Sep-13
27-Sep-13
30-Sep-13
01-Oct-13

29.45
30.1
30.75
31.05
30.65
31.3
31.5
31.8
31.4
30.05
29.35
29.5
29.7
33.3
31.9
31.95
31.1
31.45
32.9
32.65
32.8

0.022071307
0.021594684
0.009756098
-0.012882448
0.021207178
0.006389776
0.00952381
-0.012578616
-0.042993631
-0.023294509
0.005110733
0.006779661
0.121212121
-0.042042042
0.001567398
-0.026604069
0.011254019
0.046104928
-0.007598784
0.004594181
-1

0.0136486
0.0125994
0.0135956
0.0227608
0.0238333
0.0207332
0.020794
0.0580061
0.0613528
0.0570542
0.057473
0.0574016
0.0589079
0.0307826
0.0240755
0.4112162

Volatility in %

6 days

21.66646 21.67% for 6 days
20.000888
21.582299
36.131663
37.834184
32.91299
33.009524
92.081771
97.394481
90.570711
91.235492
91.122294
93.513396
48.865834
38.218644
652.78556
Share Price Movement of Technoplast Ltd
Date

Price

25-Oct-13
24-Oct-13
23-Oct-13
22-Oct-13
21-Oct-13
18-Oct-13
17-Oct-13
15-Oct-13
14-Oct-13
11-Oct-13
10-Oct-13
09-Oct-13
08-Oct-13
07-Oct-13
04-Oct-13
03-Oct-13
01-Oct-13
30-Sep-13
27-Sep-13
26-Sep-13

34.9
34.45
35.25
32.6
33.8
33.7
35.2
35.2
34.55
34.3
34
32.4
32.95
33.8
33.9
33.9
33.9
32.9
31.95
31.9

High Price Low Price Close Price No. of Trade Turnover in Lakh
34.9
35
35.5
34.9
34.25
34
35.2
35.2
35.1
34.85
34.3
33.25
33.75
33.8
33.9
33.9
33.9
35
34
31.9

32.6
33.3
33.55
32.6
32.25
32.75
32.25
34.5
33.5
34.05
33.1
32.05
32.1
31.65
31.65
32.15
32
32.5
30.1
30.2

33.45
33.5
33.7
34.15
33.75
33.3
33
34.7
35
34.55
33.95
32.9
32.25
32.2
32.25
32.7
32.7
32.75
32.65
31.25

332
146
124
254
249
199
634
80
169
287
315
102
223
230
172
147
175
355
337
123

3.71
2.52
3.85
176.63
168.22
2.85
8.72
0.87
6.34
7.82
13.17
2.65
2.87
3.94
2.94
2.81
3.25
7.69
4.52
0.83
Conclusion:
 Over the past 3 years, Time has aggressively

expanded in 10 countries and has set up
manufacturing facilities for its industrial packaging
products in these regions.
 Time’s management is well focused; gives due

attention to innovate new products.
 Domestic packaging revenue is expecting to grow

above 16% CAGR in the next two years driven by
strong end-user demand.
 We suggest that, TTL is a good company to invest in.

It will give good returns in the future and those who
want to sell it hold the share.
Thank you.......

Equity analysis

  • 1.
    Equity Analysis Presented by-Nilima Patil Santosh Phad Vaishali Chinchore Harshada Patil Snehal Vibhandik Nilesh Sandhanshiv
  • 3.
    About Time TechnoplastLtd;  Time was Incorporated in the year 1989, started its operations as a small scale unit in Daman in 1991.  Mr. Anil Jain, Promoter and M.D of TTL.  It started its production with the manufacture of polymer drums.
  • 4.
     But nowhas a diverse product portfolio by continuously adding newer products.  It currently boasts of 46 Manufacturing facilities across 13 countries like India, the Czech Republic, Poland, UAE, China and etc.  Product offered by TTL is under five broad segments- Industrial packaging, Infrastructure products, Automotive products, Lifestyle and Healthcare products.
  • 5.
  • 6.
  • 7.
  • 8.
  • 9.
  • 10.
    Economic Analysis OfPlastic Industry
  • 11.
    • GDP rate5% • Inflation rate 1.69% • Well positioned in Industrial packing to benefit domestic end-user- 60% market share •Expected revenue to grow 18%.
  • 12.
    • Operating marginsto remain stable • Has established footprints in Asia •ROE under stress in short term •Total foreign exchange earnings- Rs. 275.30 Mn •Total foreign exchange outgo- Rs. 2507.68 Mn
  • 13.
    ECONOMIC ANALYSIS OFTIME TECHNOPLAST REVENUE CONTRIBUTIONS ARE AS FOLLOWSIndustrial packaging Infrastructure Lifestyle product product 62% 18% 20%
  • 14.
    Cont.…  Strong growthin end user industries including FMCG, chemicals, pharmaceuticals etc.  Market leader in India with 70% market share.  With 60-65% of its revenue from industrial packaging, Time continues to be the leader in the domestic market.  Time’s EBITD margin declined by ~2.6% y-o-y in FY12 to 16.2% due to (a) low capacity utilization levels of the international facilities, and (b) forex loss of Rs 130 mn due to unhedged foreign exchange payables.
  • 15.
    Cont.….. EBITD margin tostay low... FY08- 21.5% FY09- 19.9% FY10- 19.5% FY11 -18.8% FY12 - 16.2%
  • 17.
  • 18.
    Size of thePlastic Industry  In India there are about 25000 plastic processing units and about 250 plastic processing machinery manufactures.  The Machinery units supply over 2500 machineries per annum.
  • 19.
    Role of PlasticIndustry in the Indian Economy 2010 Consumption of Plastic polymer 6.7 Million Tonnes Employment in Plastic Industry 4 Millions Plastic Industry’s Turnover Rs 50,ooo Crores Export of Plastic Products US$ 2500 Millions Contribution of Polymers and Plastic Products to the Exchequer Rs. 7000 Crores Source : Indian Plastics Industry
  • 20.
    Polymer products/Industry  India’sper capita consumption of polymer is one of the lowest in the world at nearly 6kgs compared to Asia’s per capita consumption of nearly 18kgs.  United States per capita consumption is nearly 28kgs.  As India’s economy is growing at a rapid pace, the industry has ample opportunities to tap increased consumption levels.
  • 21.
    Packaging Industry:  Indianpackaging industry is currently a US$14 billion market growing at 15% p.a.  Industry is expected to double gradually in the coming years.
  • 22.
    Infrastructure:  Development ofnumerous residential, commercial & industrial project and vital infrastructures has boosted the demand for primary raw material viz. Cement, steel etc. as well as facilitating material & equipment viz. glass, plastics.  In the next five years, Government of India( GOI) estimates investments to step up to $90 billion in the infrastructure sector.
  • 23.
    Automobile Sector:  IndianAutomobile component industry valued above US$ 20 bn in terms of turnover.  Automobile sector which is currently growing at 30% is also expected to continue the growth momentum.
  • 24.
    Composition of IndianAuto Component Industry Sales 10% Engine Parts 8% Others 40% 7% Suspension & Broking Parts Equipment 12% Electrical Parts 23% Drive Transmission Source: Crisil Research
  • 25.
    Health Care:  TheIndian Healthcare Industry (i.e. health care delivery, pharmaceuticals, medical and diagnostic equipment) is estimated to be above US$ 40.2 bn in terms of revenue of which above 10% is accounted for by medical consumables viz. syringes, gloves, face masks and other disposable items. Source: E & Y Survey
  • 26.
    Competitors of TTL: Product/ Segment Industrial Packaging Key Competitors Domestic: BalmerLawrie, Van Leer, Sintex Industries. Infrastructu re Products Pipes: Jain Irrigation, Supreme Industries Lifestyle Products Highly fragmented industry with many unorganized Battery: HBL players International Power, Amara : Grief, Shutz Raja, Exide and Mauser Industries. Automotive Component s and others Highly fragmented industry with many unorganized players
  • 27.
    Peer Comparison: P/E EBITDA ROE(%) Company M Cap FY 12 FY13E FY12 FY13E FY12 FY13E Time Technoplast Ltd. 9,140 10.2 8.4 6.8 6.0 12.2 13.1 Sintex Industries Ltd. 16,762 7.6 5.1 6.0 5.2 12.15 11.95 Supreme Industries Ltd. 31,852 13.2 11.7 7.5 6.9 38.8 34.8
  • 28.
  • 29.
     To understandingthe internal working of the company and its relationship to its external environment.  Company’s Analysis can be done in - Financial Analysis - Non Financial Analysis
  • 30.
  • 31.
    Profitability Ratios:Gross Profit Ratio GPRatio 17.5 17 16.5 16 15.5 15 14.5 14 13.5 FY08 FY09 FY10 FY11 FY12
  • 32.
    Net Profit Ratio: NPRatio 16 14 12 10 8 6 4 2 0 FY08 FY09 FY10 FY11 FY12
  • 33.
    Leverage Ratio: DebtEquity Ratio Total Debt-Equity Ratio 0.7 0.6 0.5 0.4 0.3 0.2 0.1 0 FY08 FY09 FY10 FY11 FY12
  • 34.
    Asset Management Ratio: FixedAssets Turnover Ratio Fixed Asset Turnover Ratio 2 1.8 1.6 1.4 1.2 1 0.8 0.6 0.4 0.2 0 FY08 FY09 FY10 FY11 FY12
  • 35.
    Liquidity Ratio: CurrentRatio Current Ratio 4.5 4 3.5 3 2.5 2 1.5 1 0.5 0 FY08 FY09 FY10 FY11 FY12
  • 36.
  • 37.
    Market Based Ratio: Earningper share Earning Per Share 30 25 20 15 10 5 0 FY08 FY09 FY10 FY11 FY12
  • 38.
    Dividend Payout Ratio 0.135 0.13 0.125 0.12 DividendPayout Ratio 0.115 0.11 0.105 0.1 FY08 FY09 FY10 FY11 FY12
  • 39.
    Profit and LossA/c Statements Particulars FY’ 2011 FY’ 2012 Shift% Net Sales 12,775 15,321 19.92% EBITDA 2,383 2,470 3.65% Profit Before Tax 1,525 1,229 -19.41% Profit After Tax 1,169 921 -21.21% 59 23 -61.02% 1,110 898 -19.10% Minority Interest Net Profit
  • 40.
  • 41.
    Strengths:  Unique businessmodel  Association with Mauser  Wide Range of product Solutions: Reputation of “ ONE STOP SHOP”
  • 42.
    Weaknesses:  Bulk ofrevenues come from packaging: The IP division currently contributes above 65% of TTL’s revenue and the emergence of a cost- competitive substitute product could impact revenues and profits.  Profitability of International Operations
  • 43.
    Opportunities:  Spiraling Priceof metal  Bright prospects of end- user segments: Sectors like telecom, chemicals, automobiles etc. Demand for a product like batteries, high volume polymer containers, fuel/radiator tanks etc.
  • 44.
    Threats:  Entire Manufacturingcapacity is polymer based.  Elongation of working capital cycle: TTL enhances its scale of operations, the scope and duration of working capital will go up. Strains the company’s resource and leads to drop in profitability of operations.
  • 45.
  • 46.
    Content  Line Chartof Time Technoplast.  Analysis with the help of Technical Indicator.  Average Volatility of Time Technoplast.  Share Price Movement of Technoplast.  Conclusion & Prediction of Technoplast Share Prices.
  • 47.
    One Month Chartfor Time Technoplast Limited
  • 49.
    Average Volatility ofTime Technoplast Ltd Date Closing Prices Returns St. Dev 02-Sep-13 03-Sep-13 04-Sep-13 05-Sep-13 06-Sep-13 10-Sep-13 11-Sep-13 12-Sep-13 13-Sep-13 16-Sep-13 17-Sep-13 18-Sep-13 19-Sep-13 20-Sep-13 23-Sep-13 24-Sep-13 25-Sep-13 26-Sep-13 27-Sep-13 30-Sep-13 01-Oct-13 29.45 30.1 30.75 31.05 30.65 31.3 31.5 31.8 31.4 30.05 29.35 29.5 29.7 33.3 31.9 31.95 31.1 31.45 32.9 32.65 32.8 0.022071307 0.021594684 0.009756098 -0.012882448 0.021207178 0.006389776 0.00952381 -0.012578616 -0.042993631 -0.023294509 0.005110733 0.006779661 0.121212121 -0.042042042 0.001567398 -0.026604069 0.011254019 0.046104928 -0.007598784 0.004594181 -1 0.0136486 0.0125994 0.0135956 0.0227608 0.0238333 0.0207332 0.020794 0.0580061 0.0613528 0.0570542 0.057473 0.0574016 0.0589079 0.0307826 0.0240755 0.4112162 Volatility in % 6 days 21.66646 21.67% for 6 days 20.000888 21.582299 36.131663 37.834184 32.91299 33.009524 92.081771 97.394481 90.570711 91.235492 91.122294 93.513396 48.865834 38.218644 652.78556
  • 50.
    Share Price Movementof Technoplast Ltd Date Price 25-Oct-13 24-Oct-13 23-Oct-13 22-Oct-13 21-Oct-13 18-Oct-13 17-Oct-13 15-Oct-13 14-Oct-13 11-Oct-13 10-Oct-13 09-Oct-13 08-Oct-13 07-Oct-13 04-Oct-13 03-Oct-13 01-Oct-13 30-Sep-13 27-Sep-13 26-Sep-13 34.9 34.45 35.25 32.6 33.8 33.7 35.2 35.2 34.55 34.3 34 32.4 32.95 33.8 33.9 33.9 33.9 32.9 31.95 31.9 High Price Low Price Close Price No. of Trade Turnover in Lakh 34.9 35 35.5 34.9 34.25 34 35.2 35.2 35.1 34.85 34.3 33.25 33.75 33.8 33.9 33.9 33.9 35 34 31.9 32.6 33.3 33.55 32.6 32.25 32.75 32.25 34.5 33.5 34.05 33.1 32.05 32.1 31.65 31.65 32.15 32 32.5 30.1 30.2 33.45 33.5 33.7 34.15 33.75 33.3 33 34.7 35 34.55 33.95 32.9 32.25 32.2 32.25 32.7 32.7 32.75 32.65 31.25 332 146 124 254 249 199 634 80 169 287 315 102 223 230 172 147 175 355 337 123 3.71 2.52 3.85 176.63 168.22 2.85 8.72 0.87 6.34 7.82 13.17 2.65 2.87 3.94 2.94 2.81 3.25 7.69 4.52 0.83
  • 51.
    Conclusion:  Over thepast 3 years, Time has aggressively expanded in 10 countries and has set up manufacturing facilities for its industrial packaging products in these regions.  Time’s management is well focused; gives due attention to innovate new products.
  • 52.
     Domestic packagingrevenue is expecting to grow above 16% CAGR in the next two years driven by strong end-user demand.  We suggest that, TTL is a good company to invest in. It will give good returns in the future and those who want to sell it hold the share.
  • 53.