Download as PDF, PPTX
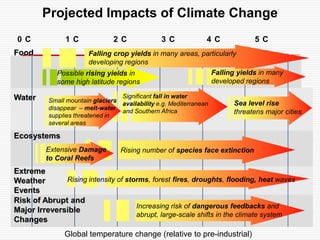
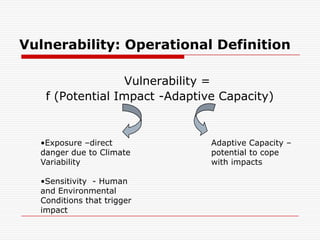


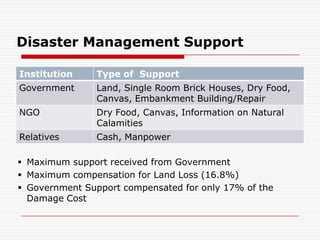


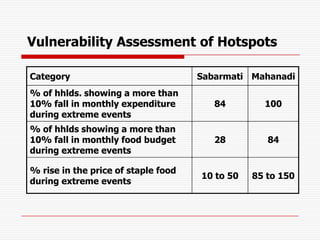
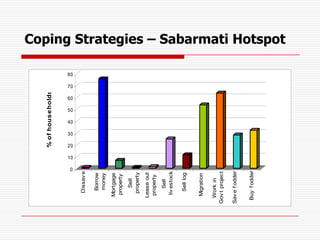

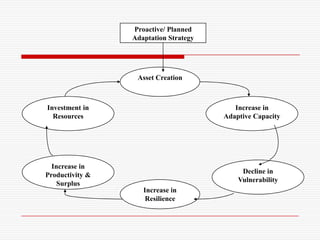


This document summarizes a presentation on the gaps between disaster management and climate change adaptation. It discusses projected impacts of climate change including effects on food supply, water resources, ecosystems and extreme weather events. It defines vulnerability and describes case studies of coastal inundation in India and drought vulnerability in three river basins. The presentation analyzes current disaster management approaches and proposes adaptation frameworks involving resilient infrastructure, capacity building and alternative to recurring disaster relief. It develops conceptual frameworks highlighting how planned adaptation can increase resilience and reduce future vulnerability through upfront investments.


