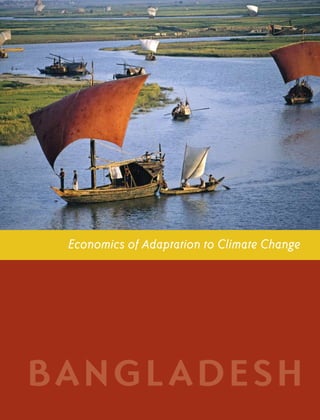
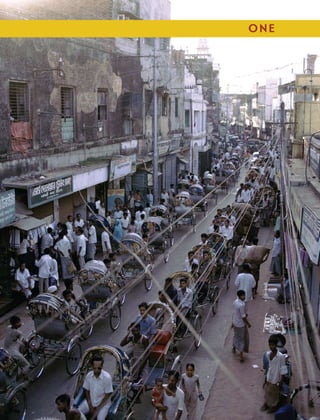
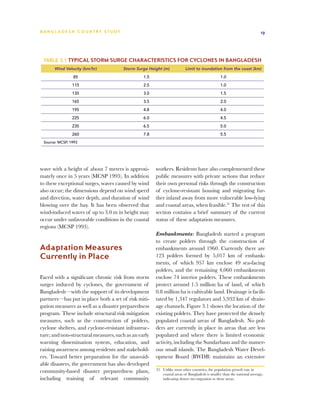
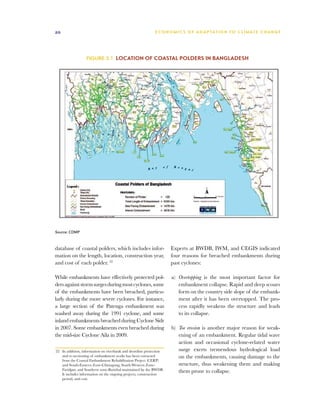
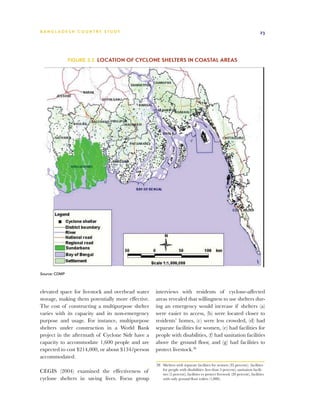
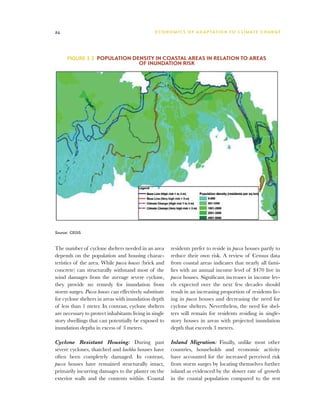
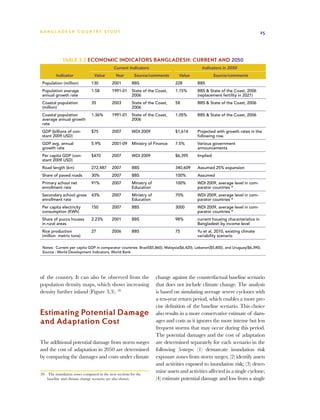
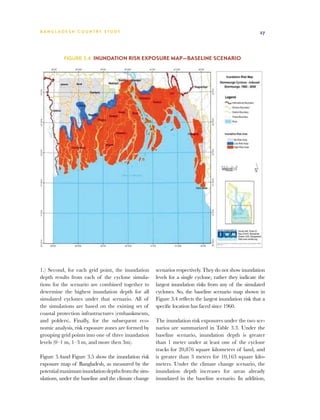
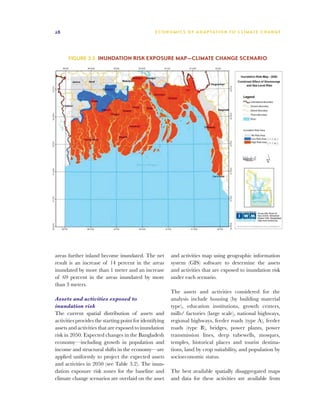
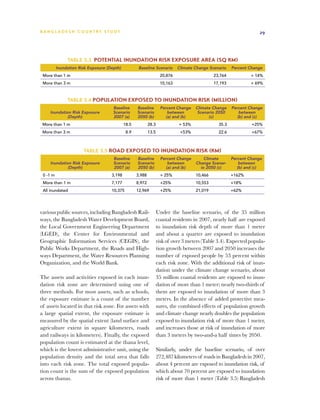
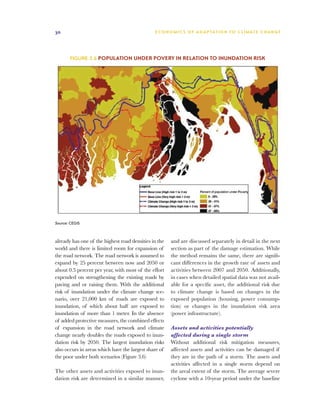
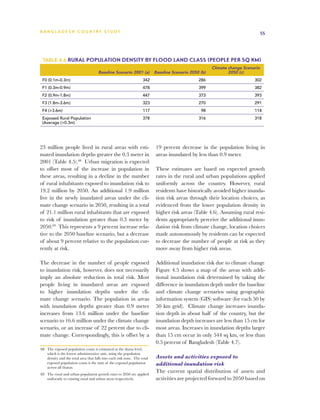
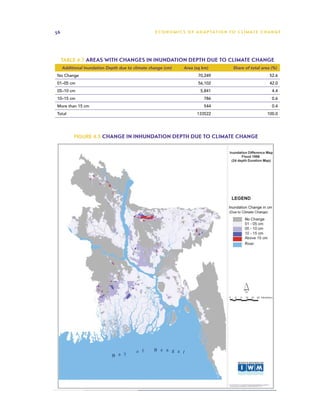
BA N G L A D E S H CO U N T RY ST U DY         i


             Economics of Adaptation to Climate Change


BANGL ADESH
ii                                         E C O N O M I C S O F A D A P TAT I O N T O C L I M AT E C H A N G E


EACC Publications and Reports

1.	 Economics of Adaptation to Climate Change: Synthesis Report
2. 	 Economics of Adaptation to Climate Change: Social Synthesis Report
3. 	 The Cost to Developing Countries of Adapting to Climate Change: New Methods
     and Estimates

Country Case Studies:
1.	 Bangladesh: Economics of Adaptation to Climate Change
2. 	 Bolivia: Adaptation to Climate Change: Vulnerability Assessment and Economic Aspects
3. 	 Ethiopia : Economics of Adaptation to Climate Change
4. 	 Ghana: Economics of Adaptation to Climate Change
5. 	 Mozambique: Economics of Adaptation to Climate Change
6. 	 Samoa: Economics of Adaptation to Climate Change
7. 	 Vietnam: Economics of Adaptation to Climate Change

Discussion Papers:
1. 	 Economics of Adaptation to Extreme Weather Events in Developing Countries
2. 	 The Costs of Adapting to Climate Change for Infrastructure
3. 	 Adaptation of Forests to Climate Change
4. 	 Costs of Agriculture Adaptation to Climate Change
5. 	 Cost of Adapting Fisheries to Climate Change
6. 	 Costs of Adaptation Related to Industrial and Municipal Water Supply and
     Riverine Flood Protection
7.	 Economics of Adaptation to Climate Change-Ecosystem Services
8. 	 Modeling the Impact of Climate Change on Global Hydrology and Water Availability
9. 	 Climate Change Scenarios and Climate Data
10. 	Economics of Coastal Zone Adaptation to Climate Change
11. 	Costs of Adapting to Climate Change for Human Health in Developing Countries
12. 	Social Dimensions of Adaptation to Climate Change in Bangladesh
13. 	Social Dimensions of Adaptation to Climate Change in Bolivia
14. 	Social Dimensions of Adaptation to Climate Change in Ethiopia
15. 	Social Dimensions of Adaptation to Climate Change in Ghana
16. 	Social Dimensions of Adaptation to Climate Change in Mozambique
17. 	Social Dimensions of Adaptation to Climate Change in Vietnam
18.	 Participatory Scenario Development Approaches for Identifying Pro-Poor Adaptation Options
19.	 Participatory Scenario Development Approaches for Pro-Poor Adaptation: Capacity
     Development Manual
BA N G L A D E S H CO U N T RY ST U DY                                   i


Economics of Adaptation
to Climate Change

BANG L ADESH


                                         Ministry of Foreign Affairs
                                         Government of the Netherlands
ii                                                       E C O N O M I C S O F A D A P TAT I O N T O C L I M AT E C H A N G E


© 2010 The World Bank Group
1818 H Street, NW
Washington, DC 20433
Telephone: 202-473-1000
Internet: www.worldbank.org
E-mail: feedback@worldbank.org


All rights reserved.


This volume is a product of the World Bank Group. The World Bank Group does not guarantee the accuracy of the data
included in this work. The boundaries, colors, denominations, and other information shown on any map in this work do not
imply any judgment on the part of the World Bank Group concerning the legal status of any territory or the endorsement or
acceptance of such boundaries.


RIGHTS AND PERMISSIONS


The material in this publication is copyrighted. Copying and/or transmitting portions or all of this work without permission
may be a violation of applicable law. The World Bank Group encourages dissemination of its work and will normally grant
permission to reproduce portions of the work promptly.


For permission to photocopy or reprint any part of this work, please send a request with complete information to the Copyright
Clearance Center Inc., 222 Rosewood Drive, Danvers, MA 01923, USA; telephone 978-750-8400; fax 978-750-4470;
Internet: www.copyright.com.


All images © The World Bank Photo Library except
Front Cover © National Geographic
BA N G L A D E S H CO U N T RY ST U DY                               iii


Contents


Acronyms		                                                        vii
Acknowledgments	                                                   ix

Executive Summary	                                                 xi
Climate hazards: a risk to achieving development objectives	        xi
Adaptation essential for development	                              xii
Objectives and scope of study	                                    xiii
Results		                                                          xv
Lessons and recommendations	                                       xx

1 Introduction	                                                      1
Motivation and context for the EACC study	                          1
Context for the Bangladesh case study	                              1
Climate change and Bangladesh	                                      4
Scope of this report	                                               4

2 Existing Climate Variability and Climate Change	                  7
Existing climate variability	                                      7
Climate change	                                                   10

3 Tropical Cyclones and Storm Surges	                              17
Historical vulnerability to tropical cyclones and storm surges	   18
Adaptation measures currently in place	                           19
Estimating potential damage and adaptation cost	                  25
Implications for Adaptation Strategy	                             42

4 Inland Flooding	                                                47
Historical Vulnerability of Inland Flooding	                      47
Estimating adaptation cost	                                       50
Implications for adaptation strategy	                             63
iv                                          E C O N O M I C S O F A D A P TAT I O N T O C L I M AT E C H A N G E


5 Agriculture and Food Security	                                                                          67
Background	                                                                                               67
Projected future climatic conditions	                                                                     68
Direct impacts on agriculture	                                                                            69
Economy-wide impacts and responses	                                                                       73
Implications for adaptation strategy	                                                                     75

6 Local Perspectives on Adaptation	                                                                       79
Background	                                                                                               79
Overview of hotspots	                                                                                     79
Vulnerability to Climate Change	                                                                          82
Adaptation practices	                                                                                     83
Preferred Adaptation Options	                                                                             85
Implications for adaptation strategy	                                                                     86

7 Limitations of the Study	                                                                              89

8 Summary of Findings	                                                                                    93

References	                                                                                             100


Annexes	(available on line at www.worldbank.org/eacc)

Annex 1. Major cyclones crossing Bangladesh coast (1960–2009)	
Annex 2. Tracks for major cyclones that crossed the Bangladesh coast, 1960–2009	
Annex 3. Cyclone Tracks used to simulate inundation risk under the Climate Change Scenario	
Annex 4. Description of Cyclone and Bay of Bengal Model	
Annex 5. Polders Likely to be overtopped in the Baseline and Climate Change Scenarios	
Annex 6. Estimated cost to prevent overtopping of embankments by 2050	
Annex 7. Earthwork Computation with an illustrative Example	
Annex 8. Determining additional vents required to reduce drainage congestion in coastal polders	
Annex 9. Floods in Bangladesh	
Annex 10. Spatial Vulnerability of Bangladesh to various types of floods	
Annex 11. Classification of floods in Bangladesh	
Annex 12. Flood-affected areas in Bangladesh, 1954–2007	
Annex 13. Chronology of above normal floods in Bangladesh	
Annex 14. Damages from major floods in Bangladesh	
Annex 15. Models used for flood hydrology	
Annex 16. Social component methodology
BA N G L A D E S H CO U N T RY ST U DY                                                              v


Tables

Table ES.1	Scope of study in the context of programs and activities included in the 	            xiv	
	           Bangladesh Climate Change Strategy and Action Plan	
Table ES.2	Cost of adapting to tropical cyclones and storm surges by 2050 ($ millions)	          xvi
Table ES.3	Total adaption cost for inland flooding by 2050 ($ millions)	                        xvii
Table 2.1	 Peak discharge and timing during extreme flood years	                                   8
Table 2.2	 Water level trends at different stations along the coastline	                           9
Table 2.3	 Estimated average change (%) in discharge	                                             12
Table 2.4	 Sea level rise impacts on flood land types	                                            15
Table 3.1	 Typical storm surge characteristics for cyclones in Bangladesh	                        19
Table 3.2	 Economic indicators Bangladesh: Current and 2050	                                      25
Table 3.3	 Potential Inundation Risk Exposure Area (sq km)	                                       29
Table 3.4	 Population exposed to inundation risk (million)	                                       29
Table 3.5	 Road exposed to inundation risk (km)	                                                  29
Table 3.6	 Area affected in a single cyclone with a 10-year return period (sq km)	                31
Table 3.7	 Population affected in a single cyclone with a 10-year return period (millions)	       31
Table 3.8	 Roads affected in a single cyclone with a 10-year return period (km)	                  31
Table 3.9	 Damages and losses during a single Super cyclonic storm by economic sector	            32
Table 3.10	 Cropped area exposed to inundation risk in the baseline and 	                         34
	           climate change scenarios (ha)	
Table 3.11	 Damages and losses from Cyclone Sidr (2007) by economic sector	                       37
Table 3.12	 Additional damages and losses due to climate change in 2050	                          37
Table 3.13	 Estimated cost for height enhancement of coastal polders ($ millions)	                40
Table 3.14	 Cost to increase geographic precision of cyclone and surge warnings	                  43
Table 3.15	 Cost of adapting to climate change by 2050 ($ millions)	                              43
Table 3.16	 Sequencing of adaption options for tropical cyclones/storm surges	                    44
Table 4.1	 Flood classification in Bangladesh	                                                    48
Table 4.2	 Impacts and losses for recent exceptional or catastrophic floods	                      48
Table 4.3	 Growth trends in total GDP and agricultural GDP in relation to major flood events	 51
Table 4.4	 Flood land classes (based on 24 hour duration inundation)	                             54
Table 4.5	 Rural Population Exposed to Inundation risk	                                           54
Table 4.6	 Rural population density by flood land class (people per sq km)	                       55
Table 4.7	 Areas with changes in inundation depth due to climate change	                          56
Table 4.8	 Length of road by type at additional inundation risk from climate change in 2050 (km)	 58
Table 4.9	 Adaptation cost for roads by type of road (Tk millions)	                               59
Table 4.10	 Railway track at risk of additional inundation due to climate change by 2050 (km)	 59
Table 4.11	 Cost per kilometer to raise different railway tracks upto 0.5 meters ($/km)	          60
Table 4.12	 Cost of earthwork ($ per km) by type of rail track and inundation depth (m)	          60
Table 4.13	 Adaptation cost for railways ($ millions)	                                            60
Table 4.14	 Embankments exposed to additional inundation risk due to climate change (km)	         60
Table 4.15	 Itemized cost for raising embankments ($ millions)	                                   61
Table 4.16	 Total adaption cost for inland flooding ($ millions)	                                 64
Table 6.1	 Location of eight hotspots selected for based of hazard	                               81
vi                                           E C O N O M I C S O F A D A P TAT I O N T O C L I M AT E C H A N G E


Figures

Figure 1.1	 Poverty and climate hazards	                                                            3
Figure 2.1	 Annual and seasonal (mm) precipitation averaged across meteorological stations by year	 8
Figure 2.2	 Monthly, annual, and seasonal temperature changes	                                    10
Figure 2.3	 Monthly, annual, and seasonal precipitation changes	                                  10
Figure 2.4	 Total change in national flooded area for 2050 in the A2 and B1 scenarios	            13
Figure 3.1	 Location of coastal polders in Bangladesh	                                            20
Figure 3.2	 Location of cyclone shelters in coastal areas	                                        23
Figure 3.3	 Population density in coastal areas in relation to areas of inundation risk	          24
Figure 3.4	 Inundation risk exposure map—baseline scenario	                                       27
Figure 3.5	 Inundation risk exposure map—climate change scenario	                                 28
Figure 3.6	 Population under povery in relation to inundation risk	                               30
Figure 3.7	 Location of overtopped polders	                                                       38
Figure 4.1	 Extent of above-normal flooding in Bangladesh, 1950–2009	                             49
Figure 4.2	 Growth trends in total GDP and agricultural GDP in relation to major flood events	 49
Figure 4.3	 Flood map – 24 Hour Duration Flood (baseline scenario)	                               52
Figure 4.4	 Flood map – 24 Hour Duration Flood (climate change scenario)	                         53
Figure 4.5	 Change in inhundation depth due to climate change	                                    56
Figure 5.1	 Percentage change in national potential production due to temperature,
	           precipitation, and CO2	                                                               70
Figure 5.2	 Percentage change in national potential production from flood damages only	           71
Figure 5.3	 Percentage change in national potential production combined effects	                  72
Figure 5.4	 National rice production (Metric tons) 	                                              73
Figure 5.5	 Share of discounted GDP	                                                              73
Figure 5.6	 Net revenues and overall social preference of adaption measures	                      77
Figure 6.1	 Poverty and climate hazards	                                                          80
Figure 6.2	 Map of Bangladesh showing the eight hotspots	                                         81
Figure 6.3	 Livelihood capital assets in eight hotspots	                                          83
BA N G L A D E S H CO U N T RY ST U DY                                                               vii


Acronyms


AR4	   Fourth Assessment Report                    IWM	         Institute of Water Modeling
BARI 	 Bangladesh Agricultural Research            MJO	         Madden-Julien Oscillation
BBS	   Bangladesh Bureau of Statistics             MSL	         Mean sea level
BCAS	  Bangladesh Center for Advanced Studies      NCA	         Net cultivable area
BMD	   Bangladesh Meteorology Department           NGO	         Nongovernmental organization
BRRI	  Bangladesh Rice Research Institute          RCM	         Regional climate model
CEGIS	 Center for Environmental and Geographic     SRTM	        Shuttle Radar Topography Mission
       Information Services                        TAR	         Third Assessment Report
CGE	   Computable general equilibrium              TRMM	        Tropical Rainfall Measurement Mission
CO2	   Carbon dioxide                              USGS	        United States Geologic Survey
DAE	   Department of Agriculture Extension
DEM	   Digital elevation model
DSSAT	 Decision support system for                 UNITS OF MEASURE
       agro-technology transfer                    ac 	   acres
ENSO	 El Nino-Southern Oscillation                 ha 	   hectares
FAO	   Food and Agriculture Organization of the    kg 	   kilograms
       United Nations                              MT 	   metric tons
FCDI	  Flood control and drainage infrastructure
FFWC	 Flood Forecast and Warning Center
GBM	   Ganges-Brahmaputra-Meghna                   CURRENCY EQUIVALENTS
GCM	   Global circulation (or climate) model       US $1.00 = Tk 70.00
GDP	   Gross domestic product                      (unless otherwise noted, all dollars are U.S. dollars)
GOB	   Government of Bangladesh
GTOPO	 Global topography                           FISCAL YEAR (FY) July 1–June 30
HYV	   High-yielding variety
IFPRI	 International Food Policy Research
       Institute
IMD	   Indian Meteorological Department
IPCC	  Intergovernmental Panel on Climate
       Change
viii   E C O N O M I C S O F A D A P TAT I O N T O C L I M AT E C H A N G E
BA N G L A D E S H CO U N T RY ST U DY                                                                 ix


Acknowledgments


The EACC study has been conducted as a partner-      Fankhauser, Ravi Kanbur, and Joel Smith; and
ship among the World Bank, which led its technical   to the study’s peer reviewers, Proditpo Gosh,
aspects; the governments of the United Kingdom,      Michael Steen Jacobsen, Ravi Kanbur, Sanjay
Netherlands, and Switzerland, which provided fund-   Kathuria, Lalita Moorty, and David Wheeler.
ing; and the participating case study countries.
                                                     Numerous comments and suggestions were also
This report has been prepared by a team led by       received from a large number of colleagues
Kiran Pandey (Coordinator EACC country stud-         during the course of the study, and the team is
ies) and comprising Susmita Dasgupta, Anne           thankful to all of them. From the World Bank,
Kuriakose, Khawaja M. Minnatullah, Winston           they include Ian Noble, Apurva Sanghi, and
Yu, Nilufar Ahmad (former TTL), and Shakil           Maria Sarraf. From outside the Bank, they
Ferdausi (World Bank), Mainul Huq, Zahirul Huq       include Gordon Hughes, Robert Schneider, Joel
Khan, Manjur Murshed Zahid Ahmed, Ainun              Smith and James Thurlow. The team is also
Nishat, Malik Fida Khan, Nandan Mukherjee,           grateful for the timely feedback by participants
M. Asaduzzaman, S. M. Zulfiqar Ali, and Iqbal        in three consultations in Dhaka—held in May
Alam Khan (consultants). The team was sup-           2009, November 2009, and May 2010—and
ported by Janet Bably Halder, Angie Harney, and      two case study workshops in Washington in June
Hawanty Page.                                        2009 and January 2010.

The study team is grateful for the general guid-     We would also like to thank Robert Livernash for
ance of Sergio Margulis (TTL) of the Economics       editorial services, Jim Cantrell for editorial input
of Adaptation to Climate Change (EACC) proj-         and production coordination, and Hugo Mansilla
ect. EACC includes a global track and six other      for editorial and production support.
country cases studies. The EACC team also ben-
efited from ongoing interaction with the Environ-    The study team is also grateful for the financial
ment Department’s management, particularly           support provided by the partners of the EACC
James Warren Evans and Michelle de Nevers.           study, the governments of the United King-
                                                     dom, Netherlands, and Switzerland and the
The team is grateful to the advisory committee       government of the Bangladesh for facilitating
for the overall EACC study, comprising Sam           the study.
x   E C O N O M I C S O F A D A P TAT I O N T O C L I M AT E C H A N G E
BA N G L A D E S H CO U N T RY ST U DY                                                                 xi


Executive Summary


Climate Hazards:                                      rural poor in low-lying coastal areas are also dev-
A Risk to Achieving                                   astated by saline water intrusion into aquifers and
                                                      groundwater and land submergence. In addition,
Development Objectives                                seasonal droughts occasionally hit the northwest-
                                                      ern region.
Bangladesh is one of the most vulnerable
countries in the world to climate risks.              Investments during the past 50 years have
Two-thirds of the nation is less than 5 meters        increased the resilience of Bangladesh to
above sea level and is susceptible to river and       climate-related hazards. Since the sixties,
rainwater flooding, particularly during the mon-      the government of Bangladesh has invested $10
soon. Due to its location at the tail end of the      billion on structural (polders, cyclone shelters,
delta formed by the Ganges, Brahmaputra, and          cyclone-resistant housing) and non-structural
Meghna (GBM) rivers, the timing, location, and        (early warning and awareness raising systems)
extent of flooding depends on the precipitation in    disaster reduction measures and enhanced its
the entire GBM basin, not just on the 7 percent       disaster preparedness systems. These investments
of the basin that lies within the country. Nearly     have significantly reduced damages and losses
80 percent of the country’s annual precipita-         from extreme climatic events over time, especially
tion occurs during the summer monsoon season,         in terms of deaths and injuries. In addition, rural
when these rivers have a combined peak flow of        households have adapted their farming systems
180,000 m3/sec, the second highest in the world.      to the “normal floods” that typically inundate
Once every three to five years, up to two-thirds      about a quarter of the country by switching from
of Bangladesh is inundated by floods that cause       low-yielding deepwater rice to high-yielding rice
substantial damage to infrastructure, housing,        crops. As a result, agricultural production has
agriculture, and livelihoods. Low-lying coastal       actually risen over the past few decades. Rising
areas are also at risk from tidal floods and severe   incomes have also enabled an increasing propor-
cyclones. On average once every three years, a        tion of households to live in homes that are more
severe cyclone makes landfall on the Bangladesh       resilient to cyclones, storm surges, and floods.
coastline, either before or after the monsoon, cre-
ating storm surges that are sometimes in excess       Despite the increased resilience, climate-
of 10 meters. Crops and the livelihoods of the        related disasters continue to result in
xii                                              E C O N O M I C S O F A D A P TAT I O N T O C L I M AT E C H A N G E


large economic losses — reducing eco-                    originating in the Bay of Bengal are also expected
nomic growth and slowing progress in                     to occur more frequently as a result of warmer
reducing poverty. The 1998 monsoon flood                 ocean surface temperatures. Cyclone-induced
inundated over two- thirds of Bangladesh and             storm surges are further exacerbated by a poten-
resulted in damages and losses of over $2 billion,       tial rise in sea level of over 27 cm by 2050. Most
or 4.8 percent of GDP. The losses were evenly            GCMs predict precipitation increases of up to 20
split among agriculture, infrastructure, and indus-      percent during July, August, and September for
try/commerce. Similarly, Cyclone Sidr resulted in        the GBM basin. As a result, median discharges
damages and losses of $1.7 billion, or 2.6 percent       in the three rivers during the summer months are
of GDP in 2007. About half the losses were in the        expected to increase between 6 and 18 percent by
housing sector, followed by agriculture and infra-       the 2050s. Unlike temperature changes, the pre-
structure. When averaged over the past decade,           dicted changes in precipitation (and discharges)
the direct annual costs from natural disasters to        through 2050 are not distinct from the historically
the national economy—in terms of damages to              observed variability for all months and seasons,
infrastructure and livelihoods and losses from           reflecting the large variability in precipitation
forgone production—have been estimated at 0.5            levels historically and even larger uncertainty in
percent to 1 percent of GDP. These statistics do         future precipitation predictions.
not include the significant loss of life that has also
occurred during these events. These damages
and losses are geographically concentrated in            Adaptation Essential
areas that also have higher concentrations of the        for Development
poor, affecting them disproportionately. They live
in thatch or tin houses that are more susceptible
to direct damages from cyclones, storm surges,           The Bangladesh Climate Change Strat-
and floods. Additionally, most rural households          egy and Action Plan, adopted by the gov-
depend on weather-sensitive sectors—agricul-             ernment of Bangladesh in 2009, seeks to
ture, fisheries, and other natural resources—for         guide activities and programs related to
their livelihood. Destruction of their assets and        climate change in Bangladesh. Until the
livelihoods leaves the poor with a limited capacity      past few years, climatic risks have been poorly
to recover.                                              reflected in national policies and programs Ban-
                                                         gladesh. The country launched the National
A warmer and wetter future climate that                  Adaptation Program of Action (NAPA) in 2005,
goes beyond historical variations will                   which identified 15 priority activities that were
exacerbate the existing climatic risks                   subsequently updated to 45 programs in 2009.
and increase vulnerability by increasing                 The first sectoral policy to explicitly include cli-
the extent and depth of inundation from                  mate change impacts and actions—the Coastal
flooding and storm surges and by reduc-                  Zone Policy—was adopted in 2005. Climate
ing arable land due to sea level rise and                change has been a key concern in the redraft-
salinity intrusion. The median predictions               ing of the National Water Management Plan
from the general circulation models (GCMs) are           (NWMP). Recognizing that a wide range of poli-
for Bangladesh to be 1.5°C warmer and 4 percent          cies have the potential to address climate-related
wetter by the 2050s. The median temperature              hazards and vulnerability, the government devel-
predictions exceed the 90th percentile of his-           oped and adopted through a consultative pro-
torical variability across GCMs for July, August,        cess the Bangladesh Climate Change Strategy
and September by the 2030s. Severe cyclones              and Action Plan 2009 to guide economywide
BA N G L A D E S H CO U N T RY ST U DY                                                                 xiii


efforts to adapt to climate change and to miti-          Objectives and Scope
gate greenhouse gases. It identifies three climate
hazards—tropical cyclones/storm surges, inland
                                                         of Study
flooding, and droughts. The strategy contains
44 programs formulated around six themes—                The objective of this study is to help
food security/social protection/health, com-             decision makers in Bangladesh to better
prehensive disaster management, infrastructure,          understand and assess the risks posed
research/knowledge management, mitigation/               by climate change and to better design
low carbon development, and capacity build-              strategies to adapt to climate change. The
ing/institutional strengthening (see Table ES.1).        study takes as its starting point the BCCSAP. It
Thirty-four programs listed under five themes            builds upon and strengthens the analytical mod-
are wholly or partially focused on adaptation.           els and quantitative assessment tools already
The BCCSAP includes an implementation time-              in use in Bangladesh in support of the research
frame for the 44 identified programs and is esti-        and knowledge management theme of BCCSAP.
mated to require $500 million in the first two           These tools are used to (a) examine the potential
years and about $5 billion in the first five years for   physical impacts of climate change; (b) assess the
full implementation. The government allocated            associated damages and losses in key economic
$100 million of its own resources in FY 2009–10          sectors, on vulnerable populations, and in the
and has budgeted $100 million in FY2010–11               overall economy; (c) estimate spatially disaggre-
toward actions contained in the strategy; it is          gated costs of adaptation options that can reduce
actively seeking additional resources to imple-          these impacts; and (d) sequence the adaptation
ment the full strategy.                                  actions over time.

In a fiscally constrained environment,                   The scope of this study is more limited
sequencing of adaptation actions is a                    than the BCCSAP, so the reported costs
necessity, particularly given the large                  represent a lower bound on the total adap-
uncertainties about the magnitude and                    tation costs in Bangladesh. As highlighted in
timing of the added risks from climate                   Table ES.1, this study encompasses about 21 of
change. The fundamental problem of policy                the identified adaptation actions, of which 11 are
making in the face of climate change is one of           examined quantitatively as well. Some important
uncertainty with regard to climate outcomes.             and likely expensive adaptation activities that
Shifting resources toward more productive uses           have not been included in this study are urban
and away from less productive ones in the context        drainage, river training works, dredging and
of uncertainty is already a principal aim of devel-      desiltation, and protection of ecosystems.
opment for a fiscally constrained government.
Climate change makes this task more complex.             The study was developed in four discrete
Uncertainty has important effects in any assess-         and somewhat independent components
ment of the impacts of climate change and on             with varying degrees of analytical depth
the selection and ranking of adaptation actions.         and quantification. When feasible, common
These include prioritizing adaptation actions with       assumptions and similar methodologies were used
more certain outcomes with the greatest near-            to increase comparability and cohesion among
term benefits, while also investing to develop the       the components. The first two components of
information base that can reduce the uncertain-          the study focus on two of the hazards identified
ties and guide the evolution of adaptation actions       in the BCCSAP—tropical cyclones/storm surges
over time.                                               and inland flooding. They assess the added risk
xiv                                                    E C O N O M I C S O F A D A P TAT I O N T O C L I M AT E C H A N G E


         Table ES.1 Scope of study in the context of programs and activities included
                       in the Bangladesh Climate Change Strategy and Action Plan*
    Theme                       Immediate                                   Short Term                          Medium to Long Term
Food,                                                         Water and sanitation program in          Institutional capacity and research
security,                                                     climate vulnerable areas                 towards climate-resilient cultivars and
social                                                                                                 their dissemination
                                                              Livelihood protection in
protection and
                                                              ecologically fragile areas               Development of climate-resilient
health
                                                                                                       cropping systems
                                                              Livelihood protection of
                                                              vulnerable socioeconomic groups          Adaptation against drought, salinity
                                                              (including women)                        submergence and heat
                                                                                                       Adaptation in fisheries sector
                                                                                                       Adaptation in livestock sector
                                                                                                       Adaptation in health sector
Comprehensive     Improvement of floods forecasting                                                    Risk management against loss of
disaster          and early warning system                                                             income and property
management
                  Improvement of cyclone and storm-
                  surge warning
                  Awareness raising and public educa-
                  tion towards climate resilience
Infrastructure    Repair and maintenance of existing          Planning, design, and implementation     Repair and maintenance of existing
                  flood embankments                           of resuscitation of networks of rivers   coastal polders
                                                              and khals through
                  Repair and maintenance of existing                                                   Improvement of urban drainage
                                                              dredging and de-siltation work
                  cyclone shelter
                                                                                                       Adaptation against floods
                                                                                                       Adaptation against future cyclones
                                                                                                       and storm-surges
                                                                                                       Planning, design, and construction of
                                                                                                       river training works
Research, and     Establishment of a center for research,     Preparatory studies for adaptation       Monitoring of ecosystem and
knowledge         knowledge management, and training          against sea level rise (SLR) and its     biodiversity changes and their impacts
management        climate change                              impacts
                                                                                                       Macroeconomic and sectoral
                  Climate change modeling at national                                                  economic impacts of CC
                  and sub-national levels
                                                                                                       Monitoring of internal and external
                                                                                                       migration of adversely impacted popu-
                                                                                                       lation and providing support to them
                                                                                                       through capacity building for their
                                                                                                       rehabilitation in new environment
                                                                                                       Monitoring of impact on various issues
                                                                                                       related to management of tourism in
                                                                                                       Bangladesh and implementation of
                                                                                                       priority action plan
Mitigation and    Renewable energy development                Rapid expansion of energy saving         Improved energy efficiency in produc-
low carbon                                                    devices e.g. (CFL)                       tion and consumption of energy
                  Management of urban waste
development
                                                              Improving in energy consumption          Gas exploration and reservoir
                  Afforestation and reforestation
                                                              pattern in transport sector and          management
                  programme
                                                              options for mitigation
                                                                                                       Development of coal mines and coal-
                                                                                                       fired power station(s)
                                                                                                       Lower emissions from agricultural land
                                                                                                       Energy and water efficiency in built
                                                                                                       environment
Capacity          Revision of sectoral policies for climate   Strengthening human resource
building and      resilience                                  capacity
institutional
                  Mainstreaming climate change in             Strengthening gender consideration in
strengthening
                  national, sectoral and spatial develop-     climate change management
                  ment programs
                  Strengthening institutional capacity for
                  climate change management
                  Mainstreaming climate change in
                  the media
* Quantitative and Quantitative Analysis, Qualitative Analysis only, Not covered
BA N G L A D E S H CO U N T RY ST U DY                                                                    xv


of these hazards due to climate change relative        all 19 severe cyclones that have made landfall
to the existing risks, identify specific assets and    in Bangladesh during the past 50 years indicate
activities that are at risk, and estimate the cost     that they would overtop 43 of the existing pol-
of adaptation actions to protect against these         ders. Further, super-cyclonic storms (with winds
risks. Sequencing of these actions is facilitated by   greater than 220 km/hr) have a return period of
detailed spatially disaggregated identification of     around 10 years; currently, a single such storm
adaptation options and associated cost estimates.      would result in damages and losses averaging 2.4
In addition, the future economic damages from          percent of GDP. Climate change is expected to
a single super cyclonic event are also estimated,      increase the severity of cyclones and the surges
both with current risks and with the added risks       they induce by 2050. When combined with an
from climate change to provide a point of refer-       expected rise in sea level, cyclone-induced storm
ence for comparing the cost of adapting to this        surges are projected to inundate an additional 15
risk. The third component of the study focuses         percent of the coastal area. The depth of inun-
on both the direct and economy-wide impacts            dation is also expected to increase. While eco-
of climate change on agriculture and food secu-        nomic expansion is expected to expose additional
rity from a full range of climate risks, includ-       assets to inundation risk by 2050, expected struc-
ing droughts (the third hazard identified in the       tural shifts in the economy away from climate-
BCCSAP), floods, sea level rise, warmer tempera-       sensitive sectors, increases in urbanization, and
tures, and increased CO2 concentrations. While a       greater affordability of cyclone-resilient housing
full set of adaptation options and the public sector   is expected to limit the damages and losses from
costs to address these impacts are not quantita-       a single severe storm in 2050 to around $9.2 bil-
tively analyzed, the relative desirability of trans-   lion, or 0.6 percent of GDP. About half of these
ferring existing coping strategies to newly affected   damages and losses would occur even without the
areas is examined. The final component provides        added risks from climate change, so the incremen-
local perspectives on adaptation as seen by the        tal damages from the added risk from a changing
poor and most vulnerable population. It exam-          climate are around $4.6 billion.
ines the determinants of the adaptive capacity of
the vulnerable populations and solicits from local,    Adaptation. Existing investments, which have
regional and national stakeholders—through the         reduced the impacts of cyclone-induced storm
use of participatory scenarios—the types of pub-       surges, provide a solid foundation upon which to
lic support that would best enable the vulnerable      undertake additional measures to reduce potential
population to cope with potential climate change       damages now and in the future. However, these
impacts.                                               investments are not sufficient to address the exist-
                                                       ing risks, much less the future risk from climate
                                                       change. By 2050, total investments of $5,516 mil-
Results                                                lion and $112 million in annual recurrent costs
                                                       will be needed to protect against storm surge risk,
The impacts of climate change and adaptation           including that from climate change (Table ES.2).
options analyzed and the cost of these options from
each study component are summarized below.             Of this, strengthening 43 polders against existing
                                                       risks requires investments of $2,462 million and
(1) Tropical cyclones and storm surges                 annual recurrent costs of $49 million. Even if the
Impacts. The risk from cyclones and the storm          numerous cyclone shelter construction programs
surges they induce spans the entire Bangladesh         provide sufficient capacity to protect all current
coastline. Most of it is currently protected by 123    coastal area residents in at-risk areas, an additional
polders constructed since the 1960s. Analyses of       2,930 shelters will need to be constructed by 2050
xvi                                                   E C O N O M I C S O F A D A P TAT I O N T O C L I M AT E C H A N G E


         Table ES.2 Cost of adapting to tropical cyclones and storm surges
                                           by 2050 ($ millions)
                                                                                                    CC Scenario
                             Baseline Scenario                 (additional risk due                 (total risk=
                              (existing risks)                        to CC)                       existing + CC)
  Adaptation Option           IC          ARC                    IC           ARC                  IC          ARC
 Polders                      2,462              49                   893             18            3,355            67
 Afforestation                                                         75                               75
 Cyclone shelters                  628           13               1,219               24            1,847            37
 Resistant housing                                                    200                               200
 Early warning system                                                  39              8                 39           8
 Total                        3,090              62               2,426               50            5,516           112
 CC = climate change; IC = investment cost; ARC = annual recurrent cost


at an estimated cost of $628 million to accommo-              even under current risks, and (c) upgrading the
date the expected population growth in coastal                spatial and temporal resolution of forecasting and
areas even under existing risk. Design innovations            early warning systems. These actions should be
and targeted subsidies can reduce the private cost            accompanied by research to improve knowledge
of cyclone-resistant housing and hence the need               about the timing and spatial distribution of added
for an even larger number of shelters.                        risks from climate change, which can guide the
                                                              pace of additional adaptation efforts.
Protecting against the added risks from climate
change will require further strengthening of 59               (2) Inland monsoon flooding
polders; afforesting sea-facing polders to reduce             Impacts. Bangladesh has been incurring signifi-
the hydraulic load of storm surges; constructing              cant damages in terms of crop losses, destruction
5,702 additional cyclone shelters; providing incen-           of roads and other infrastructure, disruption to
tives to increase affordability of cyclone resistant          industry and commerce, and injuries and losses
housing; improving the spatial and temporal reso-             in human lives from severe inland monsoon
lution of forecasting and early warning systems;              floods once every three to five years. The 1998
and expanding disaster preparedness programs                  flood inundated over two-thirds of Bangladesh
in 19 additional districts. These additional mea-             and resulted in damages and losses of over $2 bil-
sures are expected to require an additional $2,426            lion, or 4.8 percent of GDP. Increased monsoon
million in investments and $50 million in annual              precipitation, higher transboundary water flows,
recurrent costs.                                              and rising sea levels resulting from climate change
                                                              are expected to increase the depth and extent of
Recognizing the uncertainties in the timing and               inundation. The impacts of climate change are
magnitude of the added risks from climate change,             measured by comparing the inundation levels
a prudent strategy would begin by addressing the              predicted by simulations using the MIROC 3.2
existing risks that current coastal residents face            Global Circulation Model predictions under the
through (a) continued support for the construction            A2 emission scenario (this simulation predicts the
of an adequate number of multipurpose shelters                largest increase in runoff) with the inundation lev-
to protect the current populations from the exist-            els in the 1998 floods. Climate change places an
ing risks, (b) upgrading and strengthening 43 exist-          additional 4 percent of land area at risk of inunda-
ing polders that are at risk of being overtopped              tion. Further, inundation depth increases in most
BA N G L A D E S H CO U N T RY ST U DY                                                                   xvii


areas currently at risk, with increases greater than   ES.3). The full cost of protection in 2050 will also
15 cm in about 544 km2, or 0.4 percent of the          require addressing the existing risks of flooding,
country. These are underestimates of the actual        which are likely to be of the same of order of
increased risk from climate change, as they do not     magnitude. Recognizing the uncertainties in the
account for the frequent river course changes.         timing and magnitude of the added risks from cli-
The total inundation risks in 2050 are actually        mate change, a prudent strategy would begin by
substantial, considering the increased risks are       addressing the existing risks of monsoon flooding
measured relative to the 1998 flood. Despite           together with research on improving the temporal
the higher risks, the rural population exposed         and spatial resolution of flood predictions, which
to flooding, however, is expected to decline from      can guide additional actions.
current levels due to the rural-to-urban migration
that is projected to occur by 2050.                    3) Agriculture and food security
                                                       Impacts. The combined effects of rising tempera-
Adaptation. Rural households have adapted their        tures, higher precipitation, CO2 fertilization,
farming systems to the “normal floods” that typi-      severe flooding, occasional seasonal droughts, and
cally inundate about a quarter of the country          loss of arable land in coastal areas resulting from
every year by switching to high-yielding rice crops    climate change are expected to result in declines
instead of low-yielding deepwater rice. As a result,   in rice production of 3.9 percent each year, or a
agricultural production has actually risen over        cumulative total of 80 million tons over 2005–50.
the past few decades. High-magnitude, low-fre-         Overall, climate change is expected to decrease
quency floods such as the 1998 floods, however, do     agricultural GDP by 3.1 percent each year—a
result in significant damages. The cost of protect-    cumulative $36 billion in lost value-added—dur-
ing against the existing risks of severe monsoon       ing 2005–50. The economic losses increase by
flooding was not estimated largely because of data     threefold—to a cumulative $129 billion—when
limitations. The additional cost to protect (a) road   the indirect impacts on complementary industries
networks and railways, (b) river embankments to        and the dynamic effects on asset formation and
protect highly productive agricultural lands, (c)      productivity growth are included. This is equiva-
drainage systems, and (d) erosion control measures     lent to an average of $2.9 billion per year—and
for high-value assets such as towns against the        as high as $5.1 billion per year under more pes-
higher inundation depths due to climate change         simistic climate scenarios—with economic losses
are estimated at $2,671 million in investment costs    rising in later years. Around 80 percent of total
and $54 million in annual recurrent costs (Table       losses fall directly on household consumption and


             Table ES.3 Total adaption cost to address increased risk
           of inland flooding from climate change by 2050 ($ millions)
                      Adaptation Option                        Investment Cost        Annual Recurrent Cost
 Transport – Road height enhancement                                         2,122                      42
 Transport – Road cross-drainage                                                 5                        -
 Transport – Railway height enhancement                                          27                       1
 Embankment – height enhancement                                                 96                       2
 Coastal Polders – cross drainage                                             421                         8
 Erosion Control Program                                                                                  1
 Total Costs                                                                 2,671                      54
xviii                                        E C O N O M I C S O F A D A P TAT I O N T O C L I M AT E C H A N G E


hence have severe household welfare implications;    partial cost estimates. In addition, longer term
the southern coastal regions and the northwest-      adaptation has to also include development of
ern regions are expected to experience the largest   alternatives, particularly to the boro crop in the
income declines.                                     southern region.

Adaptation. While the public sector cost of adap-    (4) Poverty and local-level
tation in the agriculture sector was not quantita-   perspectives
tively estimated, the relative merits of a number    Impacts. The risks from tropical cyclones, storm
of short-term adaptation measures—namely             surges, floods, and other climatic hazards are geo-
the extension of currently available options into    graphically concentrated in specific regions of the
new areas—are examined from the farmer’s             country, which also have higher concentrations of
perspective. These measures primarily exam-          the poor. The poor and the socially most vulner-
ine the merits of promoting existing crops from      able are disproportionately affected, as they have
one area to another as the climate regime shifts.    the lowest capacity to cope with these losses. The
They provide low-cost options for adapting to        most vulnerable population includes those with
small changes in the climatic regime and may         few assets, subsistence farmers, the rural landless,
be suitable for some areas in the near term. Part    the urban poor, fishing communities, women,
of the medium-term adaptation strategy will be       children, and the elderly. They do not have suf-
to control the damages from inland floods; the       ficient resources to invest in preventive and pro-
study’s inland floods component included some        tective measures such as disaster-resilient housing,
BA N G L A D E S H CO U N T RY ST U DY                                                                xix


making them more vulnerable to the full effects        teams in Char areas. While they are similar to
of these hazards. Their access to public ser-          adaptation options identified in the BCCSAP,
vices, which might buffer them from some of the        they do provide a greater emphasis on softer
impacts, is also limited. In addition, their ability   approaches (governance), include more gen-
to better prepare themselves in the longer term        eral options (education), and are more directly
is also often limited by the destruction of their      targeted to the community level (use of mobile
asset base. These effects are further compounded       medical teams).
if vulnerable households suffer from multiple
extreme-event shocks one after the other, without      Some caution is advisable in reviewing
sufficient time for recovery in between the shocks.    these study results.
To the extent that it increases the frequency of
these events, climate change will only exacerbate      The mathematical tools and models used in this
these impacts.                                         study impose intellectual discipline; allow for
                                                       the estimation of impacts, costs, and benefits of
Adaptation. The adaptive capacity of households is     adaptation actions; and facilitate prioritization
generally low, with poor urban dwellers the most       of actions. These strengths can also be limiting
disadvantaged due to the limited opportunities         if the most important questions depend on insti-
for livelihood diversification and low social capi-    tutional, political, or cultural factors that are
tal. The most common forms of private adap-            not amenable to such tools; for example, how
tation activities among surveyed households are        to locate residents and economic activity away
temporary migration of adult men for day labor,        from high-risk or increasingly unproductive
construction of platforms to protect livestock,        areas, how to improve the allocation of water
and storage of food and drinking water prior to        and land, or how to improve the quality of edu-
extreme events. The preferred public adaptation        cation. Within the limitations imposed by the
activities from a local perspective—as identified      modeling frameworks, important limitations of
by participants in local and national participa-       this study derive from three sources of uncer-
tory scenario development workshops—include            tainty: climate, economic growth, and technol-
(a) environmental management (mangrove pres-           ogy. The climate scenarios used in the analysis
ervation, afforestation, coastal greenbelts, waste     are predicated on future global economic growth
management); (b) water resource management             and global efforts to mitigate greenhouse gases
(drainage, rainwater harvesting, drinking water        (GHGs). Whereas predicted changes in climate
provision, and flood control); (c) infrastructure      through 2050 largely depend on current and
(roads, cyclone shelters); (d) livelihood diversi-     past emissions, future global mitigation efforts
fication and social protection for fishers during      will increasingly determine the extent of warm-
the cyclone season; (e) education; (e) agricul-        ing toward the latter half of this century. While
ture, including development of salt-tolerant and       it is unlikely that technological breakthroughs
high-yield varieties and crop insurance; (f) fisher-   can greatly reduce the costs of adaptation, dra-
ies, including storm-resistant boats and conflict      matic reductions in the cost of mitigation are
resolution between shrimp and rice farmers; (g)        possible over the next few decades. A higher
governance, especially access to social services       return on investment in mitigation would in turn
for urban poor; (h) gender-responsive disas-           reduce the amount of adaptation that would be
ter management, including separate rooms for           required in the longer term. Nevertheless, it is
women in cyclone shelters, mini-shelters closer        essential to invest in adaptation to at least meet
to villages, and the use of female voices in early     the unavoidable warming.
warning announcements; and (i) mobile medical
xx                                             E C O N O M I C S O F A D A P TAT I O N T O C L I M AT E C H A N G E


Lessons and                                            is expected to currently overtop 43 existing pol-
                                                       ders. The expected damages from a single severe
Recommendations                                        cyclone currently is of the same order of magni-
                                                       tude as the total cost of strengthening all 43 pol-
Despite significant investments over the past 50       ders that would currently be overtopped. Future
years, climate-related disasters continue to have      damages are expected to be higher for two rea-
significant damages. Without additional actions,       sons: (a) higher risks as sea level rise and storms
these damages will certainly persist into the fore-    become more intense due to climate change; and
seeable future. While there is great uncertainty       (b)an increase in the value of assets that would
about the magnitude and the timing of the added        be located in at-risk areas as incomes rise. Steps
risk from climate change, the risks and hence the      taken to strengthen these 43 polders would not
potential damages are expected to increase. In a       only protect against future risks, but also pro-
fiscally constrained environment with competing        vide immediate benefits by preventing damages
priorities, climate adaptation actions have to be      from current risks, and hence are a near-term
prioritized and sequenced, particularly given the      priority.1
large costs required to prevent and protect against
these risks. The BCCSAP provides a starting point      During cyclonic events, existing multipurpose
for doing so. This study examines the key drivers—     shelters have also effectively protected the coastal
the degree of certainty, the timing of the benefits,   population. The ongoing development benefits
and the cost of action—to enable further substan-      of these shelters—as clinics, schools, or com-
tiation and refinement of the sequencing envi-         munity centers—easily offset (fully or partially)
sioned in the BCCSAP. A good near-term strategy        the construction cost of these facilities. Numer-
would be to protect populations and assets against     ous programs are already under way to construct
current climate risks while investing to reduce the    additional multipurpose shelters. A near-term
uncertainties about the magnitude and timing of        priority is to assess the adequacy of the current
future risks. The future risks can then be addressed   construction programs to provide sufficient shel-
in the medium to long term as the risks and the        ter capacity to accommodate the current popula-
potential damages become more certain.                 tion living in areas currently at risk of cyclones
                                                       and storm surges, and to develop a plan for con-
Near term                                              structing additional shelters as necessary.

(1) Addressing current climate-related                 Detailed analyses were not carried out to exam-
risks: a current priority                              ine the costs of addressing current risks for other
Rehabilitating polders currently at risk of being      climate hazards such as inland monsoon flood-
overtopped during a typical severe cyclone not         ing or droughts. Nevertheless, the large damages
only protects against the increased future risks       associated with current climate variability makes
from climate change but also provides immediate        it prudent to start by addressing the known cur-
benefits by reducing the damages from current          rent risks in the near term before beginning to
storms. This study assessed the risk that polders      address the less certain future risks. Shoring up
might be overtopped during cyclone-induced             river embankments, elevating roads, or adding
storm surges currently and with the added risk         culverts to accommodate drainage requirements
of climate change. The polder-specific costs
to prevent overtopping under these two condi-          1	 If needed, these polders can be further prioritized through
tions were determined from detailed engineering           further analyses that compare the assets and activities that would
                                                          be protected by each polder with the costs of strengthening that
analysis of each polder. A typical severe storm           polder.
BA N G L A D E S H CO U N T RY ST U DY                                                                  xxi


for severe monsoon floods that exist today would
not only provide immediate benefits, but also pro-
tect against increased future flood risks that are
expected with climate change.

Similarly, given the large impacts of current cli-
mate variability on the agriculture sector, a pru-
dent near-term strategy would be to promote
activities and policies that help households and
the government build resilience to existing climate
shocks affecting crop yields, particularly because
of the lead time needed to strengthen research
systems and to transfer and adapt findings from
the lab to the field. This effort better prepares the
country and households for whichever future cli-
mate materializes.

(2) Research and Knowledge Building: key
to improved targeting of future actions
Given the high cost of infrastructure investments,
and the expected gradual increase in climate risk
over decades, it is prudent to adapt infrastructure
incrementally in response to the added risk of cli-
mate change. This is especially true because of
the large uncertainties regarding the magnitude
and timing of the added risk from climate change.
In this regard, research and knowledge focused
on improving the spatial and temporal precision
of current climate-related risk forecasts and asso-
ciated early warning systems would enable bet-          institutions that (a) gradually integrate new knowl-
ter targeting of future adaptation actions. These       edge about climate risks into new infrastructure
actions not only provide immediate benefits,            investments; (b) reduce perverse incentives that
but also improve the capacity to address climate        are often associated with these investments; (c)
risks in the future. Supplemental research activi-      develop new, more resilient varieties of crops; (d)
ties focused on reducing the large uncertainties        improve governance and local stakeholder partici-
about future climate risks can also guide the           pation to increase effectiveness of the hard invest-
extent of adaptation that will be needed and its        ments; and (e) facilitate regional cooperation for
prioritization.                                         the equitable sharing of commonly shared water
                                                        resources.
Medium to Long Term
                                                        (3) Sound development policies:
A good medium- to long-term strategy has to             the foundation for an adaptation agenda
begin with effective development. Other elements        Sound development policies provide the founda-
of a longer term strategy include investments in        tion for adaptation action in the medium to long
programs and the creation or strengthening of           term. Adaptation takes place in the context of
xxii                                           E C O N O M I C S O F A D A P TAT I O N T O C L I M AT E C H A N G E


development, which defines both the opportuni-         costs. As research makes the risk of flooding in a
ties to adapt and generates the means for adapting     location more apparent, the design standards for
to climate change. Expected structural changes         roads in these areas need to be increased accord-
in the economy—away from climate-sensitive             ingly. Similarly, polders need to be strengthened
sectors such as agriculture toward industry and        beyond their current protective capacity as the
services—reduce exposure to climate risks, while       added risk from storm surges becomes more cer-
urbanization concentrates risks but also provides      tain. Applying the standards to infrastructure
new opportunities to manage them better. Invest-       investments as they are replaced not only pro-
ments to expand the road system and increase           vides a flexible way to integrate the most updated
the share of paved roads lowers transport costs,       research outcomes but also provides a natural way
enhances the ability of farmers to respond to mar-     to modulate adaptation efforts, scaling up adapta-
ket changes and expand markets, while lessening        tion efforts if the risks are increasing or limiting
the impacts of floods. Poverty exacerbates vulner-     efforts if the risks are stable or declining.
ability to weather variability as well as climate
change, so reducing poverty is central to both         (5) Reducing perverse incentives:
development and adaptation. Rising incomes             a necessity to increase effectiveness of
enable households to autonomously adapt and            infrastructure investments
better cope with climate-related disasters—for         As a general rule, investments—such as flood
instance, by increasing the affordability of cli-      embankments or polders—designed to protect
mate-resilient housing, which can dramatically         vulnerable assets should be subjected to careful
reduce the number of shelters that are necessary       consideration. Strengthening an embankment is
to protect coastal residents. The effectiveness of     followed, almost by definition, by an accumulation
adaptation programs can be also be improved            of physical capital in the shadow of the embank-
through the targeting of adaptation actions that       ment because it is considered “safe.” However, as
directly assist the poor, such as early warning and    the tragedy of New Orleans dramatically illus-
evacuation services, basic education (particularly     trated, a sufficiently extreme event will breach a
for women), and subsidized insurance programs.         polder. The combination of the increasing sever-
                                                       ity of extreme events, the high costs of provid-
(4) Adjustment of design standards                     ing physical protection, and the accumulation of
for infrastructure: essential for future               capital behind such barriers can mean that the
resilience                                             expected value of losses, including human suffer-
Infrastructure investments are long-lived and          ing, may not be reduced—either at all, or by as
expensive and yield large benefits when designed       much as expected by investments in protection.
appropriately. It is essential to institutionalize
the development of appropriate standards com-          The long-term challenge is to move people and
mensurate with the likely climate risks over the       economic activity into less climate-sensitive areas
expected lives of the assets and to update them        and to seek a strategic balance between protect-
over time based on new research results that           ing existing populations and encouraging the
become available. For example, the prospect of         mobility of future populations. In 2050, the num-
more intense precipitation has implications for        ber of people living in cities will triple, while the
unpaved roads, especially in rural areas, which        rural population will fall by 30 percent. Current
are vulnerable to being washed away by floods          policies will determine where this urban popula-
and heavy rainfall. Single-lane sealed roads have      tion settles and how prepared it is to adapt to a
a higher capital cost, but they provide a more reli-   changed climate. Many households have moved
able all-weather network with lower maintenance        further inland, partly due to higher perceived risk,
BA N G L A D E S H CO U N T RY ST U DY                                                                xxiii


but strengthened embankments may change these          (7) Improved governance and stakeholder
perceptions, leading to increased exposure. Good       participation: a complement to hard
policy needs to encourage future populations to        investments
move away from naturally high risk areas, avoid-       The effectiveness of hard investments depends on
ing perverse incentives to remain in high-risk         both the ability of targeted populations to access
areas and adopting positive incentives to promote      them and on their uptake. Improved governance
settlements and urban growth in low-risk areas.        and local stakeholder participation are often
Strengthened education in rural areas is critical      key determinants of access and uptake. Reach-
for rural migrants to be prepared for productive       ing women requires gender-sensitive designs of
lives in new urban areas.                              interventions such as the provision of separate
                                                       facilities for women in cyclone shelters. Pro-poor
Similar concerns apply to efforts to maintain the      adaptation investments include social protec-
welfare of populations in areas where climate          tion, livelihoods diversification, and investments
change alters the comparative advantage of agri-       in human and social capital (including training,
culture and other resource-intensive activities.       education, and community-based disaster risk
Short-term measures to prevent suffering must          management) in order to strengthen local resil-
be complemented by long-term measures such as          ience to climate change.
education, job training, and migration designed
to reduce reliance on resources and assets whose       (8) Strengthened regional cooperation: an
value may be eroded by climate change. Adapta-         essential option in the long term
tion should not attempt to resist the impact of cli-   Climate change may greatly increase the need for
mate change, but rather it should offer a path by      regional cooperation. Cooperation on the sharing
which accommodation to its effects is less disrup-     of water resources with neighboring countries in
tive and does not fall disproportionately on the       the GBM basin is not a new issue for Bangladesh,
poor and the vulnerable.                               but it is one whose importance may be greatly
                                                       increased by climate change. Recognizing its
(6) Development of climate-resilient cul-              importance, Bangladesh has been meeting since
tivars and cropping: an option for long-               2006 with six other neighboring countries—
term food security                                     including India, Nepal, and China—as part of
Additional research will also be necessary for         the Abu Dhabi Dialogue. These dialogues have
the development of climate-resilient cultivars         resulted in a consensus vision of a “cooperative
and cropping patterns that are more suited to          and knowledge-based partnership of states fairly
the future climatic conditions, particularly in the    managing and developing the Himalayan river
southern coastal regions, which are expected to        systems,” as well as agreements on specific actions
be affected the most by climate change. Bangla-        to advance the water cooperation agenda. As the
desh already has an active network of agricul-         stakes rise, effective steps taken now to promote
tural research institutes that develop and test new    and strengthen the cooperative programs such
crop varieties to increase national production         as the Abu Dhabi Dialogue can not only provide
and resilience against climate risks. The magni-       immediate benefits to all parties, but can also pre-
tude of the additional effort and the direction it     vent the need for expensive and possibly disrup-
takes will depend on the specific future climate       tive solutions in the future.
that materializes.
xxiv                                                     O NE
       E C O N O M I C S O F A D A P TAT I O N T O C L I M AT E C H A N G E
BA N G L A D E S H CO U N T RY ST U DY                                                                     1


Introduction


Motivation and Context for                              initial findings were that developing countries will
the EACC Study                                          need $70 to $100 billion per year between 2010
                                                        and 2050 to adapt to a world that is approximately
                                                        20C warmer in 2050 (World Bank 2010).
The Economics of Adaptation to Climate Change
(EACC) study has two specific objectives. The first     Each country case study under the country
is to develop a “global” estimate of adaptation costs   track consists of a series of studies that exam-
to inform the international community’s efforts to      ine the impacts of climate change and the costs
help those developing countries most vulnerable to      of adapting to them for select major economic
climate change to meet adaptation costs. The sec-       sectors. Most case studies also included vulner-
ond objective is to help decision makers in devel-      ability assessments and a participatory scenario
oping countries to better understand and assess the     workshop to highlight the differential impact of
risks posed by climate change and to better design      climate change on vulnerable groups and to iden-
strategies to adapt to climate change. The study        tify the types of adaptation strategies that can
comprises a global track to meet the first study        benefit those that are most vulnerable. Finally, the
objective and a country case study track to meet the    sectoral analyses were integrated into analytical
second objective. The country track comprises seven     tools—such as a computable general equilibrium
country case studies: Bangladesh, Bolivia, Ethiopia,    model—to identify cross-sectoral constraints and
Ghana, Mozambique, Samoa, and Vietnam.                  effects such as relative price changes. The findings
                                                        from each of the seven countries—as well as a
Using data sets with global coverage at the country     final synthesis report covering both the global and
level, the global track estimated adaptation costs      the country tracks—will be available in 2010.
for all developing countries by major economic
sectors, including agriculture, forestry, fisheries,
infrastructure, water resources, coastal zones, and     Context for the Bangladesh
health. Adaptation for ecosystem services is also       Case Study
discussed qualitatively. The study also considered
the cost implications of changes in the frequency of
extreme weather events, including the implications      Bangladesh is one of the most vulnerable coun-
for social protection programs. The global track’s      tries in the world to climate risks. Two-thirds of
2                                             E C O N O M I C S O F A D A P TAT I O N T O C L I M AT E C H A N G E


the nation is less than 5 meters above sea level      related hazards. Agricultural production has
and is susceptible to river and rainwater flood-      actually risen over the past few decades as rural
ing, particularly during the monsoon. Due to its      households have adapted their farming systems to
location at the tail end of the delta formed by the   the “normal floods” that typically inundate about
Ganges, Brahmaputra, and Meghna (GBM) riv-            a quarter of the country by switching from low-
ers, the timing, location, and extent of flooding     yielding deepwater rice to high-yielding rice crops.
depends on the precipitation in the entire GBM        Higher incomes have also enabled an increas-
basin, not just on the 7 percent of the basin that    ing proportion of households to live in homes
lies within the country. Nearly 80 percent of the     that are more resilient to cyclones, storm surges,
country’s annual precipitation occurs during the      and floods. In addition, the government of Ban-
summer monsoon season, when these rivers have         gladesh has invested $10 billion since the sixties
a combined peak flow of 180,000 m3/sec, the           on disaster reduction measures—both structural
second highest in the world. Once every three to      (polders, cyclone shelters, cyclone-resistant hous-
five years, up to two-thirds of Bangladesh is inun-   ing) and non-structural (early warning and aware-
dated by floods that cause substantial damage to      ness raising systems) measures—and enhanced its
infrastructure, housing, agriculture, and liveli-     disaster preparedness systems. These investments
hoods. The performance of the agriculture sector      have significantly reduced damages and losses
is in turn heavily dependent on the characteristics   from extreme climatic events over time, especially
of the annual floods. Low-lying coastal areas are     in terms of deaths and injuries.
also at risk from tidal floods and severe cyclones.
Bangladesh is one of the most vulnerable coun-        Large damages and losses, reduced economic
tries to climate risks, and is the most vulnerable    growth and slowed progress in reducing poverty
to tropical cyclones. Between 1877 and 1995,          following recent climate-related disasters, how-
Bangladesh was hit by 154 cyclones—including          ever, indicate that these measures are insufficient
43 severe cyclonic storms and 68 tropical depres-     to protect the exposed population and assets
sions— or one severe cyclone every three years,       against existing risks. The 1998 monsoon flood
either before or after the monsoon, creating          inundated over two- thirds of Bangladesh and
storm surges that are sometimes in excess of 10       resulted in damages and losses of over $2 billion,
meters. The largest damages from a cyclone result     or 4.8 percent of GDP. The losses were evenly
from the induced-storm surges, and Bangladesh is      split among agriculture, infrastructure, and indus-
on the receiving end of about 40 percent of the       try/commerce. Cyclone Sidr resulted in damages
impact of total storm surges in the world. Crops      and losses of $1.7 billion, or 2.6 percent of GDP
and the livelihoods of the rural poor in low-lying    in 2007. About half the losses were in the housing
coastal areas are also devastated by saline water     sector, followed by agriculture and infrastructure.
intrusion into aquifers and groundwater and land      When averaged over the past decade, the direct
submergence. In addition, seasonal droughts           annual costs from natural disasters to the national
occasionally hit the northwestern region.             economy—in terms of damages to infrastructure
                                                      and livelihoods and losses from forgone produc-
Addressing the impacts of climate and non-cli-        tion—have been estimated at 0.5 percent to 1
mate natural disasters has been an integral part      percent of GDP. These statistics do not include
of the nation’s development plans. Investments        the significant loss of life that has also occurred
made over the past 50 years have made Bangla-         during these events.
desh more resilient to climate-related hazards, but
additional steps are necessary to reduce potential    These damages and losses are geographically
damages from both existing and future climate-        concentrated in areas that also have higher
BA N G L A D E S H CO U N T RY ST U DY                                                                    3


concentrations of the poor, affecting them dis-         and Action Plan in 2009 to guide its actions in all
proportionately (Figure 1.1). They live in thatch       areas related to climate change. Until the past few
or tin houses that are more susceptible to direct       years, climatic risks have been poorly reflected in
damages from cyclones, storm surges, and floods.        major national policies and programs in Bangla-
Additionally, most rural households depend on           desh. The country launched the National Adap-
weather-sensitive sectors—agriculture, fisheries,       tation Program of Action (NAPA) in 2005, which
and other natural resources—for their livelihood.       identified 15 priority activities that were subse-
Destruction of their assets and livelihoods leaves      quently updated to 45 programs in 2009. The first
the poor with a limited capacity to recover. The        sectoral policy to explicitly include climate change
importance of adapting to these climate risks to        impacts and actions—the Coastal Zone Policy—
maintain economic growth and reduce poverty is          was adopted in 2005. Climate change has been
thus very clear.                                        a key concern in the redrafting of the National
                                                        Water Management Plan (NWMP). Recognizing
In a fiscally constrained environment, with com-        that a wide range of policies have the potential to
peting priorities, efforts to address climate related   address climate-related hazards and vulnerability,
risks can easily be set-aside. Recognizing these        the government developed and adopted through
complexities, the government of Bangladesh              a consultative process the Bangladesh Climate
adopted the Bangladesh Climate Change Strategy          Change Strategy and Action Plan 2009 to guide


                             Figure 1.1 Poverty and climate hazards


Source: BBS, World Bank, and WFP 2009
4                                               E C O N O M I C S O F A D A P TAT I O N T O C L I M AT E C H A N G E


economy-wide efforts to adapt to climate change         median discharges in the three rivers during the
and to mitigate greenhouse gases. It identifies         summer months are expected to increase between
three climate hazards—tropical cyclones/storm           6 and 18 percent by the 2050s. These climatic
surges, inland flooding, and droughts. The strat-       changes are expected to exacerbate existing cli-
egy contains 44 programs formulated around six          mate hazards — such as cyclones/storm surges,
themes—food security/social protection/health,          different floods, droughts, salinity, waterlogging,
comprehensive disaster management, infrastruc-          and drainage congestion — increasing their
ture, research/knowledge management, miti-              severity and frequency.
gation/low carbon development, and capacity
building/institutional strengthening (see Table
ES.1). Thirty-four programs listed under five           Scope of This Report
themes are wholly or partially focused on adap-
tation. The strategy includes an implementation         This report synthesizes the series of studies that
timeframe for each program and is estimated to          constitute the EACC Bangladesh case study.
require $500 million in the first two years and         The study is intended to assist the government
about $5 billion in the first five years for full       of Bangladesh in its efforts to understand how
implementation. The government allocated $100           climate change may alter the physical and eco-
million from its own resources in FY 09-10 and          nomic impacts of existing climate-related haz-
has budgeted $100 million in FY10–11 toward             ards, as well as the effectiveness and costs of
actions contained in the strategy. It is actively       available adaptation options. The study takes
seeking additional resources to implement the full      as its starting point the BCCSAP. It builds upon
strategy.                                               and strengthens the analytical models and quan-
                                                        titative assessment tools already in use in Bangla-
                                                        desh in support of the research and knowledge
Climate Change and                                      management theme of BCCSAP. This study uses
Bangladesh                                              these tools to (a) examine the potential physical
                                                        impacts of climate change; (b) assess the associ-
                                                        ated damages and losses in key economic sec-
A warmer and wetter future climate that goes            tors, vulnerable populations, and in the overall
beyond historical variations will exacerbate exist-     economy; (c) estimate spatially disaggregated
ing climatic risks and increase vulnerability by        costs of adaptation options that can reduce these
increasing the extent and depth of inundation           impacts; and (d) sequence the adaptation actions
from flooding and storm surges and by reducing          over time. The study is not a substitute for the
arable land due to sea level rise and salinity intru-   BCCSAP, instead it is designed to provide more
sion. The median predictions from the general           precise cost estimates actions in the BCCSAP
circulation models (GCMs) are for Bangladesh            and approaches to sequencing these actions in a
to be 1.5oC warmer and 4 percent wetter by the          fiscally constrained environment.
2050s. Severe cyclones originating in the Bay of
Bengal are also expected to occur more frequently       The scope of the study is more limited, encom-
as a result of warmer ocean surface temperatures.       passing about 21 of the adaptation actions identi-
Cyclone-induced storm surges are further exac-          fied in BCCSAP (as highlighted in Table ES.1).
erbated by a potential rise in sea level of over 27     Some important and likely expensive adaptation
cm by 2050. Most GCMs predict precipitation             activities—such as urban drainage, river training
increases of up to 20 percent during July, August,      works, dredging and desiltation, and protection of
and September for the GBM basin. As a result,           ecosystem services—are not included in the study,
BA N G L A D E S H CO U N T RY ST U DY                                                                  5


so the reported costs represent a lower bound of       provide a point of reference for comparing the
the total adaptation costs in Bangladesh.              cost of adapting to this risk. The third compo-
                                                       nent of the study focuses on both the direct and
The study was developed in four discrete and           economy-wide impacts of climate on agricul-
somewhat independent components with varying           ture and food security from a full range of
degrees of analytical depth and quantification.        climate risks, including droughts (the third haz-
When feasible, common assumptions and similar          ard identified in the BCCSAP), floods, sea level
methodologies were used to increase compara-           rise, warmer temperatures, and increased CO2
bility and cohesion among the components. The          concentrations. While a full set of adaptation
first two components of the study focus on two of      options and their public sector costs to address
the hazards identified in the BCCSAP—tropi-            these impacts are not analyzed, the relative
cal cyclones/storm surges and inland                   desirability of transferring existing coping strat-
flooding. They assess the added risk of these          egies to newly affected areas is examined. The
hazards due to climate change in the context           final component provides local perspectives
of the existing risks, identify specific assets and    on adaptation as seen by the poor and most
activities that are at risk, and estimate the cost     vulnerable population. It examines the determi-
of adaptation actions to protect against these         nants of the adaptive capacity of the vulnerable
risks. Sequencing of these actions is facilitated by   populations and solicits from local, regional and
detailed spatially disaggregated identification of     national stakeholders—through the use of par-
adaptation options and associated cost estimates.      ticipatory scenarios—the types of public support
In addition, the future economic damages from a        that would best enable the vulnerable population
single super cyclonic event are also estimated to      to cope with potential climate change impacts.
6                                                    T WO
    E C O N O M I C S O F A D A P TAT I O N T O C L I M AT E C H A N G E
BA N G L A D E S H CO U N T RY ST U DY                                                                      7


Existing Climate Variability
and Climate Change


Most of Bangladesh consists of extremely low land.        mm of rain. The hydrometeorological character-
Dhaka, the capital city with a population of over 12      istics of the three river basins make the country
million, is about 225 km from the coast but within        vulnerable to a range of climate risks, including
8 meters above mean sea level (MSL). Land eleva-          severe flooding and periodic droughts.
tion increases toward the northwest and reaches an
elevation of about 90 meters above MSL. The high-         This chapter characterizes the risks that Bangla-
est areas are the hill tracts in the eastern and Chit-    desh is currently facing due to variability in the
tagong regions. The lowest parts of the country are       current climate and how these are expected to
in the coastal areas, which are vulnerable to tidal and   change based on projections of the future climate
cyclone-induced storm surges and sea level rise.          through 2050. It is largely based on a comple-
                                                          mentary World Bank study focused on climate
Bangladesh is situated at the confluence of three         change and food security that has recently been
great rivers—the Ganges, the Brahmaputra, and             completed (Yu et al. 2010).
the Meghna. Over 90 percent of the Ganges-
Brahmaputra-Meghna (GBM) basin lies outside
the boundaries of the country. The country is             Existing Climate Variability
intersected by more than 200 rivers, of which
54 rivers enter Bangladesh from India. Like the           Historical precipitation levels
rest of the GBM basin, Bangladesh has a humid             Figure 2.1 shows trends in the annual and sea-
subtropical climate. The year can be divided into         sonal precipitation levels averaged across 32
four seasons: the relatively dry and cool winter          rainfall stations (both BMD and BWDB stations)
from December to February, the hot and humid              in Bangladesh between 1960 and 2001. The
summer from March through May, the southwest              national mean annual rainfall during this period
summer monsoon from June through Septem-                  was 2,447 mm, with a maximum of 4,050 mm (in
ber, and the retreating monsoon from October              Sylhet) and minimum of 1450 mm (in Rajshahi).
to November. The southwest summer monsoon                 The maximum rainfall occurs during the June,
is the dominating hydrologic driver in the GBM            July, and August monsoon months (JJA). Neither
basin. More than 80 percent of annual precipita-          the annual nor seasonal precipitation time series
tion occurs during this period. Some areas of the         show any statistically significant changes over this
South Asia subcontinent can receive up to 10,000          time period.
8                                                       E C O N O M I C S O F A D A P TAT I O N T O C L I M AT E C H A N G E


             Figure 2.1 Annual and seasonal (mm) precipitation averaged
                            across meteorological stations by year

3500

3000

2500


2000

1500

1000


    500

      0
      1960         1965          1970          1975            1980        1985          1990         1995          2000


                   DJF                MAM                JJA               SON                ANN

Note: DJF = December, January, February; MAM = March, April, May; JJA = June, July, August;
SON = September, October, November.
Source: Yu, W.H., et al. (2010)


          TABLE 2.1 PEAK DISCHARGE AND TIMING DURING EXTREME FLOOD YEARS
                   Brahmaputra                     Ganges                       Meghna                Return      Return
 Extreme                                                                                              period      period
 Years           Date        m3/s             Date        m3/s             Date        m3/s           (area)       (vol)

 1974           7-Aug        91,100          3-Sep        50,700                  -    21,100                 7         7

 1980           20-Aug       61,200          22-Aug       57,800            7-Aug      12,400                 2         2

 1984           20-Sep       76,800          17-Sep       56,500           17-Sep      15,400                 2         4

 1987           16-Aug       73,000          20-Sep       75,800            4-Aug      15,600                 9       10

 1988           31-Aug       98,300          4-Sep        71,800           18-Sep      21,000                79       34

 1998           9-Sep      103,100           11-Sep       74,280                  -    18,600             100         52

 2004           12-Jul       83,900          19-Jul       77,430                  -    16,300                10       20

 Average                    67,490                       51,130                        13,370

 Min                        40,900                       31,500                         7,940

 Source: BWDB
BA N G L A D E S H CO U N T RY ST U DY                                                                                           9


     Table 2.2 Water level trends at different stations along the coastline
         Station Name                      Station Location       Duration               No. of years        Trend (mm/yr)
 Hiron Point                           Passur                    1977 – 2002                          26                  5.6*
 Khepupara                             Nilakhi                   1959 – 1986                          22                   2.9
 Galachipa                             Lohalia                   1968 – 1988                          21                   3.3
 Dasmunia                              Tentulia                  1968 – 1986                          19                   1.3
 Kyoyaghat                             Tentulia                  1990 – 2002                          12                   3.6
 Daulatkhan                            Lower Meghna              1959 – 2003                          31                   4.3
 Nilkamal                              Lower Meghna              1968 – 2003                          33                   2.3
 Chadpur                               Lower Meghna              1947 – 2002                          50                   0.0
 Companyganj                           Little Feni Dakatia       1968 – 2002                          32                   3.9
 Chittagong                            Karnafuli                 1968 – 1988                          16                   3.1
 Dohazari                              Sangu                     1969 - 2003                          32                   2.0
 Lemsikhali                            Kutubdia Channel          1969 - 2003                          27                   2.1
 Cox’s Bazar                           Bogkhali                  1968 - 1991                          22                   1.4
 * statistically significant to p < 0.05
 Source: BWDB


Historical discharges                                         The 1987 flood was primarily from the Ganges.
The observed peak discharges during severe flood              In 1988, all three rivers had peaks within one
events with the corresponding dates in the three              week of each other. The 1998 flood discharge
rivers are summarized in Table 2.1. The peak                  in the Ganges and Brahmaputra rivers was even
discharges are almost 50 percent larger than the              higher. This particularly devastating flood was a
corresponding average discharge levels, highlight-            result of a simultaneous peak in both the Brah-
ing the extreme inter-annual variability. The tim-            maputra and the Ganges rivers (Mirza 2003). In
ing of the peak discharges on the three rivers on             2004, the Ganges and Brahmaputra peaked early.
average does not coincide, with the Brahmaputra               The 1998 event is the 1-in-100-year event from
peaking in July and August and the Ganges in                  the total area impacted perspective, and the 1-in-
August and September. The Brahmaputra starts                  50-year event from the discharge perspective.2
rising in March due to snow melt in the Himala-
yas, while the Ganges starts rising in early June             Historical rise in sea level
with the onset of the monsoon. Monsoon rainfall               Long-term reliable data are not available to assess
occurs in the Brahmaputra and Meghna basins                   the historical rise in sea levels along the Bangla-
earlier than the Ganges basin due to the pattern              desh coast. Trends in daily mean water levels in
of progression of the monsoon air mass. In addi-              the coastal zone may provide some insight on his-
tion, due to its location at the tail end of three            torical rise in sea levels. Observations from 13 sta-
major rivers, current and future water levels in              tions over 12 to 42 years are summarized in Table
these rivers invariably depend on the hydrocli-               2.2. The annual changes range from 5.6 mm/yr at
matic, demographic, and socioeconomic features                Hiron point station to no change at the Chadpur
that characterize the patterns of water utilization
                                                              2	 Return periods are estimated in terms of the total area affected
in the neighboring countries.                                    and the total volume discharged in the Ganges and Brahmaputra
                                                                 using a Gumbel Type I distribution.
10                                                         E C O N O M I C S O F A D A P TAT I O N T O C L I M AT E C H A N G E


 station. The water level increased at a rate of 1.4                 Climate Change
 mm/yr at Cox’s Bazar in the southeast and 3.9
 mm/year at Companyganj in the middle of the
 south coastal zone. Though trends are positive at                   Future temperature and
 all stations, only the observations at Hiron Point                  precipitation changes
 are statistically significant. While the consider-                  Yu et al. (2010) summarize the changes in tem-
 able sedimentation occurring at this location may                   perature and precipitation changes predicted by
 partially explain the upward trend, these observa-                  16 global circulation models for three emission
 tions may also result from land subsidence.                         scenarios for the fourth assessment report of the


              Figure 2.2 Monthly, annual, and seasonal temperature changes

                          2050s — 20TH CENTURY TEMPERATURE CHANGE FOR ALL SCENARIOS

  6°C

  5°C

  4°C

  3°C

  2°C

  1°C

  0°C
          J     F     M      A     M      J      J     A      S     O      N      D    ann    wet    dry   Aus Aman Boro Wheat


              Figure 2.3 Monthly, annual, and seasonal precipitation changes

                          2050s — 20TH CENTURY PRECIPITATION CHANGE FOR ALL SCENARIOS

100%


 50%


      0


-50%


-100%
          J     F     M      A     M      J      J     A      S     O      N      D    ann    wet    dry   Aus Aman Boro Wheat

 Note: The box and whiskers diagrams in Figure 2.2 and Figure 2.3 consist of a red line representing the median value, a box enclos-
 ing the inter-quartile range, dashed whiskers extending the to the furthest model that lies within 1.5x the inter-quartile range from
 the edges of the box, and red plus symbols for additional models that are perceived as outliers. Source: Yu, W.H., et al. (2010)
BA N G L A D E S H CO U N T RY ST U DY                                                                                                          11


IPCC.3 Figure 2.2 shows the projected monthly,                               surpasses the 90th percentile of the historical
annual, and seasonal temperature changes in                                  temperature variability.
the 2050s relative to the corresponding data for
1980–99.4 Temperature rises during all months                                Precipitation is subject to large existing variation in
and seasons, but does not show any obvious sea-                              the historical record. Differences in the monsoon
sonal structure except a wider distribution during                           structure and the influences of large-scale circula-
the dry winter months. The median warming                                    tion patterns like the Madden-Julien Oscillation
predictions for Bangladesh across the models by                              (MJO) and the El Niño-Southern Oscillation
the 2050s is 1.550C.                                                         (ENSO) contribute to this background variabil-
                                                                             ity. Despite the consistently noted enhancement
Figure 2.3 shows the projected monthly, annual,                              of the monsoonal circulation pattern that leads
and seasonal precipitation changes for the 2050s                             to a drying trend during the winter months and
relative to the corresponding data for 1980–99.                              increased rainfall during the monsoons in the cli-
Deviations for each time period are displayed                                mate scenarios of the 2050s, precipitation does
as the percentage change from their baseline                                 not separate itself from the historical variability
average. Annual and wet season precipitation                                 for any month or season due to the larger uncer-
increases, though some models do continue to                                 tainty in future predictions and the substantial
show decreases in precipitation.5 Only simula-                               existing variability.
tions for the post-monsoonal rabi dry season do
not suggest a rise in precipitation. The median                              Future flood hydrology
prediction for Bangladesh across the models is for                           Due to its location at the tail end of the GBM
precipitation increases of 4 percent by the 2050s.                           basin, the flood hydrology of Bangladesh (includ-
                                                                             ing the location, timing, and extent of future
Comparison to historical variability                                         floods) depends not just on the 7 percent of the
A trend toward a warmer and wetter future cli-                               basin that lies within Bangladesh, but on the entire
mate will impact the agriculture sector in Ban-                              GBM basin. The super or national flood model
gladesh, particularly if the climate state goes                              is used to estimate hydrologic changes within the
beyond the variations found in the historical                                country from changes in temperature and pre-
record. Warming is projected to generally accel-                             cipitation in Bangladesh and changes in water
erate over the 21st century, although the model-                             flows into the country. The later is determined
based probability distribution widens. By the                                from changes in precipitation and temperature
2030s, the median temperatures in July, August,                              predicted by GCMs using the Ganges-Brahma-
and September of the future model distribution                               putra-Meghna (GBM) river basin model.6 Future
                                                                             flood estimates are modeled for five GCMs and
3	 The 16 models are BCCR_bcm2.0, ccma_cgcm3.1(T63),                         2 emission scenarios (A2 and B1) due to resource
   cnrm_cm3, csiro_mk3.0, gfdl_cm2.0, gfdl_cm2.1,giss_model_er,
   inmcm3.0, ipsl_cm4, miroc3.2(medres0,miub-echio_g,                        limitations.7 The chosen models are skillful in
   mri_cgcm2.3.1a, mpi_echam5, ncar_pcm1, ncar_ccsm3.0,                      replicating the dynamics of the monsoon in the
   ukmo_hadcm3.
4	 The resolution of the models varies with about 5 grid boxes
                                                                             GBM basin, provide sufficient spatial resolution
   typically covering Bangladesh. The national values are weighted
   averages, with the weights equal to the percentage of each grid
   that is within Bangladesh.                                                6	 These models are described in detail in Annex 15. Models used
                                                                                for flood hydrology
5	 Despite only small changes in actual magnitude, rainfall devia-
   tions in the dry months of the year appear as very large percent-         7	 The five GCMs are University Corporation for Atmospheric
   age changes due to the low baseline average. These dry season                Research – CCSM, Max Planck Institute for Meteorology –
   totals would not have any noticeable impact on the annual rainfall           ECHAM5, Hadley Center for Climate Prediction – UKMO,
   totals, but could still have significant ramifications for the severity      Center for Climate System Research – MIROC, and Geophysi-
   of droughts. Conversely, simulated rainfall deviations in the wet            cal Fluid Dynamics Laboratory – GFDL. The A1B scenario
   season have to be very large to produce high percentage changes.             predictions are similar to the A2 scenario through 2050.
12                                                               E C O N O M I C S O F A D A P TAT I O N T O C L I M AT E C H A N G E


                      Table 2.3 Estimated average change (%) in discharge*
                                                2030s                                                               2050s
                        Brahmaputra            Ganges              Meghna                 Brahmaputra              Ganges              Meghna
 May                                 7.5                 9.3              0.0                         17.4                 11.8                 12.3
 June                                5.4               11.9               3.1                         10.9                 16.7                  7.7
 July                                3.4               13.5               0.0                           6.9                15.0                  3.6
 August                              5.5                 8.8              3.7                           9.5                12.0                  7.8
 September                           3.7                 7.3              -2.0                          9.7                12.5                  5.9
 * 5 GCM x 2 SRES = 10 model experiments Source: Yu, W.H., et al. (2010)


for hydrologic modeling, and capture the range                            Future estimated discharges
of changes and climate sensitivity across GCMs.                           Simulations of the future transboundary inflows
                                                                          of the three major rivers (Ganges, Brahmaputra,
Future temperature and precipitation                                      and Meghna) indicate increased basin precipita-
changes over GBM basin                                                    tion will result in increased inflows into Bangla-
Across the five models and two emission sce-                              desh over the monsoon period (Table 2.3).10 The
narios, a clear consensus exists on a warming                             magnitude of change from the baseline depends
trend in the GBM basin with increases of 1° to                            on the month, with larger changes on average on
3° C by 2050, with greater warming during the                             the Ganges and in the 2050s. There is not much
dry winter months. Models differ widely regard-                           difference between the A2 and B1 scenarios.
ing changes in precipitation in the GBM basin.8                           Larger changes are anticipated by the 2050s com-
Rainfall increases during the monsoon season                              pared to the 2030s.
(both in the 2030s and the 2050s)—up to 20 per-
cent more from July to September in most GCMs.
Large changes at the onset of the monsoon (dur-
                                                                                 events and misses sub-grid scale geographic variability; and
ing May and June months), particularly in the                                    (4) year-to-year variability at a particular location in the GCM
Ganges, may reflect an earlier arrival of the mon-                               output tends to be underestimated due to simplified greenhouse
                                                                                 forcing scenarios and coarse spatial resolution. In this approach,
soon season. During the dry season, some models                                  the starting point for all scenarios is the actual historical observed
                                                                                 30-year precipitation and temperature data, which captures
show increased precipitation, while others show                                  differences between subregions and day-to-day and year-to-
decreased precipitation. The temperature and                                     year variability. For each GCM/emission scenario, a monthly
                                                                                 rainfall and temperature series, averaged over each 30-year time
precipitation changes predicted by each model                                    period, is determined for the historical period, the 2030s and
are applied to the baseline historical climate data                              2050s. By comparing the baseline and future monthly averages, a
                                                                                 “delta” value for both rainfall and temperature is calculated (i.e.
for use in generating flood scenarios.9                                          percentage change is used for precipitation and absolute change
                                                                                 in degrees Celsius is used for temperature). The delta value is
                                                                                 applied to the baseline historical climate data to estimate tem-
8	 There is not even agreement on the direction of rainfall change               perature and precipitation predictions from each GCM/emission
   between emissions scenarios for individual models (e.g. in Janu-              scenario. The baseline climate period (1979–99) differs slightly
   ary, ECHAM A2 estimates decreases, ECHAM B1 estimates                         from the baseline hydrologic period (1978–2008), which intro-
   increases).                                                                   duces slightly higher baseline conditions for the delta method.
                                                                                 However, changes between 1999 and 2008 are the smallest of the
9	    This is a standard (“delta”) approach used to overcome the
                                                                                 20th century.
     following shortcomings of directly using predictions of GCMs to
     generate future flood scenarios: (1) GCM outputs may contain         10	 Not all models predict increases in discharge. The model range
     significant biases both in the baseline period and in the future         is largest for the Meghna (55 percent increase to 32 percent
     period; (2) daily output is required while the GCM output is typi-       decrease) in the GFDL scenario. This partly reflects the smaller
     cally monthly; (3) the GCM spatial resolution reduces extreme            baseline discharge at the onset of the monsoon.
BA N G L A D E S H CO U N T RY ST U DY                                                                                         13


                Figure 2.4 Total change in national flooded area for 2050
                                           in the A2 and B1 scenarios

THE B1 SCENARIOS SHOW SMALLER CHANGES THAN THE A2 SCENARIOS, THOUGH IN THE SAME DIRECTION.


                  2050 — SCENARIO A2                                             2050 — SCENARIO B1
                PERCENTAGE OF CHANGE                                           PERCENTAGE OF CHANGE


 50%                                                           50%


 40%                                                           40%


 30%                                                           30%


 20%                                                           20%


 10%                                                           10%


     0                                                             0


-10%                                                           -10%


-20%                                                           -20%
            May        June       July     Aug   Sept                     May        June       July       Aug        Sept


                      CCSM               ECHAM          GFDL           MIROC                UKMO


Source: Yu, W.H., et al. (2010)


Changes in spatial extent of land flooding                     show smaller changes than the A2 scenarios,
Given that most climate models indicate an                     though in the same direction.
increasing trend of monsoon rainfall and greater
inflows into Bangladesh, all else being equal, the             The flooded area is estimated to increase for most
extent of flooding is likely to increase. Monthly              of the flood season for most models.11 For the A2
water levels are estimated for each grid point in              scenario, the average increase of flooded area is 3
flood-relevant regions of Bangladesh for the his-              percent in 2030 and 13 percent in 2050. However,
torical period, the 2030s and 2050s. Accounting                the changes in flood areas in many subregions fall
for the existing flood protection infrastructure (e.g.         within one standard deviation of the historical vari-
roads, embankments, polders), the proportion of                ability for these areas. The most significant changes
area flooded (greater than 0.3m) is highest during             occur later in the flood season, primarily in August
July through September, peaking in August, when                and September at the height of the monsoon, and
the peak levels coincide in the three major rivers.
The percentage change in flooded area by month                 11	 Some models indicate a decrease in flooding during the month
and model is summarized in Figure 2.4 for 2050                     of May, June, and July. The GFDL model, for instance, shows the
                                                                   largest decrease of 17 percent in flooded area in the month of
for the A2 and B1 scenarios. The B1 scenarios                      May for the A2 scenario in the 2050s.
14                                                               E C O N O M I C S O F A D A P TAT I O N T O C L I M AT E C H A N G E


in the south and central parts of the country. The                        national rice production lost (Nicholls and Leath-
maximum observed increase in flooding occurs                              erman 1995). Sea level rise may also influence the
during May (about 50 percent) for the MIROC                               extent of the tides—currently the lower third of
model under the A2 scenario in the 2050s.                                 the country experiences tidal effects—and alter the
                                                                          salinity quality of both surface and groundwater.
Changes in temporal flood characteristics                                 Currently, because of the low topography in these
For each climate model/emission scenario, the                             coastal areas about 50 percent typically becomes
future and baseline hydrographs are compared at                           inundated during the annual monsoons.
36 locations across the country to determine the
changes in the temporal flood characteristics—                            Estimating the changes in area that will be inun-
annual peak values, onset, and recession dates of                         dated due to sea level rise is complicated by the
the flood. By the 2050s, many of the northern                             active river morphology. With over a billion tons
subregions show statistically significant increases                       of sediment being deposited in the alluvial fan of
in the annual peak, while many in the southwest                           Bangladesh (Goodbred and Kuehl 2000), a com-
show decreases.12 Across the subregions, most                             bination of accretion and erosion processes will
GCMs show earlier onset of the monsoon and                                work to both increase and decrease the land area
a delay in the recession of flood waters, driven                          available in the coastal areas. For instance, satel-
in large part by increased flows and flooding.13                          lite images from the coastal zone reveal that some
While the shifts are as large as 1–2 weeks across                         land areas have gained, while others have eroded
the models, year-to-year variations in the annual                         over the last several decades. In the Meghna Estu-
hydrograph are larger than the predicted changes                          ary specifically, about 86,000 ha of land were lost
in a number of cases, making them inseparable                             between 1973 and 2000 (MES 2001). The rela-
from the historical variability.                                          tive contribution of these competing processes is
                                                                          largely unknown and an area for future research.
Future sea level rise
Rising sea levels rise are one of the most critical                       Changes in the total flood land type area based
climate change issues for coastal areas. The Inter-                       on previous coastal zone modeling effort—using
governmental Panel on Climate Change (IPCC                                the MIKE21 two-dimensional estuary model
2007a) projected that an average rise of 9 to 88                          for the 15 cm, 27 cm, and 62 cm sea level rise
cm could be expected by the end of the century.                           scenarios—is shown in Table 2.4 (DEFRA 2007).
Recent projections suggest even more substantial                          Of a total 33,000 km2 in these coastal areas, over
rises (Allison et al 2009). Increasing temperatures                       half is annually flooded. The total flooded area
result in sea level rise by the thermal expansion of                      increases by 6, 10, and 20 percent for the three
water and through the addition of water to the                            sea level rise scenarios respectively. The south-
oceans from the melting of continental ice sheets.                        ernmost regions are expected to face the largest
A 1 meter sea level rise is estimated to impact 13                        increases in flooded area.
million people in Bangladesh, with 6 percent of

12	 Any observed change in average yearly peak levels must be
    considered in relation to this background variability. The baseline
    inter-annual variation is itself almost 0.5 m (average value of
    11.6 m).
13	 The baseline onset and recession dates are May 15 and Septem-
    ber 15. The onset (recession) date for a future scenario occurs
    when the water level reaches the same level as on the baseline
    onset (recession) date of May 15 (September 15). These are
    determined separately for each of the 16 locations for each of
    the climate models.
BA N G L A D E S H CO U N T RY ST U DY                                                                                    15


                    Table 2.4 Sea level rise impacts on flood land types 14
                    F0               F1               F2                  F3           F4        Flooded Area
                (0-30 cm)        (30-60 cm)       (60-90 cm)         (90-180 cm)   (180 + cm)   (F1+F2+F3+F4)    % of total
 Base                15,920             4,753            4,517             5,899        1,759           16,928          52
 15 cm               14,841             4,522            4,705             6,765        2,015           18,007          55
 27 cm               14,189             4,345            4,488             7,456        2,370           18,659          57
 62 cm               12,492             3,967            3,818             8,977        3,594           20,356          62


14	 Note that the flood land type classes used in DEFRA (2007) are
    slightly different than the MPO definitions.
16                                               TH REE
     E C O N O M I C S O F A D A P TAT I O N T O C L I M AT E C H A N G E
BA N G L A D E S H CO U N T RY ST U DY                                                                                  17


Tropical Cyclones
and Storm Surges


Bangladesh has been identified as the most vul-       timely. The urgency of doing so is only hastened
nerable country in the world to tropical cyclones     by the significant additional future risks that are
(UNDP 2004), with a severe cyclone striking Ban-      expected due to climate change. The Fourth
gladesh every three years on average (GoB 2009).      Assessment Report of the IPCC projects that cli-
Cyclone Sidr alone resulted in damages and losses     mate change is likely to increase the severity of
of $1.7 billion, or 2.6 percent of GDP in 2007,       tropical cyclones and storm surges over the 21st
primarily in the coastal region. The largest dam-     century (IPCC 2007b). For the Bay of Bengal,
ages from cyclones result from the storm surges       Unnikrishnan et al. (2006) report increases in the
they induce. Storm surge heights are typically less   frequency of the highest storm surges, despite no
than 10m, but Bangladesh has experienced surges       significant change in the frequency of cyclones.15
in excess of 10m in some areas on occasion. A
surge can be even more devastating if it makes        In the absence of additional preventive measures,
landfall during high tide.                            future storm damage risk in Bangladesh is likely
                                                      to be larger because of expansion of the vulner-
Faced with significant cyclone and storm surge        able zone further inland, increase in the areal
risk, Bangladesh has invested over $10 billion        extent of inundation, and increased inundation
during the past 35 years on disaster risk mitiga-     depths during each cyclonic event. Actual future
tion measures—both structural (polders, cyclone       damages are also expected to increase in line with
shelters, cyclone resistant housing) and non-struc-   the projected increase in the assets and activities
tural (early warning dissemination and awareness      that are located in the inundated areas, and with
raising)—and enhanced its disaster preparedness       how well they are protected from these risks.
system to address unavoidable risks (GoB 2009).
These measures have significantly reduced the loss    This chapter starts with a brief review of the
of life and livelihoods and property damage from      past experience of cyclones and storm surges in
these extreme events.                                 Bangladesh, followed by a review of the major
                                                      adaption measures that are currently in place
Nevertheless, given the significant large dam-        to reduce the risk. The third section provides an
ages from Cyclone Sidr, examining the adequacy
of existing measures and the cost effectiveness       15	 These results are based on dynamic models driven by climate
of taking additional risk mitigation measures is          projections from regional climate models.
18                                                              E C O N O M I C S O F A D A P TAT I O N T O C L I M AT E C H A N G E


overview of the five-step methodology used to                            The largest adverse impacts of a cyclone occur
assess the potential damages from storm surges                           from the inundation resulting from the storm
and the adaptation costs that would need to be                           surges that cyclones induce in coastal regions.
incurred to prevent these damages. The first step                        The Meghna estuarine region is the area where
is to define the inundation risk exposure zones                          most of the surge amplifications occur. Bangla-
for the baseline and climate change scenarios in                         desh is on the receiving end of about 40 percent
2050. The next three steps are to characterize the                       of the impact of total storm surges in the world
assets and activities that are exposed to inundation                     (Murty and El Sabh 1992). The reasons for this
risk, potentially affected during a single cyclonic                      disproportionately large impact of storm surges
event and to estimate the potential damages and                          on the coast of Bangladesh were reported (Ali
losses that would be incurred. The last step is to                       1999) to be the following: (a) recurvature of tropi-
estimate the adaptation cost that would have to                          cal cyclones in the Bay of Bengal; (b) a shallow
be incurred to prevent these damages. The final                          continental shelf, especially in the eastern part of
section of the chapter discusses the implications                        Bangladesh;17 (c) high tidal range;18 (d) the trian-
of the analysis for prioritizing adaptation actions                      gular shape at the head of the Bay of Bengal;19
in the context of Bangladesh’s development and                           (e)almost sea-level geography of the Bangladesh
climate change strategy.                                                 coastal land; and (f) the high density of popula-
                                                                         tion and coastal protection system.

Historical Vulnerability                                                 Table 3.1 presents surge inundation character-
to Tropical Cyclones and                                                 istics for cyclones of varying strength in Ban-
                                                                         gladesh as documented by the MCSP (1993).
Storm Surges                                                             While historical (time series) records of storm
                                                                         surge height are scarce in Bangladesh, the exist-
UNDP has identified Bangladesh as the most vul-                          ing literature suggests typical storm surge height
nerable country in the world to tropical cyclones                        during severe cyclones is between 1.5 and 9.0
(UNDP 2004). Cyclones hit the coastal regions                            meters. Storm surge heights in excess of 10 m
of Bangladesh almost every year, in early sum-                           are less common, but occasional references are in
mer (April–May) or late rainy season (October–                           the literature.20 A surge can be even more devas-
November). A severe cyclone strikes Bangladesh                           tating if it makes a landfall during high tide. In
every three years on average (GoB 2009). Between                         general, it has been observed that the frequency
1877 and 1995, Bangladesh was hit by 154                                 of a wave (surge plus tide) along the Bangladesh
cyclones, including 43 severe cyclonic storms, 43                        coast with a height of about 10 meters is approxi-
cyclonic storms, and 68 tropical depressions.16                          mately once in 20 years, and the frequency of a
Since 1995, five severe cyclones hit the Bangla-
desh coast in May 1997, September 1997, May                              17	 A wide continental shelf, especially off the eastern part of
                                                                             Bangladesh, characterizes the coastline of Bangladesh. This
1998, November 2007, and May 2009.                                           wide shelf amplifies the storm surges as the tangential sea-level
                                                                             wind-stress field associated with the tropical cyclone pushes the
                                                                             seawater from the deepwater side onto the shelf. Being pushed
                                                                             from the south by wind stress, the water has no place to go but
                                                                             upwards, which is the storm surge.
16	 The Indian Meteorological Department (IMD) is responsible for
    tracking tropical storms and cyclones in South Asia, including the   18	 Records from the Sandwip Channel indicate high tides of 7–8 m.
    Bay of Bengal. The IMD classifies tropical storms based on the
                                                                         19	 The triangular shape at the head of the Bay of Bengal helps to
    observed maximum sustained surface wind measured at a height
                                                                             funnel the seawater pushed by the wind toward the coast and
    of 10m and averaged over 3 minutes as follows: Super Cyclonic
                                                                             causes further amplification of the surge.
    Storm (greater than 220 km/hour), very severe cyclonic storm
    (119–220 km /hour), severe cyclonic storms (90–119 km/hour),         20	 The 1876 Bakerganj cyclone had the highest reported surge
    cyclonic storms (60–90 km/hour), Deep depression (51–59 km/              height of 13.6 meters. More recently, the 1970 cyclone had a
    hour), Depression (32–50 km/hour) (IMD 2010).                            reported height of 10 meters (SMRC 2000).
BA N G L A D E S H CO U N T RY ST U DY                                                                                     19


 Table 3.1 Typical storm surge characteristics for cyclones in Bangladesh
      Wind Velocity (km/hr)              Storm Surge Height (m)           Limit to inundation from the coast (km)
                85                                1.5                                            1.0
                115                               2.5                                            1.0
                135                               3.0                                            1.5
                165                               3.5                                            2.0
                195                               4.8                                            4.0
                225                               6.0                                            4.5
                235                               6.5                                            5.0
                260                               7.8                                            5.5
 Source: MCSP, 1993


wave with a height of about 7 meters is approxi-        workers. Residents have also complemented these
mately once in 5 years (MCSP 1993). In addition         public measures with private actions that reduce
to these exceptional surges, waves caused by wind       their own personal risks through the construction
also occur; the dimensions depend on wind speed         of cyclone-resistant housing and migrating fur-
and direction, water depth, and duration of wind        ther inland away from more vulnerable low-lying
blowing over the bay. It has been observed that         and coastal areas, when feasible.21 The rest of this
wind-induced waves of up to 3.0 m in height may         section contains a brief summary of the current
occur under unfavorable conditions in the coastal       status of these adaptation measures.
regions (MCSP 1993).
                                                        Embankments: Bangladesh started a program
                                                        to create polders through the construction of
Adaptation Measures                                     embankments around 1960. Currently there are
Currently in Place                                      123 polders formed by 5,017 km of embank-
                                                        ments, of which 957 km enclose 49 sea-facing
                                                        polders, and the remaining 4,060 embankments
Faced with a significant chronic risk from storm        enclose 74 interior polders. These embankments
surges induced by cyclones, the government of           protect around 1.5 million ha of land, of which
Bangladesh—with the support of its development          0.8 million ha is cultivable land. Drainage is facili-
partners—has put in place both a set of risk miti-      tated by 1,347 regulators and 5,932 km of drain-
gation measures as well as a disaster preparedness      age channels. Figure 3.1 shows the location of the
program. These include structural risk mitigation       existing polders. They have protected the densely
measures, such as the construction of polders,          populated coastal areas of Bangladesh. No pol-
cyclone shelters, and cyclone-resistant infrastruc-     ders are currently in place in areas that are less
ture; and non-structural measures, such as an early     populated and where there is limited economic
warning dissemination system, education, and            activity, including the Sundarbans and the numer-
raising awareness among residents and stakehold-        ous small islands. The Bangladesh Water Devel-
ers. Toward better preparation for the unavoid-         opment Board (BWDB) maintains an extensive
able disasters, the government has also developed
                                                        21	 Unlike most other countries, the population growth rate in
community-based disaster preparedness plans,                coastal areas of Bangladesh is smaller than the national average,
including training of relevant community                    indicating slower net migration to these areas.
20                                                          E C O N O M I C S O F A D A P TAT I O N T O C L I M AT E C H A N G E


                  Figure 3.1 Location of coastal polders in Bangladesh


Source: CDMP


database of coastal polders, which includes infor-                   Experts at BWDB, IWM, and CEGIS indicated
mation on the length, location, construction year,                   four reasons for breached embankments during
and cost of each polder. 22                                          past cyclones:

While embankments have effectively protected pol-                    a)	 Overtopping is the most important factor for
ders against storm surges during most cyclones, some                     embankment collapse. Rapid and deep scours
of the embankments have been breached, particu-                          form on the country side slope of the embank-
larly during the more severe cyclones. For instance,                     ment after it has been overtopped. The pro-
a large section of the Patenga embankment was                            cess rapidly weakens the structure and leads
washed away during the 1991 cyclone, and some                            to its collapse.
inland embankments breached during Cyclone Sidr
in 2007. Some embankments even breached during                       b)	 Toe erosion is another major reason for weak-
the mid-size Cyclone Aila in 2009.                                       ening of an embankment. Regular tidal wave
                                                                         action and occasional cyclone-related water
22	 In addition, information on riverbank and shoreline protection       surge exerts tremendous hydrological load
    and re-sectioning of embankment works has been extracted             on the embankments, causing damage to the
    from the Coastal Embankment Rehabilitation Project (CERP)
    and South-Eastern Zone-Chittagong, South-Western Zone-               structure, thus weakening them and making
    Faridpur, and Southern zone-Barishal maintained by the BWDB.         them prone to collapse.
    It includes information on the ongoing projects, construction
    period, and cost.
BA N G L A D E S H CO U N T RY ST U DY                                                                                   21


c)	 Slope Erosion from natural causes such as pre-                    and evacuation system that has saved thousands
    cipitation, piping action, poor design (e.g.                      of lives during recent cyclones. The system is a
    insufficient setback), substandard construc-                      partnership between civil society organizations,
    tion, inadequate compaction, and activities of                    the private sector, and multiple levels of govern-
    rats and earthworms has been another factor                       ment. The Bangladesh Meteorological Depart-
    resulting in damaged embankments.23                               ment tracks tropical storms in close collaboration
                                                                      with other regional organizations and issues alerts
d)	 Inadequate O&M has also been responsible for                      of impending cyclone and storm surges for dif-
    the collapse of some embankments. Shortage                        ferent geographic areas. Newspapers, television
    of resources has restricted even routine O&M                      channels, and radio stations broadcast the warn-
    of existing embankments, making them                              ings, and the local government administration
    weaker and susceptible to collapse.                               and the local Cyclone Preparedness Program
                                                                      (CPP) volunteers run by the Red Crescent Society
Foreshore Afforestation: Foreshore afforesta-                         lead the evacuation.
tion has proven to be a cost effective method to
dissipate wave energy and reduce the hydraulic                        The Current Cyclone Preparedness Program cov-
load on embankments during storm surges. This                         ers 32 of 51 upazilas/thanas that are exposed to
was evident during the 1991, 2007(Sidr), and                          cyclones and storm surges. This subset of upazil-
2009 (Aila) cyclones. The virtual absence of man-                     las faces a combination of cyclone risk, salinity,
grove forests in Chokoria and surrounding areas                       and tidal water movement above critical levels
resulted in large damages to property and loss of                     (Islam et al 2006) Recently these efforts have
lives in 1991 (BCAS 1992). In contrast, even scat-                    been decentralized, including the establishment
tered and unplanned forestation on the foreshore                      of a forward operation center with a govern-
of embankments affected by the 2007 Cyclone                           ment-appointed commander in chief to oversee
Sidr substantially broke the storm surge velocity,                    relief and early recovery operations. Coordina-
reducing damages and losses (GoB 2008).                               tion of relief operations at the local, regional,
                                                                      and national levels has been greatly enhanced
 Officials from the Department of Forests, GoB,                       through (a) the use of high frequency (HF) trans-
and experts from the Institute of Water Modeling                      ceiver radios for long-distance communication
(IWM) have recommended planting mangrove                              between Dhaka headquarters and field stations;
forests with a minimum width of 500 meters as                         (b) very high frequency (VHF) transceiver radios
a cost-effective method to protect embankments                        for short-distance communication between field
in front of sea-facing polders. Currently, approxi-                   stations and substations located at union/isolated
mately 60 km of the total 957 km of embank-                           islands; and (c) cell phones as an emergency com-
ments along sea facing polders are protected by                       munications system. By locating the coordination
mangrove forests. These include some forest belts                     of these operations closer to the affected popula-
that are degraded.                                                    tion, the decentralization of relief operations has
                                                                      improved their timeliness and effectiveness, as
Early Warning and Evacuation System: Ban-                             evidenced during Cyclone Sidr.
gladesh has put in place an effective early warning
                                                                      Pre-positioning of emergency relief materials and
                                                                      life-saving drugs and medical supplies played an
23	 Sometimes, local people have cut the embankments to let saline
    water in for their shrimp farms located behind the embankments.   increasingly important role in quickly initiating
    Even after repair, the section remains weak and vulnerable to     relief and rehabilitation activities during Sidr. For
    breaching. Prevention entails improved institutions and gover-
    nance that are compatible with local needs.                       example, detailed and written instruction exists
22                                             E C O N O M I C S O F A D A P TAT I O N T O C L I M AT E C H A N G E


regarding what relief materials and medical sup-       with the capacity to serve 2.8 million people, or
plies to preposition in and around possible storm-     7.3 percent of the coastal population.24 These are
surge-impacted areas. Before the landfall of Sidr,     essentially brick buildings on concrete stilts. An
national and international NGOs pre-positioned         additional 924 schools constructed under Primary
staff and relief materials closer to the forecasted    Education Development Programme, Phase II
impact areas. This action had a strong positive        (PEDP-II) with open ground floor structures have
impact, as access to hard-hit places became quite      also been used as shelters, even though they are
difficult and pre-positioned staff along with relief   not suitable as shelters.25
materials were already on the field to start relief
operations shortly after the cyclone was over.         Figure 3.2 shows the location of existing cyclone
                                                       shelters. The shelter construction program has
While the effectiveness of the EWES has                been reactive, with construction following the
improved over the years, consultations with            occurrence of major disasters.26 The east coast
experts indicate scope for improvement in three        (Noakhali, Chittagong, Cox’s Bazar, and Feni)
areas: (1) geographic precision of warnings, (2)       has a greater concentration of shelters than the
communication of warnings in local dialects to         west coast.
increase reach, and (3) greater awareness about
the importance of timely evacuation. BMD alerts        The government has an active program to con-
for impending cyclones currently cover a large         struct additional cyclone shelters. While reli-
section of the coastal zone, due to the limited geo-   able estimates of the number of shelters under
graphic precision with which storm forecasts can       construction or being planned are not available
be made. Repeated evacuations in areas that ulti-      because of the multitude of government agencies
mately do not experience a storm lead to a grad-       and NGOs undertaking this effort, they are likely
ual erosion of faith in the early warning system.      to be in the thousands eventually.27 The consensus
Improved precision in forecasting, especially in       among experts in these institutions and the rel-
the landfall location and location-specific inunda-    evant government agencies is that an additional
tion depth, is currently feasible and can enhance      2,000–2,500 cyclone shelters need to be built.
the effectiveness of the EWES. Additionally, Red       The attractiveness of investing in multi-purpose
Crescent Society officials, CPP volunteers, and        cyclone shelters is partly due to the immediate and
residents of major cyclone-affected areas indi-        ongoing benefits that they provide as a primary
cated the importance of broadcasting warnings          school or office. The newer designs are starting to
in resident-friendly local dialects to ensure timely   accommodate user concerns with the inclusion of
evacuations. Finally, the CPP volunteers and resi-
dents of cyclone-affected areas noted higher fatal-
                                                       24	 Cyclone shelters built in the early 1970s were designed to shelter
ity rates among residents that ignored/resisted/           people from cyclones but were later also used for other purposes
delayed evacuation and stressed the importance             such as primary schools. An additional 262 shelters are not
                                                           usable and 88 have been washed away, destroyed, or dismantled.
of raising awareness about the importance of
                                                       25	 Data and information on existing cyclone shelters are from the
timely evacuation.                                         IWM and CEGIS, compiled from the Public Works Depart-
                                                           ment (PWD), LGED, Education Engineering Department, Red
                                                           Crescent Society, donor agencies, NGOs, and local experts.
Cyclone Shelters: Cyclone shelters have pro-           26	 Cyclone shelters were built in Bhola and Potuakhali after the
tected human lives and livestock in the coastal            1970 cyclone; in Anwara, Banshkhali, and Cox’s Bazar after the
                                                           1991 cyclone; and in the southwest region after the 2007 cyclone.
region of Bangladesh during past cyclones,
                                                       27	 ADB, with support from other development partners, is building
including Cyclone Sidr, when 15 percent of the             398 cyclone shelters for completion by June 2011. The World
affected population took refuge in shelters (GoB           Bank is currently constructing 50 shelters, along with 30 killas.
                                                           The Islamic Development Bank is reviewing proposals to con-
2008). There are currently 2,591 usable shelters           struct another 800 cyclone shelters.
BA N G L A D E S H CO U N T RY ST U DY                                                                                        23


               Figure 3.2 Location of cyclone shelters in coastal areas


Source: CDMP


elevated space for livestock and overhead water    interviews with residents of cyclone-affected
storage, making them potentially more effective.   areas revealed that willingness to use shelters dur-
The cost of constructing a multipurpose shelter    ing an emergency would increase if shelters (a)
varies with its capacity and its non-emergency     were easier to access, (b) were located closer to
purpose and usage. For instance, multipurpose      residents’ homes, (c) were less crowded, (d) had
shelters under construction in a World Bank        separate facilities for women, (e) had facilities for
project in the aftermath of Cyclone Sidr have a    people with disabilities, (f) had sanitation facilities
capacity to accommodate 1,600 people and are       above the ground floor, and (g) had facilities to
expected to cost $214,000, or about $134/person    protect livestock.28
accommodated.
                                                   28	 Shelters with separate facilities for women (35 percent); facilities
CEGIS (2004) examined the effectiveness of             for people with disabilities (less than 5 percent); sanitation facili-
                                                       ties (5 percent), facilities to protect livestock (20 percent), facilities
cyclone shelters in saving lives. Focus group          with only ground floor toilets (1,000).
24                                              E C O N O M I C S O F A D A P TAT I O N T O C L I M AT E C H A N G E


      Figure 3.3 Population density in coastal areas in relation to areas
                                        of inundation risk


Source: CEGIS


The number of cyclone shelters needed in an area        residents prefer to reside in pucca houses partly to
depends on the population and housing charac-           reduce their own risk. A review of Census data
teristics of the area. While pucca houses (brick and    from coastal areas indicates that nearly all fami-
concrete) can structurally withstand most of the        lies with an annual income level of $470 live in
wind damages from the average severe cyclone,           pucca houses. Significant increases in income lev-
they provide no remedy for inundation from              els expected over the next few decades should
storm surges. Pucca houses can effectively substitute   result in an increasing proportion of residents liv-
for cyclone shelters in areas with inundation depth     ing in pucca houses and decreasing the need for
of less than 1 meter. In contrast, cyclone shelters     cyclone shelters. Nevertheless, the need for shel-
are necessary to protect inhabitants living in single   ters will remain for residents residing in single-
story dwellings that can potentially be exposed to      story houses in areas with projected inundation
inundation depths in excess of 3 meters.                depth that exceeds 3 meters.

Cyclone Resistant Housing: During past                  Inland Migration: Finally, unlike most other
severe cyclones, thatched and kachha houses have        countries, households and economic activity
often been completely damaged. In contrast,             have accounted for the increased perceived risk
pucca houses have remained structurally intact,         from storm surges by locating themselves further
primarily incurring damages to the plaster on the       inland as evidenced by the slower rate of growth
exterior walls and the contents within. Coastal         in the coastal population compared to the rest
BA N G L A D E S H CO U N T RY ST U DY                                                                                          25


             Table 3.2 Economic indicators Bangladesh: Current and 2050
                                             Current Indicators                              Indicators in 2050
         Indicator               Value        Year       Source/comments         Value               Source/comments
 Population (million)          130          2001        BBS                     228        BBS
 Population average            1.58         1991-01     State of the Coast,     1.15%      BBS & State of the Coast, 2006
 annual growth rate                                     2006                               (replacement fertility in 2021)
 Coastal population            35           2003        State of the Coast,     58         BBS & State of the Coast, 2006
 (million)                                              2006
 Coastal population            1.36%        1991-01     State of the Coast,     1.05%      BBS & State of the Coast, 2006
 average annual growth                                  2006
 rate
 GDP (billions of con-         $75          2007        WDI 2009                $1,614     Projected with growth rates in the
 stant 2009 USD)                                                                           following row.
 GDP avg. annual               5.9%         2001-09     Ministry of Finance     7.5%       Various government
 growth rate                                                                               announcements
 Per capita GDP (con-          $470         2007        WDI 2009                $6,395     Implied
 stant 2009 USD)
 Road length (km)              272,487      2007        BBS                     340,609    Assumed 25% expansion
 Share of paved roads          30%          2007        BBS                     100%       Assumed
 Primary school net            91%          2007        Ministry of             100%       WDI 2009, average level in com-
 enrollment rate                                        Education                          parator countries *
 Secondary school gross        43%          2007        Ministry of             70%        WDI 2009, average level in com-
 enrollment rate                                        Education                          parator countries *
 Per capita electricity        150          2007        BBS                     3000       WDI 2009, average level in com-
 consumption (KWh)                                                                         parator countries *
 Share of pucca houses         2.23%        2001        BBS                     98%        current housing characteristics in
 in rural areas                                                                            Bangladesh by income level
 Rice production               27           2006        BBS                     75         Yu et al, 2010, existing climate
 (million metric tons)                                                                     variability scenario

 Notes: Current per capita GDP in comparator countries: Brazil($5,860), Malaysia($6,420), Lebanon($5,800), and Uruguay($6,390).
 Source : World Development Indicators, World Bank


of the country. It can also be observed from the                      change against the counterfactual baseline scenario
population density maps, which shows increasing                       that does not include climate change. The analysis
density further inland (Figure 3.3). 29                               is based on simulating average severe cyclones with
                                                                      a ten-year return period, which enables a more pre-
                                                                      cise definition of the baseline scenario. This choice
Estimating Potential Damage                                           also results in a more conservative estimate of dam-
and Adaptation Cost                                                   ages and costs as it ignores the more intense but less
                                                                      frequent storms that may occur during this period.
                                                                      The potential damages and the cost of adaptation
The additional potential damage from storm surges                     are determined separately for each scenario in the
and the cost of adaptation in 2050 are determined                     following 5-steps: (1) demarcate inundation risk
by comparing the damages and costs under climate                      exposure zones from storm surges; (2) identify assets
                                                                      and activities exposed to inundation risk; (3) deter-
29	 The inundation zones computed in the next sections for the
                                                                      mine assets and activities affected in a single cyclone;
    baseline and climate change scenario are also shown.              (4) estimate potential damage and loss from a single
26                                                E C O N O M I C S O F A D A P TAT I O N T O C L I M AT E C H A N G E


cyclone; and (5) estimate adaptation measures and         historical levels due to climate change. Future
costs necessary to mitigate inundation risk.              storms tracks cannot be predicted with any degree
                                                          of precision. Cyclone-related risks under the cli-
Economic Development Baseline: Both assess-               mate change scenario are developed collectively
ments are completed under a common projected              by simulating a set of five storms that span the
development baseline that builds on recent economic       entire Bangladesh coastline (see Annex 2). Simula-
trends and extends them to 2050 based on normal           tions of the 1974, 1988, 1991, and 2007 cyclones
economic development patterns. Table 3.2 summa-           indicated that these cyclones adequately cover the
rizes the key changes in the Bangladesh economy           Sunderban coast, southwestern coat (Sunderban
between now and 2050, which includes 53 percent           to Patuakhali), the Bhola and Noakhali coast in
more people, more than a twenty-fold increase in          the Meghna Estuary, and the eastern coast (Shita-
GDP, and decreased dependence on agriculture.             kunda to Bashkhali). In addition, a fifth hypothet-
The people of Bangladesh are expected to be nearly        ical track was simulated to cover the remaining
ten times richer, consuming twenty times more elec-       Sandwip coast and the part of the Noakhali and
tricity per person, living in pucca houses, and enroll-   Chittagong coasts at the central region of the
ing all primary-aged children in schools.                 Meghna Estuary. The inundation risk exposure
                                                          for the climate change scenario is developed from
Inundation risk exposure zones                            simulations combining these five cyclones with
Inundation risk exposure in an area is character-         the Bay of Bengal hydrodynamic model. Each
ized by the maximum potential inundation depth            of the simulations is based on the following three
that may occur for any of the simulated storms            assumptions about the increasing intensity of an
under a scenario. Two scenarios are developed: (1)        average 10-year return period cyclone brought
a climate change scenario, and (2) a baseline sce-        about by climate change by 2050.
nario that is used as a counterfactual to determine
additional risk exposure due to climate change.           ■■   A rise in sea level of 27cm (UK DEFRA 2007).
                                                          ■■   An increase in wind speed by 10 percent rela-
Baseline Risk Scenario: The 19 cyclones that                   tive to Cyclone SIDR.
made landfall in Bangladesh between 1960 and              ■■   Landfall occurs during high tide.30
2009 collectively define the current cyclone-
related risks in Bangladesh. Detailed information         Inundation risk exposure for each scenario is
about each of these historical cyclone tracks is          determined in three steps. First, the extent and
available in Annex 1. These storms on average             depth of inundation associated with each cyclone
have a return period of 10 years and span the             (nineteen for the baseline and eight for the cli-
entire coastal region of Bangladesh. The baseline         mate change scenario) is determined based on
inundation risk exposure is developed from simu-          simulations using the cyclone model and the two-
lations combining these 19 historical cyclones            dimensional Bay of Bengal model.31 (A detailed
with their corresponding observed wind and pres-          description of the model is provided in Annex
sure fields with the Bay of Bengal hydrodynamic
model. This scenario is the counterfactual against
                                                          30	 Since scientific evidence to date points toward an increase in the
which future climate change risk is measured, but             frequency of intense cyclones in the Bay of Bengal, the prob-
is also useful to assess the current inundation risk          ability of a potential landfall during high tide will also increase.

that Bangladesh faces.                                    31	 The Bay of Bengal model is a hydrodynamic model based on the
                                                              Mike 21 hydrodynamic modeling system. Its domain covers the
                                                              coastal region of Bangladesh up to Chandpur and the Bay of
Climate Change Risk Scenario: Storm-surge-                    Bengal up to 16º latitude. It was recently updated and upgraded
                                                              under the Comprehensive Disaster Management Program
related risk is expected to increase from these               (CDMP) of Bangladesh (UK DEFRA 2007).
BA N G L A D E S H CO U N T RY ST U DY                                                                   27


           Figure 3.4 Inundation risk exposure map—baseline scenario


1.) Second, for each grid point, the inundation       scenarios respectively. They do not show inundation
depth results from each of the cyclone simula-        levels for a single cyclone, rather they indicate the
tions for the scenario are combined together to       largest inundation risks from any of the simulated
determine the highest inundation depth for all        cyclones. So, the baseline scenario map shown in
simulated cyclones under that scenario. All of        Figure 3.4 reflects the largest inundation risk that a
the simulations are based on the existing set of      specific location has faced since 1960.
coastal protection infrastructures (embankments,
and polders). Finally, for the subsequent eco-        The inundation risk exposures under the two sce-
nomic analysis, risk exposure zones are formed by     narios are summarized in Table 3.3. Under the
grouping grid points into one of three inundation     baseline scenario, inundation depth is greater
levels (0–1 m, 1–3 m, and more then 3m).              than 1 meter under at least one of the cyclone
                                                      tracks for 20,876 square kilometers of land, and
Figure 3.4and Figure 3.5 show the inundation risk     is greater than 3 meters for 10,163 square kilo-
exposure map of Bangladesh, as measured by the        meters. Under the climate change scenario, the
potential maximum inundation depths from the sim-     inundation depth increases for areas already
ulations, under the baseline and the climate change   inundated in the baseline scenario. In addition,
28                                               E C O N O M I C S O F A D A P TAT I O N T O C L I M AT E C H A N G E


      Figure 3.5 Inundation risk exposure map—climate change scenario


areas further inland become inundated. The net           and activities map using geographic information
result is an increase of 14 percent in the areas         system (GIS) software to determine the assets
inundated by more than 1 meter and an increase           and activities that are exposed to inundation risk
of 69 percent in the areas inundated by more             under each scenario.
than 3 meters.
                                                         The assets and activities considered for the
Assets and activities exposed to                         analysis include housing (by building material
inundation risk                                          type), education institutions, growth centers,
The current spatial distribution of assets and           mills/ factories (large scale), national highways,
activities provides the starting point for identifying   regional highways, feeder roads (type A), feeder
assets and activities that are exposed to inundation     roads (type B), bridges, power plants, power
risk in 2050. Expected changes in the Bangladesh         transmission lines, deep tubewells, mosques,
economy—including growth in population and               temples, historical places and tourist destina-
income and structural shifts in the economy—are          tions, land by crop suitability, and population by
applied uniformly to project the expected assets         socioeconomic status.
and activities in 2050 (see Table 3.2). The inun-
dation exposure risk zones for the baseline and          The best available spatially disaggregated maps
climate change scenarios are overlaid on the asset       and data for these activities are available from
BA N G L A D E S H CO U N T RY ST U DY                                                                               29


               Table 3.3 Potential Inundation Risk Exposure Area (sq km)
          Inundation Risk Exposure (Depth)           Baseline Scenario       Climate Change Scenario    Percent Change
 More than 1 m                                                      20,876                     23,764           + 14%
 More than 3 m                                                      10,163                     17,193           + 69%


               Table 3.4 Population exposed to inundation risk (million)
                                      Baseline      Baseline        Percent Change    Climate Change    Percent Change
    Inundation Risk Exposure          Scenario      Scenario           between         Scenario 2050        between
             (Depth)                  2007 (a)      2050 (b)          (a) and (b)           (c)            (b) and (c)
 More than 1 m                               18.5           28.3             + 53%               35.3            +25%
 More than 3 m                                8.9           13.5              +53%               22.6            +67%


                       Table 3.5 Road exposed to inundation risk (km)
                                      Baseline      Baseline         Percent Change       Climate       Percent Change
    Inundation Risk Exposure          Scenario      Scenario             between      Change Scenar-        between
             (Depth)                  2007 (a)      2050 (b)            (a) and (b)     io 2050 (c)        (b) and (c)
 0 -1 m                              3,198          3,988           + 25%             10,466            +162%
 More than 1 m                       7,177          8,972           +25%              10,553            +18%
 All inundated                       10,375         12,969          +25%              21,019            +62%


various public sources, including Bangladesh Rail-                 Under the baseline scenario, of the 35 million
ways, the Bangladesh Water Development Board,                      coastal residents in 2007, nearly half are exposed
the Local Government Engineering Department                        to inundation risk depth of more than 1 meter
(LGED), the Center for Environmental and                           and about a quarter are exposed to inundation
Geographic Information Services (CEGIS), the                       risk of over 3 meters (Table 3.4). Expected popula-
Public Works Department, the Roads and High-                       tion growth between 2007 and 2050 increases the
ways Department, the Water Resources Planning                      number of exposed people by 53 percent within
Organization, and the World Bank.                                  each risk zone. With the additional risk of inun-
                                                                   dation under the climate change scenario, about
The assets and activities exposed in each inun-                    35 million coastal residents are exposed to inun-
dation risk zone are determined using one of                       dation of more than 1 meter; nearly two-thirds of
three methods. For most assets, such as schools,                   them are exposed to inundation of more than 3
the exposure estimate is a count of the number                     meters. In the absence of added protective mea-
of assets located in that risk zone. For assets with               sures, the combined effects of population growth
a large spatial extent, the exposure estimate is                   and climate change nearly doubles the population
measured by the spatial extent (land surface and                   exposed to inundation risk of more than 1 meter,
agriculture extent in square kilometers, roads                     and increases those at risk of inundation of more
and railways in kilometers). Finally, the exposed                  than 3 meters by two-and-a half times by 2050.
population count is estimated at the thana level,
which is the lowest administrative unit, using the                 Similarly, under the baseline scenario, of over
population density and the total area that falls                   272,487 kilometers of roads in Bangladesh in 2007,
into each risk zone. The total exposed popula-                     about 4 percent are exposed to inundation risk, of
tion count is the sum of the exposed population                    which about 70 percent are exposed to inundation
across thanas.                                                     risk of more than 1 meter (Table 3.5) Bangladesh
30                                             E C O N O M I C S O F A D A P TAT I O N T O C L I M AT E C H A N G E


       Figure 3.6 Population under povery in relation to inundation risk


Source: CEGIS


already has one of the highest road densities in the   and are discussed separately in detail in the next
world and there is limited room for expansion of       section as part of the damage estimation. While
the road network. The road network is assumed to       the method remains the same, there are signifi-
expand by 25 percent between now and 2050 or           cant differences in the growth rate of assets and
about 0.5 percent per year, with most of the effort    activities between 2007 and 2050. Additionally,
expended on strengthening the existing roads by        in cases when detailed spatial data was not avail-
paving and or raising them. With the additional        able for a specific asset, the additional risk due
risk of inundation under the climate change sce-       to climate change is based on changes in the
nario, over 21,000 km of roads are exposed to          exposed population (housing, power consump-
inundation, of which about half are exposed to         tion) or changes in the inundation risk area
inundation of more than 1 meter. In the absence        (power infrastructure).
of added protective measures, the combined effects
of expansion in the road network and climate           Assets and activities potentially
change nearly doubles the roads exposed to inun-       affected during a single storm
dation risk by 2050. The largest inundation risks      Without additional risk mitigation measures,
also occurs in areas which have the largest share of   affected assets and activities can be damaged if
the poor under both scenarios (Figure 3.6)             they are in the path of a storm. The assets and
                                                       activities affected in a single storm depend on
The other assets and activities exposed to inun-       the areal extent of the storm. The average severe
dation risk are determined in a similar manner,        cyclone with a 10-year period under the baseline
BA N G L A D E S H CO U N T RY ST U DY                                                                                               31


   Table 3.6 Area affected in a single cyclone with a 10-year return period
                                                              (sq km)
         Inundation Risk Exposure (Depth)                   Baseline Scenario        Climate Change Scenario    Percent Change
 More than 1 m                                                               5,428                    10,219                + 88%
 More than 3 m                                                               2,642                     7,393               + 180%


    Table 3.7 Population affected in a single cyclone with a 10-year return
                                                     period (millions)
                                             Baseline       Baseline        Percent Change   Climate Change      Percent Change
     Inundation Risk Exposure                Scenario       Scenario           between        Scenario 2050          between
              (Depth)                        2007 (a)       2050 (b)          (a) and (b)          (c)              (b) and (c)
 More than 1 m                                      4.8              7.4             + 53%               15.2              +107%
 More than 3 m                                      2.3              3.5              +53%                9.7              +177%


  Table 3.8 Roads affected in a single cyclone with a 10-year return period
                                                                    (km)
                                                            Baseline        Percent Change   Climate Change      Percent Change
      Inundation Risk Exposure                Sidr          Scenario            between       Scenario 2050          between
               (Depth)                      2007* (a)       2050 (b)           (a) and (b)         (c)              (b) and (c)
 0 -1 m*                                    6,361           1,039           n/a              4,500              +333%
 More than 1 m*                             1,714           2,333           n/a              4,538               + 95%
 All inundated                              8,075           3,372           n/a              9,038               +168%

 * The affected roads for Sidr and the baseline scenario are not directly comparable. For Sidr 2007, the affected roads categories
 reported are partially damaged and fully damaged roads instead of inundation depth.


scenario affects 26 percent of the exposed area.32                         activities within each sector that are exposed
In contrast, 43 percent of the exposed area is                             and affected can be significantly different than
affected by the more intense cyclones under the                            the mix of roads that are damaged. For instance,
climate change scenario. The combined effects                              in the case of roads, unpaved roads accounted
of the larger inundation risk exposed area and                             for nearly 78 percent of the total kilometers of
the increased aeral extent during a single storm                           damaged roads during Cyclone Sidr. They can
increases the areas inundated more than 1 meter                            be damaged by even low levels of inundation
by 88 percent and areas inundated more than 3                              (Table 3.8).
meters by 180 percent (Table 3.6).
                                                                           Potential damage and loss
Similarly, the potential affected population liv-                          during a single cyclone
ing in these respective areas increases by 107                             Potential damages and losses in each of the major
percent and 177 percent respectively (Table                                economic sectors resulting from induced storm
3.7). The other assets and activities affected in                          surges from a single-cyclonic event are computed
a single storm also depend on the areal extent                             for the baseline and the climate change scenarios.
of the storm. However, the mix of assets and                               They are determined by applying sector-specific
                                                                           damage and loss functions to the affected assets
32	 The extent of inundation includes areas with inundation depth
                                                                           and activities in the sector.
    of 1 m or more.
32                                                             E C O N O M I C S O F A D A P TAT I O N T O C L I M AT E C H A N G E


     Table 3.9 Damages and losses during a single Super cyclonic storm by
                                                      economic sector
                                                                                                            Damages & Loss
      Economic Sector                  Damages and Losses (Cyclone Sidr)                                (Average Severe Cyclone)
                                    (Current          (Constant 2009            Share of                        (Constant
                                   Million USD)         Million USD)            total (%)                    2009 Million USD)
Housing                                        839                     978              50                                                      900
Agriculture                                    438                     510              26                                                      469
Transport                                      141                     164                8                                                     151
Water Resource Control                          71                      83                4                                                      83
Education Infrastructure                        69                      80                4                                                      73
Industry/ Commerce/                             52                      61                3                                                      56
Tourism
Urban and municipal                             25                      29                2                                                      27
Power                                           14                      16                1                                                      15
Other                                           26                      30                2                                                      28
Total Damages and Losses                    1,675                  1,952              100                                                    1,802
Share of GDP                                                       2.6%                                                                       2.4%


The major economic sectors impacted are limited                          and injury rates are also developed from the deaths
to those that incurred damages and losses dur-                           and injuries resulting from Sidr. Damages include
ing Cyclone Sidr in 2007, the most devastating                           complete or partial destruction inflicted on assets
cyclone in the recent past. Table 3.9 summarizes                         (assets not portable as well as stock). Losses refer
the damages and losses by sector during Cyclone                          to the flows of goods and services that are not pro-
Sidr. Damages and losses from this single event                          duced or rendered due to a disaster. Losses also
accounted for 2.6 percent of GDP. Sidr was an                            include disaster-induced cost increases incurred
above-average cyclone with a 10-year return                              in continuing essential services.
period. The damages from an average cyclone
with the same return period would actually be                            Human Casualty and Injury: Approximately
lower.33 Scaling the damages down to reflect the                         3.45 million coastal inhabitants of Bangladesh
smaller areal extent of an average cyclone indi-                         were exposed to storm-surge-related inundation
cates that if an average cyclone with a 10-year                          during Sidr in 2007. Post-disaster assessments indi-
return period were to strike the Bangladesh coast                        cate 3,406 human casualties, or a casualty rate of
today, the expected damages and losses would                             1per thousand exposed and 55,282 injuries, or an
be about 2.4 percent of GDP. Nearly half of the                          injury rate of 16 per thousand exposed. Although
damages and losses would occur in housing, fol-                          cyclone shelters saved thousands of lives, focus
lowed by agriculture and transport.                                      group interviews with the residents of cyclone-
                                                                         affected areas revealed that a large section of pop-
Damage and loss functions for each of the above                          ulation was reluctant to move to cyclone shelters
sectors are developed from the damages incurred                          even during an emergency.34 Casualty and injury
during Sidr, when available. In addition, fatality
                                                                             34	 Distance from the homestead, difficult access to shelters,
33	 Cyclone Sidr (wind speed of 223 km / hour) has a return period               unwillingness to leave livestock behind unprotected, scarcity of
    of 10 years based on the 21 major cyclone events from 1960 to                sanitation facilities, lack of user friendly facilities for women,
    2009 in Bangladesh. Its areal extent was 8.7 percent larger than             overcrowding condition in shelters are the primary reasons
    the average cyclone with a 10-year return period.                            behind their reluctance.
BA N G L A D E S H CO U N T RY ST U DY                                                                                                       33


rates can be expected to decline as cyclone-resilient                      more could afford a “pucca” house. By 2050, rising
pucca houses become affordable for an increasing                           income levels will enable approximately 98 percent
proportion of coastal residents and if user-friendly                       of households to afford a “pucca” house. As a result,
shelter designs encourage higher usage rates.                              most of the housing damage in 2050 is from dam-
                                                                           ages to the contents within the houses. The average
The exposed population is expected to rise to                              “pucca” dwelling in Bangladesh in 2050 is assumed
5.34 million in 2050 under the baseline scenario                           to remain at the current size of 400 sq feet in size
due to the expected growth in the coastal popula-                          with 2,000 sq feet of brick wall surface. Household
tion and further increase to 10.04 million due to                          assets in 2050 are estimated to be approximately
the increase in the affected area. If there are no                         $2,143 (Tk 150,000). If 50 percent of the walls
changes in the human casualty and injury rates,                            require replastering at a cost of $0.0714 per sq
the upper bound estimates are 4,637 addi-                                  ft (Tk 10/sq ft) and 50 percent of the household
tional human casualties and 75,268 addi-                                   assets are damaged due to inundation, the dam-
tional injuries due to climate change.35                                   ages per affected house will be $1,214.

Housing: The housing sector accounted for about                            Under the baseline scenario, 28.7 million peo-
half of the damages and losses from Cyclone Sidr.                          ple are exposed to inundation risk greater than
Almost all of the damages occurred in “Semi-                               1 meter in 2050.40 An additional 7.08 million
pucca”36 houses, “kacha”37 houses, and “jhupris”38.                        inhabitants (or 1.45 million houses41) are exposed
In contrast, “pucca” houses, constructed with brick                        to this same level of risk under the climate change
walls and a concrete roof, remained structurally                           scenario. Accounting for the larger areal extent
intact, sustaining minimal damages requiring                               of a cyclone under the climate change scenario,
replastering of walls. Analysis of the 2001 Ban-                           an additional 1.6 million houses are projected to
gladesh census indicates that households increas-                          be damaged due to climate change. The total
ingly move to “pucca” houses as their incomes rise.                        additional housing damages in 2050 due
The projected increase in per capita incomes by                            to climate change consists of $229 million
2050 is expected to alter the mix of housing types                         for re-plastering damaged houses and
in Bangladesh, resulting in a significant reduction                        $1,718 million in content damage, for a
in housing damage, but also a substantial increase                         total of $1,947 million.
in household asset damages.
                                                                           Education infrastructure: Damaged primary
In 2001 only 2.23 percent of rural households                              school facilities accounted for over 95 percent of
with an annual per capita income of $47039 or                              the education sector damages from Cyclone Sidr.
                                                                           With the mandate for universal primary educa-
35	 Estimated human casualties in 2050 under the baseline and              tion and gross primary school enrollment rates
    climate change scenarios are 5,274 and 9,911 respectively.
    The corresponding number of injuries are 85,609 and 160,877            of 90 percent, there are many more primary
    respectively.                                                          schools that are at risk of inundation and dam-
36	 Typical characteristics of semi-pucca housing are: foundation          age. As per capita incomes rise, school enrollment
    made of earthen plinth or brick and concrete, walls made of
    bamboo mats, CI sheet and roof made of CI sheet with timber            rates are expected to increase at all levels of edu-
    framing.
                                                                           cation, resulting in a corresponding increase in
37	 Typical characteristics of kacha housing are: foundation made
    from earthen plinth with bamboo, walls made of organic materi-         the number of educational institutions. By 2050,
    als, and roof thatched made of straw, split bamboo etc.
38	 Typical characteristics of jhupris are: ceiling less than four feet,   40	 Inundation depth of less than 1m is assumed to have a negligible
    cheap construction materials such as straw, bamboo, grass, leaves,         impact on houses in 2050.
    polythene, gunny bags, etc.
                                                                           41	 The average household size is assumed to be 4.89, unchanged
39	 Monthly income Taka 2,750 per capita.                                      from current levels.
34                                                             E C O N O M I C S O F A D A P TAT I O N T O C L I M AT E C H A N G E


  Table 3.10 Cropped area exposed                                       average contents are expected to rise to $2,857
  to inundation risk in the baseline                                    (Tk 200,000). If 50 percent of the walls in affected
   and climate change scenarios
                 (ha)                                                   schools are damaged and require replastering and
              Baseline          Climate Change                          50 percent of its contents are damaged, average
           Scenario 2050        Scenario 2050            Percent
 Crop        (hectares)            (hectares)            Change         damages per affected school are $1,851. When
 Aman            1,092,645               1,305,028            +19
                                                                        additional losses to provide interim facilities dur-
                                                                        ing reconstruction of 9.6 percent are included, the
 Aus               526,040                 618,897            +18
                                                                        total damage and loss per school is $2,029. The
 Boro              272,768                 388,828            +43
                                                                        total additional education sector dam-
                                                                        ages and losses in 2050 under the climate
secondary school enrollment rates are expected to                       change scenario consist of $9 million in
rise from the current 43 percent to 70 percent by                       damages requiring replastering of walls
2050, while primary school enrollment is expected                       and replacing contents and $1 million in
to increase to 100 percent. The combined effects                        losses for interim facilities.
of population growth, a changing age structure,
and higher school enrollment rates are expected                         Agriculture: Crop losses accounted for nearly 95
to increase by over 1 million the number of                             percent of agriculture sector damages and losses
exposed school students (0.63 million in primary                        during Cyclone Sidr. Damage and loss to fisher-
schools and 0.43 million in secondary schools)42.                       ies and livestock were much smaller. Crop losses
Climate change is expected to further increase the                      from a specific cyclone vary based on the season it
number of exposed primary school students by                            strikes. The cropping calendar, planting/harvest-
0.46 million (in 2,283 primary schools) and sec-                        ing dates, of the major rice crops Aman, Aus, and
ondary school students by 0.31 million (in 2,086                        Boro are different.44 Bangladesh is twice as likely
primary school equivalents43). Accounting for the                       to be hit by a tropical cyclone during the post-
larger areal extent of a cyclone under the climate                      monsoon season as during the pre-monsoon sea-
change scenario, an additional 4,840 primary                            son. The expected crop damage estimates from
school (equivalents) are expected to be damaged                         a cyclone is the probability-weighted crop dam-
due to climate change.                                                  ages from cyclones that occur during different
                                                                        seasons.
The standard size specification for a primary
school in Bangladesh enrolling 200 students is                          Crop losses resulting from a cyclone are deter-
approximately 160 sqm (LGED). By 2050, its                              mined in detail for the three main rice crops.
                                                                        Non-cereal crop losses are estimated based on the
                                                                        crop loses for these rice crops.
42	 These estimates are based on the following assumptions: (a)
    Bangladesh will attain 100 percent enrollment in primary schools
    and 70 percent enrollment in secondary schools by 2050. These       Table 3.10 shows the cropped area that is exposed
    are the current school enrollment rates in comparator countries
    (Brazil, Lebanon, Malaysia, Uruguay) with current per capita        to inundation risk under the baseline and climate
    incomes similar to that projected for Bangladesh in 2050; (b)
    ratio of primary school-age and secondary school-age children
                                                                        change scenarios for the three rice crops. The
    enrolled in school to total population will be 6.45 percent and     exposed area increases by twice as much for the
    4.42 percent respectively by 2050, (c) the standard capacity of
    a primary school is 200 students and a similar size school can      boro crop than for the aman and aus crops. The
    accommodate up to 150 secondary students in Bangladesh.             larger areal extent of a storm under the climate
43	 Cost of constructing a secondary school is estimated from the       change scenario implies that the affected areas in a
    costs of primary schools. Secondary schools are typically are
    larger and enroll more students than a primary school. However,
    the space required per secondary school pupil is about 33 percent
    larger. A primary school equivalent normalizes for this larger      44	 Aman grows in the monsoon season, Aus grows in pre-monsoon,
    space requirement.                                                      and Boro grows in the post-monsoon season.
BA N G L A D E S H CO U N T RY ST U DY                                                                                                 35


cyclone for aman, aus, and boro will increase by 98                     in the economy associated with rising income lev-
percent, 94 percent, and 136 percent respectively.                      els in 2050 are expected to increase the contri-
                                                                        bution of these sectors to the economy by 2050,
By 2050, the agriculture sector is expected to                          accounting for an additional 9 percent of GDP, or
grow at an annual average growth rate of 2.4 per-                       a total of 91 percent of GDP.46 Under the base-
cent, largely through increases in yields (Yu et al.                    line scenario, higher GDP levels combined with
2010). As a result, by 2050, yields for aman, aus,                      increased shares of the non-agricultural produc-
and boro are expected to rise to 5.5, 4.7 and 9.5                       tive sectors in the economy in 2050 result in total
mt/ha respectively. If 50 percent of the affected                       damages of $96 million and losses of $1,237 mil-
crops are lost, at a price of $676 per metric ton,                      lion. The increased risk due to climate change
the expected crop losses for the three rice crops                       and the larger areal extent of a storm under
in the baseline and climate change scenarios are                        the climate change scenario will result in
$501 and $1,017 million respectively. Assuming                          additional damages of $88 million and
non-cereal crops losses increase in proportion to                       additional losses of $1,084 million.
the rice crops, total crop losses will rise to $767
and $1,556 million in the baseline and climate                          Transport: Roads accounts for almost all of the
change scenarios respectively. The estimated                            damages in the transport sector. This is likely to
additional crop loss in 2050 due to climate                             remain unchanged in 2050 as well. Roads are
change is $789 million.                                                 highly sensitive to inundation and become par-
                                                                        tially damaged with inundation of less than 1
The damage and loss to fisheries and livestock                          meter and are fully damaged when inundation
are much smaller. In 2007 Sidr inflicted dam-                           exceeds 1 meter. As a result, national and regional
ages and losses of $19.3 million on livestock and                       roads in Bangladesh are constructed to lie above
$6.7 million on fisheries. If livestock and fisher-                     the highest flood level (HFL) with a return period
ies continue to grow at the observed (2001–07)                          of 50 years and feeder roads to lie above normal
annual growth rates of 3 percent and 6 percent                          flood levels (Siddiqui and Hossain 2006). The den-
respectively, the estimated additional dam-                             sity of roads in Bangladesh is already one of the
age and loss due to climate change in 2050                              highest in the world. By 2050, the road network
is $56 million for livestock and $66 million                            is expected to expand by 25 percent, much slower
for fisheries.45                                                        than the expansion of the overall economy. How-
                                                                        ever, the road network is expected to be upgraded
Non- agricultural productive sector: Cyclone                            and built to higher design standards. The share
Sidr caused total damages of $4 million and losses                      of paved roads is also expected to gradually rise
of $48 million to the non-agricultural productive                       to 100 percent by 2050.
sectors (industry, commerce, and tourism) in 2007.
These sectors accounted for 82 percent of GDP                           Under the baseline scenario, 12,969 km of roads
(Yu et al 2010). Urbanization and structural shifts                     are exposed to inundation, of which about two-
                                                                        thirds are exposed to inundation greater than 1
45	 Estimated damage to livestock is $63 million under the baseline
    scenario and $119 million under the climate change scenario.
                                                                        meter in 2050. With the additional risk of inun-
    The corresponding damage and loss for fisheries is $76 million      dation under the climate change scenario, 21,019
    and $142 million. These estimates are relatively crude—based on
    aggregate growth trends only—and can be higher or lower based       km of roads are exposed to inundation, of which
    on the underlying growth and exposure factors. For instance,        about half are exposed to inundation of more
    improvements in in-situ (individual or community-based) protec-
    tive measures such as the construction of platforms to protect
    livestock can reduce damages. On the other hand, technological
    improvements such as the increased use of diesel boats instead of   46	 Yu et al. 2010; also average non-agricultural share of GDP in
    sail boats can lead to greater exposure and potential damages.          comparator countries (Brazil, Lebanon, Malaysia, and Uruguay).
36                                             E C O N O M I C S O F A D A P TAT I O N T O C L I M AT E C H A N G E


than 1 meter. In the absence of added protec-          deliver this power. By 2050, per capita power con-
tive measures, the combined effects of expansion       sumption is expected to increase twentyfold, from
in the road network and climate change nearly          the current 150 Kwh to 3,000 Kwh.47 The power
doubles the length of roads exposed to inunda-         grid and infrastructure is expected to expand
tion risk by 2050.                                     fivefold to deliver the added electricity demand.48
                                                       The combined effects of population growth and
Under the baseline scenario, 3,372 km of roads         rising per capita consumption are expected to
are affected in a single cyclone, with partial         increase damages to power infrastructure to $68
damages to 1,039 km and full damages to 2,333          million and economic losses to $171 million in
km. Accounting for the larger areal extent of a        2050 under the baseline scenario. The increased
cyclone under the climate change scenario, the         inundation risk and areal extent under the climate
affected roads increase by over 2.5 times to 9,038     change scenario is expected to increase damages
km. Partially damaged roads nearly quadruple           to $129 million and losses to $321 million. The
to 4,500 km, while fully damaged roads almost          estimated additional damage due to cli-
double to 4,538 km.                                    mate change is $60 million and the addi-
                                                       tional potential loss is $150 million.
Repair costs after Cyclone Sidr were estimated
at $28,571 (Tk 2 million) per km for fully dam-        Coastal protective infrastructure: In the
aged roads and $14,286 (Tk 1 million) per km           1960s, 123 polders and supporting infrastructure
for partially damaged roads. Repairing dam-            were constructed to protect low-lying coastal areas
ages to bridges and culverts along these roads         against tidal flood and salinity intrusion in Ban-
increased total transport sector damages by 1.13       gladesh. In 2007, Sidr induced damages of $70.3
times. Finally, economic losses due to the closure     million to the polders and related water regulators
of roads during the reconstruction of damages          in coastal Bangladesh. Overtopping of embank-
were about 22 percent of the total damages to          ments is the most important factor responsible for
the road infrastructure.                               damages to coastal infrastructure during cyclones.
                                                       Comparison of projected surge heights and heights
Applying these cost factors, the estimated dam-        of existing embankments of polders (as described
ages and losses for roads, bridges, and culverts       in the next section) indicate an additional 13 pol-
under the baseline scenario total $212 million,        ders are likely to be overtopped by 2050 due to cli-
including $174 million in damages and $38              mate change, resulting in additional potential
million in losses. Under the climate change sce-       damage of $17.3 million.
nario, total damages increase to $413 million
and losses to $90 million. The additional dam-         Potential damage across all sectors: The
ages and losses due to climate change in the           total potential damages and losses under the
transport sector in 2050 are $240 million and          baseline and climate change scenarios in 2050
$53 million respectively.                              are summarized in Table 3.11. Total damages

Power infrastructure: In 2007, Cyclone Sidr
                                                       47	 The consumption of power in Brazil, Lebanon, Malaysia,
caused $8.2 million in damages to power transmis-          Uruguay, and South Africa—countries with present per capita
sion and distribution infrastructure in coastal Ban-       income similar to the projected per capita income of Bangla-
                                                           desh—indicates per capita consumption of power is likely to
gladesh. Loss of power also resulted in additional         increase 20 times in Bangladesh.
economic losses of $5.1 million. Rising income         48	 Experts at the Asian Development Bank working on the Ban-
levels are expected to result in an increase in both       gladesh power sector indicated that the power infrastructure has
                                                           to be expanded at one-fourth the rate of growth in electricity
power consumption and in the infrastructure to             consumption.
BA N G L A D E S H CO U N T RY ST U DY                                                                                   37


                Table 3.11 Damages and losses from Cyclone Sidr (2007)
                                          by economic sector
                                                                                                         Additional due to
                                      Average Severe            Baseline Scenario     Climate Change      Climate Change
           Economic Sector             Cyclone 2009                    (a)              Scenario (b)          (b) - (a)
 Housing                                             900                      1,825            3,772                 1,947
 Non-Agriculture Productive Sector                       56                   1,333            2,505                 1,172
 Agriculture/Fisheries/Livestock                     469                       906             1,816                   910
 Transport                                           151                       212              504                    293
 Power                                                   15                    239              449                    210
 Water Resource Control                                  83                     83              100                     17
 Education Infrastructure                                73                      9               19                     10
 Other                                                   55                     n/a              n/a                   n/a
 Total Damages and Losses                        1,802                        4,607            9,166                 4,560
 Share of GDP                                    2.4%                         0.3%             0.6%                   0.3%


  Table 3.12 Additional damages and losses due to climate change in 2050
                                       Damages                   Losses       Damages and Losses       Share of Damages &
         Economic Sector             (Million USD)            (Million USD)      (Million USD)              Losses (%)
Housing                                       1,947                      —                   1,947                      43
Industry/ Commerce/Tourism                       88                  1,084                   1,172                      26
Agriculture                                      75                    835                     910                      20
Transport                                       240                     53                     293                       6
Power                                            60                    150                     210                       5
Coastal Protection                               17                       0                     17                       0
Education Infrastructure                             9                    1                     10                       0
Others                                          n/a                     n/a                    n/a                     n/a
Total                                         2,437                  2,123                   4,560                     100


and losses under the baseline scenario are $4,607                 by $4,560 million, nearly doubling the total dam-
million. While housing continues to account for                   ages and losses. The total additional damages and
the largest share of total damages and losses, its                losses account for another 0.3 percent of GDP.
share declines to 40 percent as households adapt
to the risks they face. Structural shifts in the econ-            Table 3.12 summarizes the distribution of addi-
omy also reduce the share of agriculture, while                   tional damages and losses by sector. Losses
increasing those for non-agricultural produc-                     account for nearly half of the additional eco-
tive sectors and power. Even though these dam-                    nomic impacts of climate change in 2050. In
ages and losses are more than twice as large as                   contrast, losses only accounted for a third of the
the damages from Cyclone Sidr, their economic                     economic impacts from Sidr.
impact is expected to be much smaller, account-
ing for only 0.3 percent of GDP. Climate change                   Adaptation options and cost
is expected to increase damages and losses from                   Bangladesh has invested over $10 billion (in
an average 10-year return period cyclone in 2050                  constant 2007 USD) during the last 35 years in
38                                               E C O N O M I C S O F A D A P TAT I O N T O C L I M AT E C H A N G E


                        Figure 3.7 Location of overtopped polders

                 Baseline scenario (left), Climate change scenario (right)


measures to make the nation less vulnerable to           areas primarily because of the low density of
natural disasters such as cyclones and floods (GoB       assets and activities in these areas. The cost of
2009). The coastal protection measures already in        increasing the resilience of specific assets in these
place provide a good foundation to build upon to         areas should be relatively small; no attempt was
further mitigate existing current risks and future       made to estimate this cost.
inundation risks. They reveal what has worked
well and what has not worked well with a high            In each case, the total costs are estimated through
degree of geographic detail, and the potential           a gap analysis, taking into account the existing
effectiveness of these measures to address the           adaptation investments already in place. The
additional risks posed by climate change. This           additional set of adaption measures that would
analysis is primarily focused on the upgrading           be required to prevent damages are computed for
and expanding of existing adaptation measures            both scenarios. The costs under the baseline sce-
to prevent the inundation risks identified under         nario are the adaptation deficit. The difference in
the baseline and climate change scenarios. Spe-          the cost between the two scenarios represents the
cifically, adaptation costs are estimated for five       cost of adaptation due to climate change.
measures—embankments (upgrade only), affor-
estation (expansion only), cyclone shelters (expan-      Height enhancement of coastal polders:
sion only), cyclone-resistant housing (expansion         Geographic information system (GIS) software is
only), and early warning systems (upgrade and            used to overlay the best available spatially disag-
expansion)—under the two climate scenarios.              gregated data on polders over the areas exposed
These adaptation measures aim to reduce the              to inundation risk under the baseline and cli-
area, assets, and activities exposed to inundation       mate change scenarios. Polders likely to be over-
risk, and hence diminish the need for additional         topped and the extent of overtopping under each
asset-specific resilience enhancing investments,         scenario are identified by taking the difference
such as raising the height of roads further inland.      between the crest level of the embankments of
However, such resilience enhancing investments           each polder and the inundation depths projected
are essential to protect assets in areas that are cur-   for them under the respective scenario. Under
rently not protected by polders (e.g. many small         the baseline scenario, 14 interior polders and 30
islands). Polders were not constructed in these          sea-facing polders are expected to be overtopped
BA N G L A D E S H CO U N T RY ST U DY                                                                                             39


(Figure 3.7).49 The extent of overtopping in these                   BWDB rates for turfing of Tk 7.07 per sq meter
polders increases under the climate change sce-                      are used determine total turfing costs.52
nario for 2050. Further, 12 additional interior
polders and 3 additional sea-facing polders are                      The need to strengthen the slope or base of spe-
also overtopped under the climate change sce-                        cific polders and the extent of such strengthening is
nario. Annex 5 lists each of the overtopped pol-                     based on polder-specific field observations by experts
ders and the height by which each is overtopped                      at BWDB and IWM. They are not required for the
in the two scenarios.                                                majority of polders that are likely to be overtopped,
                                                                     but for those that do, they can account for up to 70
The cost of preventing overtopping in the interior                   percent of the cost of prevention. “Major protec-
and sea-facing polders under the baseline and cli-                   tion” includes slope protection on the sea side or river
mate change scenarios are computed separately                        side, using cement concrete blocks or boulders and
for each polder likely to be overtopped based on                     filter materials. The base or “toe” of embankments
detailed engineering analysis. Detailed cost esti-                   is subject to significant erosion from hydraulic stress.
mates for each cost component and polder for                         Protecting against toe erosion includes hard protec-
each scenario are provided in Annex 6. In each                       tion using cement concrete (CC) blocks with sand
case, costs are estimated separately by polder for                   filters and geo-textile, the best locally available tech-
earthwork, turfing, toe erosion, plantation, land                    nology to protect against major erosion. Total toe
acquisition, and major protection.                                   erosion protection costs are based on BWDB rates
                                                                     of Tk 224,100 per sq meter. Minor erosion can often
For interior polders, earthwork accounts for over                    be prevented through the planting of vetivera grass.
50 percent of the cost of preventing overtopping,                    However, high soil salinity along the Chittagong belt
and 40–50 percent for sea-facing polders. The                        has reduced its growth and survival rates. Since soil
amount of earth needed is derived from detailed                      salinity is even higher along the southwestern coast,
engineering designs, as outlined in Annex 7.                         the effectiveness of vetivera plantations may be lim-
Raising the height of an existing embankment                         ited to a few polders on a case-specific basis. Vetivera
also entails extending the base that supports it.                    planting costs Tk 70,700 per ha (BWDB 2003b).
Earth that is available locally within 1 km from
the polder costs Tk 109.96 per cubic meter.50 The                    Enhancing polder heights entails an expansion in
costs rise to Tk 133.44/ m3 if earth is not avail-                   the base to maintain the slope of each embankment,
able locally and has to be collected from distances                  as indicated by the shaded area in Annex 7. Req-
greater 1 km.51                                                      uisition of the additional land, if privately owned,
                                                                     requires compensation, and in some cases, their
Compaction and turfing of the soil is used to pro-                   rehabilitation cost. For sea-facing dykes, foreshore
tect the earth from rapidly washing away with                        land is usually government-owned or khas land. For
subsequent precipitation events. They account                        interior and marginal dykes, however, neighboring
for a small fraction of costs, but effectively extend                land is often under private ownership. Land acquisi-
the deign life of the earthwork. Turfing area is                     tion costs are based on BWDB rates of $17,143 (Tk
determined using the trapezoidal rule, consider-                     1.2 million) per ha from a BWDB project.53
ing the length and slope of the embankment. The
                                                                     52	 Source: Schedule of Rates, Mymenshing O&M Circle, Bangla-
                                                                         desh Water Development Board, 2008–09
49	 The overtopping would occur currently as well as in 2050 since   53	 Source: Feasibility Study for Flood Control Embankment and
    the risks under the baseline scenario are the existing risks.        River Bank Protection on the Left Bank of Jamuna and Right
                                                                         Bank of Dhaleshwari at Nagorpur and Chowkhali, Final Report,
50	 Source: Bangladesh Water Development Board.
                                                                         June 2007, Directorate of Planning-1, Bangladesh Water Devel-
51	 Ibid.                                                                opment Board, Dhaka.
40                                                         E C O N O M I C S O F A D A P TAT I O N T O C L I M AT E C H A N G E


     Table 3.13 Estimated cost for height enhancement of coastal polders
                                                         ($ millions)
                             Baseline Scenario       Climate Change Scenario        Additional Cost due to Climate Change
 Interior polders                             317                            706                                                389
 Sea facing polders                         2,145                          2,648                                                503
 Total all polders                          2,462                          3,354                                                893


The total investment cost for strengthen-                          cost-effective protection against the more intense
ing coastal polders to prevent overtop-                            cyclones expected under the climate change sce-
ping is $2,462 million under the baseline                          nario. The addition of the requisite 500 meter
scenario and $3,354 million under the cli-                         forest belt may reduce the embankment height
mate change scenario (Table 3.13). Sea-fac-                        enhancement necessary for some sea-facing pol-
ing polders account for 87 percent of costs under                  ders by up to 30 cm (IWM & DHIA 2000).
the baseline scenario. About half of this ($1,195
million) is for major protection and toe erosion of                Maps of the coastline available through Google
specific polders. Raising embankments to prevent                   Earth indicate that only 60 km of embankments
overtopping under the climate change scenario                      currently are protected by the recommended 0.5
requires an additional cost of $893 million, almost                km of afforestation, while the remaining 897
evenly split between interior and sea-facing pol-                  km remains unprotected. Fully protecting these
ders. Earthwork accounts for over three-fourths                    embankments requires reafforestation in nearly
of the added cost due to climate change for sea-                   448.5 sq km (897km x 0.5 km). Afforestation costs
facing dykes, while the corresponding share for                    are $168,000 / sq km in the CERP II project.55
interior dykes is about half. Most of the remain-                  The cost of afforestation to reduce the
ing costs are needed for major protection and toe                  hydraulic load on embankments under the
erosion in the 12 dykes that are overtopped in the                 climate change scenario is $75 million.
climate change scenario, but not in the baseline
scenario.                                                          Multipurpose Cyclone Shelters: Cyclone shel-
                                                                   ters protect human lives and livestock in coastal
In addition to the direct investment requirements,                 Bangladesh. While the construction cost of mul-
the operation and maintenance (O&M) cost is                        tipurpose cyclone shelters varies based on the
assumed to increase by an estimated 2 percent of                   capacity of the shelter and the design adjustments
investment per year, or $49 million in the baseline                necessary for the other regular usage of the shel-
scenario and an additional $18 million with cli-                   ter, unit costs of about $134 per person reported
mate change.                                                       for the post-Sidr shelter construction project
                                                                   funded by the World Bank is fairly typical.
Coastal afforestation: Planting mangrove for-
ests with a minimum width of 0.5 km in front                       The number of cyclone shelters needed to pro-
of sea-facing polders is a cost-effective method                   tect the affected population depends on the type
of protecting them from above-average severe                       of house they live in. Pucca houses can structur-
storms. While they may not be essential to protect                 ally withstand cyclones. While residents may be
against the average 10-year return period cyclone                  able to withstand inundation depths of 1 meter
under the baseline scenario,54 they constitute                     with minimal risk to their lives, inundation depths


54	 Most existing embankments remained intact under the above-     55	 Source: Coastal Embankment Rehabilitation Project, Stage-II,
    average Cyclone Sidr in 2007.                                      Final Report, Volume I/II, June 2003, Chittagong.
BA N G L A D E S H CO U N T RY ST U DY                                                                                        41


greater than 3 meters for an extended duration                              structurally intact during past cyclones such as
certainly requires the evacuation of affected resi-                         Sidr. In contrast, thatch, tin and kaccha houses in
dents.56 The shelter capacity needed under the                              affected areas have been severely damaged. They
two scenarios is estimated based on the popula-                             can serve as single/multi-family cyclone shelters
tion exposed to inundation depth of more than                               during storm surges. The census data indicate
3 meters.                                                                   that people with annual incomes greater than
                                                                            $470 live in pucca houses, while poorer resident
In coastal Bangladesh, 8.9 million people were                              live in tin, thatch, or other less permanent struc-
exposed to inundation risk of greater than 3                                tures. Most rural households will have sufficient
meters in 2007 under the baseline scenario. Pop-                            income by 2050 to afford to live in pucca houses.
ulation growth increases the exposed population
by 4.7 million to 13.6 million by 2050 under the                            The need to construct additional cyclone shelters
baseline scenario, or nearly a fivefold increase in                         in areas exposed to low inundation risk can be
the cyclone shelter capacity compared to what is                            reduced by (a) instituting suitable building designs
currently available.57 The current deficit will likely                      and codes to make houses cyclone resistant, and
be eliminated with the extensive shelter construc-                          (b) putting in place a revolving fund for subsidiz-
tion efforts that are planned or already under                              ing construction material and extending hous-
way. These efforts will need to be sustained in the                         ing credits. Consultations with local architects
future to keep up with the increasing population                            and civil engineers indicate that a $200 mil-
and will cost an estimated $628 million (about                              lion revolving fund would be sufficient to
2,930 shelters with an average capacity of 1600).                           encourage construction of pucca houses
                                                                            in accordance with appropriate building
The population exposed to inundation risk rises                             codes. These steps can be justified as a cost-
further by another 9.1 million to 22.6 million                              effective means of protecting the poorest rural
under the climate change scenario. This repre-                              households in low inundation risk areas in lieu
sents a 67 percent increase in the cyclone shelter                          of constructing additional shelters. As with any
capacity needed by 2050 compared to the base-                               subsidy program, its effectiveness and fiscal pru-
line scenario, or an additional 5,702 shelters                              dence hinges on the structure and design of the
with an average capacity of 1600. The con-                                  program.
struction cost for the additional shelters
needed to accommodate people that are                                       Early warning and evacuation system: The
exposed to the additional inundation risk                                   effectiveness of the early warning and evacua-
from climate change in 2050 is estimated                                    tion system can be enhanced through improved
at $1,219 million.                                                          geographic precision of warnings and the expan-
                                                                            sion of the cyclone preparedness program to
Cyclone resistant private housing: Cyclone                                  reach the additional inundation risk zones under
resistant private housing is an effective alternative                       the climate change scenario. Consultations with
to cyclone shelters, particularly in areas exposed to                       experts at the relevant agencies identified specific
low inundation risk. Pucca houses have remained                             actions necessary to achieve these objectives and
                                                                            their costs.
56	 Multi-story houses may temporarily protect residents from
    drowning as they move to higher heights. They can be substi-            The geographic precision of warnings can be
    tutes for an extended duration only if affected residents have          improved through improved monitoring of
    adequate supplies of essentials.
57	 The deficit is slightly smaller if the PDEP II school facilities cur-
                                                                            weather systems and finer scale modeling of
    rently being used as shelters are also included.                        storm surges and inundation depths. Officials at
42                                                               E C O N O M I C S O F A D A P TAT I O N T O C L I M AT E C H A N G E


the Meteorology Department identified the need                            an adequate number of these are assumed to be
to (a) upgrade and expand its network of obser-                           already under construction or have been planned.
vatories, (b) expand the number of radiosonde                             These investments prevent damages from the
stations,58 and (c) modernize the existing work-                          average cyclone with a 10-year return period, as
shop, laboratory, and training facilities. In addi-                       has been experienced during the past 50 years.
tion, the Institute of Water Modeling indicated                           The potential damages from a single such storm
the need to acquire finer scale topographic data                          currently are $1,802 million and are expected to
covering 23,500 sq km of the coastal region, as                           rise to $4,607 million by 2050. On average, four
well as upgrade the mathematical modeling to                              such storms can be expected over the next 40
better utilize the new data. These improve-                               years. The potential benefits exceed the invest-
ments require an initial investment of $39                                ment costs by several times, even when the future
million and annual recurrent costs of $5                                  benefits and costs are discounted.
million, as itemized in Table 3.14.
                                                                          Under the climate change scenario, addi-
The effectiveness of the early warning system                             tional investments of $2,426 million, or
depends critically on the awareness and coop-                             approximately $60 million per year, and
eration of residents, the community, local and                            annual recurrent costs of $50 million are
central government agencies, and volunteer orga-                          required to counter the additional risks
nizations. Under the climate change scenario, 19                          from more severe future cyclones. Assum-
additional coastal districts are exposed to inun-                         ing the investments are phased in over the next 40
dation risk. The Red Crescent Society estimates                           years, the cost to adapt to the additional risks from
that $3 million per year is required to expand the                        climate change average $85 million, gradually ris-
annual awareness promotion program to these 19                            ing from $60 million to $110 million by 2050.
new districts.59

Total adaptation cost                                                     Implications for
Table 3.15 summarizes the investment cost of                              Adaptation Strategy
adapting to climate change that would prevent
damages from cyclone-induced storm surges
under the two scenarios. Under the baseline sce-                          Cyclones hit the coastal regions of Bangladesh
nario, all of the total investment costs of $2,462                        every year. The risk from cyclones and the storm
million are for upgrading polders. The costs for                          surges they induce spans the entire coastline.
additional cyclone shelters are not included since                        Public investments in protective infrastructure
                                                                          measures such as polders, cyclone shelters, early
58	 The radiosonde is a balloon-borne instrument platform with            warning systems (complemented with aware-
    radio transmitting capabilities. It contains instruments capable of   ness raising), and disaster preparedness systems
    making direct in-situ measurements of air temperature, humidity,
    and pressure with height, typically to altitudes of approximately     have reduced damages and losses from these
    30 km. These observed data are transmitted immediately to
    the ground station by a radio transmitter located within the
                                                                          storms. Despite these investments, an average
    instrument package. The ascent of a radiosonde provides an            severe cyclone with a 10-year return period cur-
    indirect measure of the wind speed and direction at various
    levels throughout the troposphere. Ground-based radio direction       rently can result in damages of around 2.4 per-
    finding antenna equipment track the motion of the radiosonde          cent of GDP. Most of the damages result from
    during its ascent through the air. The recorded elevation and
    azimuth information are converted to wind speed and direction         the cyclone-induced storm surges that inundate
    at various levels by triangulation techniques.                        coastal areas. Economic expansion is expected
59	 The awareness raising program costs approximately Tk 10               to expose additional assets to inundation risk by
    million ($142,857) per district and an additional Tk 20 million
    ($285,714) for coordination annually.                                 2050, nearly doubling the damages and losses
BA N G L A D E S H CO U N T RY ST U DY                                                                             43


              Table 3.14 Cost to increase geographic precision of cyclone
                                          and surge warnings
                                 Investment Upgrades                 Investment for Expansion         Annual O & M
                                                   Cost                               Cost                  Cost
               Items           Quantity       (Million USD)          Quantity    (Million USD)         (Million USD)
 BMD observatories                       35              6                  30             12                      3
 BMD radiosonde stations                  3               -                  5              2                      2
 BMD workshop and                         1              7                                                            -
 laboratory
 BMD training institute                   1              3                                                            -
 facilities
 Topographic survey,              23,500                 5                                                            -
 LIDAR & RTK GPS survey            sq km
 Mathematical modeling                    1              3                                                            -
 Total cost                                             24                                 14                      5


         Table 3.15 Cost of adapting to climate change by 2050 ($ millions)
                              Baseline                Climate Change                     Additional Cost due
     Adaptation Option        Scenario                    Scenario                       to Climate Change
                             Investment         Investment        Annual            Investment          Annual
                                Cost               Cost        Recurrent Cost          Cost          Recurrent Cost
 Polders                          2,462               3,354                18               893                   18
 Foreshore afforestation                                 75                                     75
 Cyclone Shelters                                     1,219                24             1,219                   24
 Cyclone Resistant Housing                              200                                 200
 Early Warning &                                         39                8+                   39               8+
 Evacuation System
 Total                            2,462               4,888               50+             2,426                 50+


in real terms from a similar storm. Damages                   some uncertainty about the magnitude of these
and losses account for around 0.3 percent of the              changes, estimates based on plausible scenarios in
2050 GDP, due to expected structural shifts in the            the scientific literature indicate that areas at risk
economy away from climate sensitive sectors and               of inundation over 3 meters will increase by 69
due to private adaptation as households are able              percent and up to 1 meter by 15 percent. Addi-
to afford cyclone-resilient housing.                          tionally, the increased severity of the cyclone will
                                                              also span a larger proportion of the at-risk areas.
Climate change is expected to further increase the            As a result, damages and losses from an aver-
risk of inundation-related damages. A warmer                  age severe cyclone with a 10-year return period
ocean is likely to intensify cyclone activity and             in 2050 are expected to double due to climate
increase the height of storm surges, resulting in             change to around 0.6 percent of GDP.
greater inundation depths and inundation of
areas further inland. Surges will be further ele-             To address the added risks from climate change,
vated by a rising sea level as thermal expansion              the starting point for an adaptation strategy is
and ice cap(s) continue to melt. While there is               the significant public investment made over the
44                                                   E C O N O M I C S O F A D A P TAT I O N T O C L I M AT E C H A N G E


            Table 3.16 Sequencing of adaption options for tropical cyclones/
                                                     storm surges
                                Near term                   Short term                     Medium term                 Long term
Early warning                                       Upgrade equipment and           Expand observatories and
system                                              observatories; Improve          equipment to cover new
                                                    geographic precision of         areas
                                                    forecasts and warnings
Relief operations       Strengthen decentralized    Update programs to              Extend awareness raising
                        operations                  communicate existing            programs to new areas
                                                    and new risks                   at risk
Polders: All existing   Fully fund O&M, Under-
polders                 take maintenance
Polders: at risk of     Assess polder-specific      Strengthen polders in
overtopping base-       avoided damages and         order of priority, building
line scenario           human toll; prioritize      in flexibility to account for
                        polders for strengthening   added risk with climate
                                                    change
Polders: at risk of                                 Assess polder-specific          Strengthen polders in           Reassess risk of
overtopping climate                                 avoided damages and             order of priority, building     overtopping;
change scenario                                     human toll; prioritize          in flexibility to account for   strengthen
                                                    polders based on avoided        added risk with climate         polders as
                                                    damages and costs               change                          appropriate
Cyclone shelters: All   Fully fund O&M;             Adapt shelters to better
existing shelters       undertake maintenance       match resident needs
Cyclone shelters: at    Take stock of shelters      Construct multipurpose          Reassess gaps in capacity
risk of overtopping     under construction and      cyclone shelters, prioritiz-    to meet long-term future
baseline scenario       planned construction;       ing areas with large exist-     capacity needs; add capac-
                        assess location-specific    ing gaps in shelter capacity    ity as needed
                        shelter capacity gaps
Cyclone shelters:                                   Assess location-specific        Construct multipurpose          Reassess gaps in
at risk of overtop-                                 gaps in shelter capacity        cyclone shelters, prioritiz-    capacity to meet
ping climate change                                                                 ing areas with large exist-     long-term future
scenario                                                                            ing gaps in shelter capacity    capacity needs;
                                                                                                                    add capacity as
                                                                                                                    needed
Cyclone-resistant                                   Research in innovative          Identify areas where            Implement CRH
housing                                             housing designs and finan-      program can substitute          program in lieu
                                                    cial mechanisms                 for additional shelter con-     of constructing
                                                                                    struction; develop CRH          cyclone shelters
                                                                                    program with effective
                                                                                    targeting and minimized
                                                                                    leakages
Foreshore                                           Prioritize areas to be          Implement afforestation
afforestation                                       afforested; pilot               program
                                                    afforestation program;
                                                    develop institutions
                                                    arrangements
Land use planning                                   Set up institutions to          Implement institutional
and zoning                                          promote settlements             arrangements
                                                    away from high-risk areas
BA N G L A D E S H CO U N T RY ST U DY                                                                  45


past 35 years in disaster risk mitigation measures,    The sequencing presupposes sound development
which have included construction of polders and        policies that promote growth and reduction in
cyclone shelters, and the establishment of early       poverty that enables increasing number of people
warning and evacuation systems. They have been         to afford climate-resilient housing. A no-regrets
protecting virtually all of the populated areas in     strategy to make Bangladesh climate resilient
the coastal regions of Bangladesh from tidal waves     would start by addressing the existing adapta-
and storm surges. While these investments have         tion deficit expeditiously first through adequate
protected populations and assets during numer-         funding of operations and maintenance costs for
ous cyclones, experience from Cyclone Sidr indi-       existing infrastructure. This needs to be accom-
cates that the existing measures are not sufficient    panied by efforts to reduce the uncertainties sur-
to fully protect coastal areas even against histori-   rounding the added risks due to climate change
cal risks, much less the added risks under climate     research to improve the temporal and spatial
change. Toward this end, the government of             resolution of forecasts. Pending the availability
Bangladesh, development partners, and NGOs             of added information, a localized assessment
are already undertaking the construction of hun-       of damages can be taken to assess the poten-
dreds of new cyclone shelters to partially address     tial damages from inaction or delayed action.
the existing adaptation deficit.                       Specific adaption measures can be expedited
                                                       for actions that have sufficiently high avoided
Moving forward, the detailed polder level infor-       damages-per-cost ratios. Upon addressing the
mation available on the overtopping risks and          existing risks, actions can be taken to address the
the cost of strengthening them enables a finer         added risks from climate change. These invest-
level of sequencing as summarized in Table 3.16.       ments have to also be accompanied by institu-
The prioritization recognizes (a) the certainty of     tional mechanisms that address any perverse
the existing inundation risk; (b) the uncertain-       incentives that it may create in attracting popu-
ties around the magnitude of the impacts due to        lation and activities toward areas of higher risk.
climate change; and (c) the manifestation of the       Stronger institutional capacity is also essential to
added risks due to climate change gradually over       reduce uncertainties through improvements in
the next 40 years and beyond, and (d) the lack of      the knowledge base, and in turn to adjust the
localized damage assessment that is directly com-      selection and sequencing of adaptation actions
parable to the costs.                                  in response to changes in knowledge.
46                                                 FO UR
     E C O N O M I C S O F A D A P TAT I O N T O C L I M AT E C H A N G E
BA N G L A D E S H CO U N T RY ST U DY                                                                                              47


Inland Flooding


Historical Vulnerability of                                          Development Board has designated areas of
Inland Flooding                                                      Bangladesh vulnerable to various categories of
                                                                     flood (see Annex 10). Mirza (2002) has classified
                                                                     floods in terms of impacts (see Table 4.1, Annex
Bangladesh is one of the most flood-prone coun-                      11). About 21 percent of the country is subject to
tries in the world. The literature on floods in the                  annual flooding and an additional 42 percent is
country is extensive.60 Due to its location in the                   at risk of floods with varied intensity (Ahmed and
low-lying deltaic floodplains at the convergence                     Mirza 2000). Annual regular flooding has tradi-
of three Himalayan Rivers, heavy monsoon rain-                       tionally been beneficial, providing nutrient-laden
fall concomitant with poor drainage often results                    sediments and recharging groundwater aquifers,
in annual flooding. These river systems drain a                      while low frequency but high magnitude floods
catchment area of about 1.7 million km2. The                         can have adverse impacts on rural livelihoods and
intensity of the floods depends on the magnitude                     production.
and pattern of precipitation in the three river
sub-basins. At the peak discharge of the three                       A classified list of all floods in Bangladesh since
rivers, the Brahmaputra contributes the great-                       1954, together with the extent of inundation, is
est volume (58 percent), while the Ganges and                        shown in Annex 12. There have been above-nor-
Meghna contribute about 32 percent and 10                            mal floods in 22 of 54 years, of which four were
percent, respectively. These floodplains are home                    exceptional and two catastrophic (Figure 4.1).61
to a large population (most of which is rural and                    Annex 13 contains a more extended chronology
poor) whose life is intricately linked to the flood-                 and brief descriptions of the above-normal floods
ing regime.                                                          since 1781.

Floods in Bangladesh can be classified into four                     Table 4.2 summarizes key statistics for the excep-
categories based on their origin: flash floods,                      tional and catastrophic floods since 1954 (see also
river floods, rainwater floods, and coastal floods,                  Annex 13). The exceptional flood of 1998 was
as described in Annex 9. The Bangladesh Water                        the worst on record and lasted from the first week

                                                                     61	 Since 1954, Bangladesh has had a normal flood on average every
60	 For an excellent historical discussion of floods in Bangladesh       two years. There have been no floods in only 6 of the last 54
    please refer to Hofer and Messerli (2006)                            years.
48                                                     E C O N O M I C S O F A D A P TAT I O N T O C L I M AT E C H A N G E


                             Table 4.1 Flood classification in Bangladesh
              Types of Flood              Flooded area range (km2)        Inundated area range (%)               Probability
Normal                                                         31,000                                  21                     0.50
Moderate                                               31,000–38,000                                21–26                     0.30
Severe                                                 38,000–50,000                                26–34                     0.10
Catastrophic                                           50,000–57,000                             34–38.5                      0.05
Exceptional                                                  > 57,000                               > 38.5                    0.05
Source: Mirza (2002).


 Table 4.2 Impacts and losses for recent exceptional or catastrophic floods
                      Year                   1974          1987          1988             1998            2004             2007
 Affected area (‘000 sq km)                       53           57             90             100               56              62

 Affected (million)                               30           30             47               31              33              14
 Fatalities                                  28,700         1,657         2,379              918              285           1,110
 Houses damaged (‘000s)                           na          989         2,880            2,647              895           1,000
 Roads damaged (km)                               na           na        13,000          15,927           27,970          31,533
 Crops damaged (million ha)                       na           na           2.12              1.7              1.3             2.1
 Asset losses (million US$)                      936        1,167         1,424            2,128             1,860          1,100
 GDP current (million US$)                   12,459       23,969         26,034          44,092           55,900          68,400
 Asset losses as % GDP                           7.5          4.9            5.5              4.8              3.3             1.6
 Estimated return period (years)                  9            13             55               90              12              14
 Source: Islam and Mechler (2007), BWDB (2007)


of July to the third week of September; it was the             damages of 7.5 percent of GDP. In comparison,
most severe both in terms of depth and duration                the 1998 flood was a 1-in-90-year event, inundat-
(see Annex 14) . It inundated nearly 70 percent                ing nearly twice the area but resulting in damages
of the total land and caused severe damage. This               of 4.8 percent of GDP.
flood alone caused 1,110 deaths. It flooded nearly
100,000 sq km, which included 6,000 km2 of                     The increased resilience of Bangladesh to floods is
standing crop lands. It affected 31 million people             also apparent when recent GDP and agricultural
and impacted the property of about 1 million                   growth rate trends are examined with respect to
households. It also damaged 16,000 km of roads                 the timing of flood events (Figure 4.2). Major
and 6,000 km of embankments.                                   flood events are shown in the figure as black dots.
                                                               Until the 1990s, GDP and agricultural growth
The relative severity of the impacts of severe                 rates sharply declined following major flood
floods in Bangladesh has decreased substantially               events. However, the relative effects of major
since the 1970s as a result of improved macro-                 floods have diminished after 1990.62 Growth
economic management, increased resilience of                   rates actually remained positive after the excep-
the poor, and progress in disaster management
                                                               62	 Despite several major disasters, Bangladesh remains among the
and flood protection infrastructure. The 1974                      few countries that have avoided a single year of negative growth
flood was a 1-in-9-year event, which resulted in                   since the 1990s.
BA N G L A D E S H CO U N T RY ST U DY                                                                                                                                                                     49


                          Figure 4.1 Extent of above-normal flooding in Bangladesh, 1950–2009

                         INUNDATED AREA
                         70%


                         60%


                         50%


                         40%


                         30%


                         20%


                         10%


                           0
                                1954
                                       1956
                                              1961
                                                     1963
                                                            1965
                                                                   1967
                                                                          1969
                                                                                 1971
                                                                                        1973
                                                                                               1975
                                                                                                      1977
                                                                                                             1980
                                                                                                                    1983
                                                                                                                           1985

                                                                                                                                  1987
                                                                                                                                         1989
                                                                                                                                                1991
                                                                                                                                                       1993
                                                                                                                                                              1995
                                                                                                                                                                     1998
                                                                                                                                                                            2000
                                                                                                                                                                                   2002

                                                                                                                                                                                          2004
                                                                                                                                                                                                 2006
 Source: CEGIS


                         Figure 4.2 Growth trends in total GDP and agricultural GDP in relation
                                                                                   to major flood events
                         15%                                                                                                                                                                            100%

                                                                                                                                                                                                        90%
ANNUAL GDP GROWTH RATE


                         10%                                                                                                                                                                            80%


                                                                                                                                                                                                                 SHARE OF TOTAL GDP
                                                                                                                                                                                                        70%

                          5%                                                                                                                                                                            60%

                                                                                                                                                                                                        50%

                            0                                                                                                                                                                           40%

                                                                                                                                                                                                        30%

                          -5%                                                                                                                                                                           20%

                                                                                                                                                                                                        10%

                         -10%                                                                                                                                                                           0
                                   1975
                                     76
                                     77
                                     78
                                     79
                                   1980
                                     81
                                     82
                                     83
                                     84
                                     85
                                     86
                                     87
                                     88
                                     89
                                   1990
                                     91
                                     92
                                     93
                                     94
                                     95
                                     96
                                     97
                                     98
                                     99
                                   2000
                                     01
                                     02
                                     03
                                     04
                                     05
                                     06
                                     07
                                     08


                                AGRICULTURAL GDP GROWTH                                               TOTAL GDP GROWTH                                        AGRICULTURAL GDP SHARE


 Source: Yu, W.H. et al. (2010)
50                                                                 E C O N O M I C S O F A D A P TAT I O N T O C L I M AT E C H A N G E


tional 1998 flood, which resulted in damages of                             services. The adaptation costs are determined in
nearly 4.8 percent of GDP. Changes in cropping                              the following four steps.
patterns (the shift from deepwater aman rice to
boro rice), adequate reserves of food grains, and                           1)	 Demarcate inundation risk exposure zones
an increase in rice imports by both the public and                              from monsoon floods under the baseline and
private sectors have all contributed to diminishing                             climate change scenarios.
the relative impact of major flood events.
                                                                            2)	 Demarcate additional inundation risk due to
These recent gains may be at risk if the severity of                            climate change.
floods increases with climate change, as predicted
by the GCMs for the fourth assessment report of                             3)	 Identify assets and activities in the risk expo-
the Intergovernmental Panel on Climate Change.                                  sure zones.
As discussed in Chapter 2, flooding in Bangladesh
depends on the rainfall in the entire GBM basin                             4)	 Determine additional inundation risk due to
due to the location of Bangladesh at the tail end                               climate change and estimate costs necessary
of the basin.                                                                   to mitigate additional inundation risk.

                                                                            Economic Development Baseline: The analy-
Estimating Adaptation Cost                                                  sis is based on the projected development baseline
                                                                            as used in the coastal chapter.64 Table 4.3 summa-
Adaptation options and costs for inland flooding                            rizes the key relevant changes in the Bangladesh
are more difficult to determine than for storm                              economy between now and 2050.
surges, since flooding can have beneficial impacts
as well as adverse impacts. This analysis is limited                        Inundation risk exposure zones
to what was tractable within the time and resources                         Inundation risk exposure in an area is character-
available—specifically, options and costs for cli-                          ized by the highest inundation that is expected
mate proofing key infrastructure against the addi-                          to occur during the year under a scenario. Two
tional risks due to climate change from a 100-year                          scenarios are developed—a climate change sce-
flood. These steps would also protect against risks                         nario and a baseline scenario, which is used as a
form smaller floods. Infrastructure accounted for                           counterfactual to determine the additional risk of
about one-third of the damages and losses in the                            exposure due to climate change.
1998 flood,63 mostly from damaged roads, rail-
ways, embankments, drainage, and soil erosion.                              Baseline Risk Scenario: The 1998 exceptional
The limited scope of the analysis implies that the                          flood event with a return period of 100 years is the
cost estimates are likely to be a fraction of the                           baseline scenario. It is the counterfactual against
total cost of adapting to inland flooding.                                  which future climate change risk is measured.

Adaptation costs to protect the selected assets are                         Climate Change Risk Scenario: Flood risk in
estimated using a consistent economic develop-                              2050 is expected to change from the baseline sce-
ment baseline for 2050, which includes a much                               nario levels due to changes in temperature and
larger economy together with structural changes                             precipitation levels and increases in the sea level.
away from agriculture toward industry and                                   Changes in monthly precipitation and temperature

63	 The economic impacts (crores taka) of the 1998 flood consisted          64	 The development baseline builds on recent economic trends and
    of: agriculture (crop 3,675; livestock/fishery/forestry, 288); infra-       extends them to 2050 based on normal economic development
    structure including telecom (5,023); industry (5,000), other (230).         patterns.
BA N G L A D E S H CO U N T RY ST U DY                                                                                              51


    Table 4.3 Growth trends in total GDP and agricultural GDP in relation
                                            to major flood events
                                                Current Indicators                                    Indicators in 2050
         Indicator               Value        Year             Source/ Comments             Value          Source/comments
 Population (million)                130         2001        BBS                               228     BBS
 Population average                 1.58     1991-01         State of the Coast,            1.15%      BBS (replacement fertility
 annual growth rate                                          2006                                      in 2021)
 GDP (billions of constant           $75         2007        WDI 2009                       $1,614     Projected with growth
 2009 USD)                                                                                             rates in the following row.
 GDP Avg. Annual growth            5.9%      2001-09         Ministry of Finance,             7.5%     Various government
 rate                                                        GOB                                       announcements
 Per capita GDP (constant          $470          2007        WDI 2009                       $6,395     Implied
 2009 USD)
 Road length (km)               272,487          2007        BBS                          340,609      Assumed 25% expansion
 Share of paved roads               30%          2007        BBS                             100%      Assumed
 Railway track (km)                2,460         2006        BBS                             3,415     Planned doubling of
                                                                                                       Dhaka & Chitagong
                                                                                                       districts
 Embankment (km)                   9,943         2006        BWDB, 2006                      9,943     No change
 Water regulating                 13949          2006        BWDB, 2006                     16,199     Engineering estimate
 Structures                                                                                            based on increased drain-
                                                                                                       age requirement
 Drainage canals (km)              5111          2006        BWDB, 2006                       5111     No change
 Rice Production (million             27         2006        BBS                                 75    Yu et al. 2010, Exist-
 metric tons)                                                                                          ing Climate Variability
                                                                                                       Scenario
 Notes: Current per capita GDP in Comparator countries: Brazil($5,860), Malaysia($6,420), Lebanon($5,800) and Uruguay($6,390).
 Source : World Development Indicators, World Bank


predicted by the global circulation model (GCM,                   300 m by 300 m grid point under each scenario.65
MIROC 3.2 under the A2 emission scenario                          All of the simulations include the existing flood
between 1998 and 2050 for each 50km by 50 km                      protection measures, such as flood embankment,
grid) are applied to the corresponding observed                   flood control, and drainage infrastructure in
monthly averages for 1998 over the entire GBM                     Bangladesh. Second, the daily inundation depth
basin. The MIROC 3.2 results are used for this                    results are synthesized to determine the highest
analysis, as it results in the largest increase in runoff         inundation depth for each grid point during the
among the five GCMs and two emission scenarios                    monsoon period. Finally, for the subsequent eco-
examined as part of the food security study by Yu                 nomic analysis, risk exposure zones are formed by
et al. (2010) (see Chapter 2). The rise in sea level of           grouping grid points into flood risk zones.
27cm by 2050 is based on UK DEFRA (2007).
                                                                   65	 Detailed descriptions of the models are provided in Annex 15.
                                                                       The simulations do not include urban flooding, flash floods, and
Inundation risk exposure for each scenario is                          changes in the course of rivers due to difficulties in modeling
                                                                       them and have the effect of underestimating the cost of adapta-
determined in three steps. First, the Ganges Brah-                     tion. Modeling urban floods requires the integration of urban
maputra Meghna (GBM) model is used to simulate                         drainage and sewer systems and the outfall rivers. Rivers in
                                                                       Bangladesh frequently change course during monsoon floods.
the transboundary flows, while the Super model                         This results in long-term submergence of newly inundated lands,
is used to generate the daily extent and depth of                      but reclamation of the prior river bed as char land. Increased
                                                                       peak season flows resulting from climate change may increase the
inundation during the monsoon period for each                          incidence of rivers changing course.
52                               E C O N O M I C S O F A D A P TAT I O N T O C L I M AT E C H A N G E


     Figure 4.3 Flood map – 24 Hour Duration Flood (baseline scenario)
BA N G L A D E S H CO U N T RY ST U DY                                 53


 Figure 4.4 Flood map – 24 Hour Duration Flood (climate change scenario)
54                                                                E C O N O M I C S O F A D A P TAT I O N T O C L I M AT E C H A N G E


     Table 4.4 Flood land classes (based on 24 hour duration inundation)
                                                                                 Climate Change                       Change in
             Land Type                     Baseline Scenario                         Scenario                      Inundated Area
                                           (sq.km)         %                      (sq.km)     %                    (sq.km)       %
FF (flood free)                              69,820            52                   64,905      49                   (4,915)         4
F0 (0.1m-0.3m)                                 2,953              2                  2,256        2                    (697)         -
F1 (0.3m-0.9m)                               14,062            11                   11,967        9                  (2,095)         2
F2 (0.9m-1.8m)                               19,014            14                   20,609      15                    1,595          1
F3 (1.8m-3.6m)                               21,965            16                   25,900      19                    3,934
F4 (>3.6m)                                     5,708              4                  7,886        6                   2,177          2
Total Flooded area                           60,750            45                   66,362      50                    5,612          4
(F1+F2+F3+F4)


                    Table 4.5 Rural Population Exposed to Inundation risk
                                            Baseline Scenario          Baseline Scenario      Climate change       Percent change
                                                2001 (a)                   2050 (b)          Scenario 2050 (c)     100 * (c - b) / (b)
 F0 (0.1m-0.3m)                                        1,009,898                 843,729                681,031                    -19
 F1 (0.3m-0.9m)                                        6,721,555                5,615,588              4,566,517                   -19
 F2 (0.9m-1.8m)                                        8,490,523                7,093,488              8,108,952                   14
 F3 (1.8m-3.6m)                                        7,105,158                5,936,072              7,543,397                   27
 F4 (>3.6m)                                              669,027                 558,945                899,066                    61
 Exposed Rural Population                            22,986,263               19,204,093              21,117,932                     9
 (F1+F2+F3+F4)


Figure 4.3 and Figure 4.4 show the flood risk                             scenario, 45 percent of land is under at least 0.3
exposure map of Bangladesh, as measured by                                m of water. The total flooded area increases by
the highest inundation levels for a 24-hour dura-                         4 percent, exposing more assets and activities to
tion from the simulations, under the baseline and                         risk under the climate change scenario. More
the climate change scenarios respectively. While                          importantly, the inundation depth increases in
the duration of a flood is an important metric for                        most flooded areas, correspondingly increasing
determining its impact, models to reliably deter-                         the level of risk in these areas. Areas inundated
mine the duration of a flood beyond a few days                            to depths greater than 0.9m increase from 34 per-
are not currently available.66 The choice of 24                           cent of the total area under the baseline scenario
hours duration is based on the potential severe                           to 40 percent under the climate change scenario,
damages that road infrastructure, flood embank-                           or an increase of about 17 percent. The distri-
ments, and rural houses usually are subject to                            bution of land based on inundation levels at the
from floods of such duration.67                                           peak period is approximately the same as those
                                                                          for the 24-hour duration flood.
The flood risk exposures under the two scenarios
are summarized in Table 4.4 Under the baseline                            The number of people exposed to inundation
                                                                          risk of different depths under the two scenarios is
66	 Construction of flood maps of longer duration was not feasible        estimated by overlaying the inundation risk maps
    within the resource constraints of the study.
67	 Urban floods and flash floods are not accounted for in this
                                                                          with the population map for 2001 using geo-
    analysis.                                                             graphic information system (GIS) software. About
BA N G L A D E S H CO U N T RY ST U DY                                                                                            55


 Table 4.6 Rural population density by flood land class (people per sq km)
                                                                                                        Climate change Scenario
                                      Baseline Scenario 2001 (a)           Baseline Scenario 2050 (b)           2050 (c)
 F0 (0.1m-0.3m)                                                     342                          286                        302
 F1 (0.3m-0.9m)                                                     478                          399                        382
 F2 (0.9m-1.8m)                                                     447                          373                        393
 F3 (1.8m-3.6m)                                                     323                          270                        291
 F4 (>3.6m)                                                         117                           98                        114
 Exposed Rural Population                                           378                          316                        318
 (Average (>0.3m)


23 million people lived in rural areas with esti-                          19 percent decrease in the population living in
mated inundation depths greater the 0.3 meter in                           areas inundated by less than 0.9 meter.
2001 (Table 4.5).68 Urban migration is expected
to offset most of the increase in population in                            These estimates are based on expected growth
these areas, resulting in a decline in the number                          rates in the rural and urban populations applied
of rural inhabitants exposed to inundation risk to                         uniformly across the country. However, rural
19.2 million by 2050. An additional 1.9 million                            residents have historically avoided higher inunda-
live in the newly inundated areas under the cli-                           tion risk areas through their location choices, as
mate change scenario in 2050, resulting in a total                         evidenced from the lower population density in
of 21.1 million rural inhabitants that are exposed                         higher risk areas (Table 4.6). Assuming rural resi-
to risk of inundation greater than 0.3 meter by                            dents appropriately perceive the additional inun-
2050.69 This represents a 9 percent increase rela-                         dation risk from climate change, location choices
tive to the 2050 baseline scenario, but a decrease                         made autonomously by residents can be expected
of about 9 percent relative to the population cur-                         to decrease the number of people at risk as they
rently at risk.                                                            move away from higher risk areas.

The decrease in the number of people exposed                               Additional inundation risk due to climate change
to inundation risk, however, does not necessarily                          Figure 4.5 shows a map of the areas with addi-
imply an absolute reduction in total risk. Most                            tional inundation risk determined by taking the
people living in inundated areas are exposed                               difference in inundation depth under the baseline
to higher inundation depths under the cli-                                 and climate change scenarios using geographic
mate change scenario. The population in areas                              information system (GIS) software (for each 50 by
with inundation depths greater than 0.9 meter                              50 km grid). Climate change increases inunda-
increases from 13.6 million under the baseline                             tion depth in about half of the country, but the
scenario to 16.6 million under the climate change                          inundation depth increases are less than 15 cm for
scenario, or an increase of 22 percent due to cli-                         most areas. Increases in inundation depths larger
mate change. Correspondingly, this is offset by a                          than 15 cm occur in only 544 sq km, or less than
                                                                           0.5 percent of Bangladesh (Table 4.7).
68	 The exposed population count is estimated at the thana level,
    which is the lowest administrative unit, using the population
    density and the total area that falls into each risk zone. The total   Assets and activities exposed to
    exposed population count is the sum of the exposed population          additional inundation risk
    across all thanas.
69	 The rural and urban population growth rates to 2050 are applied
                                                                           The current spatial distribution of assets and
    uniformly to existing rural and urban areas respectively.              activities are projected forward to 2050 based on
56                                                E C O N O M I C S O F A D A P TAT I O N T O C L I M AT E C H A N G E


     Table 4.7 Areas with changes in inundation depth due to climate change
     Additional Inundation Depth due to climate change (cm)      Area (sq km)               Share of total area (%)
No Change                                                                70,249                                 52.6
01–05 cm                                                                 56,102                                 42.0
05–10 cm                                                                  5,841                                  4.4
10–15 cm                                                                    786                                  0.6
More than 15 cm                                                             544                                  0.4
Total                                                                   133522                                100.0


          Figure 4.5 Change in inhundation depth due to climate change
BA N G L A D E S H CO U N T RY ST U DY                                                                                57


expected changes in the Bangladesh economy70                                 a. 	 Height enhancement
applied uniformly across the country. The addi-                              b.	 Additional cross-drainage facility
tional inundation exposure risk due to climate                        2)	   Transport (railways)—height enhancement
change is overlaid on the projected assets and                        3)	   Embankments—height enhancement
activities map using geographic information                           4)	   Coastal polders—additional cross-drainage
system (GIS) software to determine the extent                               facility
of exposed assets and activities. The assets and                      5)	   High-value assets—strengthen erosion con-
activities considered for the analysis include                              trol programs
national highways, regional highways, feeder
roads (type A), feeder roads (type B), railways,                      In each case, the costs are for adaptation only
bridges, embankments, and drainage systems.                           and not for the associated base investments. For
The assets and activities exposed in each inun-                       instance, the base costs of expanding the road
dation risk zone for most assets (e.g. culverts) is                   network are not included, but the costs of adapt-
a count of the number of assets located in that                       ing the entire future network (existing as well as
risk zone. For assets with a large spatial extent,                    new roads) are included.
the exposure estimate is measured by the spa-
tial extent of the assets (land surface in square                     Transport (roads)
kilometers; road, railways, and embankments
in kilometers).                                                       All national and regional roads in Bangladesh
                                                                      were previously designed to lie above the highest
The best available spatially disaggregated maps                       flood level (HFL) with a return period of 50 years,
and data for these activities are available from                      and feeder roads were constructed to lie above
various public sources, including Bangladesh                          normal flood levels (NFL) (Siddiqui and Hossain
Railways, the Bangladesh Water Development                            2006). These standards have not been sufficient
Board, the Local Government Engineering                               to prevent large losses in recent major floods.
Department (LGED), the Center for Environ-                            Road damages accounted for 15 percent of the
mental and Geographic Information Services                            total damages, or about 0.7 percent of GDP dur-
(CEGIS), the Public Works Department, the                             ing the 1998 flood (Islam and Mechler 2007). The
Roads and Highways Department, the Water                              increase in inundated area and inundation depths
Resources Planning Organization, and the                              due to climate change increases the flooding risks
World Bank.                                                           of roads.

Detailed tables of assets exposed to different lev-                   The length of roads (km) exposed to additional
els of additional risk are presented together with                    inundation risk due to climate change for differ-
the cost estimates in the next section.                               ent types of roads is determined based on GIS
                                                                      overlays of the maps of additional inundation
Additional adaptation costs                                           risk zones with the existing road maps for each
The adaptation costs are estimated for climate                        category. By 2050, the road network is expected
proofing the following assets from the additional                     to expand by 25 percent, a less than proportional
inundation risk due to climate change:                                increase compared to population or GDP. Bangla-
                                                                      desh already has one of the densest road networks
1)	 Transport (roads)                                                 in the world, leaving little room for extensive
                                                                      growth in the road network. As a result, most new
70	 These include population and income growth and structural
    shifts in the economy away from agriculture and toward industry
                                                                      investments in the road infrastructure are likely
    and services.                                                     to be for upgrading roads to higher standards, for
58                                                             E C O N O M I C S O F A D A P TAT I O N T O C L I M AT E C H A N G E


            Table 4.8 Length of road by type at additional inundation risk
                           from climate change in 2050 (km)
                                            Feeder         Feeder
  Additional Inundation Depth                Road-          Road                                                                     Share of
               (m)                          Type A         -Type B         National       Regional         Rural          Total      Total (%)
 0–0.5                                         6,175           4,203              998            587        11,065       23,027               87
 0.5–1.0                                          734            515              194              86         1,315       2,844               11
 1.0–1.5                                           72              68              11               6           189         346                1
 1.5–2.0                                           24              19                1              3            89         137                1
 2.0–2.5                                             7                 4             0              1            17           30                -
 2.5–3.0                                             8                 2             1              0              8          19                -
 All exposed                                   7,020           4,810            1,205            683        12,683       26,402             100
 Share of all exposed (%)                        27%             18%               5%             3%           48%        100%


instance by paving unpaved roads rather than for                           Cross-Drainage Facility for roads72
expansion. The assumed 25 percent expansion of
the road network is applied uniformly across the                           The natural flow of flood water currently is
existing network.                                                          obstructed due to an inadequate number of
                                                                           culverts and regulators to allow cross-drainage
Table 4.8 summarizes the total length of roads                             for roads. The increased volume of flood water
that are subject to various degrees of additional                          under a changing climate requires the construc-
inundation due to climate change. Less than 2                              tion of additional drainage structures. Addition-
percent of roads in 2050 are subject to more than                          ally, some existing culverts need to be raised to
1 meter of additional inundation due to climate                            facilitate the free flow of water. Climate change
change, while almost all (87 percent) roads are                            is expected to increase the deeply inundated
expected to be inundated by up to 0.5 meters due                           areas (greater than 0.9 meters) by an additional
to climate change.                                                         7,736 sq km.73 Each drainage structure—about
                                                                           1.5m X 1.8m in size—can drain a 10 sq km
Table 4.9 provides the total cost to raise the entire                      area and costs Tk. 15 million.74 As a result,
road network to offset the additional inundation                           775 additional drainage structures are
risk due to climate change for different types of                          required to drain the additional deep
roads.71 National and regional roads account for                           inundated areas due to climate change
about 12 percent of the total costs of Tk 149 bil-                         at a total cost of Tk. 11,625 million, or
lion, while the remaining 88 percent is required                           $166.07mn. A total of 315 additional culverts
for rural and feeder roads. The cost for elevat-                           need to be raised to avoid additional inundation
ing the entire road network to offset addi-                                from climate change at a cost of Tk. 1 million
tional risk due to climate change is Tk
                                                                           72	 The cost of cross-drainage for railways was not estimated for
148.56 billion, or $2.12 billion.                                              several reasons. First, unlike road culverts, most railway bridges
                                                                               are currently located well above ordinary flood levels. Second,
                                                                               the height of specific bridges and culverts in relation to ordinary
71	 The total cost of raising roads to avoid further inundation due            flood levels was not available. Third, the added risk of flooding
    to climate change is calculated using the following: DBS-wearing           due to climate change is concentrated in a limited area, making it
    course 50 mm thick on average (Taka 8,350 per m3), DBS-base                difficult to ascertain when additional cross-drainage facilities are
    course 50 mm thick on average (Taka 7,899 per m3), aggregate               warranted.
    base Type I-100 mm (Taka 2,819 per m3), aggregate base type
                                                                           73	 These are areas with the F2-F4 classifications.
    II-100mm (Taka 2,232 per m3), roadway excavation (Taka 184
    per m3), and earth fill from borrow pit (Taka 124 per m3).             74	 Experts from IWM
BA N G L A D E S H CO U N T RY ST U DY                                                                                                            59


              Table 4.9 Adaptation cost for roads by type of road (Tk millions)
                                           Feeder         Feeder
    Additional Inundation Depth             Road-          Road                                                                         Share of
                 (m)                       Type A         -Type B          National        Regional         Rural         Total          total
    0–0.5                                    51,169          21,647              10,093         6,883       47,292        137,084           92%
    0.5–1.0                                    3,298           1,459               776           579         3,349          9,461             6%
    1.0–1.5                                      440             208               154            35           594          1,432             1%
    1.5–2.0                                        73                 -              5            11            88           178              0%
    2.0–2.5                                        76             38                 5             9           107           235              0%
    2.5–3.0                                        87             14                 7             7            55           171              0%
    All exposed                              55,144          23,366              11,040         7,525       51,486        148,560          100%
    Share of all exposed (%)                     37%             16%                7%            5%          35%           100%
	

      Table 4.10 Railway track at risk of additional inundation due to climate
                                  change by 2050 (km)
                                                                          Additional Inundation Depth (m)
        Railway track (in km)            0–0.5       0.5–1.0      1.0–1.5          1.5–2.0      2.0–2.5     2.5–3.0         >3.0          Total
    Meter gauge                            173.3          10.8             2.4            1.7           -             -             -      188.1
    Broad gauge                            205.8          35.0             7.0              -           -           0.4           0.3      248.5
    Meter gauge double                     224.7          43.0             2.6            0.5       0.3             0.4             -      271.4
    Total track                            603.8          88.8            11.9            2.1       0.3             0.8           0.3      708.1


each.75 The total for raising culverts is Tk.                               there are a few tracks that can be used for either
315 million, or $4.5 million.                                               broad gauge or meter gauge trains.

Railways                                                                    Table 4.10 summarizes the total kilometers of
                                                                            railway tracks subject to various degrees of addi-
The length of railways (km) exposed to additional                           tional inundation risk due to climate change. Less
inundation risk due to climate change for differ-                           than 2 percent of railway tracks in 2050 are sub-
ent types of rail tracks is determined based on                             ject to more than 1 meter of additional inunda-
GIS overlays of the maps of additional inunda-                              tion due to climate change, while almost all tracks
tion risk zones with existing railway maps. The                             (85 percent) are expected to be inundated by up
rail network has not changed significantly in the                           to 0.5 meters due to climate change. Nearly all of
past fifty years. Aside from doubling the railway                           the tracks that are at additional risk from climate
track between Dhaka and Chittagong in the next                              change are meter gauge tracks.
few years, Bangladesh Railways does not have
any other plans for changing its network for the                            Raising rail tracks entails the following six tasks:
foreseeable future. The rail network in 2050 is                             (1) remove and replace ballast, (2) remove and
assumed to be the same as now with this planned                             replace rail and other heavy iron works, (3) dis-
expansion. Railway tracks in Bangladesh are                                 mantle and re-lay track, (4) earth work with sand,
either broad gauge or meter gauge. Additionally,                            (5) procure 15 percent ballast and spreading, and
                                                                            (6) mechanical temping at four stages. The cost
75	 Rebuilding the flat part cost Tk. 700,000 on average, and other
                                                                            per kilometer for raising railway tracks 0–0.5
    remodeling costs are Tk. 300,000.                                       meter for different gauges of track are shown in
60                                                                E C O N O M I C S O F A D A P TAT I O N T O C L I M AT E C H A N G E


          Table 4.11 Cost per kilometer to raise different railway tracks up
                                  to 0.5 meters ($/km)
                   Description of cost component                                    Meter gauge           Broad gauge               Double gauge
 CARRIAGE COST
 	 Remove and replace ballast                                                                    741                    892                       892
 	 Remove and replace rail &other heavy iron works                                               463                    498                       498
 PERMANENT WAY
 	 Dismantle and Re-lay of track                                                            12,745                 17,039                      17,039
 	 Earth work with sand                                                                         5,607                  6,846                    6,846
 	 Procure 15% ballast & spreading                                                              6.786              10,143                      10,143
 	 Mechanical temping at four stages                                                            2,871                  3,468                    3,468
 Total cost 75                                                                              29,212                 38,886                      38,886


          Table 4.12 Cost of earthwork ($ per km) by type of rail track and
                                                      inundation depth (m)
                                                                        Additional Inundation Depth (m)
          Railway track                  0 - 0.5       0.5 - 1.0        1.0 - 1.5      1.5-2.0          2.0-2.5               2.5-3.0         >3.0
 Meter gauge                                5,607         16,821          28,036           39,250             50,464           61,679         67,286
 Broad gauge                                6,846         20,539          34,232           47,925             61,618           75,311         82,517
 Meter gauge double                         6,846         20,539          34,232           47,925             61,618           75,311         82,517


                       Table 4.13 Adaptation cost for railways ($ millions)
                                                                        Additional Inundation Depth (m)
          Railway track                 0 - 0.5       0.5 - 1.0     1.0 - 1.5     1.5-2.0        2.0-2.5        2.5-3.0           >3.0         Total
 Meter gauge                                      5          0              0               -             -             0                0             6
 Broad gauge                                      8          2              0              0              -               -               -          10
 Meter gauge double                               9          2              0              0            0               0                 -          11
 All tracks                                    22            4              0              0            0               0                0           27


     Table 4.14 Embankments exposed to additional inundation risk due to
                                                      climate change (km)
                                                                                    Additional Inundation Depth (m)
                                                                  0–0.5         0.5–1.0         1.0–1.5         1.5–2.0           > 2.0        Total
 Length of embankment (km)                                          5,088            304                25                4               0     5,421


76


76	 The cost of removing and replacing ballast, cost of removing
    and replacing of rail and other heavy iron works, and cost of
    dismantling and re-laying of tracks have been counted twice
    because during the construction work another diversion track will
    be required to sustain continuous movement of trains.
BA N G L A D E S H CO U N T RY ST U DY                                                                                        61


            Table 4.15 Itemized cost for raising embankments ($ millions)
                                                                 Additional Inundation Depth (m)
                                              0–0.5         0.5–1.0       1.0–1.5       1.5–2.0         > 2.0         Total
Earthwork                                            55              9             1             0              0          65
Compaction                                           26              4             1             0              0          31
Turfing                                               0               -            0              -             -             0
Total cost (million Taka)                            81            13              2             0              0          96


Table 4.11. The cost for broad gauge and double           embankments in 2050 are subject to more than
gauge are $38,886 per km, while the cost for meter        1 meter of additional inundation due to cli-
gauge is somewhat lower at $29,212 per km.                mate change, while almost all (94 percent) are
                                                          expected to be inundated by up to 0.5 meters
Earthwork is the only cost component that                 due to climate change.
increases when rail tracks have to be raised more
than 0.5 m. The cost of earthwork per km of rail          The total cost of raising embankments to avoid
track by type of track and inundation depth is            further inundation due to climate change is cal-
shown in Table 4.12. The estimated total cost             culated using cost estimates available from the
of raising railway track is $27 million                   BWDB for earth work (Taka 125/ m3), compac-
(Table 4.13).                                             tion (Taka 60/ m3) , and turfing (Taka 25/ m2).
                                                          Table 4.15 provides the total cost to raise the
Embankments                                               affected embankments to offset the additional
                                                          inundation risk due to climate change by cost
Structural measures such as embankments and               component and additional inundation depth.
water regulating structures have dominated                Most of the costs are for earthwork. The total
water and flood management practices in Ban-              cost for raising embankments to offset
gladesh. The Bangladesh Water Development                 the additional risk due to climate change
Board (BWDB) maintains a total of 9,943 km                is $96 million (or Tk 6,727 million).
of embankments, 5,111 km of drainage canals,
and 13,949 flood control/regulating structures            Drainage within Coastal Polders77
(BWDB 2006). Embankments are used to protect
agricultural land, major cities, and small towns          Water regulators are used to prevent drainage con-
from 10-year, 15-year, and 50-year return period          gestion in coastal polders. Not all existing water
floods respectively.                                      regulators are currently operational. Reliable sta-
                                                          tistics are not available on the quantity or quality
The length of embankment (km) exposed to                  of existing regulators. The costs of rehabilitating
additional inundation risk due to climate change          existing structures or adding new ones to meet the
is determined based on GIS overlays of the                drainage needs under the baseline scenario are
maps of additional inundation risk zones with             not part of adaptation cost. The higher precipita-
the map of existing embankments. The length               tion level and rising sea levels under the climate
of embankments is not expected to expand fur-
ther through 2050. Table 4.14 summarizes the
                                                          77	 Additional upgrades to drainage systems within coastal polders in
total kilometers of embankments that are sub-                 response to storm surges are not needed if (a) the embankments
ject to various degrees of additional inundation              are raised sufficiently to ensure polders are not overtopped, and
                                                              (b) the congestion from inland flooding is larger than the conges-
due to climate change. Less than 1 percent of                 tion that would occur in case there is some overtopping.
62   E C O N O M I C S O F A D A P TAT I O N T O C L I M AT E C H A N G E
BA N G L A D E S H CO U N T RY ST U DY                                                                                    63


change scenario are expected to increase drain-                          Lacey’s formula is used to predict local scour
age congestion in coastal polders. A total of 1,475                      depths. Increases in scour depth increase the
additional vents—each costing Taka 20 million—                           yearly operation and maintenance cost due to the
are required to drain the affected polders78 that                        additional requirement of launching apron. The
are likely to face increased drainage problems                           additional cost is a function of the increased dis-
under the climate change scenario. The total                             charge, silt factor, and nature of location of scour
cost of additional drainage regulators in                                sites. Increases in the expected peak discharge
the coastal areas is Taka 29,500 million,                                will result in a 6.8 percent increase in the annual
or $421.4 million.                                                       operation and maintenance cost of the existing
                                                                         bank protection project for providing additional
Scour Control                                                            protection against scour.

Increases in the maximum discharge is directly                           BWDB’s average annual operation and main-
correlated with increased erosion of unprotected                         tenance costs for scouring during the last three
river banks (CEGIS 2009) and scour depth for pro-                        years (2007–09 to 2009–10) were Tk. 1,045 mil-
tected river banks. More than 60 towns and cities                        lion ($14.9 million). Increased discharges due to
are currently under the erosion control program.                         climate change are expected to increase annual
While additional towns are likely to encounter                           scour costs by 6.8 percent (Tk. 71 million), or $1.0
erosion and scour concerns, the adaptation cost                          million per year.
estimates only include the additional costs for the
existing protected towns due to availability of                          Adaptation cost for inland flooding
data. Similarly, lack of data has also precluded                         Table 4.16 summarizes the costs of protecting
estimation of the cost of protecting unprotected                         selected infrastructure against the additional risk
river banks from erosion. The only cost estimates                        of inundation from the inland monsoon result-
are for the influence of discharge on scour depth                        ing from climate change by 2050. They provide
for currently protected banks. Three case stud-                          a lower bound on the actual costs of adaption
ies on bank protection on the Brahmaputra, the                           as they do not include additional adaptation in
Ganges, and the Meghna basins found that cli-                            urban areas. Over four-fifths of the total adapta-
mate change would induce likely increases in the                         tion cost is required to raise the height of roads.
maximum discharge of 17 percent in the Ganges,                           Additional drainage structures in coastal areas
20 percent in the Brahmaputra, and 8 percent in                          account for an additional 14 percent of costs,
the Meghna, which would increase scour depths                            while the remaining measures account for less
by 1.87 m, 0.96 m, and 1.13 m respectively                               than 5 percent of the total cost of adaptation for
(BWDB 2003).                                                             inland flooding.


78	 An increase in the water level inside a polder creates drainage
    congestion in the polder. Trial simulations were conducted with      Implications for
    four polders to determine the average number of additional
    vents needed per overtopped polder. Each simulation consisted        Adaptation Strategy
    of adjusting the length of opening under the climate change
    scenario to reduce the water depth inside each polder to the
    level under the baseline scenario. The adaptation measure is the
    additional length of opening needed to ensure the same drainage      Rural households have adapted their farming
    conditions under both scenarios. Additional numbers of vents
    are computed by dividing the length of opening with 1.52 m           systems to the normal inundation by switch-
    (i.e. width of each vent). The four trials indicate 7, 17, 24, and   ing to high-yielding rice crops instead of low-
    51 additional vents are needed to reduce water levels under the
    climate change scenario down to the levels under the baseline        yielding deepwater rice. As a result, agricultural
    scenario. Details of this estimate are in Annex 8.
64                                                E C O N O M I C S O F A D A P TAT I O N T O C L I M AT E C H A N G E


         Table 4.16 Total adaption cost for inland flooding ($ millions)
                           Description of cost component                                 Investment         Annual Recur-
                                                                                                                rent
 Transport – Road height enhancement                                                            2,122                        42
 Transport – Road cross-drainage                                                                      5                        -
 Transport – Railway height enhancement                                                             27                        1
 Embankment – height enhancement                                                                    96                        2
 Coastal Polders – cross drainage                                                                  421                        8
 Erosion Control Program                                                                                                      1
 Total Costs                                                                                    2,671                        54


production has actually risen over the past few            damages from flooding in the agriculture sec-
decades. Severe flooding, however, has resulted in         tor and for the overall economy are estimated
significant damage to the Bangladeshi economy              in Chapter 5.79 Damage estimates from the
in terms of crop losses, destruction of roads and          agriculture and food security component of this
other infrastructure, disruption to industry and           study indicate that climate change increases the
commerce, and injuries and loss in human lives             existing damages by about one-third, with com-
from severe inland monsoon floods once every               mensurate increases in economy-wide losses as
three to five years.                                       well. Similar comparisons were not completed
                                                           for other sectors.
Increased monsoon precipitation, higher trans-
boundary water flows, and rising sea levels                While the cost of protecting against the existing
resulting from climate change are expected to              risks of severe inland monsoon flooding were not
increase the depth and extent of inundation.               estimated, the incremental cost to climate proof
The impacts of climate change are measured                 (a) road networks and railways, (b) river embank-
based on simulations that compare inunda-                  ments and embankments to protect highly pro-
tion levels under the climate change scenario              ductive agricultural lands, (c) drainage systems,
with the 1998 floods. With climate change, the             and (d) erosion control measures for high-value
total flooded area increases by 4 percent, expos-          assets such as towns are substantial (estimated at
ing more assets and activities to risk. While the          $2,671 million in investment costs and $54 mil-
inundation depth increases in about half of the            lion in annual recurrent costs). Full protection in
county, the increases compared to the baseline             2050 will also require addressing the existing risks
scenario are greater than 15cm in only 544 km2,            of flooding, which are likely to be of the same of
or less than 0.5 percent of the country. Since             order of magnitude or larger.
these areas also have a higher density of assets
and activities than the remainder of the country,          A prudent no-regrets strategy would begin by
the damages will be larger than the small areal            strengthening existing flood embankments, sup-
share may suggest. The rural population exposed            plemented by improvements in the spatial and
to flooding, however, is expected to decline from
current levels due to the rural-to-urban migra-            79	 The flooding results in Chapter 5 are based on the average severe
                                                               flood, which is useful for determining average effects over time.
tion that is projected to occur by 2050. While                 The risk and cost estimate in this chapter is measured against a
significant, these increases are a small fraction              baseline level created from the 1998 flood and is useful for exam-
                                                               ining extreme events. Adaption costs estimated in this chapter
of the existing risks of inland flooding.The                   will also protect against the less severe floods.
BA N G L A D E S H CO U N T RY ST U DY                                                                65


temporal resolution of flood forecasting and early      Finally, given the location of Bangladesh at the
warning systems as indicated in the BCCSAP.             tail end of the GBM basin, a longer term adapta-
Once existing risks have been addressed, the            tion strategy has to also include the development
adaptation strategy would either relocate the           of institutions and mechanisms for the sharing
assets and activities in the at-risk areas, or target   of water resources with neighboring countries
them for climate proofing.                              located in the GBM basin.
66                                                     F IV E
     E C O N O M I C S O F A D A P TAT I O N T O C L I M AT E C H A N G E
BA N G L A D E S H CO U N T RY ST U DY                                                                                                  67


Agriculture and
Food Security

Background                                                            of livelihood and employment.81 An important
                                                                      determinant of the overall magnitude of flooding
Agriculture is a key economic sector in Bangla-                       is the timing of the peaks of the three major river
desh, accounting for nearly 20 percent of GDP                         systems (Ganges, Brahmaputra, and Meghna). His-
and 65 percent of the labor force. The achieve-                       torical data reveals that climate variability plays a
ment of food self-sufficiency remains a key devel-                    critical role in observed erratic agricultural growth
opment agenda for the country and is the first                        despite some evidence of diminishing variability.
of six pillars in the Bangladesh Climate Strategy                     Overall production declines during major flood
2009 (GOB 2009). Prior to the start of the EACC                       events are primarily driven by area changes for the
study, the World Bank had initiated a separate                        aman (monsoon season rice) and aus (inter-season
multiyear study on climate change and food secu-                      rice) crops; these losses have increasingly been off-
rity in Bangladesh. Given the significant overlap                     set by increased boro production (dry season rice).
in the objectives and methods between the two                         As a result, agricultural GDP has become less sen-
studies, the food security study was augmented                        sitive to current climate variability compared to
with additional analyses focused on adaptation.                       pre-1990 levels.
The relevant portions of the enhanced study have
been incorporated into the EACC study as sum-                         In addition to floods, the livelihoods of much
marized in this chapter.80                                            of the rural population are also threatened by
                                                                      droughts, salinity, storm surges, cyclones and
The performance of the agriculture sector is heav-                    other natural disasters. Regional droughts and
ily dependent on the characteristics of the annual                    coastal inundation from sea level rise can have
flood. Regular flooding of various types (e.g. flash,                 consequences for agriculture production as large
riverine, coastal) has traditionally been beneficial.                 as those from floods.
However, low frequency but high magnitude floods
can have adverse impacts on agricultural produc-                      Despite these climate hazards, rice and wheat
tion and rural livelihoods, especially of the poor,                   production have tripled from about 10 million
for whom the agriculture sector is a critical source
                                                                      81	 Between 1991 and 2000, 93 major disasters were recorded in
                                                                          Bangladesh, resulting in billions of dollars in losses, much of
80	 The augmented study is now complete and is available separately       which were in the agriculture sector. The 1998 flood resulted in
    as Yu et al. 2010.                                                    crop losses of over 2 million MT.
68                                           E C O N O M I C S O F A D A P TAT I O N T O C L I M AT E C H A N G E


metric tons (Mmt) in the early 1970s to almost       Projected Future
30 Mmt by 2001, partly due to the rapid expan-
sion of surface and groundwater irrigation and
                                                     Climatic Conditions
the introduction of new high-yielding crop
varieties. The challenge for Bangladesh is to        The direct impacts of climate on crop yields
continue the productivity enhancements of            are estimated based on climate predictions from
the past few decades, which ensures that the         sixteen different Global circulation models for
expected rise in demand for food (resulting          three emission scenarios for the 2030s, 2050s,
from increased population and higher income          and 2080s. These are compared to counter-
levels) can be met despite the increasing pres-      factual scenarios based on the historical past
sures on available land and water resources          (1970–99) for the respective models. The median
from overuse, droughts, and quality changes          model predictions are a warmer (1.55 °C) and
(e.g. salinity).                                     wetter (annual precipitation increases of 4 per-
                                                     cent) climate by the 2050s, with greater contrasts
Climate change poses additional challenges to        between the wet and dry seasons. Greater model
agriculture beyond the existing risks from cur-      uncertainty (in terms of magnitude and direc-
rent variability. Long-term changes in tempera-      tion) exists with future precipitation than future
tures and precipitation have direct implications     temperature. Simulated future temperature
on evaporative demands and consequently              changes significantly separate from the back-
agriculture yields. Moreover, the changing           ground temperature variations. Precipitation is
hydro-characteristics (e.g. onset, duration, and     subject to large existing inter-annual and intra-
magnitude) of extreme events may affect agri-        annual variations. Simulations of future rainfall
culture production significantly. Finally, sea       do not significantly separate themselves from the
level rise may have important implications on        historical variability for any month or season.
the sediment balance and may alter the pro-
file of the area inundated and salinity in the       Primarily driven by increased monsoon precipita-
coastal areas.                                       tion in the GBM basin, models on average demon-
                                                     strate increased future flows in the three major rivers
This study examines the impacts of climate           into Bangladesh (as much as 20 percent).82 Larger
change on agricultural yields, cropping pat-         changes are anticipated by the 2050s compared to
terns, and production, both from a sectoral per-     the 2030s. Larger changes are observed on average
spective as well as in the context of the overall    for the Ganges. The exact magnitude is dependent
economy. The key innovations introduced by           on the month. Given that most GCMs project both
the study are (a) improved characterization of
the changes in climate using a comprehensive
                                                     82	 A Ganges-Brahmaputra-Meghna (GBM) regional model and
set of climate projections, (b) use of agricul-          national hydrologic model are developed to simulate discharges
tural impact functions developed from coun-              and water levels into/in Bangladesh under various climate
                                                         change scenarios for the flood monsoon months from May
try-specific data, (c) integration of agricultural       to September. Annex 15. Models used for flood hydrology a
                                                         detailed description of these models. Bangladesh is divided into
model results into a macroeconomic (CGE)                 sixteen subregions to capture agro-ecological variations. Eleven
framework to examine both direct and indirect            are used for hydrologic modeling purposes. A delta approach is
                                                         used to model future changes. The delta between the baseline
impact and responses, and (d) examination of a           and future time period for the climate parameter of interest
range of climate risks, including the changing           (i.e. percentage change in precipitation and absolute change
                                                         in temperature) is applied directly to the historical time series.
characteristics of floods, droughts, and poten-          This preserves the differences across subregions and maintains
tial sea level rise.                                     the day-to-day and year-to-year variability that is not captured
                                                         accurately in the GCM historical outputs. A subset of five GCMs
                                                         and two emissions scenarios were selected as model experiments.
BA N G L A D E S H CO U N T RY ST U DY                                                                    69


an increasing trend of monsoon rainfall and greater       (Figure 5.1). Considering only temperature, precip-
inflows into Bangladesh, it follows that the flooding     itation, and CO2 changes, aus and aman median
intensity would worsen. On average, models simu-          production increases by 2 percent and 4 percent by
late increases in flooded area in the future (over 10     2030 and 2050 respectively across the model simu-
percent by 2050). This is primarily in the central        lations. Wheat also increases, reaching a maximum
part of the country at the confluence of the Ganges       of 4 percent by 2050.
and Brahmaputra rivers and in the south.
                                                          These distributions range approximately +/- 2
Increases in yearly peak water levels are pro-            percent. Boro production declines— around 8
jected for the northern subregions and decreases          percent by 2080—under climate change scenarios.
are projected for the southern subregions. Not            These changes are conservative, as it is assumed
all estimated changes are statistically significant.      that farmers have limitless access to irrigation.
More models demonstrate changes that are sig-             Mean shifts in floods are estimated to reduce
nificant by the 2050s. In general, changes are            production of aus and aman between 1 percent
less than a half meter from the baseline. Fur-            and 4 percent. The narrow model distribution of
thermore, across the subregions, most GCMs                flood impacts projected by different GCMs sug-
show earlier onset of the monsoon and a delay             gest a robust change, although changes are small
in the recession of flood waters.                         in comparison to year-to-year variability.

The study also draws upon prior results using the         Production changes due to flood damages only are
MIKE21 two-dimensional estuary model (DEFRA               presented in Figure 5.2 for aus and aman rice. Boro
2007), which indicated that the total flooded area in     and wheat are assumed to be unaffected by floods.
the coastal districts would increase by 6 percent, 10     Flood damages are projected to increase in most
percent, and 20 percent under three scenarios—15          scenarios, particularly for the 2050s time period
cm, 27 cm, and 62 cm—of sea level rise.                   and for the aman crop grown at the height of the
                                                          monsoon. Median additional losses across all sce-
                                                          narios are 1 percent and 2 percent in the 2030s
Direct Impacts on                                         and 2050s respectively. Maximum median flood
Agriculture                                               losses occur in the 2050s A2, with national aman
                                                          production falling 4 percent and national aus pro-
                                                          duction dropping 2.4 percent. More modest crop
Dynamic biophysical crop models are developed (i.e.       losses are projected for the B1 scenario, reaching
DSSAT) and validated using available information          only 1 percent of aus production and 3 percent of
on climate, soils, cultivars, and management prac-        aman production in the 2050s. The narrow dis-
tices. Simulations of changes in crop yield include       tribution of flood damages projected by different
impacts from climate only (CO2, temperature, and          GCMs suggests a robust change, although changes
precipitation), mean changes in floods, and coastal       are small compared to the year-to-year variability
inundation, both separately and in combination.           in each time period. These results are likely to be
The gap between actual yields and modeled potential       optimistic, as changes in inter-annual variability
yields is large. Replicating actual yields is secondary   between the baseline and future time periods are
to estimating the changes from the baseline. Yields       likely to produce larger flood damages and several
vary from season to season by 10 to 20 percent.           sub-regions were not modeled.

Elevated CO2 concentrations can have a significant        Considering all climate impacts (CO2 fertiliza-
positive effect on yields for all crops and locations     tion, temperature and precipitation changes, flood
70                                                          E C O N O M I C S O F A D A P TAT I O N T O C L I M AT E C H A N G E


     Figure 5.1: Percentage change in national potential production due to
                                    temperature, precipitation, and CO2
                                         PERCENTAGE LOST COMPARED TO BASELINE

                                             NATIONAL AUS PRODUCTION CHANGE
 20%

 10%

     0

 -10%

 -20%
          2030s     2050s      2080s     2030s      2050s     2080s      2030s     2050s      2080s     2030s      2050s     2080s

                                            NATIONAL AMAN PRODUCTION CHANGE
 20%

 10%

     0

 -10%

 -20%
          2030s     2050s      2080s     2030s      2050s     2080s      2030s     2050s      2080s     2030s      2050s     2080s

                                            NATIONAL BORO PRODUCTION CHANGE


 20%


     0


 -20%

          2030s     2050s      2080s     2030s      2050s     2080s      2030s     2050s      2080s     2030s      2050s     2080s

                                            NATIONAL WHEAT PRODUCTION CHANGE


 20%


     0


 -20%

          2030s     2050s      2080s     2030s      2050s     2080s      2030s     2050s      2080s     2030s      2050s     2080s


Notes: Potential production of each crop (aus, aman, boro, wheat) is compared relative to the baseline undamaged simulation. Each
panel has four sections, each containing the three future time periods and presenting (from left to right) the combination of all emis-
sions scenarios, the A1B, the A2, and the B1 scenario. The results of the CO2 impact experiments are displayed as green triangles,
while the median of the temperature and precipitation impact experiments is shown as a red triangle. The distribution of undam-
aged potential yields projected by GCMs are presented as a box and whiskers diagram, consisting of a red line representing the
median value, a box enclosing the inter-quartile range (the middle 50 percent of models), dashed whiskers extending to the furthest
model that lies within 1.5x the inter-quartile range from the edges of the box, and red plus symbols for additional models that are
perceived as outliers. Source: Yu, W.H., et al. (2010)
BA N G L A D E S H CO U N T RY ST U DY                                                                                            71


changes, sea level rise), the median of all rice crop               to climate change. For instance, average losses in
projections shows declining national production,                    the Khulna region are -10 percent for aus, aman,
with boro showing the largest median losses (Fig-                   and wheat and -18 percent for boro by the 2050s
ure 5.3). However, for aus (-1.5 percent) and aman                  due in large part to rising sea levels. These produc-
(-0.6 percent), the range of model experiments                      tion impacts ignore economic responses to these
covers both potential positive gains and losses and                 shocks (e.g. land and labor reallocation, price
does not separate convincingly from zero. Most                      effects) which will provide a buffer against the pre-
GCM projections estimate a potential decline in                     dicted physical losses to some degree.
boro production with a median loss of 3 percent
by the 2030s and 5 percent by the 2050s.                            Climate change exacerbates the negative impacts
                                                                    of existing climate variability by further reducing
Wheat production increases out to the 2050s (+3                     rice production by a projected cumulative total of
percent). Boro and wheat changes are conservative,                  80 million tons over 2005–50 (about 3.9 percent
as it is assumed that farmers have limitless access                 each year), driven primarily by reduced boro crop
to irrigation. In each subregion, production losses                 production. This is equivalent to almost two years
are estimated for at least one crop. The produc-                    worth of rice production lost over the next 45
tion in the southern subregions is most vulnerable                  years as a result of climate change. Uncertainty


        Figure 5.2 Percentage change in national potential production from
                                               flood damages only
                                       PERCENTAGE LOST COMPARED TO BASELINE

                          NATIONAL AUS PRODUCTION CHANGES — FLOOD DAMAGES ONLY
10%

  5%

    0

 -5%

-10%
           ALL 2030s           ALL 2050s            A2 2030s            A2 2050s            B1 2030s            B1 2050s

                         NATIONAL AMAN PRODUCTION CHANGES — FLOOD DAMAGES ONLY
10%

  5%

    0

 -5%

-10%
           ALL 2030s           ALL 2050s            A2 2030s            A2 2050s            B1 2030s            B1 2050s


Notes: Percentage change in national potential production for each crop (aus and aman) affected by basin floods relative to the
baseline flood-only simulation. Boro and wheat are assumed to be flood-free. Each panel has three sections, each containing the
two future time periods and presenting (from left to right) the combination of all emissions scenarios, the A2, and the B1 scenario.
The distribution of flood-damaged potential yields projected by GCMs are presented as a box and whiskers diagram, consisting of a
red line representing the median value, a box enclosing the inter-quartile range (the middle 50 percent of models), dashed whiskers
extending to the furthest model that lies within 1.5x the inter-quartile range from the edges of the box, and red plus symbols for
additional models that are perceived as outliers.
Source: Yu, W.H., et al. (2010)
72                                                          E C O N O M I C S O F A D A P TAT I O N T O C L I M AT E C H A N G E


 Figure 5.3 Percentage change in national potential production combined
                                                             effects

                                         PERCENTAGE LOST COMPARED TO BASELINE

                                   NATIONAL AUS PRODUCTION CHANGES — ALL IMPACTS


 10%


      0


 -10%


            ALL 2030s           ALL 2050s             A2 2030s            A2 2050s             B1 2030s             B1 2050s

                                  NATIONAL AMAN PRODUCTION CHANGES — ALL IMPACTS


 10%


      0


 -10%


            ALL 2030s           ALL 2050s             A2 2030s            A2 2050s             B1 2030s             B1 2050s

                                  NATIONAL BORO PRODUCTION CHANGES — ALL IMPACTS


 10%


      0


 -10%


            ALL 2030s           ALL 2050s             A2 2030s            A2 2050s             B1 2030s             B1 2050s

                                 NATIONAL WHEAT PRODUCTION CHANGES — ALL IMPACTS
 10%

     5%

      0

  -5%

 -10%
            ALL 2030s           ALL 2050s             A2 2030s            A2 2050s             B1 2030s             B1 2050s


Notes: Percentage change in national potential production for each crop (aus, aman, boro, and wheat) with the combined effects
of CO2, temperature, precipitation, and basin flooding. Each panel has three sections, each containing two future time periods and
presenting (from left to right) the combination of all emissions scenarios, the A2, and the B1 scenario. The distribution of potential
yields projected by GCMs are presented as a box and whiskers diagram, consisting of a red line representing the median value, a
box enclosing the inter-quartile range (the middle 50 percent of models), dashed whiskers extending to the furthest model that lies
within 1.5x the inter-quartile range from the edges of the box, and red plus symbols for additional models that are perceived as
outliers. Source: Yu, W.H., et al. (2010)
BA N G L A D E S H CO U N T RY ST U DY                                                                      73


about future climate change means that annual            Bangladesh economy is characterized by 36 sectors,
rice production losses range between 3.6 percent         16 agro-climatic regions, rice split by seasonal vari-
and 4.3 percent. Climate change has particularly         eties, national labor and capital markets, regional
adverse implications for boro rice production and        land markets, and three representative households
will limit its ability to compensate for lost aus and    (marginal, small-scale, and large-scale farms). The
aman rice production during extreme climate              CGE captures the detailed sector and labor mar-
events. This will further jeopardize food security       ket structure of the Bangladesh economy—as well
in Bangladesh, necessitating greater reliance on         as the linkages among production, employment,
other crops and imported food grains. Rice pro-          and household incomes—and is run forward over
duction in the southern regions of Patuakhali and        2005–50 in a recursive-dynamic manner. The
Khulna is particularly vulnerable.                       climate impact channels captured by the CGE
                                                         model include crop yield changes from the hydro-
                                                         crop models, additional impacts of low-frequency
Economy-wide Impacts                                     extreme events, and sea level rise.
and Responses
                                                         Overall, agricultural GDP is projected to be 3.1 per-
                                                         cent lower each year as a result of climate change
These production impacts ignore economic                 ($36 billion in lost value-added). Climate change
responses to these shocks (e.g. land and labor reallo-   also has broader economy-wide implications. This
cation, price effects). These economic effects will to   will cost Bangladesh $129 billion in total GDP over
some degree buffer against the physical losses pre-      the 45-year period 2005–50, equivalent to $2.9 bil-
dicted. A dynamic recursive computable general           lion overall lost each year to climate change, or
equilibrium (CGE) model is developed to estimate         alternatively an average annual 1.6 percent reduc-
the consequences of climate variability and change       tion in total GDP. Average loss in agricultural GDP
on economic growth and household welfare. The            due to climate change is projected to be a third of


 Figure 5.4 National rice production                       Figure 5.5 Share of discounted GDP
                      (Metric tons)


Source: Yu, W.H., et al. (2010)                          Source: Yu, W.H., et al. (2010)
74                                             E C O N O M I C S O F A D A P TAT I O N T O C L I M AT E C H A N G E


the agricultural GDP losses associated with existing   multiple climate risks. These areas experience
climate variability. Uncertainty surrounding GCMs      the largest decline in rice production due to cli-
and emission scenarios means that costs may be as      mate change. This is for three reasons. First, these
high as $5.1 billion per year over 2005–50 under       regions already experience significant declines
less optimistic scenarios. Additionally, these eco-    in aus and aman rice production due to climate
nomic losses are projected to rise over time.          variability, which is expected to worsen under cli-
                                                       mate change. Secondly, boro yields are severely
These climate risks will have severe implications      affected by the effects of changes in mean rainfall,
for household welfare. Around 80 percent of total      temperature and mean shifts in the flood hydro-
losses fall directly on household consumption.         graphs. Thus, reductions in boro production limit
About 80 percent of the economic losses occur          the ability for these regions to compensate for lost
outside of agriculture, particularly in the upstream   aus and aman rice production during extreme
and downstream agriculture value-added process-        events. The south is also affected the most by ris-
ing sectors. This means that both rural and urban      ing sea levels, which permanently reduces culti-
households are adversely affected. Per capita con-     vable land. The largest percentage declines in per
sumption is projected to fall for both farm and        capita consumption are projected in these regions.
nonfarm households.                                    Finally, the northwest is also vulnerable, as the lost
                                                       consumption is a large fraction of existing house-
The southern and northwest regions are the most        hold consumption. Adaptation measures should
vulnerable. The south sits at the confluence of        focus on these areas.
BA N G L A D E S H CO U N T RY ST U DY                                                                        75


Implications for Adaptation                            with the probable impacts. Significant additional
                                                       investments in promoting these types of adapta-
Strategy                                               tions are still needed.

Some of the key results of the study are that the      Second, a no-regrets strategy is to promote
net impacts are that climate change will result in     activities and policies that help households build
losses of about 3.1 percent in agricultural GDP        resilience to existing climate risks today. Both
and even larger economy-wide losses through            processes—adapting to climate change and
2050, with losses increasing over time. These losses   stimulating the agriculture sector to achieve rural
are not evenly distributed across the country, with    growth and support livelihoods—require efforts
the southern coastal region and the northwest          to diversify household income sources; improve
bearing much larger losses. Nearly 80 percent of       crop productivity; support greater agricultural
the losses are borne by households, with the poor      research and development; promote education
and the most vulnerable within these communi-          and skills development; increase access to finan-
ties bearing the greatest burden. While warmer         cial services; enhance irrigation efficiency and
and wetter climates increase the yields of the pri-    overall water and land productivity; strengthen
mary rice crops—aman and aus—the impacts of            climate risk management; and develop protec-
severe floods is expected to result in a net decline   tive infrastructure. Moreover, the current large
in the total production of these crops. Higher         gap between actual and potential yields suggests
precipitation and temperatures actually result in      substantial on-farm opportunities for growth and
lower yields of the dry season boro crop which         poverty reduction. Expanded availability of mod-
has been used in recent years to offset crop losses    ern rice varieties, irrigation facilities, fertilizer use,
following severe floods.                               and labor could increase average yields at rates
                                                       that could potentially more than offset the cli-
While the cost of adaption to climate change in        mate change impacts. Significant additional plan-
the agriculture sector was not directly estimated      ning and investments in promoting these types of
due to resource and time constraints. However, a       adaptations are still needed.
number of implications of the study for adapta-
tion cost and a strategy can be inferred and sum-      Third, the southern region is the most vulner-
marized below.                                         able. The south sits at the confluence of multiple
                                                       climate risks. These areas experience the largest
First, increased investments in adaptation in the      decline in rice production due to climate change.
agriculture sector are critical to ensuring contin-    This is for three reasons: (a) these regions already
ued growth and poverty alleviation. Bangladesh         experience significant declines in aus and aman
will continue to depend on the agriculture sec-        rice production due to climate variability, which
tor for economic growth. Rural households will         is expected to worsen under climate change; (b)
continue to depend on the agriculture sector for       boro yields are severely affected by the effects of
income and livelihoods. Though the government          changes in mean rainfall, temperature, and mean
has made substantial investments to increase the       shifts in the flood hydrographs, so reductions in
resilience of the poor (e.g. new high-yielding crop    boro production limit the ability for these regions
varieties, protective infrastructure, disaster man-    to compensate for lost aus and aman rice produc-
agement), these variability impacts may, as has        tion during extreme events; and (c) the south is
been shown, be exacerbated by the long-term            affected the most by rising sea levels, which per-
effects of climate change. The scale of current        manently reduces cultivable land. The largest
efforts remains limited and is not commensurate        percentage declines in per capita consumption
76                                                               E C O N O M I C S O F A D A P TAT I O N T O C L I M AT E C H A N G E


will be in these regions. Specific focus should be                        the climatic regime and may be suitable in the
placed here.                                                              near term. Each of these measures are evaluated
                                                                          based on a set of criteria, including policy and
Fourth, while the public sector cost of adapting                          institutional, socioeconomic, economic, and envi-
in the agriculture was not estimated, the relative                        ronmental. The net revenues to farmers of adopt-
merits of a number of short term adaptation                               ing these strategies are also estimated. These are
measures – namely the extension of currently                              summarized in Figure 5.6. Adaptation measures
available options into new areas – are examined                           to the right and higher up in the graph provide
from the farmer’s perspective. These measures                             larger private payoffs and need to be compared to
primarily examine the merits of promoting exist-                          the social cost of implementing these options.
ing crops from one area to another as the climate
regimes shifts. The adaptations can focus on                              Finally, the medium to long term adaptation strat-
increasing crop productivity, improving irrigation                        egy has to include flood control, given the signifi-
efficiency or expanding water supply, crop diversi-                       cant crop damages and losses from severe floods
fication and intensification, generating alternative                      (some of which has been costed in Chapter 4) and
enterprises (either farm or non-farm sector) to                           the development of alternative cultivars particu-
diversify household income sources, and expand-                           larly to the boro crop in the southern region.
ing access to training and credit. Sixteen adapta-
tion options were identified through consultation                         Finally, longer run strategies in the agriculture
with local officials, NGOs, and farmers to address                        sector need to examine the development of new
the risks of flooding, drought, and salinity to agri-                     cultivars that are able to better withstand the new
culture.83 Many of these measures are already in                          climate and to control floods. A key aspect of the
place in some regions of Bangladesh, or could be                          latter will be the development of institutional
in place with some modification. They provide a                           mechanisms for the sharing of water resources
low cost option for adapting to small changes in                          with neighboring countries in the GBM basin.


83	 These measures are (1) zero or minimum tillage to cultivate
    potato, aroid and ground nut with water hyacinth and straw
    mulch; (2) zero tillage cultivation of mashkalai, khesari, lentil,
    and mustard; (3) modified sorjan system (zuzubi garden) with
    vegetable cultivation; (4) floating bed vegetable cultivation; (5)
    cultivating foxtail millet (kaon); (6) parenga practice of t-aman
    cultivation system; (7) relay cropping of sprouted seeds of aman
    rice in jute fields; (8) raising vegetable seedlings in poly bags
    homestead trellises; (9) zero tillage maize cultivation; (10) zero
    or minimum tillage to cultivate potato with water hyacinth and
    straw mulch; (11) chickpea cultivation using a priming technique;
    (12) supplementary irrigation for T aman; (13) year-round
    homestead vegetable cultivation; (14) pond water irrigation for
    vegetable cultivation; (15) sorjan system of cropping of veg-
    etables and fisheries; and (16) raising vegetable seedlings in poly
    bags homestead trellises.
BA N G L A D E S H CO U N T RY ST U DY                                                                                      77


                                    Figure 5.6 Net revenues and overall social preference
                                                               of adaption measures


                         60


                                              2.4

                         55
                                         1.2                         2.6
                                               2.1


                                                                                                  1.3       3.1
  OVERALL RATING SCORE


                         50                    2.3


                                                                                           2.5
                                                               2.2     1.1
                                        1.1

                         45
                                              1.7                                                 3.2


                                              1.4
                         40       1.6
                                                                                            1.5
                                                                                                 1.8


                         35

                              0                      100,000                 200,000              300,000         400,000

                                                               NET REVENUE (TK) PER HECTARE


                                                      FLOOD           DROUGHT          SALINITY


Source: Yu, W.H., et al. (2010)
78
                                                           S IX
     E C O N O M I C S O F A D A P TAT I O N T O C L I M AT E C H A N G E
BA N G L A D E S H CO U N T RY ST U DY                                                                                         79


Local Perspectives
on Adaptation

Background                                                climate-related hazards (see Figure 4).84 While
                                                          each ‘hotspot’ was selected for a primary hazard,
Bangladesh is exposed to a wide variety of climate        many areas are in fact exposed to multiple hazards
change impacts and induced hazards including              which reinforce the negative shocks of these haz-
drought, river floods, flash floods, cyclones and tidal   ards on the affected communities. Differentiated
surges, salinity intrusion, water-logging and drain-      patterns of vulnerability to climate change also
age congestion. Current climate variability already       emerge from the uneven socio-economic develop-
represents a profound threat to the livelihoods of        ment of the country. While the sites shown are
the poor as they are often collocated in areas of         large areas (districts) exposed to various types and
highest risk (Figure 6.1) and are directly depen-         magnitudes of climate hazards, actual fieldwork
dent on climate sensitive sectors of the economy          was conducted in particular villages or urban
such as agriculture and fisheries. The objective of       slums with different socio economic characteris-
this component is to examine the determinants of          tics (Table 6.1, Figure 6.2). The selected hotpots
the adaptive capacity and practices of vulnerable         exhibit variation in socioeconomic development,
populations, and solicit from local and national          resource availability and exposure to natural
stakeholders – through participatory scenarios –          hazards.85 Experiences with coping strategies
the types of public support that would best enable        for climate hazards and the people’s preferences
the vulnerable population to cope with the poten-         for adaptation investments across locations were
tial impacts of climate change. The analysis uses         determined from fieldwork and participatory
a broad assortment of tools including a literature        scenario development workshops as described in
review, fieldwork consisting of focus groups and          Annex 16.
sample surveys in eight “hotspots”, and a series of
participatory scenario development (PSD) work-
shops at the local, regional, and national levels.        84	 ‘Hotspots’ refers to those regions already vulnerable to climate
                                                              variability and likely to suffer substantial impacts in future from
                                                              climate change, with poverty and vulnerability characteristics also
Overview of Hotspots                                          present.
                                                          85	 Pockets of high poverty incidence generally coincide with eco-
                                                              logically poor areas of Bangladesh: i. low-lying depression area,
Based on a literature review, a total of eight study          called haor, in the north-east; ii. drought-prone area on relatively
sites or ‘hotspots’ were selected to better under-            higher land in the northwest; iii. several upazilas fringing the
                                                              major rivers, particularly along the Jamuna River; and iv. several
stand the impact on the community of different                of the south-eastern upazilas, including the Chittagong Hill Tract
80                                              E C O N O M I C S O F A D A P TAT I O N T O C L I M AT E C H A N G E


Agriculture is the most affected sector in all          Livestock also are an important asset for the
hotspots since crop cultivation is highly weather-      poor, whether the products are consumed by the
dependent. In salinity and tidal-flood prone areas,     household or sold in the market. These assets are
crop cultivation is gradually becoming difficult        affected during extreme events: livestock often die
due to an increase in salinity. In other areas such     in cyclones as people fail to move them to safe
as Sirajganj and Sunamganj, people can now grow         shelter. An indirect effect of climate change on
crops only in the boro season, and in waterlogged       livestock is the reduced ability to produce fodder
Jessore, farmers cannot cultivate at all in any sea-    for livestock due to declining crop cultivation. In
son. Trees and vegetation are also severely affected    some places, grasses cannot be grown; in others,
by climate change in all rural areas; for example, in   grazing lands are flooded during the monsoon.
water-logged, river, and flash flood prone hotspots,    The fisheries sector is highly affected in Bagerhat
trees cannot be grown due to excess water. Fre-         and Jessore, where cyclones and saline water have
quent cyclones in Bagerhot, Satkhira, and Cox’s         caused ghers to be damaged and fisheries to die.
Bazaar cause trees to be uprooted and soil salin-       Infrastructure is also directly impacted by climate
ity prevents homestead gardening. Reduced veg-          change. Frequent cyclones cause massive destruc-
etable and fruit cultivation hurts nutrition levels,    tion of embankments, houses, roads, bridges,
especially for the poor, who cannot afford to pur-      trees, crops and fisheries, as well as loss of human
chase these items in the market.                        and animal lives. Entry of tidal water due to high


                             Figure 6.1 Poverty and climate hazards


Source : BBS, World Bank and WFP 2009
BA N G L A D E S H CO U N T RY ST U DY                                                                                       81


      Table 6.1: Location of eight hotspots selected for based of hazard
    Hotspot (hazard)               Region         District             Upzilla                   Union            Village
 Drought                      NW               Naogaon          Porsha                     Nitpur Sadar      Nitpur
 Salinity                     SW               Satkhira          Assasuni                  Protapnagar       Sonatankathi
 Cyclone                      SW               Bagerhat         Shorankhola                Southkhali        Gabtala
 River Flood                  NW               Sirajganj        Kazipur                    Natuar Para       Ghora Gacha
 Flash Flood                  NE               Sunamganj        Tahirpur                   Dakshin Sreepur   Janjail
 Waterlogging                 SW               Jessore          Keshobpur                  Safalakathi       Kalicharanpur
 Tidal flood                  SE               Cox’s Bazar      Cox’s Bazar Sadar          Khurushkul        Rastarpar
 Drainage congestion          Dhaka            Dhaka            Mohammedpur                Adabor            Comfort House


                                                             FIGURE 4
                Figure 6.2 Map of Bangladesh showing the eight hotspots
                                  Map of Study Sites in Bangladesh


                                                                                      Flash Flood
                                                             River Floods


        Drought


                                                                                   Drainage Congestion (Urban)

         Waterlogging


                 Salinity
                                                  Cyclones

                                                                        Cyclones & Tidal Floods
 L IST OF SITE S

  1. Porsha Upazila, Naogaon District,           5. Tahirpur Upazila , Sunamganj District
  2. Assasuni Upazila , Satkhira District        6. Keshobpur Upazila , Jessore District
  3. Shorankhola Upazila , Bagerhat District     7. Cox’s Bazar Sadar Upazila , Cox’s Bazar District
  4. Kazipur Upazila , Sirajganj District        8. Mohamedpur Upazila, Dhaka District
82                                                 E C O N O M I C S O F A D A P TAT I O N T O C L I M AT E C H A N G E


waves and breached embankments leads to inun-              decrease people’s mobility and livelihood options
dation and salinization of agricultural lands and          as in the northeast region, where lack of road
water bodies, which severely affects the livelihoods       infrastructure also left villages isolated and suf-
of the already disaster-displaced populace.                fering from underinvestment by government and
                                                           NGOs. In Cox’s Bazaar, poor communication
                                                           meant that people could not travel to safe shelter
Vulnerability to                                           easily and relief materials did not reach in time.
Climate Change                                             Further, just as asset depletion can lead to chronic
                                                           poverty at the household level, at the area level
                                                           too repeated hazard events can reduce a region’s
Vulnerability was found to stem from exposure              adaptive capacity. For example, rising water lev-
factors such as physical location and hazard-              els can completely sever road links for months
proneness (as in the riverine char islands); sensi-        at a time, with consequent impacts on regional
tivity factors such as economic geography and              growth. Diversified structure of the regional
levels of regional development; socio-economic             economy is important in providing a base for
status and degree of economic “power” (e.g., in            effective adaptation. For example tourist areas
value chains), and social differentiation including        offer a broader range of livelihood opportunities
gender. Socio-economic factors exacerbating sen-           for area households than those solely reliant on
sitivity at the household level included: landless-        agriculture, therein reducing vulnerability to cli-
ness, illiteracy of adults and children, temporary         mate impacts.
migration status, large family size, and female-
headed household status. At the community level,           Climatic Shocks and the Effects of Multiple
these included latent social conflict and lack of          Hazards: Climate hazards subject households
political voice (e.g., urban in-migrants).                 to economic shocks. Natural disasters were men-
Social capital and organizational presence are important   tioned by more than half of all respondents in
inputs to household and area adaptive capacity.            Bangladesh as the reason for sudden loss of
Urban respondents expressed more concern than              household income, while illness or death of fam-
rural residents about leaving assets unattended            ily members named by only 12 percent of house-
during floods, suggesting that urban households            holds. It is important to consider the temporal
may take dangerous risks (i.e., not evacuating)            scale of climate-related shocks i.e., rapid-onset
due to a heightened sense of social insecurity.            (such as cyclones) or slow-onset (e.g., floods and
Fieldwork revealed that NGO presence was                   waterlogging), and also their frequency. Multiple
highly unequally distributed, with an overwhelm-           extreme events arriving one after another do not
ing presence in cyclone-prone Bagerhat district            allow households sufficient time to recover their
(rebuilding houses, providing radios and deliver-          earlier asset base. Further, hotspots investigated
ing cyclone warnings) but no presence in saline            were found to be doubly- or triply-exposed to
Satkhira district that also suffered, secondarily,         hazards. For instance, river bank erosion leads
from cyclones. Here, failure to consider the role          to agricultural land loss in cyclone-prone areas,
of overlapping hazards meant that neither disas-           further reducing household ability to cope with
ter response infrastructure, nor the social learning       frequent disasters. The compound effect of these
that accompanied it, as in Bagerhat were present           events was often enough to tip households into
in the saline area.                                        chronic poverty status. None of the hotspots had
                                                           particularly strong adaptive capacity given their
Area Asset Status, including infrastructure:               poor asset bases that prevented livelihood diver-
Poor communication and transport facilities                sification in times of crisis. Long-term adaptation
BA N G L A D E S H CO U N T RY ST U DY                                                                    83


planning (beyond short and medium-term mea-                their poor asset bases, which prevent asset trans-
sures as changing crop types and planting dates)           formation in times of crisis. Thus most house-
includes the need for economy-wide diversifi-              holds interviewed had little room for maneuver in
cation, as well as significant improvements in             adapting to climate change, due to the low asset
human capital levels to allow households to take           base level from which they started. Poor urban
advantage of risk-prevention strategies at house-          dwellers face particularly few options for liveli-
hold and area levels.                                      hood diversification and hold low social capital.
                                                           Poor urban dwellers are typically not competitive
                                                           on the labor market due to lack of education.
Adaptation Practices                                       Housing and health conditions for them remain
                                                           poor, and access to services weak.
Adaptation practices by households vary accord-
ing to hazard type, location, and asset base hold-         The most common form of rural adaptation is
ings. Variations in the self-reported levels of            temporary migration for day labor work by adult
different types of “capital” for households in dif-        men (undertaken by 37 percent of surveyed
ferent hotspots are show in Figure 6.3. None of            households, mainly to other rural areas). Storage
the hotspots had strong adaptive capacity given            of food and drinking water before an extreme


                Figure 6.3 Livelihood capital assets in eight hotspots

                                                  HUMAN
                                                   5
                                                  4.5
                                                      4
                                                  3.5
                                                      3
                                                  2.5
                                                      2
       FINANCIAL                                  1.5                                          SOCIAL

                                                      1
                                                      .5
                                                      0


                       NATURAL                                                  PHYSICAL


                          Cyclone prone         River flood prone           Tidal surge prone
84   E C O N O M I C S O F A D A P TAT I O N T O C L I M AT E C H A N G E
BA N G L A D E S H CO U N T RY ST U DY                                                                     85


event is also a common coping strategy. Twenty-         and their frequency make people vulnerable by
five percent of surveyed households reported            inhibiting forward planning by households who
building livestock platforms to guard animals           become more risk-averse. In Sirajganj, those liv-
during extreme events. Past adaptation prac-            ing on chars do not take longer-term approaches
tices also included moving to safe shelters such        to adaptation, as the flood-prone nature of the
as high roads or cyclone shelters during floods         islands makes for a very temporary mindset. In
and cyclones. Gender-specific coping strategies         cyclone-prone Bagerhat, people are also reluctant
in the face of disaster include women changing          to repair damaged assets because they are afraid
from saris to salwar kameez when cyclone warnings       another cyclone may damage everything again at
come, to ease physical mobility.                        any time.

Livelihood diversification is a common adaptation       While asset level patterns among households are
measure. Households dependent on crop agri-             difficult to improve, there is evidence of significant
culture alone supplement their income through           behavioral changes among individuals seeking to
production of handicrafts, fishing, homestead           cope with climate variability and extreme events.
gardening, or sale of livestock products. Poor          Women, for example, will change from saris to
asset bases of households, however, often limit         salwar kameez suits to reduce their risk of drown-
livelihood diversification options, and result in       ing during cyclones. Some also cut their hair. This
overcrowding and resource depletion when large          suggests disaster preparedness measures can be
numbers of household shift en masse to specific         good investments for pro-poor impact.
occupations—for example, from agriculture to
fisheries—ultimately resulting in push-factor
entry into day labor work.                              Preferred Adaptation
                                                        Options
Migration. Without adequate training, people
cannot transition to more reliable employment
in the service or manufacturing sectors. Those          Adaptation Preferences. Participants in local
with some skills migrate to cities and hilly areas to   and national PSD workshops identified pre-
work as rickshaw pullers, garment workers, car-         ferred adaptation options in environmental
penters, construction workers, cooks, and shrimp        management, water resource management,
farm workers. Nonetheless, migration, even in           infrastructure, livelihood diversification, social
the rural-to-rural unskilled labor form, is not an      protection, education, agriculture, fisheries,
automatic “release valve” for climate-stressed          governance, and gender-responsive disaster risk
regions and households. Multiple factors condi-         management. Hard adaptation options were
tion household decision making about migration.         identified with reference to specific areas: for
In Bagerhat, Satkhira, and flood-prone areas,           example, building embankments to reduce the
men feared leaving their families alone due to          exposure of a community to floods or storms.
the physical risk from river erosion, which could       Soft adaptation measures—such as diversify-
destroy their houses at any time and leave family       ing livelihood opportunities generally—were
members highly vulnerable. In low social capi-          viewed as necessary across all hotspots and
tal areas, men also feared leaving female family        closely aligned with local perceptions of good
members alone.                                          development practice. Participants in local
                                                        PSD workshops also emphasized the need to
Household decision making, risk, and                    invest in specific social policies to reduce local
behavior. The uncertainties of natural hazards          vulnerability, including empowering women
86                                               E C O N O M I C S O F A D A P TAT I O N T O C L I M AT E C H A N G E


and promoting female education; and ensuring             Implications for Adaptation
access to social protection.
                                                         Strategy
Participants in local and national PSD workshops
identified similar adaptation preferences (e.g., in      The poor and the socially most vulnerable are
disaster risk management, fisheries support, agri-       disproportionately affected by climate hazards, as
culture, and governance arenas). However, local          they have the lowest capacity to cope with these
workshop participants particularly emphasized            losses. The most vulnerable population includes
the need for social protection, livelihoods diver-       those with few assets, the subsistence farmers,
sification and gender-specific support. Overall,         the rural landless, the urban poor, fishing com-
preferred adaptation options were identified in:         munities, women, children, and the elderly. They
                                                         do not have sufficient resources to invest in pre-
■■   Environmental Management (mangrove pres-            ventive and protective measures such as flood-
     ervation; afforestation; coastal greenbelts;        resilient housing, making them more vulnerable
     waste management);                                  to the full effects of these hazards. Their access
                                                         to public services, which might buffer them from
■■   Water Resource Management (drainage; rain-          some of the impacts, is also limited. In addition,
     water harvesting; drinking water provision,         their ability to better prepare themselves in the
     and flood control);                                 longer term is also often limited by the destruc-
                                                         tion of their asset base. These effects are further
■■   Infrastructure (roads; cyclone shelters);           compounded if vulnerable households suffer from
                                                         multiple extreme-event shocks one after the other,
■■   Livelihood Diversification;                         without sufficient time for recovery in between
                                                         the shocks. To the extent that it increases the fre-
■■   Social Protection (especially for fishers during    quency of these events, climate change will only
     cyclone season);                                    exacerbate these impacts.

■■   Education;                                          Adaptation. The adaptive capacity of house-
                                                         holds is generally low, with poor urban dwellers
■■   Agriculture (development of salt-tolerant and       the most disadvantaged due to the limited oppor-
     high-yield varieties; crop insurance);              tunities for livelihood diversification and low social
                                                         capital. The most common forms of autonomous
■■   Fisheries (storm-resistant boats; conflict reso-    adaptation activities among surveyed households
     lution between shrimp and rice farmers);            are temporary migration of adult men for day
                                                         labor, construction of platforms to protect live-
■■   Governance (especially access to social services    stock, and storage of food and drinking water
     for urban poor) and;                                prior to extreme events.

■■   Disaster Risk Management that is gender-            The local and national Participatory Scenario
     responsive (e.g., for separate rooms for women      Development process largely reaffirms the impor-
     in cyclone shelters; mini-shelters closer to vil-   tance of the adaptation actions planned under
     lages; use of female voices in early warning        the six themes of the BCCSAP 2009. The pre-
     announcements; and mobile medical teams in          ferred adaptation options identified in the work-
     Char areas).                                        shops include continued national investment in
                                                         flood management schemes, flood protection and
BA N G L A D E S H CO U N T RY ST U DY                                                                 87


drainage, coastal embankments, cyclone shelters        instrumental outcomes (e.g., of improved employ-
(though specifying the need for smaller shelters       ment outcomes for those whose livelihoods had
located at shorter distances from villages), com-      been harmed by climate change such as farmers
prehensive disaster management, agricultural           or fishers in the case of education, and improved
research for drought and saline-resistant crop         delivery of urban services in the case of gover-
varieties, and coastal and urban greenbelts. Pref-     nance). Increased attention to these areas of local
erences from the PSD process, however, deempha-        governance and education would increase resil-
size activities under the research and knowledge       ience and decrease vulnerability of poor persons
management theme and instead emphasize softer          and women to climate hazards.
approaches (e.g. governance), include more gen-
eral options (e.g. education), and are more directly   This component of the study also highlights the
targeted toward community-level outcomes (e.g.         importance of complementing hard adaptation
use of mobile medical teams).                          measures with soft measures such as improving
                                                       disaster preparedness by establishing communi-
In addition, local and national stakeholders           cation in local dialects, constructing redesigned
identified education and governance as two             cyclone shelters to appeal to those most in need
additional areas that were not included in the         and upgrading the resilience of roads in the
BCCSAP but that could strengthen the adap-             hazard-prone areas. Enabling policies and insti-
tive capacity of rural and urban households and        tutions are essential for putting in these actions
communities. These cross-cutting issues also have      in place.
88
                                                S EV EN
     E C O N O M I C S O F A D A P TAT I O N T O C L I M AT E C H A N G E
BA N G L A D E S H CO U N T RY ST U DY                                                                  89


Limitations of the Study


One of the strengths of this study is its use of       the study by definition was primarily interested in
mathematical tools, which impose intellectual          understanding the economics of adaptation, and
discipline. Examples of this discipline are the use    not all aspects of adaptation to climate change.
of a well-defined baseline and the requirement
under CGE models that the national income              Within the limitations imposed by the modeling
accounting identities balance at the end of each       frameworks, important limitations of this study
year. This mathematical approach is indicated          derive from three sources of uncertainty: climate,
when the objective of the exercise includes quan-      economic growth, and technology.
titative and monetary impact evaluation of costs
and benefits. Apart from providing estimates of        Climate uncertainty. There is no consensus on
both, the models indicate the relative importance      the extent of severity of future extreme events
of some factors compared to others, and also           such as cyclones or the rise in the sea level. As
the effects of changing certain variables on oth-      a consequence, information for helping decision
ers. This is important for concretely supporting       makers to invest in assets with long useful lives of
the decision-making process. By making a choice        20, 30, or even 40 years—such as dams, dykes,
for quantitative rigor, however, all the well-known    urban drainage, bridges, and other infrastructure
limitations of using econometric and other math-       is also limited. Adaptation costs are estimated as
ematical models apply.                                 if decision makers know with certainty what the
                                                       future climate will be. In fact the problem deci-
A key limitation in the context of the EACC is         sion makers face is how to maximize the flexibil-
that the models used channel researchers to ask        ity of investment programs to take advantage of
and answer questions that can be answered by the       new climate knowledge as it becomes available.
models, when the most important questions may          A major finding of the study is that the potential
be institutional or cultural, or more likely a com-    damages from climate change are a fraction of
bination of these plus political factors: for exam-    the damages that Bangladesh already faces due to
ple, how to influence the location of people away      existing climate variability. However, these results
from high-risk or increasingly unproductive areas,     are conditioned on the specific scenarios chosen,
how to improve the allocation of water and land,       the worst climate scenarios for extreme weather
how to improve the quality of education. In this       events. However, these scenarios define what the
sense, economics is clearly not sufficient, although   climate scientists have explored so far.
90                                             E C O N O M I C S O F A D A P TAT I O N T O C L I M AT E C H A N G E


To make calculations tractable, the study lim-         the country to absorb and defend against climate-
its both the breadth of economic analysis and          induced changes in productivity and adverse cli-
the length of the time horizon: the study inves-       mate events. As is evident from events in the past
tigates public sector adaptation only, and the         decade, predicting economic growth is a fragile sci-
investment horizon of the study is to 2050 only.       ence. A key contribution of this study is to separate
Although climate science tells us that adaptation      the costs of adaptation from those of development
costs and damages will increase over time, and         by defining a development baseline. The study
that major effects such as melting of ice sheets       assumes just one future development path, based
are more likely to occur well beyond this hori-        on growth in population, GDP per capita, and
zon, uncertainty with regard to both climate and       urbanization, which drive the demand for food,
economic growth make efforts to analyze adap-          investment in infrastructure, benefits of protect-
tation beyond this period unproductive.                ing coastal zones, and so on. How would the costs
                                                       of adaptation change with a different trajectory?
Growth uncertainty. The second major uncer-            The global track analysis indicates that alterna-
tainty concerns economic growth. Rapid economic        tive assumptions about population and economic
growth exposes more assets to risk, but also enables   growth have only a slight impact on estimates of
BA N G L A D E S H CO U N T RY ST U DY                                                                91


the cost of adaptation in 2010–19, so the margins     effects of innovation and technical change on
of error associated with the development baseline     adaptation costs. In effect, these costs are based
are not very important in the immediate future,       on what is known today rather than what might
although they may grow over time.                     be possible in 20–40 years. Sustained growth in
                                                      per capita GDP for the world economy rests on
Technological uncertainty. Finally, technologi-       technical change, which is likely to reduce the
cal change over the next 50 years will affect adap-   real costs of adaptation over time. This treatment
tation in currently unknowable ways. Most parts       of technological change also contributes to an
of the study do not allow for the unknowable          upward bias in the calculated costs.
92
                                                 EIGH T
     E C O N O M I C S O F A D A P TAT I O N T O C L I M AT E C H A N G E
BA N G L A D E S H CO U N T RY ST U DY                                                                   93


Summary of Findings


Given the pervasive impacts of climate-related          value of exposed assets, they decline in relation to
risks, both public sector investments and private       the size of the economy as higher incomes make
actions have made Bangladesh more resilient over        adaptation actions more affordable to future pop-
time. Bangladesh already has an extensive set of        ulations. The cost of adaption actions in response
adaptation measures—such as early warning sys-          to the additional risk from climate change are
tems, embankments, and shelters—in place to pro-        generally less than the additional cost of adapting
tect against climate risks such as tropical cyclones/   to existing risks, which remains substantial.
storm surges and flooding. The climate resilience
of Bangladesh also derives from the ways house-         Further, the impacts of existing climate vari-
holds and business and society have adapted to          ability are concentrated in areas that also have
climate risks. These include, for instance, the adop-   higher concentrations of poor and socially vulner-
tion of countercyclical cropping patterns immedi-       able populations. Climate change is not expected
ately following severe floods, and the shift toward     to shift these distributions, but just to exacerbate
cyclone-resistant housing with rising incomes and       them. The rural poor in the Southern region in
migration of population and economic activity           particular are expected to face the largest declines
away from higher risk coastal areas.                    in per capita consumption. In addition to the direct
                                                        damage to lives and property from storm surges
Despite these investments and actions, damages          and cyclones, they are also impacted by declining
from recent extreme events have made clear that         productivity in the aus and aman rice crops; severe
substantial risks remain. A detailed assessment of      yield losses in the boro crop from changes in mean
the adequacy of costal protective measures indi-        rainfall; temperature and mean shifts in the flood
cates a significant deficiency in addressing existing   hydrographs, which have historically been used as
risks from cyclone-induced storm surges. Climate        a countercyclical measure against severe floods;
change is expected to nearly double these risks.        and land losses due to increased salinity brought
Further, the aggregate additional costs of the pro-     forth by sea level rise.
posed adaptation measures needed to mitigate
climate change risk from extreme events are gen-        Increased investments in adaptation to reduce
erally smaller than the expected damages. While         the impacts of climatic hazards are important
the damages from extreme events rise over time          to ensure continued growth. The concentration
in absolute terms, in line with increases in the        of climate impacts in areas with concentrations
94                                              E C O N O M I C S O F A D A P TAT I O N T O C L I M AT E C H A N G E


of the poor also means that these investments           uncertainties about the magnitude and timing of
are essential for poverty alleviation. Rural house-     future impacts makes it prudent to appropriately
holds will continue to depend on the agriculture        sequence adaptation actions to provide essential
sector for income and livelihoods. Though the           protection without overinvesting in areas where the
government has made substantial investments to          risks do not materialize. These investments have
increase the resilience of the poor—such as new         to also be accompanied by institutional mecha-
high-yielding crop varieties, protective infrastruc-    nisms that address any perverse incentives that it
ture, and disaster management—the scale of the          may create in attracting population and activities
current efforts remains limited and will need to        toward areas of higher risk. Stronger institutional
be scaled up commensurate with the probable             capacity is also essential to reduce uncertainties
impacts from climate change.                            through improvements in the knowledge base,
                                                        and in turn to adjust the selection and sequenc-
In a fiscally constrained environment, with com-        ing of adaptation actions in response to changes
peting priorities, efforts to address climate related   in knowledge. Strengthened regional cooperation
risks can easily be seaside. While the adoption of      on managing shared water resources in the GBM
the Bangladesh Climate Change Strategy and              basin also has significant implications for adapta-
Action Plan in 2009 recognizes the importance           tion actions within the country.
of addressing climate change, the commitment of
public resources provides a focal point for starting    (1) Sequencing of adaption actions: a
these actions. However, the available resources         necessity in the face of uncertainties
are much smaller than the current needs even            The fundamental problem of policy making
for the limited set areas analyzed and measures         in the face of climate change is one of uncer-
costed in this study. As a result, it may be neces-     tainty with regard to climate outcomes. Shift-
sary to sequence adaptation actions based on the        ing resources toward more productive uses and
degree of certainty and timing of the benefits or       away from less productive ones in the context
costs of actions. The analyses in this study can        of uncertainty is already a principal aim of
provide some guidance for developing an adapta-         development for a fiscally constrained govern-
tion agenda for Bangladesh.                             ment. Climate change increases the importance
                                                        of achieving this aim, but it makes the task
An adaptation agenda                                    more complex. This uncertainty has impor-
for Bangladesh                                          tant effects in any assessment of the impact of
                                                        climate change and on the selection and rank-
Sound development policies provide the foun-            ing of adaptation actions. Early investments to
dation for any action agenda on adaptation to           improve the information base and to reduce
climate change. This study presupposes specific         the existing uncertainties are also important
future development baselines for Bangladesh             to guide the evolution of adaptation actions
based on a continuation of existing trends and          over time. A prudent strategy would phase in
patterns, which conditions both the size and types      additional actions based on the cost of inac-
of potential impacts and the necessity and effec-       tion and the certainty of impacts across a wide
tiveness of specific adaptation actions. It elabo-      range of climate outcomes. Table 1 illustrates
rates on the potential impacts and the specific         the sequencing of immediate, short-term, and
actions in the BCCSAP, providing bottom-up              medium- to long-term investments envisioned
cost estimates of undertaking these actions, and        in the BCCSAP that is consistent with these
the potential losses if they are not undertaken.        principles, focusing on reducing uncertainty
Large existing climate variability and significant      in the near term and improving on protective
BA N G L A D E S H CO U N T RY ST U DY                                                              95


infrastructure for coastal polders near the           sea levels and increased intensity of storms. So
medium. The risk analysis from this study pro-        steps taken to address current risks will even-
vides additional spatially differentiated infor-      tually also protect populations and activities
mation to further refine the sequencing of the        against future risks. The aggregate costs of
adaptation actions.                                   strengthening existing polders against historical
                                                      risks are of the same order of magnitude as the
(2) Addressing current climate-related                aggregate damages of a single severe cyclone.
risks: a no-regrets strategy                          The detailed polder-specific risk assessment
Public investments in disaster risk reduction         and cost estimate provided in the study should
measures over the past 50 years have reduced          be combined with the assets and populations
the damages resulting from them, yet recent           that they would protect to prioritize immedi-
experiences indicate that climate-related disas-      ate actions to strengthen polders. The effec-
ters continue to have significant damages. Cli-       tiveness of these efforts can be increased by
mate change is only expected to increase the          complementing them with efforts to strengthen
risks and the associated damages in the future.       institutions for managing development in the
A no-regrets strategy would address these cur-        vulnerable zones. Similarly, the efforts to shore
rent climate risks. One clear example concerns        up river embankments, elevate roads, or add
the impact of cyclones and the storm surges           culverts to accommodate drainage require-
they induce in coastal areas. Despite the uncer-      ments for severe floods that exist today would
tainty over future rainfall, there is relative cer-   not only provide immediate benefits but also
tainty that a warmer climate will lead to rising      protect against increased future flood risks.
96                                           E C O N O M I C S O F A D A P TAT I O N T O C L I M AT E C H A N G E


(3) Research and Knowledge Building: key             research activities to reduce the large uncertain-
to improved targeting of future actions              ties about future climate risks. These efforts can
While the direction of future climate risks in       provide guidance for the extent of adaptation
Bangladesh seems clear, its magnitude and tim-       and the prioritization of investments.
ing is less certain. Given the high cost of infra-
structure investments, and the expected gradual      (4) Sound development policies:
increase in climate risk over decades, a prudent     the foundation for any adaptation agenda
strategy would be to focus on improving the          Development generates both the resources and
spatial precision of current climate-related risks   opportunities to adapt to climate change at a rela-
forecasting and associated early warning sys-        tively low cost. The Bangladesh economy has been
tems, which would enable better targeting of         growing at over 6 percent during the past decade
adaptation actions. These actions not only pro-      and is expected to continue to grow at a compa-
vide immediate benefits, but also improve the        rable pace over the coming decades. Expected
capacity to address climate risks in the future.     structural changes in the economy—away from
This needs to be supplemented with additional        climate-sensitive sectors such as agriculture toward
BA N G L A D E S H CO U N T RY ST U DY                                                                    97


industry and services—reduce exposure to climate        for inevitable losses, will be essential for improved
risks, while urbanization provides new opportu-         targeting of adaptation actions.
nities for managing them better. Investments to
expand the road system and increase the share of        5) Adjustment of design standards for
paved roads yield high returns by lowering trans-       infrastructure: essential for future
port costs and expanding markets. At the same           resilience
time, they lessen the impact of floods and enhance      Infrastructure investments are long-lived and
the ability of farmers to respond to changes in         expensive and yield large benefits when designed
agricultural comparative advantage. Ensuring            appropriately. It is essential to develop appropriate
that the design and location of new infrastructure,     standards commensurate with the likely climate
buildings, and other assets consider the effects of     risks over the expected lives of the assets and to
climate change can extend their useful lives. Simi-     update them over time based on new research
larly, better management of water resources and         results that become available. For example, the pros-
an expansion of irrigation should increase agricul-     pect of more intense precipitation has implications
tural yields and permit the adoption of new agri-       for unpaved roads, especially in rural areas, which
cultural technologies, as well as enabling farmers to   are vulnerable to being washed away by floods
cope with greater variability of rainfall.              and heavy rainfall. Single-lane sealed roads have a
Eliminating poverty is central to both develop-         higher capital cost but they provide a more reliable
ment and adaptation, since poverty exacerbates          all-weather network with lower maintenance costs.
vulnerability to weather variability as well as cli-    As research makes the risk of flooding in a location
mate change. Higher incomes enable households           more apparent, the design standards for roads in
to autonomously adapt and better cope with              these areas need to be increased accordingly. Simi-
climate-related disasters, by for instance, making      larly, polders need to be strengthened beyond their
climate-resilient housing more affordable. Rapid        current protective capacity as the added risk from
development leads to a more flexible and resilient      storm surges becomes more certain. Additional
society, so building human and social capital—          research may also be necessary in the medium to
including education, social protection and health,      long term for the development of new varieties of
and skills training—are crucial to adaptation.          crops and cropping patterns in accordance with
In addition, the government has made substan-           the changing climatic conditions particularly in the
tial investments to increase the resilience of the      southern coastal regions.
poor through, for instance, the introduction of
new high-yielding crop varieties, construction          (6) Reducing perverse incentives:
of protective infrastructure, and improvements          a necessity to increase effectiveness of
in disaster management. However, risk reduc-            infrastructure investments
tions achieved through protective infrastructure        As a general rule, investments—such as flood
improvements increase ground rents and often            embankments or polders—designed to protect
result in crowding out the poor. Inevitably, this       vulnerable assets should be subjected to careful
adverse location selection will increase the con-       consideration. Construction of a dyke is followed,
centration of the poor in unprotected areas, as         almost by definition, by accumulation of physi-
can be seen in from the coincidence of poverty          cal capital in the shadow of the dyke because
and disaster risk maps. Adaptation that directly        it is considered “safe.” However, as the tragedy
assists the poor, such as early warning and evacu-      of New Orleans dramatically illustrated, a suffi-
ation services, basic education (particularly for       ciently extreme event will breach a polder. The
women), and subsidized insurance to compensate          combination of an increasing severity of extreme
98                                              E C O N O M I C S O F A D A P TAT I O N T O C L I M AT E C H A N G E


events, the high costs of providing physical pro-       (7) Soft adaption approaches:
tection, and the accumulation of capital behind         a complement to hard investments
such barriers can mean that the expected value          The distinction between “hard” (capital-inten-
of losses, including human suffering, may not be        sive) and “soft” (institutions and policies) adapta-
reduced—either at all, or by as much as expected        tion is easily exaggerated. The reality is that both
by investments in protection.                           approaches are necessary and complement each
                                                        other as illustrated above, in terms of potential per-
Similar concerns apply to efforts to maintain the       verse incentives of investments in coastal embank-
welfare of populations in areas where climate           ments. This study has focused largely on the costs
change alters the comparative advantage of agri-        of hard measures. The challenge is thus to get the
culture and other resource-intensive activities.        balance between hard and soft adaptation right. It
Short-term measures to prevent suffering must           is much simpler to estimate the costs of upgrading
be complemented by long-term measures such as           embankments or adding new culverts to protect
education, job training, and migration designed         against the effects of climate change than it is to
to reduce reliance on resources and assets whose        estimate the costs of creating new institutions and
value may be eroded by climate change. Adapta-          implementing better policies. Evaluation of these
tion should not attempt to resist the impact of cli-    “hard” adaptation investments, however, has been
mate change, but rather it should offer a path by       done within a framework of appropriate develop-
which accommodation to its effects is less disrup-      ment policies and efficient institutional arrange-
tive and does not fall disproportionately on the        ments. Good policies, planning, and institutions
poor and the vulnerable.                                are essential to ensure that more capital-intensive
                                                        measures are used in the right circumstances and
The long-term challenge is to move people and           yield the expected benefits. In many cases, the latter
economic activity into less climate-sensitive areas     costs are zero or negative in the longer run, because
and to seek a strategic balance between protect-        these changes provide benefits beyond adaptation
ing existing populations and encouraging the            to climate change and contribute to overall well-
mobility of future populations. In 2050, the num-       being. But they are much harder to quantify. In
ber of people living in cities will triple, while the   others, the absence of appropriate complementary
rural population will fall by 30 percent. Current       institutional arrangements can actually worsen the
policies will determine where this urban popula-        impacts that the hard investment is designed to
tion settles and how prepared it is to adapt to a       address. The importance of keeping infrastructure
changed climate. Many households have moved             and urban development out of harm’s way is a key
further inland, partly due to higher perceived risk,    illustration of the costs of creating perverse incen-
but strengthened embankments may change these           tives that encourage behavior and investments that
perceptions, leading to increased exposure. Good        worsen rather than reduce the prospective impacts
policy needs to encourage future populations to         of climate change. Equally, however, experience
move away from high natural risk areas, avoid-          shows that the difficulties of devising and imple-
ing perverse incentives to remain in high-risk          menting soft measures are often underestimated
areas and adopting positive incentives to promote       because these may involve changes in expecta-
settlements and urban growth in low-risk areas.         tions or established (quasi-) property rights that are
Strengthened education in rural areas is critical       strongly resisted.
for rural migrants to be prepared for productive
lives in new urban areas.                               An important component of soft adaptation is the
                                                        focus on governance and local stakeholder par-
                                                        ticipation. The effectiveness of hard investments
BA N G L A D E S H CO U N T RY ST U DY                                                                   99


depends on the access to them and their uptake          research institutes that develop and test new crop
by targeted populations. Reaching women requires        varieties to increase national production and
gender-sensitive designs of interventions such as the   resilience against climate risks. The magnitude
provision of separate facilities for women in cyclone   of the additional effort and the direction it takes
shelters. Pro-poor adaptation investments include       will depend on the specific future climate that
social protection, livelihoods diversification, and     materializes.
investments in human and social capital (including
training, education and community-based disaster        (9) Strengthened regional cooperation: an
risk management) in order to strengthen local resil-    essential option in the long term
ience to climate change.                                Climate change may greatly increase the need for
                                                        regional cooperation. Cooperation on the shar-
(8) Development of climate-resilient cul-               ing of water resources with neighboring countries
tivars and cropping: an option for long-                in the GBM basin is not a new issue for Ban-
term food security                                      gladesh, but it is one whose importance may be
Additional research will also be necessary for          greatly increased by climate change. As the stakes
the development of climate-resilient cultivars          rise, effective steps taken now to promote and
and cropping patterns that are more suited to           strengthen the cooperative management of the
the future climatic conditions, particularly in the     shared resources can not only provide immedi-
southern coastal regions, which are expected to         ate benefits to all parties but can also prevent the
be affected the most by climate change. Bangla-         need for expensive and possibly disruptive solu-
desh already has an active network of agricultural      tions in the future.
100                                                              E C O N O M I C S O F A D A P TAT I O N T O C L I M AT E C H A N G E


References


Ahmed, A.U. and M. M. Q. Mirza. 2000. “Review of causes and               Christensen, J.H., et al. 2007. “Regional Climate Projections.”
  Dimensions of Floods with Particular Reference to Flood                    In S. Solomon, D. Qin, M. Manning, Z. Chen, M. Marquis,
  ’98: National Perspectives.” In Q.K. Ahmed et al., eds. Per-               K.B. Averyt, M. Tignor, and H.L. Miller, eds. Climate Change
  spectives on Flood 1998. Dhaka: University Press Limited.                  2007: The Physical Science Basis. Contribution of Working
                                                                             Group I to the Fourth Assessment Report of the Intergov-
Ahmed, A.U., and M. Alam. 1998. “Development of Climate
                                                                             ernmental Panel on Climate Change. Cambridge, UK, and
  Change Scenarios with General Circulation Models.” In
                                                                             New York: Cambridge University Press.
  S. Huq, Z. Karim, M. Asaduzzaman, and F. Mahtab, eds.
  Vulnerability and Adaption to Climate Change for Bangladesh. Dor-       Dasgupta S., B. Laplante, C. Meisner, D. Wheeler, and J. Yan.
  drecht: Kluwer Academic Publishers.                                        2009. “The impact of sea-level rise on developing countries:
                                                                             A comparative analysis.” Climatic Change 93 (3): 379–388.
Ahmad, Q.K., N. Ahmad, and K.B.S. Rasheed, eds. 1994.
  Resources, Environment and Development in Bangladesh with               Emanuel, K. 2005. “Increasing destructiveness of tropical
  Particular Reference to the Ganges, Brahmaputra and Meghna Basins.        cyclones over the past 30 years.” Nature 436: 686–688.
  Dhaka: Academic Publishers, Dhaka.
                                                                          Emanuel, K., R. Sundararajan, and J. Williams. 2008. “Hurri-
Ali, A. 1999. “Climate Change Impacts and Adaptation Assess-                canes and Global warming: Results from Downscaling IPCC
     ment in Bangladesh.” Climate Research 12: 109–116.                     AR4 Simulations.” Available at: ftp://texmex.mit.edu/pub/
                                                                            emanuel/PAPERS/Emanuel_etal_2008.pdf.
Allison, I. et al. 2009. The Copenhagen Diagnosis, 2009: Updating
     the world on the Latest Climate Science. Sydney: The University      Goodbred, Steven L., and Steven A. Kuehl. 2000. “Enormous
     of New South Wales Climate Change Research Centre                       Ganges-Brahmaputra Sediment Discharge during Strength-
     (CCRC).                                                                 ened Early Holocene Monsoon.” Geology 28 (12)
Bangladesh Water Development Board (BWDB). 2007. Annual                   Government of the People’s Republic of Bangladesh. 2007.
   Flood Report 2007. Dhaka, Bangladesh: Flood Forecasting                   Consolidated Damage and Loss Assessment, Lessons Learnt from the
   & Warning Centre Processing & Flood Forecasting Circle,                   Flood 2007 and Future Action Plan. Report prepared by Disaster
   Bangladesh Water Development Board.                                       Management Bureau, Ministry of Food and Disaster
                                                                             Management, with the assistance of Comprehensive Disaster
BCAS (Bangladesh Centre for Advanced Studies). 1992.
                                                                             Management Programme (CDMP). Dhaka, Bangladesh.
  “Cyclone ’91 Revisited: A Follow-up Study.” Raana Halder,
                                                                             Ministry of Environment and Forests Government of the
  ed. Dhaka: BCAS, Bangladesh.
                                                                             People’s Republic of Bangladesh.
BWDB (Bangladesh Water Development Board). 2003a. Technical
                                                                          Government of the People’s Republic of Bangladesh. 2008.
  Evaluation of Some Selected Flood Protection and River Erosion Con-
                                                                             Cyclone Sidr in Bangladesh: Damage, Loss, and Needs Assessment for
  trol works Already Implemented by BWDB. Dhaka: BWDB.
                                                                             Disaster Recovery and Reconstruction. Dhaka, Bangladesh. Minis-
BWDB (Bangladesh Water Development Board). 2003b. Coastal                    try of Environment and Forests Government of the People’s
  Embankment Rehabilitation Project, Stage II, Final Report. Vol. I/II.      Republic of Bangladesh.
  Chittagong: BWDB.
                                                                          Government of the People’s Republic of Bangladesh. 2009.
Bengtsson, L., K. I. Hodges, and E. Roeckner. 2006. “Storm                   Bangladesh Climate Change Strategy and Action Plan 2009. Dhaka,
   tracks and climate change.” Journal of Climate 19: 3518–43.               Bangladesh. Ministry of Environment and Forests Govern-
                                                                             ment of the People’s Republic of Bangladesh.
CEGIS (Centre for Environmental and Geographic Information
  Services). 2010. Mid-Term report on Field-Based Research on the         Hofer, T., and B. Messerli. 2006. Floods in Bangladesh. History,
  Impacts of Climate Change on Bangladesh Rivers. Dhaka: ADB,                dynamics and rethinking the role of the Himalayas. Tokyo: United
  Bangladesh.                                                                Nations University Press.
BA N G L A D E S H CO U N T RY ST U DY                                                                                                     101


Hoque, M. Mozzammel. 1992. “Strategies and Measures to                  IWM (Institute of Water Modeling). 2007a. Improving WFP and
   Reduce Cyclone Damage.” In Cyclone Disaster Management                 partners knowledgebase on flood prone areas in Bangladesh. Final
   and Regional/Rural Development Planning. UNCRD-CIRDAP                  Report. Dhaka, Bangladesh.
   Seminar, Phase III, January 27–29, 1992, Chittagong, Ban-
                                                                        IWM (Institute of Water Modeling). 2007a. Improving WFP and
   gladesh. Nagoya, Japan: UNCRD.
                                                                          partners knowledgebase on flood prone areas in Bangladesh. Final
Huq, S., A.U. Ahmed, and R. Koudstaal. 1996. “Vulnerability of            Report. Dhaka, Bangladesh.
   Bangladesh to Climate Change and Sea Level Rise.” In T.E.
                                                                        IWM (Institute of Water Modeling) 2007b. “Real time data col-
   Downing, ed. Climate Change and World Food Security. NATO
                                                                          lection (July ’05 to December ’06) for FFWC and update &
   ASI Series, I37. Berlin and Hiedelberg: Springer-Verlag.
                                                                          model validation of General/ National & 6-Regional models
IMD (Indian Metrological Department). 2010. Frequently Asked              for 2003–06 hydrological years.” Validation Report 2, Vols.
  Questions on Tropical Cyclones. Available at: <http://www.              1,2,3,4,5, 2007. Dhaka, Bangladesh.
  imd.gov.in/section/nhac/dynamic/faq/FAQP.htm#q42>
                                                                        IWM (Institute of Water Modeling). 2009a?. Updating Calibration
  (accessed March 15, 2010).
                                                                          and Validation of Flood Forecasting Model. Final Report. Dhaka,
International Workshop on Tropical Cyclones (IWTC). 2006.                 Bangladesh. Bangladesh Water Development Board, Minis-
    Statement on tropical cyclones and climate change. Available at:      try of Water Resources, Government of Bangladesh.
    http://www.gfdl.noaa.gov/~tk/glob_warm_hurr.html.
                                                                        IWM (Institute of Water Modeling). 2009b?. Hydrological Modeling
IPCC (Intergovernmental Panel on Climate Change). 2000.                   for the Implication of Climate Change on Food Security of Bangladesh:
   Special Report on Emissions Scenarios (SRES). Working Group            A Menu of Adaptation Responses. Final Report. Dhaka, Bangla-
   III, Intergovernmental Panel on Climate Change (IPCC).                 desh: Bangladesh Centre for Advance Studies, the World
   Cambridge, UK: Cambridge University Press. Available at:               Bank.
   http://www.grida.no/climate/ipcc/emission/index.htm.
                                                                        IWM & DHI (2000) 2nd CERP: 2nd Coastal Embankment
IPCC (Intergovernmental Panel on Climate Change). 2001.                   Rehabilitation Project, Dhaka.
   Regional Impacts of Climate Change. Third Intergovernmental
                                                                        IWFM (Institute of Water Modeling), CEGIS (Center for
   Panel on Climate Change. Geneva: IPCC.
                                                                           Environmental and Geographic Information Services).
IPCC (Intergovernmental Panel on Climate Change). 2007a.                   2008. “Impact of Climate Change on Surface Water Flow
   Climate Change 2007: Impacts, Adaptation and Vulnerability: Sum-        in Bangladesh.” Technical Report of CLASIC. Dhaka,
   mary for Policymakers. Working Group II Contribution to the             Bangladesh.
   Intergovernmental Panel on Climate Change Fourth Assess-
                                                                        Keim, M. E. 2006. “Cyclones, Tsunamis and Human Health.”
   ment Report. Geneva: IPCC.
                                                                           Oceanography 19(2): 40–49.
IPCC (Intergovernmental Panel on Climate Change). 2007b.
                                                                        Khalil, G. 1992. “Cyclones and Storm Surges in Bangladesh:
   Climate Change 2007: The Physical Science Basis: Summary for Poli-
                                                                           Some Mitigative Measures.” Natural Hazards 6: 11–24.
   cymakers. Working Group II Contribution to the Intergovern-
   mental Panel on Climate Change Fourth Assessment Report.             Knutson, T. R., and R. E. Tuleya. 2004. “Impact of CO2-
   Geneva: IPCC.                                                           induced Warming on Simulated Hurricane Intensity and
                                                                           Precipitation Sensitivity to the Choice of Climate Model
IPCC (Intergovernmental Panel on Climate Change). 2007c.
                                                                           and Convective Parameterization.” Journal of Climate 17:
   “Technical Summary.” In S. Solomon, D. Qin, M. Manning,
                                                                           3477–95.
   Z. Chen, M. Marquis, K.B. Averyt, M. Tignor and H.L.
   Miller, eds. Climate Change 2007: The Physical Science Basis.        Landsea, C.W., B.A. Harper, K. Hoarau, and J.A. Knaff. 2006.
   Contribution of Working Group I to the Fourth Assessment                “Climate Change: Can We Detect Trends in Extreme Tropi-
   Report of the Intergovernmental Panel on Climate Change.                cal Cyclones?” Science: 313 (5786): 452–54.
   Cambridge, UK, and New York: Cambridge University
                                                                        Michaels, P. J., P. C. Knappenberger, and R. E. Davis. 2005.
   Press.
                                                                           “Sea-Surface Temperatures and Tropical Cyclones: Breaking
IPCC (Intergovernmental Panel on Climate Change). 2007d.                   the Paradigm.” Presented at 15th Conference of Applied
   Technical Summary. A Report of Working Group 1 of Intergov-             Climatology, 2005, Washington, DC. Available at http://
   ernmental Panel on Climate Change. Geneva: IPCC.                        ams.confex.com/ams/15AppClimate/techprogram/
                                                                           paper_94127.htm.
IPCC (Intergovernmental Panel on Climate Change). 2007e.
   Climate Change 2007: Impacts, Adaptation and Vulnerability: Sum-     Ministry of Environment and Forest, Government of the
   mary for Policymakers. Working Group II Contribution to the             People’s Republic of Bangladesh. 2005. National Adaptation
   Intergovernmental Panel on Climate Change Fourth Assess-                Programme of Action. Dhaka, Bangladesh. Ministry of Environ-
   ment Report. Geneva: IPCC.                                              ment and Forests Government of the People’s Republic of
                                                                           Bangladesh.
Islam, M.R., M. Ahmad, H. Huq, and M.S. Osman. 2006. State
    of the Coast 2006. Dhaka: Program Development Office for            Mirza, M.M.Q. 2002. “Global Warming and Changes in the
    Integrated Coastal Zone Management Plan Project, Water                 probability of occurrence of floods in Bangladesh and impli-
    Resources Planning Organization.                                       cations.” Global Environmental Change 12: 127–138.
Islam, K.M.N., and R. Mechler. 2007. ORCHID: Piloting                   Mirza, M.M.Q. 2003. “Three Recent Extreme Floods in Ban-
    Climate Risk Screening in DFID Bangladesh. An Economic                 gladesh: A Hydro-Meteorological Analysis”, Natural Hazards,
    and Cost Benefit Analysis of Adaptation Options. Institute             28: 35-64.
    of Development Studies, University of Sussex, UK.
102                                                             E C O N O M I C S O F A D A P TAT I O N T O C L I M AT E C H A N G E


Mirza, M.Q., R.A. Warrick, N.J. Ericksen, and G.J. Kenny. 1998.         SMRC (SAARC Meteorological Research Centre). 2000. The
   “Trends and persistence in precipitation in the Ganges,                Vulnerability Assessment of the SAARC Coastal Region due
   Brahmaputra and Meghna Basins in South Asia.” Hydrologi-               to Sea Level Rise: Bangladesh Case. Dhaka: SAARC Meteo-
   cal Sciences Journal 43: 845–858.                                      rological Research Centre, SMRC Publication.
Mirza, M.M.Q. and A. Dixit. 1997. “Climate Change and Water             UK DEFRA (United Kingdom Government Department for
   Resources in the GBM Basins.” Water Nepal 5 (1): 71–100.               Environment, food and Rural Affairs). 2007. Investigating the
                                                                          Impact of Relative Sea-Level Rise on Coastal Communities and their
Multi-purpose Cyclone Shelter Project (MCSP). 1993. Summary
                                                                          Livelihoods in Bangladesh. London, Government Department
   Report. Dhaka: Bangladesh University of Engineering and
                                                                          for Environment, food and Rural Affairs.
   Technology and Bangladesh Institute of Development
   Studies.                                                             UNDP (United Nations Development Programme). 2004. A
                                                                          Global Report: Reducing Disaster Risk: A Challenge for Development.
Murty, T.S., and M.I. El-Sabh. 1992. “Mitigating the Effects of
                                                                          Available at http://www.undp.org/bcpr.
  Storm Surges Generated by Tropical Cyclones: A proposal.”
  Natural Hazards 6(3): 251–273.                                        Unnikrishnan A.S., R. Kumar, S.E. Fernandez, G.S. Michael,
                                                                           and S.K. Patwardhan. 2006. “Sea Level Changes along the
Nicholls, R. J. 2003. An Expert Assessment of Storm Surge “Hotspots.”
                                                                           Indian Coast: Observations and Projections.” Current Science
   Final Report (Draft Version) to Center for Hazards and Risk
                                                                           India 90: 362–368.
   Research, Lamont-Dohert Observatory, Columbia Univer-
   sity. New York.                                                      United Nations and the World Bank. 2010 (forthcoming). UnNat-
                                                                           ural Disasters: the Economics of Reducing Death and Destruction.
Nicholls, R.J. and Leatherman, S.P. (1995) ‘The Potential Impact
   of Accelerated Sea-level Rise on Developing Countries’,              WARPO-Halcrow et al. 2004. National Water Management Plan.
   Journal of Coastal Research, 14(special issue).                        Dhaka: Water Resources Planning Organization (WARPO),
                                                                          Government of the People’s Republic of Bangladesh (GOB),
Pielke, R. A., C. Landsea, M. Mayfield, J. Laver, and R. Pasch.
                                                                          and Sir William Halcrow and Associates.
    2005. “Hurricanes and Global Warming.” Bulletin of Ameri-
    can Meteorological Society November: 1571–75.                       Webster, P. J., G .J. Holland, J.A. Curry, and H-R. Chang. 2005.
                                                                           “Changes in tropical cyclone number, duration and intensity
Quadir, D. A. and Md. Anwar Iqbal. 2008. “Tropical Cyclones:
                                                                           in a warming environment.” Science 309: 1844–46.
   Impacts on Coastal Livelihoods.” IUCN Working Paper.
   Dhaka International Union for the Conservation of Nature             Woodworth, P. L., and D. L. Blackman. 2004. “Evidence for
   and Natural Resources.                                                 systematic changes in extreme high waters since the mid-
                                                                          1970s.” Journal of Climate 17(6): 1190–97.
Qureshi, A. and D. Hobbie. 1994. Climate Change in Asia. Manila:
   Asian Development Bank (ADB).                                        World Bank. 2007. Floods 2007: Damage and Needs Assessment Report.
                                                                           Washington, DC: World Bank.
Rahmstorf, Stefan. 2007. “A semi-empirical approach to project-
   ing future sea-level rise.” Science 315: 368–370.Available at:       Woth, K., R. Weisse, and H. von Storch. 2006. “Climate change
   http://www.pik-potsdam.de/~stefan/Publications/Nature/                  and North Sea storm surge extremes: An ensemble study
   rahmstorf_science_2007.pdf.                                             of storm surge extremes expected in a changed climate
                                                                           projected by four different regional climate models.” Ocean
Shultz, J. M., J. Russell, and Z. Espinel. 2005. “Epidemiology of
                                                                           Dynamics 56(1):
   Tropical Cyclones: The Dynamics of Disaster, Disease, and
   Development.” Epidemiologic Reviews 27: 21–35.                       Yu, W.H., et al. 2010. Climate Change Risks and Food Security in
                                                                            Bangladesh. London: Earthscan Publishers.
BA N G L A D E S H CO U N T RY ST U DY   103
104                                               E C O N O M I C S O F A D A P TAT I O N T O C L I M AT E C H A N G E


                             Ministry of Foreign Affairs
                             Government of the Netherlands


The World Bank Group
1818 H Street, NW
Washington, D.C. 20433 USA


Tel: 202 473 1000
Fax: 202 477 6391


www.worldbank.org/eacc

Eacc bangladesh

  • 1.
    BA N GL A D E S H CO U N T RY ST U DY i Economics of Adaptation to Climate Change BANGL ADESH
  • 2.
    ii E C O N O M I C S O F A D A P TAT I O N T O C L I M AT E C H A N G E EACC Publications and Reports 1. Economics of Adaptation to Climate Change: Synthesis Report 2. Economics of Adaptation to Climate Change: Social Synthesis Report 3. The Cost to Developing Countries of Adapting to Climate Change: New Methods and Estimates Country Case Studies: 1. Bangladesh: Economics of Adaptation to Climate Change 2. Bolivia: Adaptation to Climate Change: Vulnerability Assessment and Economic Aspects 3. Ethiopia : Economics of Adaptation to Climate Change 4. Ghana: Economics of Adaptation to Climate Change 5. Mozambique: Economics of Adaptation to Climate Change 6. Samoa: Economics of Adaptation to Climate Change 7. Vietnam: Economics of Adaptation to Climate Change Discussion Papers: 1. Economics of Adaptation to Extreme Weather Events in Developing Countries 2. The Costs of Adapting to Climate Change for Infrastructure 3. Adaptation of Forests to Climate Change 4. Costs of Agriculture Adaptation to Climate Change 5. Cost of Adapting Fisheries to Climate Change 6. Costs of Adaptation Related to Industrial and Municipal Water Supply and Riverine Flood Protection 7. Economics of Adaptation to Climate Change-Ecosystem Services 8. Modeling the Impact of Climate Change on Global Hydrology and Water Availability 9. Climate Change Scenarios and Climate Data 10. Economics of Coastal Zone Adaptation to Climate Change 11. Costs of Adapting to Climate Change for Human Health in Developing Countries 12. Social Dimensions of Adaptation to Climate Change in Bangladesh 13. Social Dimensions of Adaptation to Climate Change in Bolivia 14. Social Dimensions of Adaptation to Climate Change in Ethiopia 15. Social Dimensions of Adaptation to Climate Change in Ghana 16. Social Dimensions of Adaptation to Climate Change in Mozambique 17. Social Dimensions of Adaptation to Climate Change in Vietnam 18. Participatory Scenario Development Approaches for Identifying Pro-Poor Adaptation Options 19. Participatory Scenario Development Approaches for Pro-Poor Adaptation: Capacity Development Manual
  • 3.
    BA N GL A D E S H CO U N T RY ST U DY i Economics of Adaptation to Climate Change BANG L ADESH Ministry of Foreign Affairs Government of the Netherlands
  • 4.
    ii E C O N O M I C S O F A D A P TAT I O N T O C L I M AT E C H A N G E © 2010 The World Bank Group 1818 H Street, NW Washington, DC 20433 Telephone: 202-473-1000 Internet: www.worldbank.org E-mail: feedback@worldbank.org All rights reserved. This volume is a product of the World Bank Group. The World Bank Group does not guarantee the accuracy of the data included in this work. The boundaries, colors, denominations, and other information shown on any map in this work do not imply any judgment on the part of the World Bank Group concerning the legal status of any territory or the endorsement or acceptance of such boundaries. RIGHTS AND PERMISSIONS The material in this publication is copyrighted. Copying and/or transmitting portions or all of this work without permission may be a violation of applicable law. The World Bank Group encourages dissemination of its work and will normally grant permission to reproduce portions of the work promptly. For permission to photocopy or reprint any part of this work, please send a request with complete information to the Copyright Clearance Center Inc., 222 Rosewood Drive, Danvers, MA 01923, USA; telephone 978-750-8400; fax 978-750-4470; Internet: www.copyright.com. All images © The World Bank Photo Library except Front Cover © National Geographic
  • 5.
    BA N GL A D E S H CO U N T RY ST U DY iii Contents Acronyms vii Acknowledgments ix Executive Summary xi Climate hazards: a risk to achieving development objectives xi Adaptation essential for development xii Objectives and scope of study xiii Results xv Lessons and recommendations xx 1 Introduction 1 Motivation and context for the EACC study 1 Context for the Bangladesh case study 1 Climate change and Bangladesh 4 Scope of this report 4 2 Existing Climate Variability and Climate Change 7 Existing climate variability 7 Climate change 10 3 Tropical Cyclones and Storm Surges 17 Historical vulnerability to tropical cyclones and storm surges 18 Adaptation measures currently in place 19 Estimating potential damage and adaptation cost 25 Implications for Adaptation Strategy 42 4 Inland Flooding 47 Historical Vulnerability of Inland Flooding 47 Estimating adaptation cost 50 Implications for adaptation strategy 63
  • 6.
    iv E C O N O M I C S O F A D A P TAT I O N T O C L I M AT E C H A N G E 5 Agriculture and Food Security 67 Background 67 Projected future climatic conditions 68 Direct impacts on agriculture 69 Economy-wide impacts and responses 73 Implications for adaptation strategy 75 6 Local Perspectives on Adaptation 79 Background 79 Overview of hotspots 79 Vulnerability to Climate Change 82 Adaptation practices 83 Preferred Adaptation Options 85 Implications for adaptation strategy 86 7 Limitations of the Study 89 8 Summary of Findings 93 References 100 Annexes (available on line at www.worldbank.org/eacc) Annex 1. Major cyclones crossing Bangladesh coast (1960–2009) Annex 2. Tracks for major cyclones that crossed the Bangladesh coast, 1960–2009 Annex 3. Cyclone Tracks used to simulate inundation risk under the Climate Change Scenario Annex 4. Description of Cyclone and Bay of Bengal Model Annex 5. Polders Likely to be overtopped in the Baseline and Climate Change Scenarios Annex 6. Estimated cost to prevent overtopping of embankments by 2050 Annex 7. Earthwork Computation with an illustrative Example Annex 8. Determining additional vents required to reduce drainage congestion in coastal polders Annex 9. Floods in Bangladesh Annex 10. Spatial Vulnerability of Bangladesh to various types of floods Annex 11. Classification of floods in Bangladesh Annex 12. Flood-affected areas in Bangladesh, 1954–2007 Annex 13. Chronology of above normal floods in Bangladesh Annex 14. Damages from major floods in Bangladesh Annex 15. Models used for flood hydrology Annex 16. Social component methodology
  • 7.
    BA N GL A D E S H CO U N T RY ST U DY v Tables Table ES.1 Scope of study in the context of programs and activities included in the xiv Bangladesh Climate Change Strategy and Action Plan Table ES.2 Cost of adapting to tropical cyclones and storm surges by 2050 ($ millions) xvi Table ES.3 Total adaption cost for inland flooding by 2050 ($ millions) xvii Table 2.1 Peak discharge and timing during extreme flood years 8 Table 2.2 Water level trends at different stations along the coastline 9 Table 2.3 Estimated average change (%) in discharge 12 Table 2.4 Sea level rise impacts on flood land types 15 Table 3.1 Typical storm surge characteristics for cyclones in Bangladesh 19 Table 3.2 Economic indicators Bangladesh: Current and 2050 25 Table 3.3 Potential Inundation Risk Exposure Area (sq km) 29 Table 3.4 Population exposed to inundation risk (million) 29 Table 3.5 Road exposed to inundation risk (km) 29 Table 3.6 Area affected in a single cyclone with a 10-year return period (sq km) 31 Table 3.7 Population affected in a single cyclone with a 10-year return period (millions) 31 Table 3.8 Roads affected in a single cyclone with a 10-year return period (km) 31 Table 3.9 Damages and losses during a single Super cyclonic storm by economic sector 32 Table 3.10 Cropped area exposed to inundation risk in the baseline and 34 climate change scenarios (ha) Table 3.11 Damages and losses from Cyclone Sidr (2007) by economic sector 37 Table 3.12 Additional damages and losses due to climate change in 2050 37 Table 3.13 Estimated cost for height enhancement of coastal polders ($ millions) 40 Table 3.14 Cost to increase geographic precision of cyclone and surge warnings 43 Table 3.15 Cost of adapting to climate change by 2050 ($ millions) 43 Table 3.16 Sequencing of adaption options for tropical cyclones/storm surges 44 Table 4.1 Flood classification in Bangladesh 48 Table 4.2 Impacts and losses for recent exceptional or catastrophic floods 48 Table 4.3 Growth trends in total GDP and agricultural GDP in relation to major flood events 51 Table 4.4 Flood land classes (based on 24 hour duration inundation) 54 Table 4.5 Rural Population Exposed to Inundation risk 54 Table 4.6 Rural population density by flood land class (people per sq km) 55 Table 4.7 Areas with changes in inundation depth due to climate change 56 Table 4.8 Length of road by type at additional inundation risk from climate change in 2050 (km) 58 Table 4.9 Adaptation cost for roads by type of road (Tk millions) 59 Table 4.10 Railway track at risk of additional inundation due to climate change by 2050 (km) 59 Table 4.11 Cost per kilometer to raise different railway tracks upto 0.5 meters ($/km) 60 Table 4.12 Cost of earthwork ($ per km) by type of rail track and inundation depth (m) 60 Table 4.13 Adaptation cost for railways ($ millions) 60 Table 4.14 Embankments exposed to additional inundation risk due to climate change (km) 60 Table 4.15 Itemized cost for raising embankments ($ millions) 61 Table 4.16 Total adaption cost for inland flooding ($ millions) 64 Table 6.1 Location of eight hotspots selected for based of hazard 81
  • 8.
    vi E C O N O M I C S O F A D A P TAT I O N T O C L I M AT E C H A N G E Figures Figure 1.1 Poverty and climate hazards 3 Figure 2.1 Annual and seasonal (mm) precipitation averaged across meteorological stations by year 8 Figure 2.2 Monthly, annual, and seasonal temperature changes 10 Figure 2.3 Monthly, annual, and seasonal precipitation changes 10 Figure 2.4 Total change in national flooded area for 2050 in the A2 and B1 scenarios 13 Figure 3.1 Location of coastal polders in Bangladesh 20 Figure 3.2 Location of cyclone shelters in coastal areas 23 Figure 3.3 Population density in coastal areas in relation to areas of inundation risk 24 Figure 3.4 Inundation risk exposure map—baseline scenario 27 Figure 3.5 Inundation risk exposure map—climate change scenario 28 Figure 3.6 Population under povery in relation to inundation risk 30 Figure 3.7 Location of overtopped polders 38 Figure 4.1 Extent of above-normal flooding in Bangladesh, 1950–2009 49 Figure 4.2 Growth trends in total GDP and agricultural GDP in relation to major flood events 49 Figure 4.3 Flood map – 24 Hour Duration Flood (baseline scenario) 52 Figure 4.4 Flood map – 24 Hour Duration Flood (climate change scenario) 53 Figure 4.5 Change in inhundation depth due to climate change 56 Figure 5.1 Percentage change in national potential production due to temperature, precipitation, and CO2 70 Figure 5.2 Percentage change in national potential production from flood damages only 71 Figure 5.3 Percentage change in national potential production combined effects 72 Figure 5.4 National rice production (Metric tons) 73 Figure 5.5 Share of discounted GDP 73 Figure 5.6 Net revenues and overall social preference of adaption measures 77 Figure 6.1 Poverty and climate hazards 80 Figure 6.2 Map of Bangladesh showing the eight hotspots 81 Figure 6.3 Livelihood capital assets in eight hotspots 83
  • 9.
    BA N GL A D E S H CO U N T RY ST U DY vii Acronyms AR4 Fourth Assessment Report IWM Institute of Water Modeling BARI Bangladesh Agricultural Research MJO Madden-Julien Oscillation BBS Bangladesh Bureau of Statistics MSL Mean sea level BCAS Bangladesh Center for Advanced Studies NCA Net cultivable area BMD Bangladesh Meteorology Department NGO Nongovernmental organization BRRI Bangladesh Rice Research Institute RCM Regional climate model CEGIS Center for Environmental and Geographic SRTM Shuttle Radar Topography Mission Information Services TAR Third Assessment Report CGE Computable general equilibrium TRMM Tropical Rainfall Measurement Mission CO2 Carbon dioxide USGS United States Geologic Survey DAE Department of Agriculture Extension DEM Digital elevation model DSSAT Decision support system for UNITS OF MEASURE agro-technology transfer ac acres ENSO El Nino-Southern Oscillation ha hectares FAO Food and Agriculture Organization of the kg kilograms United Nations MT metric tons FCDI Flood control and drainage infrastructure FFWC Flood Forecast and Warning Center GBM Ganges-Brahmaputra-Meghna CURRENCY EQUIVALENTS GCM Global circulation (or climate) model US $1.00 = Tk 70.00 GDP Gross domestic product (unless otherwise noted, all dollars are U.S. dollars) GOB Government of Bangladesh GTOPO Global topography FISCAL YEAR (FY) July 1–June 30 HYV High-yielding variety IFPRI International Food Policy Research Institute IMD Indian Meteorological Department IPCC Intergovernmental Panel on Climate Change
  • 10.
    viii E C O N O M I C S O F A D A P TAT I O N T O C L I M AT E C H A N G E
  • 11.
    BA N GL A D E S H CO U N T RY ST U DY ix Acknowledgments The EACC study has been conducted as a partner- Fankhauser, Ravi Kanbur, and Joel Smith; and ship among the World Bank, which led its technical to the study’s peer reviewers, Proditpo Gosh, aspects; the governments of the United Kingdom, Michael Steen Jacobsen, Ravi Kanbur, Sanjay Netherlands, and Switzerland, which provided fund- Kathuria, Lalita Moorty, and David Wheeler. ing; and the participating case study countries. Numerous comments and suggestions were also This report has been prepared by a team led by received from a large number of colleagues Kiran Pandey (Coordinator EACC country stud- during the course of the study, and the team is ies) and comprising Susmita Dasgupta, Anne thankful to all of them. From the World Bank, Kuriakose, Khawaja M. Minnatullah, Winston they include Ian Noble, Apurva Sanghi, and Yu, Nilufar Ahmad (former TTL), and Shakil Maria Sarraf. From outside the Bank, they Ferdausi (World Bank), Mainul Huq, Zahirul Huq include Gordon Hughes, Robert Schneider, Joel Khan, Manjur Murshed Zahid Ahmed, Ainun Smith and James Thurlow. The team is also Nishat, Malik Fida Khan, Nandan Mukherjee, grateful for the timely feedback by participants M. Asaduzzaman, S. M. Zulfiqar Ali, and Iqbal in three consultations in Dhaka—held in May Alam Khan (consultants). The team was sup- 2009, November 2009, and May 2010—and ported by Janet Bably Halder, Angie Harney, and two case study workshops in Washington in June Hawanty Page. 2009 and January 2010. The study team is grateful for the general guid- We would also like to thank Robert Livernash for ance of Sergio Margulis (TTL) of the Economics editorial services, Jim Cantrell for editorial input of Adaptation to Climate Change (EACC) proj- and production coordination, and Hugo Mansilla ect. EACC includes a global track and six other for editorial and production support. country cases studies. The EACC team also ben- efited from ongoing interaction with the Environ- The study team is also grateful for the financial ment Department’s management, particularly support provided by the partners of the EACC James Warren Evans and Michelle de Nevers. study, the governments of the United King- dom, Netherlands, and Switzerland and the The team is grateful to the advisory committee government of the Bangladesh for facilitating for the overall EACC study, comprising Sam the study.
  • 12.
    x E C O N O M I C S O F A D A P TAT I O N T O C L I M AT E C H A N G E
  • 13.
    BA N GL A D E S H CO U N T RY ST U DY xi Executive Summary Climate Hazards: rural poor in low-lying coastal areas are also dev- A Risk to Achieving astated by saline water intrusion into aquifers and groundwater and land submergence. In addition, Development Objectives seasonal droughts occasionally hit the northwest- ern region. Bangladesh is one of the most vulnerable countries in the world to climate risks. Investments during the past 50 years have Two-thirds of the nation is less than 5 meters increased the resilience of Bangladesh to above sea level and is susceptible to river and climate-related hazards. Since the sixties, rainwater flooding, particularly during the mon- the government of Bangladesh has invested $10 soon. Due to its location at the tail end of the billion on structural (polders, cyclone shelters, delta formed by the Ganges, Brahmaputra, and cyclone-resistant housing) and non-structural Meghna (GBM) rivers, the timing, location, and (early warning and awareness raising systems) extent of flooding depends on the precipitation in disaster reduction measures and enhanced its the entire GBM basin, not just on the 7 percent disaster preparedness systems. These investments of the basin that lies within the country. Nearly have significantly reduced damages and losses 80 percent of the country’s annual precipita- from extreme climatic events over time, especially tion occurs during the summer monsoon season, in terms of deaths and injuries. In addition, rural when these rivers have a combined peak flow of households have adapted their farming systems 180,000 m3/sec, the second highest in the world. to the “normal floods” that typically inundate Once every three to five years, up to two-thirds about a quarter of the country by switching from of Bangladesh is inundated by floods that cause low-yielding deepwater rice to high-yielding rice substantial damage to infrastructure, housing, crops. As a result, agricultural production has agriculture, and livelihoods. Low-lying coastal actually risen over the past few decades. Rising areas are also at risk from tidal floods and severe incomes have also enabled an increasing propor- cyclones. On average once every three years, a tion of households to live in homes that are more severe cyclone makes landfall on the Bangladesh resilient to cyclones, storm surges, and floods. coastline, either before or after the monsoon, cre- ating storm surges that are sometimes in excess Despite the increased resilience, climate- of 10 meters. Crops and the livelihoods of the related disasters continue to result in
  • 14.
    xii E C O N O M I C S O F A D A P TAT I O N T O C L I M AT E C H A N G E large economic losses — reducing eco- originating in the Bay of Bengal are also expected nomic growth and slowing progress in to occur more frequently as a result of warmer reducing poverty. The 1998 monsoon flood ocean surface temperatures. Cyclone-induced inundated over two- thirds of Bangladesh and storm surges are further exacerbated by a poten- resulted in damages and losses of over $2 billion, tial rise in sea level of over 27 cm by 2050. Most or 4.8 percent of GDP. The losses were evenly GCMs predict precipitation increases of up to 20 split among agriculture, infrastructure, and indus- percent during July, August, and September for try/commerce. Similarly, Cyclone Sidr resulted in the GBM basin. As a result, median discharges damages and losses of $1.7 billion, or 2.6 percent in the three rivers during the summer months are of GDP in 2007. About half the losses were in the expected to increase between 6 and 18 percent by housing sector, followed by agriculture and infra- the 2050s. Unlike temperature changes, the pre- structure. When averaged over the past decade, dicted changes in precipitation (and discharges) the direct annual costs from natural disasters to through 2050 are not distinct from the historically the national economy—in terms of damages to observed variability for all months and seasons, infrastructure and livelihoods and losses from reflecting the large variability in precipitation forgone production—have been estimated at 0.5 levels historically and even larger uncertainty in percent to 1 percent of GDP. These statistics do future precipitation predictions. not include the significant loss of life that has also occurred during these events. These damages and losses are geographically concentrated in Adaptation Essential areas that also have higher concentrations of the for Development poor, affecting them disproportionately. They live in thatch or tin houses that are more susceptible to direct damages from cyclones, storm surges, The Bangladesh Climate Change Strat- and floods. Additionally, most rural households egy and Action Plan, adopted by the gov- depend on weather-sensitive sectors—agricul- ernment of Bangladesh in 2009, seeks to ture, fisheries, and other natural resources—for guide activities and programs related to their livelihood. Destruction of their assets and climate change in Bangladesh. Until the livelihoods leaves the poor with a limited capacity past few years, climatic risks have been poorly to recover. reflected in national policies and programs Ban- gladesh. The country launched the National A warmer and wetter future climate that Adaptation Program of Action (NAPA) in 2005, goes beyond historical variations will which identified 15 priority activities that were exacerbate the existing climatic risks subsequently updated to 45 programs in 2009. and increase vulnerability by increasing The first sectoral policy to explicitly include cli- the extent and depth of inundation from mate change impacts and actions—the Coastal flooding and storm surges and by reduc- Zone Policy—was adopted in 2005. Climate ing arable land due to sea level rise and change has been a key concern in the redraft- salinity intrusion. The median predictions ing of the National Water Management Plan from the general circulation models (GCMs) are (NWMP). Recognizing that a wide range of poli- for Bangladesh to be 1.5°C warmer and 4 percent cies have the potential to address climate-related wetter by the 2050s. The median temperature hazards and vulnerability, the government devel- predictions exceed the 90th percentile of his- oped and adopted through a consultative pro- torical variability across GCMs for July, August, cess the Bangladesh Climate Change Strategy and September by the 2030s. Severe cyclones and Action Plan 2009 to guide economywide
  • 15.
    BA N GL A D E S H CO U N T RY ST U DY xiii efforts to adapt to climate change and to miti- Objectives and Scope gate greenhouse gases. It identifies three climate hazards—tropical cyclones/storm surges, inland of Study flooding, and droughts. The strategy contains 44 programs formulated around six themes— The objective of this study is to help food security/social protection/health, com- decision makers in Bangladesh to better prehensive disaster management, infrastructure, understand and assess the risks posed research/knowledge management, mitigation/ by climate change and to better design low carbon development, and capacity build- strategies to adapt to climate change. The ing/institutional strengthening (see Table ES.1). study takes as its starting point the BCCSAP. It Thirty-four programs listed under five themes builds upon and strengthens the analytical mod- are wholly or partially focused on adaptation. els and quantitative assessment tools already The BCCSAP includes an implementation time- in use in Bangladesh in support of the research frame for the 44 identified programs and is esti- and knowledge management theme of BCCSAP. mated to require $500 million in the first two These tools are used to (a) examine the potential years and about $5 billion in the first five years for physical impacts of climate change; (b) assess the full implementation. The government allocated associated damages and losses in key economic $100 million of its own resources in FY 2009–10 sectors, on vulnerable populations, and in the and has budgeted $100 million in FY2010–11 overall economy; (c) estimate spatially disaggre- toward actions contained in the strategy; it is gated costs of adaptation options that can reduce actively seeking additional resources to imple- these impacts; and (d) sequence the adaptation ment the full strategy. actions over time. In a fiscally constrained environment, The scope of this study is more limited sequencing of adaptation actions is a than the BCCSAP, so the reported costs necessity, particularly given the large represent a lower bound on the total adap- uncertainties about the magnitude and tation costs in Bangladesh. As highlighted in timing of the added risks from climate Table ES.1, this study encompasses about 21 of change. The fundamental problem of policy the identified adaptation actions, of which 11 are making in the face of climate change is one of examined quantitatively as well. Some important uncertainty with regard to climate outcomes. and likely expensive adaptation activities that Shifting resources toward more productive uses have not been included in this study are urban and away from less productive ones in the context drainage, river training works, dredging and of uncertainty is already a principal aim of devel- desiltation, and protection of ecosystems. opment for a fiscally constrained government. Climate change makes this task more complex. The study was developed in four discrete Uncertainty has important effects in any assess- and somewhat independent components ment of the impacts of climate change and on with varying degrees of analytical depth the selection and ranking of adaptation actions. and quantification. When feasible, common These include prioritizing adaptation actions with assumptions and similar methodologies were used more certain outcomes with the greatest near- to increase comparability and cohesion among term benefits, while also investing to develop the the components. The first two components of information base that can reduce the uncertain- the study focus on two of the hazards identified ties and guide the evolution of adaptation actions in the BCCSAP—tropical cyclones/storm surges over time. and inland flooding. They assess the added risk
  • 16.
    xiv E C O N O M I C S O F A D A P TAT I O N T O C L I M AT E C H A N G E Table ES.1 Scope of study in the context of programs and activities included in the Bangladesh Climate Change Strategy and Action Plan* Theme Immediate Short Term Medium to Long Term Food, Water and sanitation program in Institutional capacity and research security, climate vulnerable areas towards climate-resilient cultivars and social their dissemination Livelihood protection in protection and ecologically fragile areas Development of climate-resilient health cropping systems Livelihood protection of vulnerable socioeconomic groups Adaptation against drought, salinity (including women) submergence and heat Adaptation in fisheries sector Adaptation in livestock sector Adaptation in health sector Comprehensive Improvement of floods forecasting Risk management against loss of disaster and early warning system income and property management Improvement of cyclone and storm- surge warning Awareness raising and public educa- tion towards climate resilience Infrastructure Repair and maintenance of existing Planning, design, and implementation Repair and maintenance of existing flood embankments of resuscitation of networks of rivers coastal polders and khals through Repair and maintenance of existing Improvement of urban drainage dredging and de-siltation work cyclone shelter Adaptation against floods Adaptation against future cyclones and storm-surges Planning, design, and construction of river training works Research, and Establishment of a center for research, Preparatory studies for adaptation Monitoring of ecosystem and knowledge knowledge management, and training against sea level rise (SLR) and its biodiversity changes and their impacts management climate change impacts Macroeconomic and sectoral Climate change modeling at national economic impacts of CC and sub-national levels Monitoring of internal and external migration of adversely impacted popu- lation and providing support to them through capacity building for their rehabilitation in new environment Monitoring of impact on various issues related to management of tourism in Bangladesh and implementation of priority action plan Mitigation and Renewable energy development Rapid expansion of energy saving Improved energy efficiency in produc- low carbon devices e.g. (CFL) tion and consumption of energy Management of urban waste development Improving in energy consumption Gas exploration and reservoir Afforestation and reforestation pattern in transport sector and management programme options for mitigation Development of coal mines and coal- fired power station(s) Lower emissions from agricultural land Energy and water efficiency in built environment Capacity Revision of sectoral policies for climate Strengthening human resource building and resilience capacity institutional Mainstreaming climate change in Strengthening gender consideration in strengthening national, sectoral and spatial develop- climate change management ment programs Strengthening institutional capacity for climate change management Mainstreaming climate change in the media * Quantitative and Quantitative Analysis, Qualitative Analysis only, Not covered
  • 17.
    BA N GL A D E S H CO U N T RY ST U DY xv of these hazards due to climate change relative all 19 severe cyclones that have made landfall to the existing risks, identify specific assets and in Bangladesh during the past 50 years indicate activities that are at risk, and estimate the cost that they would overtop 43 of the existing pol- of adaptation actions to protect against these ders. Further, super-cyclonic storms (with winds risks. Sequencing of these actions is facilitated by greater than 220 km/hr) have a return period of detailed spatially disaggregated identification of around 10 years; currently, a single such storm adaptation options and associated cost estimates. would result in damages and losses averaging 2.4 In addition, the future economic damages from percent of GDP. Climate change is expected to a single super cyclonic event are also estimated, increase the severity of cyclones and the surges both with current risks and with the added risks they induce by 2050. When combined with an from climate change to provide a point of refer- expected rise in sea level, cyclone-induced storm ence for comparing the cost of adapting to this surges are projected to inundate an additional 15 risk. The third component of the study focuses percent of the coastal area. The depth of inun- on both the direct and economy-wide impacts dation is also expected to increase. While eco- of climate change on agriculture and food secu- nomic expansion is expected to expose additional rity from a full range of climate risks, includ- assets to inundation risk by 2050, expected struc- ing droughts (the third hazard identified in the tural shifts in the economy away from climate- BCCSAP), floods, sea level rise, warmer tempera- sensitive sectors, increases in urbanization, and tures, and increased CO2 concentrations. While a greater affordability of cyclone-resilient housing full set of adaptation options and the public sector is expected to limit the damages and losses from costs to address these impacts are not quantita- a single severe storm in 2050 to around $9.2 bil- tively analyzed, the relative desirability of trans- lion, or 0.6 percent of GDP. About half of these ferring existing coping strategies to newly affected damages and losses would occur even without the areas is examined. The final component provides added risks from climate change, so the incremen- local perspectives on adaptation as seen by the tal damages from the added risk from a changing poor and most vulnerable population. It exam- climate are around $4.6 billion. ines the determinants of the adaptive capacity of the vulnerable populations and solicits from local, Adaptation. Existing investments, which have regional and national stakeholders—through the reduced the impacts of cyclone-induced storm use of participatory scenarios—the types of pub- surges, provide a solid foundation upon which to lic support that would best enable the vulnerable undertake additional measures to reduce potential population to cope with potential climate change damages now and in the future. However, these impacts. investments are not sufficient to address the exist- ing risks, much less the future risk from climate change. By 2050, total investments of $5,516 mil- Results lion and $112 million in annual recurrent costs will be needed to protect against storm surge risk, The impacts of climate change and adaptation including that from climate change (Table ES.2). options analyzed and the cost of these options from each study component are summarized below. Of this, strengthening 43 polders against existing risks requires investments of $2,462 million and (1) Tropical cyclones and storm surges annual recurrent costs of $49 million. Even if the Impacts. The risk from cyclones and the storm numerous cyclone shelter construction programs surges they induce spans the entire Bangladesh provide sufficient capacity to protect all current coastline. Most of it is currently protected by 123 coastal area residents in at-risk areas, an additional polders constructed since the 1960s. Analyses of 2,930 shelters will need to be constructed by 2050
  • 18.
    xvi E C O N O M I C S O F A D A P TAT I O N T O C L I M AT E C H A N G E Table ES.2 Cost of adapting to tropical cyclones and storm surges by 2050 ($ millions) CC Scenario Baseline Scenario (additional risk due (total risk= (existing risks) to CC) existing + CC) Adaptation Option IC ARC IC ARC IC ARC Polders 2,462 49 893 18 3,355 67 Afforestation 75 75 Cyclone shelters 628 13 1,219 24 1,847 37 Resistant housing 200 200 Early warning system 39 8 39 8 Total 3,090 62 2,426 50 5,516 112 CC = climate change; IC = investment cost; ARC = annual recurrent cost at an estimated cost of $628 million to accommo- even under current risks, and (c) upgrading the date the expected population growth in coastal spatial and temporal resolution of forecasting and areas even under existing risk. Design innovations early warning systems. These actions should be and targeted subsidies can reduce the private cost accompanied by research to improve knowledge of cyclone-resistant housing and hence the need about the timing and spatial distribution of added for an even larger number of shelters. risks from climate change, which can guide the pace of additional adaptation efforts. Protecting against the added risks from climate change will require further strengthening of 59 (2) Inland monsoon flooding polders; afforesting sea-facing polders to reduce Impacts. Bangladesh has been incurring signifi- the hydraulic load of storm surges; constructing cant damages in terms of crop losses, destruction 5,702 additional cyclone shelters; providing incen- of roads and other infrastructure, disruption to tives to increase affordability of cyclone resistant industry and commerce, and injuries and losses housing; improving the spatial and temporal reso- in human lives from severe inland monsoon lution of forecasting and early warning systems; floods once every three to five years. The 1998 and expanding disaster preparedness programs flood inundated over two-thirds of Bangladesh in 19 additional districts. These additional mea- and resulted in damages and losses of over $2 bil- sures are expected to require an additional $2,426 lion, or 4.8 percent of GDP. Increased monsoon million in investments and $50 million in annual precipitation, higher transboundary water flows, recurrent costs. and rising sea levels resulting from climate change are expected to increase the depth and extent of Recognizing the uncertainties in the timing and inundation. The impacts of climate change are magnitude of the added risks from climate change, measured by comparing the inundation levels a prudent strategy would begin by addressing the predicted by simulations using the MIROC 3.2 existing risks that current coastal residents face Global Circulation Model predictions under the through (a) continued support for the construction A2 emission scenario (this simulation predicts the of an adequate number of multipurpose shelters largest increase in runoff) with the inundation lev- to protect the current populations from the exist- els in the 1998 floods. Climate change places an ing risks, (b) upgrading and strengthening 43 exist- additional 4 percent of land area at risk of inunda- ing polders that are at risk of being overtopped tion. Further, inundation depth increases in most
  • 19.
    BA N GL A D E S H CO U N T RY ST U DY xvii areas currently at risk, with increases greater than ES.3). The full cost of protection in 2050 will also 15 cm in about 544 km2, or 0.4 percent of the require addressing the existing risks of flooding, country. These are underestimates of the actual which are likely to be of the same of order of increased risk from climate change, as they do not magnitude. Recognizing the uncertainties in the account for the frequent river course changes. timing and magnitude of the added risks from cli- The total inundation risks in 2050 are actually mate change, a prudent strategy would begin by substantial, considering the increased risks are addressing the existing risks of monsoon flooding measured relative to the 1998 flood. Despite together with research on improving the temporal the higher risks, the rural population exposed and spatial resolution of flood predictions, which to flooding, however, is expected to decline from can guide additional actions. current levels due to the rural-to-urban migration that is projected to occur by 2050. 3) Agriculture and food security Impacts. The combined effects of rising tempera- Adaptation. Rural households have adapted their tures, higher precipitation, CO2 fertilization, farming systems to the “normal floods” that typi- severe flooding, occasional seasonal droughts, and cally inundate about a quarter of the country loss of arable land in coastal areas resulting from every year by switching to high-yielding rice crops climate change are expected to result in declines instead of low-yielding deepwater rice. As a result, in rice production of 3.9 percent each year, or a agricultural production has actually risen over cumulative total of 80 million tons over 2005–50. the past few decades. High-magnitude, low-fre- Overall, climate change is expected to decrease quency floods such as the 1998 floods, however, do agricultural GDP by 3.1 percent each year—a result in significant damages. The cost of protect- cumulative $36 billion in lost value-added—dur- ing against the existing risks of severe monsoon ing 2005–50. The economic losses increase by flooding was not estimated largely because of data threefold—to a cumulative $129 billion—when limitations. The additional cost to protect (a) road the indirect impacts on complementary industries networks and railways, (b) river embankments to and the dynamic effects on asset formation and protect highly productive agricultural lands, (c) productivity growth are included. This is equiva- drainage systems, and (d) erosion control measures lent to an average of $2.9 billion per year—and for high-value assets such as towns against the as high as $5.1 billion per year under more pes- higher inundation depths due to climate change simistic climate scenarios—with economic losses are estimated at $2,671 million in investment costs rising in later years. Around 80 percent of total and $54 million in annual recurrent costs (Table losses fall directly on household consumption and Table ES.3 Total adaption cost to address increased risk of inland flooding from climate change by 2050 ($ millions) Adaptation Option Investment Cost Annual Recurrent Cost Transport – Road height enhancement 2,122 42 Transport – Road cross-drainage 5 - Transport – Railway height enhancement 27 1 Embankment – height enhancement 96 2 Coastal Polders – cross drainage 421 8 Erosion Control Program 1 Total Costs 2,671 54
  • 20.
    xviii E C O N O M I C S O F A D A P TAT I O N T O C L I M AT E C H A N G E hence have severe household welfare implications; partial cost estimates. In addition, longer term the southern coastal regions and the northwest- adaptation has to also include development of ern regions are expected to experience the largest alternatives, particularly to the boro crop in the income declines. southern region. Adaptation. While the public sector cost of adap- (4) Poverty and local-level tation in the agriculture sector was not quantita- perspectives tively estimated, the relative merits of a number Impacts. The risks from tropical cyclones, storm of short-term adaptation measures—namely surges, floods, and other climatic hazards are geo- the extension of currently available options into graphically concentrated in specific regions of the new areas—are examined from the farmer’s country, which also have higher concentrations of perspective. These measures primarily exam- the poor. The poor and the socially most vulner- ine the merits of promoting existing crops from able are disproportionately affected, as they have one area to another as the climate regime shifts. the lowest capacity to cope with these losses. The They provide low-cost options for adapting to most vulnerable population includes those with small changes in the climatic regime and may few assets, subsistence farmers, the rural landless, be suitable for some areas in the near term. Part the urban poor, fishing communities, women, of the medium-term adaptation strategy will be children, and the elderly. They do not have suf- to control the damages from inland floods; the ficient resources to invest in preventive and pro- study’s inland floods component included some tective measures such as disaster-resilient housing,
  • 21.
    BA N GL A D E S H CO U N T RY ST U DY xix making them more vulnerable to the full effects teams in Char areas. While they are similar to of these hazards. Their access to public ser- adaptation options identified in the BCCSAP, vices, which might buffer them from some of the they do provide a greater emphasis on softer impacts, is also limited. In addition, their ability approaches (governance), include more gen- to better prepare themselves in the longer term eral options (education), and are more directly is also often limited by the destruction of their targeted to the community level (use of mobile asset base. These effects are further compounded medical teams). if vulnerable households suffer from multiple extreme-event shocks one after the other, without Some caution is advisable in reviewing sufficient time for recovery in between the shocks. these study results. To the extent that it increases the frequency of these events, climate change will only exacerbate The mathematical tools and models used in this these impacts. study impose intellectual discipline; allow for the estimation of impacts, costs, and benefits of Adaptation. The adaptive capacity of households is adaptation actions; and facilitate prioritization generally low, with poor urban dwellers the most of actions. These strengths can also be limiting disadvantaged due to the limited opportunities if the most important questions depend on insti- for livelihood diversification and low social capi- tutional, political, or cultural factors that are tal. The most common forms of private adap- not amenable to such tools; for example, how tation activities among surveyed households are to locate residents and economic activity away temporary migration of adult men for day labor, from high-risk or increasingly unproductive construction of platforms to protect livestock, areas, how to improve the allocation of water and storage of food and drinking water prior to and land, or how to improve the quality of edu- extreme events. The preferred public adaptation cation. Within the limitations imposed by the activities from a local perspective—as identified modeling frameworks, important limitations of by participants in local and national participa- this study derive from three sources of uncer- tory scenario development workshops—include tainty: climate, economic growth, and technol- (a) environmental management (mangrove pres- ogy. The climate scenarios used in the analysis ervation, afforestation, coastal greenbelts, waste are predicated on future global economic growth management); (b) water resource management and global efforts to mitigate greenhouse gases (drainage, rainwater harvesting, drinking water (GHGs). Whereas predicted changes in climate provision, and flood control); (c) infrastructure through 2050 largely depend on current and (roads, cyclone shelters); (d) livelihood diversi- past emissions, future global mitigation efforts fication and social protection for fishers during will increasingly determine the extent of warm- the cyclone season; (e) education; (e) agricul- ing toward the latter half of this century. While ture, including development of salt-tolerant and it is unlikely that technological breakthroughs high-yield varieties and crop insurance; (f) fisher- can greatly reduce the costs of adaptation, dra- ies, including storm-resistant boats and conflict matic reductions in the cost of mitigation are resolution between shrimp and rice farmers; (g) possible over the next few decades. A higher governance, especially access to social services return on investment in mitigation would in turn for urban poor; (h) gender-responsive disas- reduce the amount of adaptation that would be ter management, including separate rooms for required in the longer term. Nevertheless, it is women in cyclone shelters, mini-shelters closer essential to invest in adaptation to at least meet to villages, and the use of female voices in early the unavoidable warming. warning announcements; and (i) mobile medical
  • 22.
    xx E C O N O M I C S O F A D A P TAT I O N T O C L I M AT E C H A N G E Lessons and is expected to currently overtop 43 existing pol- ders. The expected damages from a single severe Recommendations cyclone currently is of the same order of magni- tude as the total cost of strengthening all 43 pol- Despite significant investments over the past 50 ders that would currently be overtopped. Future years, climate-related disasters continue to have damages are expected to be higher for two rea- significant damages. Without additional actions, sons: (a) higher risks as sea level rise and storms these damages will certainly persist into the fore- become more intense due to climate change; and seeable future. While there is great uncertainty (b)an increase in the value of assets that would about the magnitude and the timing of the added be located in at-risk areas as incomes rise. Steps risk from climate change, the risks and hence the taken to strengthen these 43 polders would not potential damages are expected to increase. In a only protect against future risks, but also pro- fiscally constrained environment with competing vide immediate benefits by preventing damages priorities, climate adaptation actions have to be from current risks, and hence are a near-term prioritized and sequenced, particularly given the priority.1 large costs required to prevent and protect against these risks. The BCCSAP provides a starting point During cyclonic events, existing multipurpose for doing so. This study examines the key drivers— shelters have also effectively protected the coastal the degree of certainty, the timing of the benefits, population. The ongoing development benefits and the cost of action—to enable further substan- of these shelters—as clinics, schools, or com- tiation and refinement of the sequencing envi- munity centers—easily offset (fully or partially) sioned in the BCCSAP. A good near-term strategy the construction cost of these facilities. Numer- would be to protect populations and assets against ous programs are already under way to construct current climate risks while investing to reduce the additional multipurpose shelters. A near-term uncertainties about the magnitude and timing of priority is to assess the adequacy of the current future risks. The future risks can then be addressed construction programs to provide sufficient shel- in the medium to long term as the risks and the ter capacity to accommodate the current popula- potential damages become more certain. tion living in areas currently at risk of cyclones and storm surges, and to develop a plan for con- Near term structing additional shelters as necessary. (1) Addressing current climate-related Detailed analyses were not carried out to exam- risks: a current priority ine the costs of addressing current risks for other Rehabilitating polders currently at risk of being climate hazards such as inland monsoon flood- overtopped during a typical severe cyclone not ing or droughts. Nevertheless, the large damages only protects against the increased future risks associated with current climate variability makes from climate change but also provides immediate it prudent to start by addressing the known cur- benefits by reducing the damages from current rent risks in the near term before beginning to storms. This study assessed the risk that polders address the less certain future risks. Shoring up might be overtopped during cyclone-induced river embankments, elevating roads, or adding storm surges currently and with the added risk culverts to accommodate drainage requirements of climate change. The polder-specific costs to prevent overtopping under these two condi- 1 If needed, these polders can be further prioritized through tions were determined from detailed engineering further analyses that compare the assets and activities that would be protected by each polder with the costs of strengthening that analysis of each polder. A typical severe storm polder.
  • 23.
    BA N GL A D E S H CO U N T RY ST U DY xxi for severe monsoon floods that exist today would not only provide immediate benefits, but also pro- tect against increased future flood risks that are expected with climate change. Similarly, given the large impacts of current cli- mate variability on the agriculture sector, a pru- dent near-term strategy would be to promote activities and policies that help households and the government build resilience to existing climate shocks affecting crop yields, particularly because of the lead time needed to strengthen research systems and to transfer and adapt findings from the lab to the field. This effort better prepares the country and households for whichever future cli- mate materializes. (2) Research and Knowledge Building: key to improved targeting of future actions Given the high cost of infrastructure investments, and the expected gradual increase in climate risk over decades, it is prudent to adapt infrastructure incrementally in response to the added risk of cli- mate change. This is especially true because of the large uncertainties regarding the magnitude and timing of the added risk from climate change. In this regard, research and knowledge focused on improving the spatial and temporal precision of current climate-related risk forecasts and asso- ciated early warning systems would enable bet- institutions that (a) gradually integrate new knowl- ter targeting of future adaptation actions. These edge about climate risks into new infrastructure actions not only provide immediate benefits, investments; (b) reduce perverse incentives that but also improve the capacity to address climate are often associated with these investments; (c) risks in the future. Supplemental research activi- develop new, more resilient varieties of crops; (d) ties focused on reducing the large uncertainties improve governance and local stakeholder partici- about future climate risks can also guide the pation to increase effectiveness of the hard invest- extent of adaptation that will be needed and its ments; and (e) facilitate regional cooperation for prioritization. the equitable sharing of commonly shared water resources. Medium to Long Term (3) Sound development policies: A good medium- to long-term strategy has to the foundation for an adaptation agenda begin with effective development. Other elements Sound development policies provide the founda- of a longer term strategy include investments in tion for adaptation action in the medium to long programs and the creation or strengthening of term. Adaptation takes place in the context of
  • 24.
    xxii E C O N O M I C S O F A D A P TAT I O N T O C L I M AT E C H A N G E development, which defines both the opportuni- costs. As research makes the risk of flooding in a ties to adapt and generates the means for adapting location more apparent, the design standards for to climate change. Expected structural changes roads in these areas need to be increased accord- in the economy—away from climate-sensitive ingly. Similarly, polders need to be strengthened sectors such as agriculture toward industry and beyond their current protective capacity as the services—reduce exposure to climate risks, while added risk from storm surges becomes more cer- urbanization concentrates risks but also provides tain. Applying the standards to infrastructure new opportunities to manage them better. Invest- investments as they are replaced not only pro- ments to expand the road system and increase vides a flexible way to integrate the most updated the share of paved roads lowers transport costs, research outcomes but also provides a natural way enhances the ability of farmers to respond to mar- to modulate adaptation efforts, scaling up adapta- ket changes and expand markets, while lessening tion efforts if the risks are increasing or limiting the impacts of floods. Poverty exacerbates vulner- efforts if the risks are stable or declining. ability to weather variability as well as climate change, so reducing poverty is central to both (5) Reducing perverse incentives: development and adaptation. Rising incomes a necessity to increase effectiveness of enable households to autonomously adapt and infrastructure investments better cope with climate-related disasters—for As a general rule, investments—such as flood instance, by increasing the affordability of cli- embankments or polders—designed to protect mate-resilient housing, which can dramatically vulnerable assets should be subjected to careful reduce the number of shelters that are necessary consideration. Strengthening an embankment is to protect coastal residents. The effectiveness of followed, almost by definition, by an accumulation adaptation programs can be also be improved of physical capital in the shadow of the embank- through the targeting of adaptation actions that ment because it is considered “safe.” However, as directly assist the poor, such as early warning and the tragedy of New Orleans dramatically illus- evacuation services, basic education (particularly trated, a sufficiently extreme event will breach a for women), and subsidized insurance programs. polder. The combination of the increasing sever- ity of extreme events, the high costs of provid- (4) Adjustment of design standards ing physical protection, and the accumulation of for infrastructure: essential for future capital behind such barriers can mean that the resilience expected value of losses, including human suffer- Infrastructure investments are long-lived and ing, may not be reduced—either at all, or by as expensive and yield large benefits when designed much as expected by investments in protection. appropriately. It is essential to institutionalize the development of appropriate standards com- The long-term challenge is to move people and mensurate with the likely climate risks over the economic activity into less climate-sensitive areas expected lives of the assets and to update them and to seek a strategic balance between protect- over time based on new research results that ing existing populations and encouraging the become available. For example, the prospect of mobility of future populations. In 2050, the num- more intense precipitation has implications for ber of people living in cities will triple, while the unpaved roads, especially in rural areas, which rural population will fall by 30 percent. Current are vulnerable to being washed away by floods policies will determine where this urban popula- and heavy rainfall. Single-lane sealed roads have tion settles and how prepared it is to adapt to a a higher capital cost, but they provide a more reli- changed climate. Many households have moved able all-weather network with lower maintenance further inland, partly due to higher perceived risk,
  • 25.
    BA N GL A D E S H CO U N T RY ST U DY xxiii but strengthened embankments may change these (7) Improved governance and stakeholder perceptions, leading to increased exposure. Good participation: a complement to hard policy needs to encourage future populations to investments move away from naturally high risk areas, avoid- The effectiveness of hard investments depends on ing perverse incentives to remain in high-risk both the ability of targeted populations to access areas and adopting positive incentives to promote them and on their uptake. Improved governance settlements and urban growth in low-risk areas. and local stakeholder participation are often Strengthened education in rural areas is critical key determinants of access and uptake. Reach- for rural migrants to be prepared for productive ing women requires gender-sensitive designs of lives in new urban areas. interventions such as the provision of separate facilities for women in cyclone shelters. Pro-poor Similar concerns apply to efforts to maintain the adaptation investments include social protec- welfare of populations in areas where climate tion, livelihoods diversification, and investments change alters the comparative advantage of agri- in human and social capital (including training, culture and other resource-intensive activities. education, and community-based disaster risk Short-term measures to prevent suffering must management) in order to strengthen local resil- be complemented by long-term measures such as ience to climate change. education, job training, and migration designed to reduce reliance on resources and assets whose (8) Strengthened regional cooperation: an value may be eroded by climate change. Adapta- essential option in the long term tion should not attempt to resist the impact of cli- Climate change may greatly increase the need for mate change, but rather it should offer a path by regional cooperation. Cooperation on the sharing which accommodation to its effects is less disrup- of water resources with neighboring countries in tive and does not fall disproportionately on the the GBM basin is not a new issue for Bangladesh, poor and the vulnerable. but it is one whose importance may be greatly increased by climate change. Recognizing its (6) Development of climate-resilient cul- importance, Bangladesh has been meeting since tivars and cropping: an option for long- 2006 with six other neighboring countries— term food security including India, Nepal, and China—as part of Additional research will also be necessary for the Abu Dhabi Dialogue. These dialogues have the development of climate-resilient cultivars resulted in a consensus vision of a “cooperative and cropping patterns that are more suited to and knowledge-based partnership of states fairly the future climatic conditions, particularly in the managing and developing the Himalayan river southern coastal regions, which are expected to systems,” as well as agreements on specific actions be affected the most by climate change. Bangla- to advance the water cooperation agenda. As the desh already has an active network of agricul- stakes rise, effective steps taken now to promote tural research institutes that develop and test new and strengthen the cooperative programs such crop varieties to increase national production as the Abu Dhabi Dialogue can not only provide and resilience against climate risks. The magni- immediate benefits to all parties, but can also pre- tude of the additional effort and the direction it vent the need for expensive and possibly disrup- takes will depend on the specific future climate tive solutions in the future. that materializes.
  • 26.
    xxiv O NE E C O N O M I C S O F A D A P TAT I O N T O C L I M AT E C H A N G E
  • 27.
    BA N GL A D E S H CO U N T RY ST U DY 1 Introduction Motivation and Context for initial findings were that developing countries will the EACC Study need $70 to $100 billion per year between 2010 and 2050 to adapt to a world that is approximately 20C warmer in 2050 (World Bank 2010). The Economics of Adaptation to Climate Change (EACC) study has two specific objectives. The first Each country case study under the country is to develop a “global” estimate of adaptation costs track consists of a series of studies that exam- to inform the international community’s efforts to ine the impacts of climate change and the costs help those developing countries most vulnerable to of adapting to them for select major economic climate change to meet adaptation costs. The sec- sectors. Most case studies also included vulner- ond objective is to help decision makers in devel- ability assessments and a participatory scenario oping countries to better understand and assess the workshop to highlight the differential impact of risks posed by climate change and to better design climate change on vulnerable groups and to iden- strategies to adapt to climate change. The study tify the types of adaptation strategies that can comprises a global track to meet the first study benefit those that are most vulnerable. Finally, the objective and a country case study track to meet the sectoral analyses were integrated into analytical second objective. The country track comprises seven tools—such as a computable general equilibrium country case studies: Bangladesh, Bolivia, Ethiopia, model—to identify cross-sectoral constraints and Ghana, Mozambique, Samoa, and Vietnam. effects such as relative price changes. The findings from each of the seven countries—as well as a Using data sets with global coverage at the country final synthesis report covering both the global and level, the global track estimated adaptation costs the country tracks—will be available in 2010. for all developing countries by major economic sectors, including agriculture, forestry, fisheries, infrastructure, water resources, coastal zones, and Context for the Bangladesh health. Adaptation for ecosystem services is also Case Study discussed qualitatively. The study also considered the cost implications of changes in the frequency of extreme weather events, including the implications Bangladesh is one of the most vulnerable coun- for social protection programs. The global track’s tries in the world to climate risks. Two-thirds of
  • 28.
    2 E C O N O M I C S O F A D A P TAT I O N T O C L I M AT E C H A N G E the nation is less than 5 meters above sea level related hazards. Agricultural production has and is susceptible to river and rainwater flood- actually risen over the past few decades as rural ing, particularly during the monsoon. Due to its households have adapted their farming systems to location at the tail end of the delta formed by the the “normal floods” that typically inundate about Ganges, Brahmaputra, and Meghna (GBM) riv- a quarter of the country by switching from low- ers, the timing, location, and extent of flooding yielding deepwater rice to high-yielding rice crops. depends on the precipitation in the entire GBM Higher incomes have also enabled an increas- basin, not just on the 7 percent of the basin that ing proportion of households to live in homes lies within the country. Nearly 80 percent of the that are more resilient to cyclones, storm surges, country’s annual precipitation occurs during the and floods. In addition, the government of Ban- summer monsoon season, when these rivers have gladesh has invested $10 billion since the sixties a combined peak flow of 180,000 m3/sec, the on disaster reduction measures—both structural second highest in the world. Once every three to (polders, cyclone shelters, cyclone-resistant hous- five years, up to two-thirds of Bangladesh is inun- ing) and non-structural (early warning and aware- dated by floods that cause substantial damage to ness raising systems) measures—and enhanced its infrastructure, housing, agriculture, and liveli- disaster preparedness systems. These investments hoods. The performance of the agriculture sector have significantly reduced damages and losses is in turn heavily dependent on the characteristics from extreme climatic events over time, especially of the annual floods. Low-lying coastal areas are in terms of deaths and injuries. also at risk from tidal floods and severe cyclones. Bangladesh is one of the most vulnerable coun- Large damages and losses, reduced economic tries to climate risks, and is the most vulnerable growth and slowed progress in reducing poverty to tropical cyclones. Between 1877 and 1995, following recent climate-related disasters, how- Bangladesh was hit by 154 cyclones—including ever, indicate that these measures are insufficient 43 severe cyclonic storms and 68 tropical depres- to protect the exposed population and assets sions— or one severe cyclone every three years, against existing risks. The 1998 monsoon flood either before or after the monsoon, creating inundated over two- thirds of Bangladesh and storm surges that are sometimes in excess of 10 resulted in damages and losses of over $2 billion, meters. The largest damages from a cyclone result or 4.8 percent of GDP. The losses were evenly from the induced-storm surges, and Bangladesh is split among agriculture, infrastructure, and indus- on the receiving end of about 40 percent of the try/commerce. Cyclone Sidr resulted in damages impact of total storm surges in the world. Crops and losses of $1.7 billion, or 2.6 percent of GDP and the livelihoods of the rural poor in low-lying in 2007. About half the losses were in the housing coastal areas are also devastated by saline water sector, followed by agriculture and infrastructure. intrusion into aquifers and groundwater and land When averaged over the past decade, the direct submergence. In addition, seasonal droughts annual costs from natural disasters to the national occasionally hit the northwestern region. economy—in terms of damages to infrastructure and livelihoods and losses from forgone produc- Addressing the impacts of climate and non-cli- tion—have been estimated at 0.5 percent to 1 mate natural disasters has been an integral part percent of GDP. These statistics do not include of the nation’s development plans. Investments the significant loss of life that has also occurred made over the past 50 years have made Bangla- during these events. desh more resilient to climate-related hazards, but additional steps are necessary to reduce potential These damages and losses are geographically damages from both existing and future climate- concentrated in areas that also have higher
  • 29.
    BA N GL A D E S H CO U N T RY ST U DY 3 concentrations of the poor, affecting them dis- and Action Plan in 2009 to guide its actions in all proportionately (Figure 1.1). They live in thatch areas related to climate change. Until the past few or tin houses that are more susceptible to direct years, climatic risks have been poorly reflected in damages from cyclones, storm surges, and floods. major national policies and programs in Bangla- Additionally, most rural households depend on desh. The country launched the National Adap- weather-sensitive sectors—agriculture, fisheries, tation Program of Action (NAPA) in 2005, which and other natural resources—for their livelihood. identified 15 priority activities that were subse- Destruction of their assets and livelihoods leaves quently updated to 45 programs in 2009. The first the poor with a limited capacity to recover. The sectoral policy to explicitly include climate change importance of adapting to these climate risks to impacts and actions—the Coastal Zone Policy— maintain economic growth and reduce poverty is was adopted in 2005. Climate change has been thus very clear. a key concern in the redrafting of the National Water Management Plan (NWMP). Recognizing In a fiscally constrained environment, with com- that a wide range of policies have the potential to peting priorities, efforts to address climate related address climate-related hazards and vulnerability, risks can easily be set-aside. Recognizing these the government developed and adopted through complexities, the government of Bangladesh a consultative process the Bangladesh Climate adopted the Bangladesh Climate Change Strategy Change Strategy and Action Plan 2009 to guide Figure 1.1 Poverty and climate hazards Source: BBS, World Bank, and WFP 2009
  • 30.
    4 E C O N O M I C S O F A D A P TAT I O N T O C L I M AT E C H A N G E economy-wide efforts to adapt to climate change median discharges in the three rivers during the and to mitigate greenhouse gases. It identifies summer months are expected to increase between three climate hazards—tropical cyclones/storm 6 and 18 percent by the 2050s. These climatic surges, inland flooding, and droughts. The strat- changes are expected to exacerbate existing cli- egy contains 44 programs formulated around six mate hazards — such as cyclones/storm surges, themes—food security/social protection/health, different floods, droughts, salinity, waterlogging, comprehensive disaster management, infrastruc- and drainage congestion — increasing their ture, research/knowledge management, miti- severity and frequency. gation/low carbon development, and capacity building/institutional strengthening (see Table ES.1). Thirty-four programs listed under five Scope of This Report themes are wholly or partially focused on adap- tation. The strategy includes an implementation This report synthesizes the series of studies that timeframe for each program and is estimated to constitute the EACC Bangladesh case study. require $500 million in the first two years and The study is intended to assist the government about $5 billion in the first five years for full of Bangladesh in its efforts to understand how implementation. The government allocated $100 climate change may alter the physical and eco- million from its own resources in FY 09-10 and nomic impacts of existing climate-related haz- has budgeted $100 million in FY10–11 toward ards, as well as the effectiveness and costs of actions contained in the strategy. It is actively available adaptation options. The study takes seeking additional resources to implement the full as its starting point the BCCSAP. It builds upon strategy. and strengthens the analytical models and quan- titative assessment tools already in use in Bangla- desh in support of the research and knowledge Climate Change and management theme of BCCSAP. This study uses Bangladesh these tools to (a) examine the potential physical impacts of climate change; (b) assess the associ- ated damages and losses in key economic sec- A warmer and wetter future climate that goes tors, vulnerable populations, and in the overall beyond historical variations will exacerbate exist- economy; (c) estimate spatially disaggregated ing climatic risks and increase vulnerability by costs of adaptation options that can reduce these increasing the extent and depth of inundation impacts; and (d) sequence the adaptation actions from flooding and storm surges and by reducing over time. The study is not a substitute for the arable land due to sea level rise and salinity intru- BCCSAP, instead it is designed to provide more sion. The median predictions from the general precise cost estimates actions in the BCCSAP circulation models (GCMs) are for Bangladesh and approaches to sequencing these actions in a to be 1.5oC warmer and 4 percent wetter by the fiscally constrained environment. 2050s. Severe cyclones originating in the Bay of Bengal are also expected to occur more frequently The scope of the study is more limited, encom- as a result of warmer ocean surface temperatures. passing about 21 of the adaptation actions identi- Cyclone-induced storm surges are further exac- fied in BCCSAP (as highlighted in Table ES.1). erbated by a potential rise in sea level of over 27 Some important and likely expensive adaptation cm by 2050. Most GCMs predict precipitation activities—such as urban drainage, river training increases of up to 20 percent during July, August, works, dredging and desiltation, and protection of and September for the GBM basin. As a result, ecosystem services—are not included in the study,
  • 31.
    BA N GL A D E S H CO U N T RY ST U DY 5 so the reported costs represent a lower bound of provide a point of reference for comparing the the total adaptation costs in Bangladesh. cost of adapting to this risk. The third compo- nent of the study focuses on both the direct and The study was developed in four discrete and economy-wide impacts of climate on agricul- somewhat independent components with varying ture and food security from a full range of degrees of analytical depth and quantification. climate risks, including droughts (the third haz- When feasible, common assumptions and similar ard identified in the BCCSAP), floods, sea level methodologies were used to increase compara- rise, warmer temperatures, and increased CO2 bility and cohesion among the components. The concentrations. While a full set of adaptation first two components of the study focus on two of options and their public sector costs to address the hazards identified in the BCCSAP—tropi- these impacts are not analyzed, the relative cal cyclones/storm surges and inland desirability of transferring existing coping strat- flooding. They assess the added risk of these egies to newly affected areas is examined. The hazards due to climate change in the context final component provides local perspectives of the existing risks, identify specific assets and on adaptation as seen by the poor and most activities that are at risk, and estimate the cost vulnerable population. It examines the determi- of adaptation actions to protect against these nants of the adaptive capacity of the vulnerable risks. Sequencing of these actions is facilitated by populations and solicits from local, regional and detailed spatially disaggregated identification of national stakeholders—through the use of par- adaptation options and associated cost estimates. ticipatory scenarios—the types of public support In addition, the future economic damages from a that would best enable the vulnerable population single super cyclonic event are also estimated to to cope with potential climate change impacts.
  • 32.
    6 T WO E C O N O M I C S O F A D A P TAT I O N T O C L I M AT E C H A N G E
  • 33.
    BA N GL A D E S H CO U N T RY ST U DY 7 Existing Climate Variability and Climate Change Most of Bangladesh consists of extremely low land. mm of rain. The hydrometeorological character- Dhaka, the capital city with a population of over 12 istics of the three river basins make the country million, is about 225 km from the coast but within vulnerable to a range of climate risks, including 8 meters above mean sea level (MSL). Land eleva- severe flooding and periodic droughts. tion increases toward the northwest and reaches an elevation of about 90 meters above MSL. The high- This chapter characterizes the risks that Bangla- est areas are the hill tracts in the eastern and Chit- desh is currently facing due to variability in the tagong regions. The lowest parts of the country are current climate and how these are expected to in the coastal areas, which are vulnerable to tidal and change based on projections of the future climate cyclone-induced storm surges and sea level rise. through 2050. It is largely based on a comple- mentary World Bank study focused on climate Bangladesh is situated at the confluence of three change and food security that has recently been great rivers—the Ganges, the Brahmaputra, and completed (Yu et al. 2010). the Meghna. Over 90 percent of the Ganges- Brahmaputra-Meghna (GBM) basin lies outside the boundaries of the country. The country is Existing Climate Variability intersected by more than 200 rivers, of which 54 rivers enter Bangladesh from India. Like the Historical precipitation levels rest of the GBM basin, Bangladesh has a humid Figure 2.1 shows trends in the annual and sea- subtropical climate. The year can be divided into sonal precipitation levels averaged across 32 four seasons: the relatively dry and cool winter rainfall stations (both BMD and BWDB stations) from December to February, the hot and humid in Bangladesh between 1960 and 2001. The summer from March through May, the southwest national mean annual rainfall during this period summer monsoon from June through Septem- was 2,447 mm, with a maximum of 4,050 mm (in ber, and the retreating monsoon from October Sylhet) and minimum of 1450 mm (in Rajshahi). to November. The southwest summer monsoon The maximum rainfall occurs during the June, is the dominating hydrologic driver in the GBM July, and August monsoon months (JJA). Neither basin. More than 80 percent of annual precipita- the annual nor seasonal precipitation time series tion occurs during this period. Some areas of the show any statistically significant changes over this South Asia subcontinent can receive up to 10,000 time period.
  • 34.
    8 E C O N O M I C S O F A D A P TAT I O N T O C L I M AT E C H A N G E Figure 2.1 Annual and seasonal (mm) precipitation averaged across meteorological stations by year 3500 3000 2500 2000 1500 1000 500 0 1960 1965 1970 1975 1980 1985 1990 1995 2000 DJF MAM JJA SON ANN Note: DJF = December, January, February; MAM = March, April, May; JJA = June, July, August; SON = September, October, November. Source: Yu, W.H., et al. (2010) TABLE 2.1 PEAK DISCHARGE AND TIMING DURING EXTREME FLOOD YEARS Brahmaputra Ganges Meghna Return Return Extreme period period Years Date m3/s Date m3/s Date m3/s (area) (vol) 1974 7-Aug 91,100 3-Sep 50,700 - 21,100 7 7 1980 20-Aug 61,200 22-Aug 57,800 7-Aug 12,400 2 2 1984 20-Sep 76,800 17-Sep 56,500 17-Sep 15,400 2 4 1987 16-Aug 73,000 20-Sep 75,800 4-Aug 15,600 9 10 1988 31-Aug 98,300 4-Sep 71,800 18-Sep 21,000 79 34 1998 9-Sep 103,100 11-Sep 74,280 - 18,600 100 52 2004 12-Jul 83,900 19-Jul 77,430 - 16,300 10 20 Average 67,490 51,130 13,370 Min 40,900 31,500 7,940 Source: BWDB
  • 35.
    BA N GL A D E S H CO U N T RY ST U DY 9 Table 2.2 Water level trends at different stations along the coastline Station Name Station Location Duration No. of years Trend (mm/yr) Hiron Point Passur 1977 – 2002 26 5.6* Khepupara Nilakhi 1959 – 1986 22 2.9 Galachipa Lohalia 1968 – 1988 21 3.3 Dasmunia Tentulia 1968 – 1986 19 1.3 Kyoyaghat Tentulia 1990 – 2002 12 3.6 Daulatkhan Lower Meghna 1959 – 2003 31 4.3 Nilkamal Lower Meghna 1968 – 2003 33 2.3 Chadpur Lower Meghna 1947 – 2002 50 0.0 Companyganj Little Feni Dakatia 1968 – 2002 32 3.9 Chittagong Karnafuli 1968 – 1988 16 3.1 Dohazari Sangu 1969 - 2003 32 2.0 Lemsikhali Kutubdia Channel 1969 - 2003 27 2.1 Cox’s Bazar Bogkhali 1968 - 1991 22 1.4 * statistically significant to p < 0.05 Source: BWDB Historical discharges The 1987 flood was primarily from the Ganges. The observed peak discharges during severe flood In 1988, all three rivers had peaks within one events with the corresponding dates in the three week of each other. The 1998 flood discharge rivers are summarized in Table 2.1. The peak in the Ganges and Brahmaputra rivers was even discharges are almost 50 percent larger than the higher. This particularly devastating flood was a corresponding average discharge levels, highlight- result of a simultaneous peak in both the Brah- ing the extreme inter-annual variability. The tim- maputra and the Ganges rivers (Mirza 2003). In ing of the peak discharges on the three rivers on 2004, the Ganges and Brahmaputra peaked early. average does not coincide, with the Brahmaputra The 1998 event is the 1-in-100-year event from peaking in July and August and the Ganges in the total area impacted perspective, and the 1-in- August and September. The Brahmaputra starts 50-year event from the discharge perspective.2 rising in March due to snow melt in the Himala- yas, while the Ganges starts rising in early June Historical rise in sea level with the onset of the monsoon. Monsoon rainfall Long-term reliable data are not available to assess occurs in the Brahmaputra and Meghna basins the historical rise in sea levels along the Bangla- earlier than the Ganges basin due to the pattern desh coast. Trends in daily mean water levels in of progression of the monsoon air mass. In addi- the coastal zone may provide some insight on his- tion, due to its location at the tail end of three torical rise in sea levels. Observations from 13 sta- major rivers, current and future water levels in tions over 12 to 42 years are summarized in Table these rivers invariably depend on the hydrocli- 2.2. The annual changes range from 5.6 mm/yr at matic, demographic, and socioeconomic features Hiron point station to no change at the Chadpur that characterize the patterns of water utilization 2 Return periods are estimated in terms of the total area affected in the neighboring countries. and the total volume discharged in the Ganges and Brahmaputra using a Gumbel Type I distribution.
  • 36.
    10 E C O N O M I C S O F A D A P TAT I O N T O C L I M AT E C H A N G E station. The water level increased at a rate of 1.4 Climate Change mm/yr at Cox’s Bazar in the southeast and 3.9 mm/year at Companyganj in the middle of the south coastal zone. Though trends are positive at Future temperature and all stations, only the observations at Hiron Point precipitation changes are statistically significant. While the consider- Yu et al. (2010) summarize the changes in tem- able sedimentation occurring at this location may perature and precipitation changes predicted by partially explain the upward trend, these observa- 16 global circulation models for three emission tions may also result from land subsidence. scenarios for the fourth assessment report of the Figure 2.2 Monthly, annual, and seasonal temperature changes 2050s — 20TH CENTURY TEMPERATURE CHANGE FOR ALL SCENARIOS 6°C 5°C 4°C 3°C 2°C 1°C 0°C J F M A M J J A S O N D ann wet dry Aus Aman Boro Wheat Figure 2.3 Monthly, annual, and seasonal precipitation changes 2050s — 20TH CENTURY PRECIPITATION CHANGE FOR ALL SCENARIOS 100% 50% 0 -50% -100% J F M A M J J A S O N D ann wet dry Aus Aman Boro Wheat Note: The box and whiskers diagrams in Figure 2.2 and Figure 2.3 consist of a red line representing the median value, a box enclos- ing the inter-quartile range, dashed whiskers extending the to the furthest model that lies within 1.5x the inter-quartile range from the edges of the box, and red plus symbols for additional models that are perceived as outliers. Source: Yu, W.H., et al. (2010)
  • 37.
    BA N GL A D E S H CO U N T RY ST U DY 11 IPCC.3 Figure 2.2 shows the projected monthly, surpasses the 90th percentile of the historical annual, and seasonal temperature changes in temperature variability. the 2050s relative to the corresponding data for 1980–99.4 Temperature rises during all months Precipitation is subject to large existing variation in and seasons, but does not show any obvious sea- the historical record. Differences in the monsoon sonal structure except a wider distribution during structure and the influences of large-scale circula- the dry winter months. The median warming tion patterns like the Madden-Julien Oscillation predictions for Bangladesh across the models by (MJO) and the El Niño-Southern Oscillation the 2050s is 1.550C. (ENSO) contribute to this background variabil- ity. Despite the consistently noted enhancement Figure 2.3 shows the projected monthly, annual, of the monsoonal circulation pattern that leads and seasonal precipitation changes for the 2050s to a drying trend during the winter months and relative to the corresponding data for 1980–99. increased rainfall during the monsoons in the cli- Deviations for each time period are displayed mate scenarios of the 2050s, precipitation does as the percentage change from their baseline not separate itself from the historical variability average. Annual and wet season precipitation for any month or season due to the larger uncer- increases, though some models do continue to tainty in future predictions and the substantial show decreases in precipitation.5 Only simula- existing variability. tions for the post-monsoonal rabi dry season do not suggest a rise in precipitation. The median Future flood hydrology prediction for Bangladesh across the models is for Due to its location at the tail end of the GBM precipitation increases of 4 percent by the 2050s. basin, the flood hydrology of Bangladesh (includ- ing the location, timing, and extent of future Comparison to historical variability floods) depends not just on the 7 percent of the A trend toward a warmer and wetter future cli- basin that lies within Bangladesh, but on the entire mate will impact the agriculture sector in Ban- GBM basin. The super or national flood model gladesh, particularly if the climate state goes is used to estimate hydrologic changes within the beyond the variations found in the historical country from changes in temperature and pre- record. Warming is projected to generally accel- cipitation in Bangladesh and changes in water erate over the 21st century, although the model- flows into the country. The later is determined based probability distribution widens. By the from changes in precipitation and temperature 2030s, the median temperatures in July, August, predicted by GCMs using the Ganges-Brahma- and September of the future model distribution putra-Meghna (GBM) river basin model.6 Future flood estimates are modeled for five GCMs and 3 The 16 models are BCCR_bcm2.0, ccma_cgcm3.1(T63), 2 emission scenarios (A2 and B1) due to resource cnrm_cm3, csiro_mk3.0, gfdl_cm2.0, gfdl_cm2.1,giss_model_er, inmcm3.0, ipsl_cm4, miroc3.2(medres0,miub-echio_g, limitations.7 The chosen models are skillful in mri_cgcm2.3.1a, mpi_echam5, ncar_pcm1, ncar_ccsm3.0, replicating the dynamics of the monsoon in the ukmo_hadcm3. 4 The resolution of the models varies with about 5 grid boxes GBM basin, provide sufficient spatial resolution typically covering Bangladesh. The national values are weighted averages, with the weights equal to the percentage of each grid that is within Bangladesh. 6 These models are described in detail in Annex 15. Models used for flood hydrology 5 Despite only small changes in actual magnitude, rainfall devia- tions in the dry months of the year appear as very large percent- 7 The five GCMs are University Corporation for Atmospheric age changes due to the low baseline average. These dry season Research – CCSM, Max Planck Institute for Meteorology – totals would not have any noticeable impact on the annual rainfall ECHAM5, Hadley Center for Climate Prediction – UKMO, totals, but could still have significant ramifications for the severity Center for Climate System Research – MIROC, and Geophysi- of droughts. Conversely, simulated rainfall deviations in the wet cal Fluid Dynamics Laboratory – GFDL. The A1B scenario season have to be very large to produce high percentage changes. predictions are similar to the A2 scenario through 2050.
  • 38.
    12 E C O N O M I C S O F A D A P TAT I O N T O C L I M AT E C H A N G E Table 2.3 Estimated average change (%) in discharge* 2030s 2050s Brahmaputra Ganges Meghna Brahmaputra Ganges Meghna May 7.5 9.3 0.0 17.4 11.8 12.3 June 5.4 11.9 3.1 10.9 16.7 7.7 July 3.4 13.5 0.0 6.9 15.0 3.6 August 5.5 8.8 3.7 9.5 12.0 7.8 September 3.7 7.3 -2.0 9.7 12.5 5.9 * 5 GCM x 2 SRES = 10 model experiments Source: Yu, W.H., et al. (2010) for hydrologic modeling, and capture the range Future estimated discharges of changes and climate sensitivity across GCMs. Simulations of the future transboundary inflows of the three major rivers (Ganges, Brahmaputra, Future temperature and precipitation and Meghna) indicate increased basin precipita- changes over GBM basin tion will result in increased inflows into Bangla- Across the five models and two emission sce- desh over the monsoon period (Table 2.3).10 The narios, a clear consensus exists on a warming magnitude of change from the baseline depends trend in the GBM basin with increases of 1° to on the month, with larger changes on average on 3° C by 2050, with greater warming during the the Ganges and in the 2050s. There is not much dry winter months. Models differ widely regard- difference between the A2 and B1 scenarios. ing changes in precipitation in the GBM basin.8 Larger changes are anticipated by the 2050s com- Rainfall increases during the monsoon season pared to the 2030s. (both in the 2030s and the 2050s)—up to 20 per- cent more from July to September in most GCMs. Large changes at the onset of the monsoon (dur- events and misses sub-grid scale geographic variability; and ing May and June months), particularly in the (4) year-to-year variability at a particular location in the GCM Ganges, may reflect an earlier arrival of the mon- output tends to be underestimated due to simplified greenhouse forcing scenarios and coarse spatial resolution. In this approach, soon season. During the dry season, some models the starting point for all scenarios is the actual historical observed 30-year precipitation and temperature data, which captures show increased precipitation, while others show differences between subregions and day-to-day and year-to- decreased precipitation. The temperature and year variability. For each GCM/emission scenario, a monthly rainfall and temperature series, averaged over each 30-year time precipitation changes predicted by each model period, is determined for the historical period, the 2030s and are applied to the baseline historical climate data 2050s. By comparing the baseline and future monthly averages, a “delta” value for both rainfall and temperature is calculated (i.e. for use in generating flood scenarios.9 percentage change is used for precipitation and absolute change in degrees Celsius is used for temperature). The delta value is applied to the baseline historical climate data to estimate tem- 8 There is not even agreement on the direction of rainfall change perature and precipitation predictions from each GCM/emission between emissions scenarios for individual models (e.g. in Janu- scenario. The baseline climate period (1979–99) differs slightly ary, ECHAM A2 estimates decreases, ECHAM B1 estimates from the baseline hydrologic period (1978–2008), which intro- increases). duces slightly higher baseline conditions for the delta method. However, changes between 1999 and 2008 are the smallest of the 9 This is a standard (“delta”) approach used to overcome the 20th century. following shortcomings of directly using predictions of GCMs to generate future flood scenarios: (1) GCM outputs may contain 10 Not all models predict increases in discharge. The model range significant biases both in the baseline period and in the future is largest for the Meghna (55 percent increase to 32 percent period; (2) daily output is required while the GCM output is typi- decrease) in the GFDL scenario. This partly reflects the smaller cally monthly; (3) the GCM spatial resolution reduces extreme baseline discharge at the onset of the monsoon.
  • 39.
    BA N GL A D E S H CO U N T RY ST U DY 13 Figure 2.4 Total change in national flooded area for 2050 in the A2 and B1 scenarios THE B1 SCENARIOS SHOW SMALLER CHANGES THAN THE A2 SCENARIOS, THOUGH IN THE SAME DIRECTION. 2050 — SCENARIO A2 2050 — SCENARIO B1 PERCENTAGE OF CHANGE PERCENTAGE OF CHANGE 50% 50% 40% 40% 30% 30% 20% 20% 10% 10% 0 0 -10% -10% -20% -20% May June July Aug Sept May June July Aug Sept CCSM ECHAM GFDL MIROC UKMO Source: Yu, W.H., et al. (2010) Changes in spatial extent of land flooding show smaller changes than the A2 scenarios, Given that most climate models indicate an though in the same direction. increasing trend of monsoon rainfall and greater inflows into Bangladesh, all else being equal, the The flooded area is estimated to increase for most extent of flooding is likely to increase. Monthly of the flood season for most models.11 For the A2 water levels are estimated for each grid point in scenario, the average increase of flooded area is 3 flood-relevant regions of Bangladesh for the his- percent in 2030 and 13 percent in 2050. However, torical period, the 2030s and 2050s. Accounting the changes in flood areas in many subregions fall for the existing flood protection infrastructure (e.g. within one standard deviation of the historical vari- roads, embankments, polders), the proportion of ability for these areas. The most significant changes area flooded (greater than 0.3m) is highest during occur later in the flood season, primarily in August July through September, peaking in August, when and September at the height of the monsoon, and the peak levels coincide in the three major rivers. The percentage change in flooded area by month 11 Some models indicate a decrease in flooding during the month and model is summarized in Figure 2.4 for 2050 of May, June, and July. The GFDL model, for instance, shows the largest decrease of 17 percent in flooded area in the month of for the A2 and B1 scenarios. The B1 scenarios May for the A2 scenario in the 2050s.
  • 40.
    14 E C O N O M I C S O F A D A P TAT I O N T O C L I M AT E C H A N G E in the south and central parts of the country. The national rice production lost (Nicholls and Leath- maximum observed increase in flooding occurs erman 1995). Sea level rise may also influence the during May (about 50 percent) for the MIROC extent of the tides—currently the lower third of model under the A2 scenario in the 2050s. the country experiences tidal effects—and alter the salinity quality of both surface and groundwater. Changes in temporal flood characteristics Currently, because of the low topography in these For each climate model/emission scenario, the coastal areas about 50 percent typically becomes future and baseline hydrographs are compared at inundated during the annual monsoons. 36 locations across the country to determine the changes in the temporal flood characteristics— Estimating the changes in area that will be inun- annual peak values, onset, and recession dates of dated due to sea level rise is complicated by the the flood. By the 2050s, many of the northern active river morphology. With over a billion tons subregions show statistically significant increases of sediment being deposited in the alluvial fan of in the annual peak, while many in the southwest Bangladesh (Goodbred and Kuehl 2000), a com- show decreases.12 Across the subregions, most bination of accretion and erosion processes will GCMs show earlier onset of the monsoon and work to both increase and decrease the land area a delay in the recession of flood waters, driven available in the coastal areas. For instance, satel- in large part by increased flows and flooding.13 lite images from the coastal zone reveal that some While the shifts are as large as 1–2 weeks across land areas have gained, while others have eroded the models, year-to-year variations in the annual over the last several decades. In the Meghna Estu- hydrograph are larger than the predicted changes ary specifically, about 86,000 ha of land were lost in a number of cases, making them inseparable between 1973 and 2000 (MES 2001). The rela- from the historical variability. tive contribution of these competing processes is largely unknown and an area for future research. Future sea level rise Rising sea levels rise are one of the most critical Changes in the total flood land type area based climate change issues for coastal areas. The Inter- on previous coastal zone modeling effort—using governmental Panel on Climate Change (IPCC the MIKE21 two-dimensional estuary model 2007a) projected that an average rise of 9 to 88 for the 15 cm, 27 cm, and 62 cm sea level rise cm could be expected by the end of the century. scenarios—is shown in Table 2.4 (DEFRA 2007). Recent projections suggest even more substantial Of a total 33,000 km2 in these coastal areas, over rises (Allison et al 2009). Increasing temperatures half is annually flooded. The total flooded area result in sea level rise by the thermal expansion of increases by 6, 10, and 20 percent for the three water and through the addition of water to the sea level rise scenarios respectively. The south- oceans from the melting of continental ice sheets. ernmost regions are expected to face the largest A 1 meter sea level rise is estimated to impact 13 increases in flooded area. million people in Bangladesh, with 6 percent of 12 Any observed change in average yearly peak levels must be considered in relation to this background variability. The baseline inter-annual variation is itself almost 0.5 m (average value of 11.6 m). 13 The baseline onset and recession dates are May 15 and Septem- ber 15. The onset (recession) date for a future scenario occurs when the water level reaches the same level as on the baseline onset (recession) date of May 15 (September 15). These are determined separately for each of the 16 locations for each of the climate models.
  • 41.
    BA N GL A D E S H CO U N T RY ST U DY 15 Table 2.4 Sea level rise impacts on flood land types 14 F0 F1 F2 F3 F4 Flooded Area (0-30 cm) (30-60 cm) (60-90 cm) (90-180 cm) (180 + cm) (F1+F2+F3+F4) % of total Base 15,920 4,753 4,517 5,899 1,759 16,928 52 15 cm 14,841 4,522 4,705 6,765 2,015 18,007 55 27 cm 14,189 4,345 4,488 7,456 2,370 18,659 57 62 cm 12,492 3,967 3,818 8,977 3,594 20,356 62 14 Note that the flood land type classes used in DEFRA (2007) are slightly different than the MPO definitions.
  • 42.
    16 TH REE E C O N O M I C S O F A D A P TAT I O N T O C L I M AT E C H A N G E
  • 43.
    BA N GL A D E S H CO U N T RY ST U DY 17 Tropical Cyclones and Storm Surges Bangladesh has been identified as the most vul- timely. The urgency of doing so is only hastened nerable country in the world to tropical cyclones by the significant additional future risks that are (UNDP 2004), with a severe cyclone striking Ban- expected due to climate change. The Fourth gladesh every three years on average (GoB 2009). Assessment Report of the IPCC projects that cli- Cyclone Sidr alone resulted in damages and losses mate change is likely to increase the severity of of $1.7 billion, or 2.6 percent of GDP in 2007, tropical cyclones and storm surges over the 21st primarily in the coastal region. The largest dam- century (IPCC 2007b). For the Bay of Bengal, ages from cyclones result from the storm surges Unnikrishnan et al. (2006) report increases in the they induce. Storm surge heights are typically less frequency of the highest storm surges, despite no than 10m, but Bangladesh has experienced surges significant change in the frequency of cyclones.15 in excess of 10m in some areas on occasion. A surge can be even more devastating if it makes In the absence of additional preventive measures, landfall during high tide. future storm damage risk in Bangladesh is likely to be larger because of expansion of the vulner- Faced with significant cyclone and storm surge able zone further inland, increase in the areal risk, Bangladesh has invested over $10 billion extent of inundation, and increased inundation during the past 35 years on disaster risk mitiga- depths during each cyclonic event. Actual future tion measures—both structural (polders, cyclone damages are also expected to increase in line with shelters, cyclone resistant housing) and non-struc- the projected increase in the assets and activities tural (early warning dissemination and awareness that are located in the inundated areas, and with raising)—and enhanced its disaster preparedness how well they are protected from these risks. system to address unavoidable risks (GoB 2009). These measures have significantly reduced the loss This chapter starts with a brief review of the of life and livelihoods and property damage from past experience of cyclones and storm surges in these extreme events. Bangladesh, followed by a review of the major adaption measures that are currently in place Nevertheless, given the significant large dam- to reduce the risk. The third section provides an ages from Cyclone Sidr, examining the adequacy of existing measures and the cost effectiveness 15 These results are based on dynamic models driven by climate of taking additional risk mitigation measures is projections from regional climate models.
  • 44.
    18 E C O N O M I C S O F A D A P TAT I O N T O C L I M AT E C H A N G E overview of the five-step methodology used to The largest adverse impacts of a cyclone occur assess the potential damages from storm surges from the inundation resulting from the storm and the adaptation costs that would need to be surges that cyclones induce in coastal regions. incurred to prevent these damages. The first step The Meghna estuarine region is the area where is to define the inundation risk exposure zones most of the surge amplifications occur. Bangla- for the baseline and climate change scenarios in desh is on the receiving end of about 40 percent 2050. The next three steps are to characterize the of the impact of total storm surges in the world assets and activities that are exposed to inundation (Murty and El Sabh 1992). The reasons for this risk, potentially affected during a single cyclonic disproportionately large impact of storm surges event and to estimate the potential damages and on the coast of Bangladesh were reported (Ali losses that would be incurred. The last step is to 1999) to be the following: (a) recurvature of tropi- estimate the adaptation cost that would have to cal cyclones in the Bay of Bengal; (b) a shallow be incurred to prevent these damages. The final continental shelf, especially in the eastern part of section of the chapter discusses the implications Bangladesh;17 (c) high tidal range;18 (d) the trian- of the analysis for prioritizing adaptation actions gular shape at the head of the Bay of Bengal;19 in the context of Bangladesh’s development and (e)almost sea-level geography of the Bangladesh climate change strategy. coastal land; and (f) the high density of popula- tion and coastal protection system. Historical Vulnerability Table 3.1 presents surge inundation character- to Tropical Cyclones and istics for cyclones of varying strength in Ban- gladesh as documented by the MCSP (1993). Storm Surges While historical (time series) records of storm surge height are scarce in Bangladesh, the exist- UNDP has identified Bangladesh as the most vul- ing literature suggests typical storm surge height nerable country in the world to tropical cyclones during severe cyclones is between 1.5 and 9.0 (UNDP 2004). Cyclones hit the coastal regions meters. Storm surge heights in excess of 10 m of Bangladesh almost every year, in early sum- are less common, but occasional references are in mer (April–May) or late rainy season (October– the literature.20 A surge can be even more devas- November). A severe cyclone strikes Bangladesh tating if it makes a landfall during high tide. In every three years on average (GoB 2009). Between general, it has been observed that the frequency 1877 and 1995, Bangladesh was hit by 154 of a wave (surge plus tide) along the Bangladesh cyclones, including 43 severe cyclonic storms, 43 coast with a height of about 10 meters is approxi- cyclonic storms, and 68 tropical depressions.16 mately once in 20 years, and the frequency of a Since 1995, five severe cyclones hit the Bangla- desh coast in May 1997, September 1997, May 17 A wide continental shelf, especially off the eastern part of Bangladesh, characterizes the coastline of Bangladesh. This 1998, November 2007, and May 2009. wide shelf amplifies the storm surges as the tangential sea-level wind-stress field associated with the tropical cyclone pushes the seawater from the deepwater side onto the shelf. Being pushed from the south by wind stress, the water has no place to go but upwards, which is the storm surge. 16 The Indian Meteorological Department (IMD) is responsible for tracking tropical storms and cyclones in South Asia, including the 18 Records from the Sandwip Channel indicate high tides of 7–8 m. Bay of Bengal. The IMD classifies tropical storms based on the 19 The triangular shape at the head of the Bay of Bengal helps to observed maximum sustained surface wind measured at a height funnel the seawater pushed by the wind toward the coast and of 10m and averaged over 3 minutes as follows: Super Cyclonic causes further amplification of the surge. Storm (greater than 220 km/hour), very severe cyclonic storm (119–220 km /hour), severe cyclonic storms (90–119 km/hour), 20 The 1876 Bakerganj cyclone had the highest reported surge cyclonic storms (60–90 km/hour), Deep depression (51–59 km/ height of 13.6 meters. More recently, the 1970 cyclone had a hour), Depression (32–50 km/hour) (IMD 2010). reported height of 10 meters (SMRC 2000).
  • 45.
    BA N GL A D E S H CO U N T RY ST U DY 19 Table 3.1 Typical storm surge characteristics for cyclones in Bangladesh Wind Velocity (km/hr) Storm Surge Height (m) Limit to inundation from the coast (km) 85 1.5 1.0 115 2.5 1.0 135 3.0 1.5 165 3.5 2.0 195 4.8 4.0 225 6.0 4.5 235 6.5 5.0 260 7.8 5.5 Source: MCSP, 1993 wave with a height of about 7 meters is approxi- workers. Residents have also complemented these mately once in 5 years (MCSP 1993). In addition public measures with private actions that reduce to these exceptional surges, waves caused by wind their own personal risks through the construction also occur; the dimensions depend on wind speed of cyclone-resistant housing and migrating fur- and direction, water depth, and duration of wind ther inland away from more vulnerable low-lying blowing over the bay. It has been observed that and coastal areas, when feasible.21 The rest of this wind-induced waves of up to 3.0 m in height may section contains a brief summary of the current occur under unfavorable conditions in the coastal status of these adaptation measures. regions (MCSP 1993). Embankments: Bangladesh started a program to create polders through the construction of Adaptation Measures embankments around 1960. Currently there are Currently in Place 123 polders formed by 5,017 km of embank- ments, of which 957 km enclose 49 sea-facing polders, and the remaining 4,060 embankments Faced with a significant chronic risk from storm enclose 74 interior polders. These embankments surges induced by cyclones, the government of protect around 1.5 million ha of land, of which Bangladesh—with the support of its development 0.8 million ha is cultivable land. Drainage is facili- partners—has put in place both a set of risk miti- tated by 1,347 regulators and 5,932 km of drain- gation measures as well as a disaster preparedness age channels. Figure 3.1 shows the location of the program. These include structural risk mitigation existing polders. They have protected the densely measures, such as the construction of polders, populated coastal areas of Bangladesh. No pol- cyclone shelters, and cyclone-resistant infrastruc- ders are currently in place in areas that are less ture; and non-structural measures, such as an early populated and where there is limited economic warning dissemination system, education, and activity, including the Sundarbans and the numer- raising awareness among residents and stakehold- ous small islands. The Bangladesh Water Devel- ers. Toward better preparation for the unavoid- opment Board (BWDB) maintains an extensive able disasters, the government has also developed 21 Unlike most other countries, the population growth rate in community-based disaster preparedness plans, coastal areas of Bangladesh is smaller than the national average, including training of relevant community indicating slower net migration to these areas.
  • 46.
    20 E C O N O M I C S O F A D A P TAT I O N T O C L I M AT E C H A N G E Figure 3.1 Location of coastal polders in Bangladesh Source: CDMP database of coastal polders, which includes infor- Experts at BWDB, IWM, and CEGIS indicated mation on the length, location, construction year, four reasons for breached embankments during and cost of each polder. 22 past cyclones: While embankments have effectively protected pol- a) Overtopping is the most important factor for ders against storm surges during most cyclones, some embankment collapse. Rapid and deep scours of the embankments have been breached, particu- form on the country side slope of the embank- larly during the more severe cyclones. For instance, ment after it has been overtopped. The pro- a large section of the Patenga embankment was cess rapidly weakens the structure and leads washed away during the 1991 cyclone, and some to its collapse. inland embankments breached during Cyclone Sidr in 2007. Some embankments even breached during b) Toe erosion is another major reason for weak- the mid-size Cyclone Aila in 2009. ening of an embankment. Regular tidal wave action and occasional cyclone-related water 22 In addition, information on riverbank and shoreline protection surge exerts tremendous hydrological load and re-sectioning of embankment works has been extracted on the embankments, causing damage to the from the Coastal Embankment Rehabilitation Project (CERP) and South-Eastern Zone-Chittagong, South-Western Zone- structure, thus weakening them and making Faridpur, and Southern zone-Barishal maintained by the BWDB. them prone to collapse. It includes information on the ongoing projects, construction period, and cost.
  • 47.
    BA N GL A D E S H CO U N T RY ST U DY 21 c) Slope Erosion from natural causes such as pre- and evacuation system that has saved thousands cipitation, piping action, poor design (e.g. of lives during recent cyclones. The system is a insufficient setback), substandard construc- partnership between civil society organizations, tion, inadequate compaction, and activities of the private sector, and multiple levels of govern- rats and earthworms has been another factor ment. The Bangladesh Meteorological Depart- resulting in damaged embankments.23 ment tracks tropical storms in close collaboration with other regional organizations and issues alerts d) Inadequate O&M has also been responsible for of impending cyclone and storm surges for dif- the collapse of some embankments. Shortage ferent geographic areas. Newspapers, television of resources has restricted even routine O&M channels, and radio stations broadcast the warn- of existing embankments, making them ings, and the local government administration weaker and susceptible to collapse. and the local Cyclone Preparedness Program (CPP) volunteers run by the Red Crescent Society Foreshore Afforestation: Foreshore afforesta- lead the evacuation. tion has proven to be a cost effective method to dissipate wave energy and reduce the hydraulic The Current Cyclone Preparedness Program cov- load on embankments during storm surges. This ers 32 of 51 upazilas/thanas that are exposed to was evident during the 1991, 2007(Sidr), and cyclones and storm surges. This subset of upazil- 2009 (Aila) cyclones. The virtual absence of man- las faces a combination of cyclone risk, salinity, grove forests in Chokoria and surrounding areas and tidal water movement above critical levels resulted in large damages to property and loss of (Islam et al 2006) Recently these efforts have lives in 1991 (BCAS 1992). In contrast, even scat- been decentralized, including the establishment tered and unplanned forestation on the foreshore of a forward operation center with a govern- of embankments affected by the 2007 Cyclone ment-appointed commander in chief to oversee Sidr substantially broke the storm surge velocity, relief and early recovery operations. Coordina- reducing damages and losses (GoB 2008). tion of relief operations at the local, regional, and national levels has been greatly enhanced Officials from the Department of Forests, GoB, through (a) the use of high frequency (HF) trans- and experts from the Institute of Water Modeling ceiver radios for long-distance communication (IWM) have recommended planting mangrove between Dhaka headquarters and field stations; forests with a minimum width of 500 meters as (b) very high frequency (VHF) transceiver radios a cost-effective method to protect embankments for short-distance communication between field in front of sea-facing polders. Currently, approxi- stations and substations located at union/isolated mately 60 km of the total 957 km of embank- islands; and (c) cell phones as an emergency com- ments along sea facing polders are protected by munications system. By locating the coordination mangrove forests. These include some forest belts of these operations closer to the affected popula- that are degraded. tion, the decentralization of relief operations has improved their timeliness and effectiveness, as Early Warning and Evacuation System: Ban- evidenced during Cyclone Sidr. gladesh has put in place an effective early warning Pre-positioning of emergency relief materials and life-saving drugs and medical supplies played an 23 Sometimes, local people have cut the embankments to let saline water in for their shrimp farms located behind the embankments. increasingly important role in quickly initiating Even after repair, the section remains weak and vulnerable to relief and rehabilitation activities during Sidr. For breaching. Prevention entails improved institutions and gover- nance that are compatible with local needs. example, detailed and written instruction exists
  • 48.
    22 E C O N O M I C S O F A D A P TAT I O N T O C L I M AT E C H A N G E regarding what relief materials and medical sup- with the capacity to serve 2.8 million people, or plies to preposition in and around possible storm- 7.3 percent of the coastal population.24 These are surge-impacted areas. Before the landfall of Sidr, essentially brick buildings on concrete stilts. An national and international NGOs pre-positioned additional 924 schools constructed under Primary staff and relief materials closer to the forecasted Education Development Programme, Phase II impact areas. This action had a strong positive (PEDP-II) with open ground floor structures have impact, as access to hard-hit places became quite also been used as shelters, even though they are difficult and pre-positioned staff along with relief not suitable as shelters.25 materials were already on the field to start relief operations shortly after the cyclone was over. Figure 3.2 shows the location of existing cyclone shelters. The shelter construction program has While the effectiveness of the EWES has been reactive, with construction following the improved over the years, consultations with occurrence of major disasters.26 The east coast experts indicate scope for improvement in three (Noakhali, Chittagong, Cox’s Bazar, and Feni) areas: (1) geographic precision of warnings, (2) has a greater concentration of shelters than the communication of warnings in local dialects to west coast. increase reach, and (3) greater awareness about the importance of timely evacuation. BMD alerts The government has an active program to con- for impending cyclones currently cover a large struct additional cyclone shelters. While reli- section of the coastal zone, due to the limited geo- able estimates of the number of shelters under graphic precision with which storm forecasts can construction or being planned are not available be made. Repeated evacuations in areas that ulti- because of the multitude of government agencies mately do not experience a storm lead to a grad- and NGOs undertaking this effort, they are likely ual erosion of faith in the early warning system. to be in the thousands eventually.27 The consensus Improved precision in forecasting, especially in among experts in these institutions and the rel- the landfall location and location-specific inunda- evant government agencies is that an additional tion depth, is currently feasible and can enhance 2,000–2,500 cyclone shelters need to be built. the effectiveness of the EWES. Additionally, Red The attractiveness of investing in multi-purpose Crescent Society officials, CPP volunteers, and cyclone shelters is partly due to the immediate and residents of major cyclone-affected areas indi- ongoing benefits that they provide as a primary cated the importance of broadcasting warnings school or office. The newer designs are starting to in resident-friendly local dialects to ensure timely accommodate user concerns with the inclusion of evacuations. Finally, the CPP volunteers and resi- dents of cyclone-affected areas noted higher fatal- 24 Cyclone shelters built in the early 1970s were designed to shelter ity rates among residents that ignored/resisted/ people from cyclones but were later also used for other purposes delayed evacuation and stressed the importance such as primary schools. An additional 262 shelters are not usable and 88 have been washed away, destroyed, or dismantled. of raising awareness about the importance of 25 Data and information on existing cyclone shelters are from the timely evacuation. IWM and CEGIS, compiled from the Public Works Depart- ment (PWD), LGED, Education Engineering Department, Red Crescent Society, donor agencies, NGOs, and local experts. Cyclone Shelters: Cyclone shelters have pro- 26 Cyclone shelters were built in Bhola and Potuakhali after the tected human lives and livestock in the coastal 1970 cyclone; in Anwara, Banshkhali, and Cox’s Bazar after the 1991 cyclone; and in the southwest region after the 2007 cyclone. region of Bangladesh during past cyclones, 27 ADB, with support from other development partners, is building including Cyclone Sidr, when 15 percent of the 398 cyclone shelters for completion by June 2011. The World affected population took refuge in shelters (GoB Bank is currently constructing 50 shelters, along with 30 killas. The Islamic Development Bank is reviewing proposals to con- 2008). There are currently 2,591 usable shelters struct another 800 cyclone shelters.
  • 49.
    BA N GL A D E S H CO U N T RY ST U DY 23 Figure 3.2 Location of cyclone shelters in coastal areas Source: CDMP elevated space for livestock and overhead water interviews with residents of cyclone-affected storage, making them potentially more effective. areas revealed that willingness to use shelters dur- The cost of constructing a multipurpose shelter ing an emergency would increase if shelters (a) varies with its capacity and its non-emergency were easier to access, (b) were located closer to purpose and usage. For instance, multipurpose residents’ homes, (c) were less crowded, (d) had shelters under construction in a World Bank separate facilities for women, (e) had facilities for project in the aftermath of Cyclone Sidr have a people with disabilities, (f) had sanitation facilities capacity to accommodate 1,600 people and are above the ground floor, and (g) had facilities to expected to cost $214,000, or about $134/person protect livestock.28 accommodated. 28 Shelters with separate facilities for women (35 percent); facilities CEGIS (2004) examined the effectiveness of for people with disabilities (less than 5 percent); sanitation facili- ties (5 percent), facilities to protect livestock (20 percent), facilities cyclone shelters in saving lives. Focus group with only ground floor toilets (1,000).
  • 50.
    24 E C O N O M I C S O F A D A P TAT I O N T O C L I M AT E C H A N G E Figure 3.3 Population density in coastal areas in relation to areas of inundation risk Source: CEGIS The number of cyclone shelters needed in an area residents prefer to reside in pucca houses partly to depends on the population and housing charac- reduce their own risk. A review of Census data teristics of the area. While pucca houses (brick and from coastal areas indicates that nearly all fami- concrete) can structurally withstand most of the lies with an annual income level of $470 live in wind damages from the average severe cyclone, pucca houses. Significant increases in income lev- they provide no remedy for inundation from els expected over the next few decades should storm surges. Pucca houses can effectively substitute result in an increasing proportion of residents liv- for cyclone shelters in areas with inundation depth ing in pucca houses and decreasing the need for of less than 1 meter. In contrast, cyclone shelters cyclone shelters. Nevertheless, the need for shel- are necessary to protect inhabitants living in single ters will remain for residents residing in single- story dwellings that can potentially be exposed to story houses in areas with projected inundation inundation depths in excess of 3 meters. depth that exceeds 3 meters. Cyclone Resistant Housing: During past Inland Migration: Finally, unlike most other severe cyclones, thatched and kachha houses have countries, households and economic activity often been completely damaged. In contrast, have accounted for the increased perceived risk pucca houses have remained structurally intact, from storm surges by locating themselves further primarily incurring damages to the plaster on the inland as evidenced by the slower rate of growth exterior walls and the contents within. Coastal in the coastal population compared to the rest
  • 51.
    BA N GL A D E S H CO U N T RY ST U DY 25 Table 3.2 Economic indicators Bangladesh: Current and 2050 Current Indicators Indicators in 2050 Indicator Value Year Source/comments Value Source/comments Population (million) 130 2001 BBS 228 BBS Population average 1.58 1991-01 State of the Coast, 1.15% BBS & State of the Coast, 2006 annual growth rate 2006 (replacement fertility in 2021) Coastal population 35 2003 State of the Coast, 58 BBS & State of the Coast, 2006 (million) 2006 Coastal population 1.36% 1991-01 State of the Coast, 1.05% BBS & State of the Coast, 2006 average annual growth 2006 rate GDP (billions of con- $75 2007 WDI 2009 $1,614 Projected with growth rates in the stant 2009 USD) following row. GDP avg. annual 5.9% 2001-09 Ministry of Finance 7.5% Various government growth rate announcements Per capita GDP (con- $470 2007 WDI 2009 $6,395 Implied stant 2009 USD) Road length (km) 272,487 2007 BBS 340,609 Assumed 25% expansion Share of paved roads 30% 2007 BBS 100% Assumed Primary school net 91% 2007 Ministry of 100% WDI 2009, average level in com- enrollment rate Education parator countries * Secondary school gross 43% 2007 Ministry of 70% WDI 2009, average level in com- enrollment rate Education parator countries * Per capita electricity 150 2007 BBS 3000 WDI 2009, average level in com- consumption (KWh) parator countries * Share of pucca houses 2.23% 2001 BBS 98% current housing characteristics in in rural areas Bangladesh by income level Rice production 27 2006 BBS 75 Yu et al, 2010, existing climate (million metric tons) variability scenario Notes: Current per capita GDP in comparator countries: Brazil($5,860), Malaysia($6,420), Lebanon($5,800), and Uruguay($6,390). Source : World Development Indicators, World Bank of the country. It can also be observed from the change against the counterfactual baseline scenario population density maps, which shows increasing that does not include climate change. The analysis density further inland (Figure 3.3). 29 is based on simulating average severe cyclones with a ten-year return period, which enables a more pre- cise definition of the baseline scenario. This choice Estimating Potential Damage also results in a more conservative estimate of dam- and Adaptation Cost ages and costs as it ignores the more intense but less frequent storms that may occur during this period. The potential damages and the cost of adaptation The additional potential damage from storm surges are determined separately for each scenario in the and the cost of adaptation in 2050 are determined following 5-steps: (1) demarcate inundation risk by comparing the damages and costs under climate exposure zones from storm surges; (2) identify assets and activities exposed to inundation risk; (3) deter- 29 The inundation zones computed in the next sections for the mine assets and activities affected in a single cyclone; baseline and climate change scenario are also shown. (4) estimate potential damage and loss from a single
  • 52.
    26 E C O N O M I C S O F A D A P TAT I O N T O C L I M AT E C H A N G E cyclone; and (5) estimate adaptation measures and historical levels due to climate change. Future costs necessary to mitigate inundation risk. storms tracks cannot be predicted with any degree of precision. Cyclone-related risks under the cli- Economic Development Baseline: Both assess- mate change scenario are developed collectively ments are completed under a common projected by simulating a set of five storms that span the development baseline that builds on recent economic entire Bangladesh coastline (see Annex 2). Simula- trends and extends them to 2050 based on normal tions of the 1974, 1988, 1991, and 2007 cyclones economic development patterns. Table 3.2 summa- indicated that these cyclones adequately cover the rizes the key changes in the Bangladesh economy Sunderban coast, southwestern coat (Sunderban between now and 2050, which includes 53 percent to Patuakhali), the Bhola and Noakhali coast in more people, more than a twenty-fold increase in the Meghna Estuary, and the eastern coast (Shita- GDP, and decreased dependence on agriculture. kunda to Bashkhali). In addition, a fifth hypothet- The people of Bangladesh are expected to be nearly ical track was simulated to cover the remaining ten times richer, consuming twenty times more elec- Sandwip coast and the part of the Noakhali and tricity per person, living in pucca houses, and enroll- Chittagong coasts at the central region of the ing all primary-aged children in schools. Meghna Estuary. The inundation risk exposure for the climate change scenario is developed from Inundation risk exposure zones simulations combining these five cyclones with Inundation risk exposure in an area is character- the Bay of Bengal hydrodynamic model. Each ized by the maximum potential inundation depth of the simulations is based on the following three that may occur for any of the simulated storms assumptions about the increasing intensity of an under a scenario. Two scenarios are developed: (1) average 10-year return period cyclone brought a climate change scenario, and (2) a baseline sce- about by climate change by 2050. nario that is used as a counterfactual to determine additional risk exposure due to climate change. ■■ A rise in sea level of 27cm (UK DEFRA 2007). ■■ An increase in wind speed by 10 percent rela- Baseline Risk Scenario: The 19 cyclones that tive to Cyclone SIDR. made landfall in Bangladesh between 1960 and ■■ Landfall occurs during high tide.30 2009 collectively define the current cyclone- related risks in Bangladesh. Detailed information Inundation risk exposure for each scenario is about each of these historical cyclone tracks is determined in three steps. First, the extent and available in Annex 1. These storms on average depth of inundation associated with each cyclone have a return period of 10 years and span the (nineteen for the baseline and eight for the cli- entire coastal region of Bangladesh. The baseline mate change scenario) is determined based on inundation risk exposure is developed from simu- simulations using the cyclone model and the two- lations combining these 19 historical cyclones dimensional Bay of Bengal model.31 (A detailed with their corresponding observed wind and pres- description of the model is provided in Annex sure fields with the Bay of Bengal hydrodynamic model. This scenario is the counterfactual against 30 Since scientific evidence to date points toward an increase in the which future climate change risk is measured, but frequency of intense cyclones in the Bay of Bengal, the prob- is also useful to assess the current inundation risk ability of a potential landfall during high tide will also increase. that Bangladesh faces. 31 The Bay of Bengal model is a hydrodynamic model based on the Mike 21 hydrodynamic modeling system. Its domain covers the coastal region of Bangladesh up to Chandpur and the Bay of Climate Change Risk Scenario: Storm-surge- Bengal up to 16º latitude. It was recently updated and upgraded under the Comprehensive Disaster Management Program related risk is expected to increase from these (CDMP) of Bangladesh (UK DEFRA 2007).
  • 53.
    BA N GL A D E S H CO U N T RY ST U DY 27 Figure 3.4 Inundation risk exposure map—baseline scenario 1.) Second, for each grid point, the inundation scenarios respectively. They do not show inundation depth results from each of the cyclone simula- levels for a single cyclone, rather they indicate the tions for the scenario are combined together to largest inundation risks from any of the simulated determine the highest inundation depth for all cyclones. So, the baseline scenario map shown in simulated cyclones under that scenario. All of Figure 3.4 reflects the largest inundation risk that a the simulations are based on the existing set of specific location has faced since 1960. coastal protection infrastructures (embankments, and polders). Finally, for the subsequent eco- The inundation risk exposures under the two sce- nomic analysis, risk exposure zones are formed by narios are summarized in Table 3.3. Under the grouping grid points into one of three inundation baseline scenario, inundation depth is greater levels (0–1 m, 1–3 m, and more then 3m). than 1 meter under at least one of the cyclone tracks for 20,876 square kilometers of land, and Figure 3.4and Figure 3.5 show the inundation risk is greater than 3 meters for 10,163 square kilo- exposure map of Bangladesh, as measured by the meters. Under the climate change scenario, the potential maximum inundation depths from the sim- inundation depth increases for areas already ulations, under the baseline and the climate change inundated in the baseline scenario. In addition,
  • 54.
    28 E C O N O M I C S O F A D A P TAT I O N T O C L I M AT E C H A N G E Figure 3.5 Inundation risk exposure map—climate change scenario areas further inland become inundated. The net and activities map using geographic information result is an increase of 14 percent in the areas system (GIS) software to determine the assets inundated by more than 1 meter and an increase and activities that are exposed to inundation risk of 69 percent in the areas inundated by more under each scenario. than 3 meters. The assets and activities considered for the Assets and activities exposed to analysis include housing (by building material inundation risk type), education institutions, growth centers, The current spatial distribution of assets and mills/ factories (large scale), national highways, activities provides the starting point for identifying regional highways, feeder roads (type A), feeder assets and activities that are exposed to inundation roads (type B), bridges, power plants, power risk in 2050. Expected changes in the Bangladesh transmission lines, deep tubewells, mosques, economy—including growth in population and temples, historical places and tourist destina- income and structural shifts in the economy—are tions, land by crop suitability, and population by applied uniformly to project the expected assets socioeconomic status. and activities in 2050 (see Table 3.2). The inun- dation exposure risk zones for the baseline and The best available spatially disaggregated maps climate change scenarios are overlaid on the asset and data for these activities are available from
  • 55.
    BA N GL A D E S H CO U N T RY ST U DY 29 Table 3.3 Potential Inundation Risk Exposure Area (sq km) Inundation Risk Exposure (Depth) Baseline Scenario Climate Change Scenario Percent Change More than 1 m 20,876 23,764 + 14% More than 3 m 10,163 17,193 + 69% Table 3.4 Population exposed to inundation risk (million) Baseline Baseline Percent Change Climate Change Percent Change Inundation Risk Exposure Scenario Scenario between Scenario 2050 between (Depth) 2007 (a) 2050 (b) (a) and (b) (c) (b) and (c) More than 1 m 18.5 28.3 + 53% 35.3 +25% More than 3 m 8.9 13.5 +53% 22.6 +67% Table 3.5 Road exposed to inundation risk (km) Baseline Baseline Percent Change Climate Percent Change Inundation Risk Exposure Scenario Scenario between Change Scenar- between (Depth) 2007 (a) 2050 (b) (a) and (b) io 2050 (c) (b) and (c) 0 -1 m 3,198 3,988 + 25% 10,466 +162% More than 1 m 7,177 8,972 +25% 10,553 +18% All inundated 10,375 12,969 +25% 21,019 +62% various public sources, including Bangladesh Rail- Under the baseline scenario, of the 35 million ways, the Bangladesh Water Development Board, coastal residents in 2007, nearly half are exposed the Local Government Engineering Department to inundation risk depth of more than 1 meter (LGED), the Center for Environmental and and about a quarter are exposed to inundation Geographic Information Services (CEGIS), the risk of over 3 meters (Table 3.4). Expected popula- Public Works Department, the Roads and High- tion growth between 2007 and 2050 increases the ways Department, the Water Resources Planning number of exposed people by 53 percent within Organization, and the World Bank. each risk zone. With the additional risk of inun- dation under the climate change scenario, about The assets and activities exposed in each inun- 35 million coastal residents are exposed to inun- dation risk zone are determined using one of dation of more than 1 meter; nearly two-thirds of three methods. For most assets, such as schools, them are exposed to inundation of more than 3 the exposure estimate is a count of the number meters. In the absence of added protective mea- of assets located in that risk zone. For assets with sures, the combined effects of population growth a large spatial extent, the exposure estimate is and climate change nearly doubles the population measured by the spatial extent (land surface and exposed to inundation risk of more than 1 meter, agriculture extent in square kilometers, roads and increases those at risk of inundation of more and railways in kilometers). Finally, the exposed than 3 meters by two-and-a half times by 2050. population count is estimated at the thana level, which is the lowest administrative unit, using the Similarly, under the baseline scenario, of over population density and the total area that falls 272,487 kilometers of roads in Bangladesh in 2007, into each risk zone. The total exposed popula- about 4 percent are exposed to inundation risk, of tion count is the sum of the exposed population which about 70 percent are exposed to inundation across thanas. risk of more than 1 meter (Table 3.5) Bangladesh
  • 56.
    30 E C O N O M I C S O F A D A P TAT I O N T O C L I M AT E C H A N G E Figure 3.6 Population under povery in relation to inundation risk Source: CEGIS already has one of the highest road densities in the and are discussed separately in detail in the next world and there is limited room for expansion of section as part of the damage estimation. While the road network. The road network is assumed to the method remains the same, there are signifi- expand by 25 percent between now and 2050 or cant differences in the growth rate of assets and about 0.5 percent per year, with most of the effort activities between 2007 and 2050. Additionally, expended on strengthening the existing roads by in cases when detailed spatial data was not avail- paving and or raising them. With the additional able for a specific asset, the additional risk due risk of inundation under the climate change sce- to climate change is based on changes in the nario, over 21,000 km of roads are exposed to exposed population (housing, power consump- inundation, of which about half are exposed to tion) or changes in the inundation risk area inundation of more than 1 meter. In the absence (power infrastructure). of added protective measures, the combined effects of expansion in the road network and climate Assets and activities potentially change nearly doubles the roads exposed to inun- affected during a single storm dation risk by 2050. The largest inundation risks Without additional risk mitigation measures, also occurs in areas which have the largest share of affected assets and activities can be damaged if the poor under both scenarios (Figure 3.6) they are in the path of a storm. The assets and activities affected in a single storm depend on The other assets and activities exposed to inun- the areal extent of the storm. The average severe dation risk are determined in a similar manner, cyclone with a 10-year period under the baseline
  • 57.
    BA N GL A D E S H CO U N T RY ST U DY 31 Table 3.6 Area affected in a single cyclone with a 10-year return period (sq km) Inundation Risk Exposure (Depth) Baseline Scenario Climate Change Scenario Percent Change More than 1 m 5,428 10,219 + 88% More than 3 m 2,642 7,393 + 180% Table 3.7 Population affected in a single cyclone with a 10-year return period (millions) Baseline Baseline Percent Change Climate Change Percent Change Inundation Risk Exposure Scenario Scenario between Scenario 2050 between (Depth) 2007 (a) 2050 (b) (a) and (b) (c) (b) and (c) More than 1 m 4.8 7.4 + 53% 15.2 +107% More than 3 m 2.3 3.5 +53% 9.7 +177% Table 3.8 Roads affected in a single cyclone with a 10-year return period (km) Baseline Percent Change Climate Change Percent Change Inundation Risk Exposure Sidr Scenario between Scenario 2050 between (Depth) 2007* (a) 2050 (b) (a) and (b) (c) (b) and (c) 0 -1 m* 6,361 1,039 n/a 4,500 +333% More than 1 m* 1,714 2,333 n/a 4,538 + 95% All inundated 8,075 3,372 n/a 9,038 +168% * The affected roads for Sidr and the baseline scenario are not directly comparable. For Sidr 2007, the affected roads categories reported are partially damaged and fully damaged roads instead of inundation depth. scenario affects 26 percent of the exposed area.32 activities within each sector that are exposed In contrast, 43 percent of the exposed area is and affected can be significantly different than affected by the more intense cyclones under the the mix of roads that are damaged. For instance, climate change scenario. The combined effects in the case of roads, unpaved roads accounted of the larger inundation risk exposed area and for nearly 78 percent of the total kilometers of the increased aeral extent during a single storm damaged roads during Cyclone Sidr. They can increases the areas inundated more than 1 meter be damaged by even low levels of inundation by 88 percent and areas inundated more than 3 (Table 3.8). meters by 180 percent (Table 3.6). Potential damage and loss Similarly, the potential affected population liv- during a single cyclone ing in these respective areas increases by 107 Potential damages and losses in each of the major percent and 177 percent respectively (Table economic sectors resulting from induced storm 3.7). The other assets and activities affected in surges from a single-cyclonic event are computed a single storm also depend on the areal extent for the baseline and the climate change scenarios. of the storm. However, the mix of assets and They are determined by applying sector-specific damage and loss functions to the affected assets 32 The extent of inundation includes areas with inundation depth and activities in the sector. of 1 m or more.
  • 58.
    32 E C O N O M I C S O F A D A P TAT I O N T O C L I M AT E C H A N G E Table 3.9 Damages and losses during a single Super cyclonic storm by economic sector Damages & Loss Economic Sector Damages and Losses (Cyclone Sidr) (Average Severe Cyclone) (Current (Constant 2009 Share of (Constant Million USD) Million USD) total (%) 2009 Million USD) Housing 839 978 50 900 Agriculture 438 510 26 469 Transport 141 164 8 151 Water Resource Control 71 83 4 83 Education Infrastructure 69 80 4 73 Industry/ Commerce/ 52 61 3 56 Tourism Urban and municipal 25 29 2 27 Power 14 16 1 15 Other 26 30 2 28 Total Damages and Losses 1,675 1,952 100 1,802 Share of GDP 2.6% 2.4% The major economic sectors impacted are limited and injury rates are also developed from the deaths to those that incurred damages and losses dur- and injuries resulting from Sidr. Damages include ing Cyclone Sidr in 2007, the most devastating complete or partial destruction inflicted on assets cyclone in the recent past. Table 3.9 summarizes (assets not portable as well as stock). Losses refer the damages and losses by sector during Cyclone to the flows of goods and services that are not pro- Sidr. Damages and losses from this single event duced or rendered due to a disaster. Losses also accounted for 2.6 percent of GDP. Sidr was an include disaster-induced cost increases incurred above-average cyclone with a 10-year return in continuing essential services. period. The damages from an average cyclone with the same return period would actually be Human Casualty and Injury: Approximately lower.33 Scaling the damages down to reflect the 3.45 million coastal inhabitants of Bangladesh smaller areal extent of an average cyclone indi- were exposed to storm-surge-related inundation cates that if an average cyclone with a 10-year during Sidr in 2007. Post-disaster assessments indi- return period were to strike the Bangladesh coast cate 3,406 human casualties, or a casualty rate of today, the expected damages and losses would 1per thousand exposed and 55,282 injuries, or an be about 2.4 percent of GDP. Nearly half of the injury rate of 16 per thousand exposed. Although damages and losses would occur in housing, fol- cyclone shelters saved thousands of lives, focus lowed by agriculture and transport. group interviews with the residents of cyclone- affected areas revealed that a large section of pop- Damage and loss functions for each of the above ulation was reluctant to move to cyclone shelters sectors are developed from the damages incurred even during an emergency.34 Casualty and injury during Sidr, when available. In addition, fatality 34 Distance from the homestead, difficult access to shelters, 33 Cyclone Sidr (wind speed of 223 km / hour) has a return period unwillingness to leave livestock behind unprotected, scarcity of of 10 years based on the 21 major cyclone events from 1960 to sanitation facilities, lack of user friendly facilities for women, 2009 in Bangladesh. Its areal extent was 8.7 percent larger than overcrowding condition in shelters are the primary reasons the average cyclone with a 10-year return period. behind their reluctance.
  • 59.
    BA N GL A D E S H CO U N T RY ST U DY 33 rates can be expected to decline as cyclone-resilient more could afford a “pucca” house. By 2050, rising pucca houses become affordable for an increasing income levels will enable approximately 98 percent proportion of coastal residents and if user-friendly of households to afford a “pucca” house. As a result, shelter designs encourage higher usage rates. most of the housing damage in 2050 is from dam- ages to the contents within the houses. The average The exposed population is expected to rise to “pucca” dwelling in Bangladesh in 2050 is assumed 5.34 million in 2050 under the baseline scenario to remain at the current size of 400 sq feet in size due to the expected growth in the coastal popula- with 2,000 sq feet of brick wall surface. Household tion and further increase to 10.04 million due to assets in 2050 are estimated to be approximately the increase in the affected area. If there are no $2,143 (Tk 150,000). If 50 percent of the walls changes in the human casualty and injury rates, require replastering at a cost of $0.0714 per sq the upper bound estimates are 4,637 addi- ft (Tk 10/sq ft) and 50 percent of the household tional human casualties and 75,268 addi- assets are damaged due to inundation, the dam- tional injuries due to climate change.35 ages per affected house will be $1,214. Housing: The housing sector accounted for about Under the baseline scenario, 28.7 million peo- half of the damages and losses from Cyclone Sidr. ple are exposed to inundation risk greater than Almost all of the damages occurred in “Semi- 1 meter in 2050.40 An additional 7.08 million pucca”36 houses, “kacha”37 houses, and “jhupris”38. inhabitants (or 1.45 million houses41) are exposed In contrast, “pucca” houses, constructed with brick to this same level of risk under the climate change walls and a concrete roof, remained structurally scenario. Accounting for the larger areal extent intact, sustaining minimal damages requiring of a cyclone under the climate change scenario, replastering of walls. Analysis of the 2001 Ban- an additional 1.6 million houses are projected to gladesh census indicates that households increas- be damaged due to climate change. The total ingly move to “pucca” houses as their incomes rise. additional housing damages in 2050 due The projected increase in per capita incomes by to climate change consists of $229 million 2050 is expected to alter the mix of housing types for re-plastering damaged houses and in Bangladesh, resulting in a significant reduction $1,718 million in content damage, for a in housing damage, but also a substantial increase total of $1,947 million. in household asset damages. Education infrastructure: Damaged primary In 2001 only 2.23 percent of rural households school facilities accounted for over 95 percent of with an annual per capita income of $47039 or the education sector damages from Cyclone Sidr. With the mandate for universal primary educa- 35 Estimated human casualties in 2050 under the baseline and tion and gross primary school enrollment rates climate change scenarios are 5,274 and 9,911 respectively. The corresponding number of injuries are 85,609 and 160,877 of 90 percent, there are many more primary respectively. schools that are at risk of inundation and dam- 36 Typical characteristics of semi-pucca housing are: foundation age. As per capita incomes rise, school enrollment made of earthen plinth or brick and concrete, walls made of bamboo mats, CI sheet and roof made of CI sheet with timber rates are expected to increase at all levels of edu- framing. cation, resulting in a corresponding increase in 37 Typical characteristics of kacha housing are: foundation made from earthen plinth with bamboo, walls made of organic materi- the number of educational institutions. By 2050, als, and roof thatched made of straw, split bamboo etc. 38 Typical characteristics of jhupris are: ceiling less than four feet, 40 Inundation depth of less than 1m is assumed to have a negligible cheap construction materials such as straw, bamboo, grass, leaves, impact on houses in 2050. polythene, gunny bags, etc. 41 The average household size is assumed to be 4.89, unchanged 39 Monthly income Taka 2,750 per capita. from current levels.
  • 60.
    34 E C O N O M I C S O F A D A P TAT I O N T O C L I M AT E C H A N G E Table 3.10 Cropped area exposed average contents are expected to rise to $2,857 to inundation risk in the baseline (Tk 200,000). If 50 percent of the walls in affected and climate change scenarios (ha) schools are damaged and require replastering and Baseline Climate Change 50 percent of its contents are damaged, average Scenario 2050 Scenario 2050 Percent Crop (hectares) (hectares) Change damages per affected school are $1,851. When Aman 1,092,645 1,305,028 +19 additional losses to provide interim facilities dur- ing reconstruction of 9.6 percent are included, the Aus 526,040 618,897 +18 total damage and loss per school is $2,029. The Boro 272,768 388,828 +43 total additional education sector dam- ages and losses in 2050 under the climate secondary school enrollment rates are expected to change scenario consist of $9 million in rise from the current 43 percent to 70 percent by damages requiring replastering of walls 2050, while primary school enrollment is expected and replacing contents and $1 million in to increase to 100 percent. The combined effects losses for interim facilities. of population growth, a changing age structure, and higher school enrollment rates are expected Agriculture: Crop losses accounted for nearly 95 to increase by over 1 million the number of percent of agriculture sector damages and losses exposed school students (0.63 million in primary during Cyclone Sidr. Damage and loss to fisher- schools and 0.43 million in secondary schools)42. ies and livestock were much smaller. Crop losses Climate change is expected to further increase the from a specific cyclone vary based on the season it number of exposed primary school students by strikes. The cropping calendar, planting/harvest- 0.46 million (in 2,283 primary schools) and sec- ing dates, of the major rice crops Aman, Aus, and ondary school students by 0.31 million (in 2,086 Boro are different.44 Bangladesh is twice as likely primary school equivalents43). Accounting for the to be hit by a tropical cyclone during the post- larger areal extent of a cyclone under the climate monsoon season as during the pre-monsoon sea- change scenario, an additional 4,840 primary son. The expected crop damage estimates from school (equivalents) are expected to be damaged a cyclone is the probability-weighted crop dam- due to climate change. ages from cyclones that occur during different seasons. The standard size specification for a primary school in Bangladesh enrolling 200 students is Crop losses resulting from a cyclone are deter- approximately 160 sqm (LGED). By 2050, its mined in detail for the three main rice crops. Non-cereal crop losses are estimated based on the crop loses for these rice crops. 42 These estimates are based on the following assumptions: (a) Bangladesh will attain 100 percent enrollment in primary schools and 70 percent enrollment in secondary schools by 2050. These Table 3.10 shows the cropped area that is exposed are the current school enrollment rates in comparator countries (Brazil, Lebanon, Malaysia, Uruguay) with current per capita to inundation risk under the baseline and climate incomes similar to that projected for Bangladesh in 2050; (b) ratio of primary school-age and secondary school-age children change scenarios for the three rice crops. The enrolled in school to total population will be 6.45 percent and exposed area increases by twice as much for the 4.42 percent respectively by 2050, (c) the standard capacity of a primary school is 200 students and a similar size school can boro crop than for the aman and aus crops. The accommodate up to 150 secondary students in Bangladesh. larger areal extent of a storm under the climate 43 Cost of constructing a secondary school is estimated from the change scenario implies that the affected areas in a costs of primary schools. Secondary schools are typically are larger and enroll more students than a primary school. However, the space required per secondary school pupil is about 33 percent larger. A primary school equivalent normalizes for this larger 44 Aman grows in the monsoon season, Aus grows in pre-monsoon, space requirement. and Boro grows in the post-monsoon season.
  • 61.
    BA N GL A D E S H CO U N T RY ST U DY 35 cyclone for aman, aus, and boro will increase by 98 in the economy associated with rising income lev- percent, 94 percent, and 136 percent respectively. els in 2050 are expected to increase the contri- bution of these sectors to the economy by 2050, By 2050, the agriculture sector is expected to accounting for an additional 9 percent of GDP, or grow at an annual average growth rate of 2.4 per- a total of 91 percent of GDP.46 Under the base- cent, largely through increases in yields (Yu et al. line scenario, higher GDP levels combined with 2010). As a result, by 2050, yields for aman, aus, increased shares of the non-agricultural produc- and boro are expected to rise to 5.5, 4.7 and 9.5 tive sectors in the economy in 2050 result in total mt/ha respectively. If 50 percent of the affected damages of $96 million and losses of $1,237 mil- crops are lost, at a price of $676 per metric ton, lion. The increased risk due to climate change the expected crop losses for the three rice crops and the larger areal extent of a storm under in the baseline and climate change scenarios are the climate change scenario will result in $501 and $1,017 million respectively. Assuming additional damages of $88 million and non-cereal crops losses increase in proportion to additional losses of $1,084 million. the rice crops, total crop losses will rise to $767 and $1,556 million in the baseline and climate Transport: Roads accounts for almost all of the change scenarios respectively. The estimated damages in the transport sector. This is likely to additional crop loss in 2050 due to climate remain unchanged in 2050 as well. Roads are change is $789 million. highly sensitive to inundation and become par- tially damaged with inundation of less than 1 The damage and loss to fisheries and livestock meter and are fully damaged when inundation are much smaller. In 2007 Sidr inflicted dam- exceeds 1 meter. As a result, national and regional ages and losses of $19.3 million on livestock and roads in Bangladesh are constructed to lie above $6.7 million on fisheries. If livestock and fisher- the highest flood level (HFL) with a return period ies continue to grow at the observed (2001–07) of 50 years and feeder roads to lie above normal annual growth rates of 3 percent and 6 percent flood levels (Siddiqui and Hossain 2006). The den- respectively, the estimated additional dam- sity of roads in Bangladesh is already one of the age and loss due to climate change in 2050 highest in the world. By 2050, the road network is $56 million for livestock and $66 million is expected to expand by 25 percent, much slower for fisheries.45 than the expansion of the overall economy. How- ever, the road network is expected to be upgraded Non- agricultural productive sector: Cyclone and built to higher design standards. The share Sidr caused total damages of $4 million and losses of paved roads is also expected to gradually rise of $48 million to the non-agricultural productive to 100 percent by 2050. sectors (industry, commerce, and tourism) in 2007. These sectors accounted for 82 percent of GDP Under the baseline scenario, 12,969 km of roads (Yu et al 2010). Urbanization and structural shifts are exposed to inundation, of which about two- thirds are exposed to inundation greater than 1 45 Estimated damage to livestock is $63 million under the baseline scenario and $119 million under the climate change scenario. meter in 2050. With the additional risk of inun- The corresponding damage and loss for fisheries is $76 million dation under the climate change scenario, 21,019 and $142 million. These estimates are relatively crude—based on aggregate growth trends only—and can be higher or lower based km of roads are exposed to inundation, of which on the underlying growth and exposure factors. For instance, about half are exposed to inundation of more improvements in in-situ (individual or community-based) protec- tive measures such as the construction of platforms to protect livestock can reduce damages. On the other hand, technological improvements such as the increased use of diesel boats instead of 46 Yu et al. 2010; also average non-agricultural share of GDP in sail boats can lead to greater exposure and potential damages. comparator countries (Brazil, Lebanon, Malaysia, and Uruguay).
  • 62.
    36 E C O N O M I C S O F A D A P TAT I O N T O C L I M AT E C H A N G E than 1 meter. In the absence of added protec- deliver this power. By 2050, per capita power con- tive measures, the combined effects of expansion sumption is expected to increase twentyfold, from in the road network and climate change nearly the current 150 Kwh to 3,000 Kwh.47 The power doubles the length of roads exposed to inunda- grid and infrastructure is expected to expand tion risk by 2050. fivefold to deliver the added electricity demand.48 The combined effects of population growth and Under the baseline scenario, 3,372 km of roads rising per capita consumption are expected to are affected in a single cyclone, with partial increase damages to power infrastructure to $68 damages to 1,039 km and full damages to 2,333 million and economic losses to $171 million in km. Accounting for the larger areal extent of a 2050 under the baseline scenario. The increased cyclone under the climate change scenario, the inundation risk and areal extent under the climate affected roads increase by over 2.5 times to 9,038 change scenario is expected to increase damages km. Partially damaged roads nearly quadruple to $129 million and losses to $321 million. The to 4,500 km, while fully damaged roads almost estimated additional damage due to cli- double to 4,538 km. mate change is $60 million and the addi- tional potential loss is $150 million. Repair costs after Cyclone Sidr were estimated at $28,571 (Tk 2 million) per km for fully dam- Coastal protective infrastructure: In the aged roads and $14,286 (Tk 1 million) per km 1960s, 123 polders and supporting infrastructure for partially damaged roads. Repairing dam- were constructed to protect low-lying coastal areas ages to bridges and culverts along these roads against tidal flood and salinity intrusion in Ban- increased total transport sector damages by 1.13 gladesh. In 2007, Sidr induced damages of $70.3 times. Finally, economic losses due to the closure million to the polders and related water regulators of roads during the reconstruction of damages in coastal Bangladesh. Overtopping of embank- were about 22 percent of the total damages to ments is the most important factor responsible for the road infrastructure. damages to coastal infrastructure during cyclones. Comparison of projected surge heights and heights Applying these cost factors, the estimated dam- of existing embankments of polders (as described ages and losses for roads, bridges, and culverts in the next section) indicate an additional 13 pol- under the baseline scenario total $212 million, ders are likely to be overtopped by 2050 due to cli- including $174 million in damages and $38 mate change, resulting in additional potential million in losses. Under the climate change sce- damage of $17.3 million. nario, total damages increase to $413 million and losses to $90 million. The additional dam- Potential damage across all sectors: The ages and losses due to climate change in the total potential damages and losses under the transport sector in 2050 are $240 million and baseline and climate change scenarios in 2050 $53 million respectively. are summarized in Table 3.11. Total damages Power infrastructure: In 2007, Cyclone Sidr 47 The consumption of power in Brazil, Lebanon, Malaysia, caused $8.2 million in damages to power transmis- Uruguay, and South Africa—countries with present per capita sion and distribution infrastructure in coastal Ban- income similar to the projected per capita income of Bangla- desh—indicates per capita consumption of power is likely to gladesh. Loss of power also resulted in additional increase 20 times in Bangladesh. economic losses of $5.1 million. Rising income 48 Experts at the Asian Development Bank working on the Ban- levels are expected to result in an increase in both gladesh power sector indicated that the power infrastructure has to be expanded at one-fourth the rate of growth in electricity power consumption and in the infrastructure to consumption.
  • 63.
    BA N GL A D E S H CO U N T RY ST U DY 37 Table 3.11 Damages and losses from Cyclone Sidr (2007) by economic sector Additional due to Average Severe Baseline Scenario Climate Change Climate Change Economic Sector Cyclone 2009 (a) Scenario (b) (b) - (a) Housing 900 1,825 3,772 1,947 Non-Agriculture Productive Sector 56 1,333 2,505 1,172 Agriculture/Fisheries/Livestock 469 906 1,816 910 Transport 151 212 504 293 Power 15 239 449 210 Water Resource Control 83 83 100 17 Education Infrastructure 73 9 19 10 Other 55 n/a n/a n/a Total Damages and Losses 1,802 4,607 9,166 4,560 Share of GDP 2.4% 0.3% 0.6% 0.3% Table 3.12 Additional damages and losses due to climate change in 2050 Damages Losses Damages and Losses Share of Damages & Economic Sector (Million USD) (Million USD) (Million USD) Losses (%) Housing 1,947 — 1,947 43 Industry/ Commerce/Tourism 88 1,084 1,172 26 Agriculture 75 835 910 20 Transport 240 53 293 6 Power 60 150 210 5 Coastal Protection 17 0 17 0 Education Infrastructure 9 1 10 0 Others n/a n/a n/a n/a Total 2,437 2,123 4,560 100 and losses under the baseline scenario are $4,607 by $4,560 million, nearly doubling the total dam- million. While housing continues to account for ages and losses. The total additional damages and the largest share of total damages and losses, its losses account for another 0.3 percent of GDP. share declines to 40 percent as households adapt to the risks they face. Structural shifts in the econ- Table 3.12 summarizes the distribution of addi- omy also reduce the share of agriculture, while tional damages and losses by sector. Losses increasing those for non-agricultural produc- account for nearly half of the additional eco- tive sectors and power. Even though these dam- nomic impacts of climate change in 2050. In ages and losses are more than twice as large as contrast, losses only accounted for a third of the the damages from Cyclone Sidr, their economic economic impacts from Sidr. impact is expected to be much smaller, account- ing for only 0.3 percent of GDP. Climate change Adaptation options and cost is expected to increase damages and losses from Bangladesh has invested over $10 billion (in an average 10-year return period cyclone in 2050 constant 2007 USD) during the last 35 years in
  • 64.
    38 E C O N O M I C S O F A D A P TAT I O N T O C L I M AT E C H A N G E Figure 3.7 Location of overtopped polders Baseline scenario (left), Climate change scenario (right) measures to make the nation less vulnerable to areas primarily because of the low density of natural disasters such as cyclones and floods (GoB assets and activities in these areas. The cost of 2009). The coastal protection measures already in increasing the resilience of specific assets in these place provide a good foundation to build upon to areas should be relatively small; no attempt was further mitigate existing current risks and future made to estimate this cost. inundation risks. They reveal what has worked well and what has not worked well with a high In each case, the total costs are estimated through degree of geographic detail, and the potential a gap analysis, taking into account the existing effectiveness of these measures to address the adaptation investments already in place. The additional risks posed by climate change. This additional set of adaption measures that would analysis is primarily focused on the upgrading be required to prevent damages are computed for and expanding of existing adaptation measures both scenarios. The costs under the baseline sce- to prevent the inundation risks identified under nario are the adaptation deficit. The difference in the baseline and climate change scenarios. Spe- the cost between the two scenarios represents the cifically, adaptation costs are estimated for five cost of adaptation due to climate change. measures—embankments (upgrade only), affor- estation (expansion only), cyclone shelters (expan- Height enhancement of coastal polders: sion only), cyclone-resistant housing (expansion Geographic information system (GIS) software is only), and early warning systems (upgrade and used to overlay the best available spatially disag- expansion)—under the two climate scenarios. gregated data on polders over the areas exposed These adaptation measures aim to reduce the to inundation risk under the baseline and cli- area, assets, and activities exposed to inundation mate change scenarios. Polders likely to be over- risk, and hence diminish the need for additional topped and the extent of overtopping under each asset-specific resilience enhancing investments, scenario are identified by taking the difference such as raising the height of roads further inland. between the crest level of the embankments of However, such resilience enhancing investments each polder and the inundation depths projected are essential to protect assets in areas that are cur- for them under the respective scenario. Under rently not protected by polders (e.g. many small the baseline scenario, 14 interior polders and 30 islands). Polders were not constructed in these sea-facing polders are expected to be overtopped
  • 65.
    BA N GL A D E S H CO U N T RY ST U DY 39 (Figure 3.7).49 The extent of overtopping in these BWDB rates for turfing of Tk 7.07 per sq meter polders increases under the climate change sce- are used determine total turfing costs.52 nario for 2050. Further, 12 additional interior polders and 3 additional sea-facing polders are The need to strengthen the slope or base of spe- also overtopped under the climate change sce- cific polders and the extent of such strengthening is nario. Annex 5 lists each of the overtopped pol- based on polder-specific field observations by experts ders and the height by which each is overtopped at BWDB and IWM. They are not required for the in the two scenarios. majority of polders that are likely to be overtopped, but for those that do, they can account for up to 70 The cost of preventing overtopping in the interior percent of the cost of prevention. “Major protec- and sea-facing polders under the baseline and cli- tion” includes slope protection on the sea side or river mate change scenarios are computed separately side, using cement concrete blocks or boulders and for each polder likely to be overtopped based on filter materials. The base or “toe” of embankments detailed engineering analysis. Detailed cost esti- is subject to significant erosion from hydraulic stress. mates for each cost component and polder for Protecting against toe erosion includes hard protec- each scenario are provided in Annex 6. In each tion using cement concrete (CC) blocks with sand case, costs are estimated separately by polder for filters and geo-textile, the best locally available tech- earthwork, turfing, toe erosion, plantation, land nology to protect against major erosion. Total toe acquisition, and major protection. erosion protection costs are based on BWDB rates of Tk 224,100 per sq meter. Minor erosion can often For interior polders, earthwork accounts for over be prevented through the planting of vetivera grass. 50 percent of the cost of preventing overtopping, However, high soil salinity along the Chittagong belt and 40–50 percent for sea-facing polders. The has reduced its growth and survival rates. Since soil amount of earth needed is derived from detailed salinity is even higher along the southwestern coast, engineering designs, as outlined in Annex 7. the effectiveness of vetivera plantations may be lim- Raising the height of an existing embankment ited to a few polders on a case-specific basis. Vetivera also entails extending the base that supports it. planting costs Tk 70,700 per ha (BWDB 2003b). Earth that is available locally within 1 km from the polder costs Tk 109.96 per cubic meter.50 The Enhancing polder heights entails an expansion in costs rise to Tk 133.44/ m3 if earth is not avail- the base to maintain the slope of each embankment, able locally and has to be collected from distances as indicated by the shaded area in Annex 7. Req- greater 1 km.51 uisition of the additional land, if privately owned, requires compensation, and in some cases, their Compaction and turfing of the soil is used to pro- rehabilitation cost. For sea-facing dykes, foreshore tect the earth from rapidly washing away with land is usually government-owned or khas land. For subsequent precipitation events. They account interior and marginal dykes, however, neighboring for a small fraction of costs, but effectively extend land is often under private ownership. Land acquisi- the deign life of the earthwork. Turfing area is tion costs are based on BWDB rates of $17,143 (Tk determined using the trapezoidal rule, consider- 1.2 million) per ha from a BWDB project.53 ing the length and slope of the embankment. The 52 Source: Schedule of Rates, Mymenshing O&M Circle, Bangla- desh Water Development Board, 2008–09 49 The overtopping would occur currently as well as in 2050 since 53 Source: Feasibility Study for Flood Control Embankment and the risks under the baseline scenario are the existing risks. River Bank Protection on the Left Bank of Jamuna and Right Bank of Dhaleshwari at Nagorpur and Chowkhali, Final Report, 50 Source: Bangladesh Water Development Board. June 2007, Directorate of Planning-1, Bangladesh Water Devel- 51 Ibid. opment Board, Dhaka.
  • 66.
    40 E C O N O M I C S O F A D A P TAT I O N T O C L I M AT E C H A N G E Table 3.13 Estimated cost for height enhancement of coastal polders ($ millions) Baseline Scenario Climate Change Scenario Additional Cost due to Climate Change Interior polders 317 706 389 Sea facing polders 2,145 2,648 503 Total all polders 2,462 3,354 893 The total investment cost for strengthen- cost-effective protection against the more intense ing coastal polders to prevent overtop- cyclones expected under the climate change sce- ping is $2,462 million under the baseline nario. The addition of the requisite 500 meter scenario and $3,354 million under the cli- forest belt may reduce the embankment height mate change scenario (Table 3.13). Sea-fac- enhancement necessary for some sea-facing pol- ing polders account for 87 percent of costs under ders by up to 30 cm (IWM & DHIA 2000). the baseline scenario. About half of this ($1,195 million) is for major protection and toe erosion of Maps of the coastline available through Google specific polders. Raising embankments to prevent Earth indicate that only 60 km of embankments overtopping under the climate change scenario currently are protected by the recommended 0.5 requires an additional cost of $893 million, almost km of afforestation, while the remaining 897 evenly split between interior and sea-facing pol- km remains unprotected. Fully protecting these ders. Earthwork accounts for over three-fourths embankments requires reafforestation in nearly of the added cost due to climate change for sea- 448.5 sq km (897km x 0.5 km). Afforestation costs facing dykes, while the corresponding share for are $168,000 / sq km in the CERP II project.55 interior dykes is about half. Most of the remain- The cost of afforestation to reduce the ing costs are needed for major protection and toe hydraulic load on embankments under the erosion in the 12 dykes that are overtopped in the climate change scenario is $75 million. climate change scenario, but not in the baseline scenario. Multipurpose Cyclone Shelters: Cyclone shel- ters protect human lives and livestock in coastal In addition to the direct investment requirements, Bangladesh. While the construction cost of mul- the operation and maintenance (O&M) cost is tipurpose cyclone shelters varies based on the assumed to increase by an estimated 2 percent of capacity of the shelter and the design adjustments investment per year, or $49 million in the baseline necessary for the other regular usage of the shel- scenario and an additional $18 million with cli- ter, unit costs of about $134 per person reported mate change. for the post-Sidr shelter construction project funded by the World Bank is fairly typical. Coastal afforestation: Planting mangrove for- ests with a minimum width of 0.5 km in front The number of cyclone shelters needed to pro- of sea-facing polders is a cost-effective method tect the affected population depends on the type of protecting them from above-average severe of house they live in. Pucca houses can structur- storms. While they may not be essential to protect ally withstand cyclones. While residents may be against the average 10-year return period cyclone able to withstand inundation depths of 1 meter under the baseline scenario,54 they constitute with minimal risk to their lives, inundation depths 54 Most existing embankments remained intact under the above- 55 Source: Coastal Embankment Rehabilitation Project, Stage-II, average Cyclone Sidr in 2007. Final Report, Volume I/II, June 2003, Chittagong.
  • 67.
    BA N GL A D E S H CO U N T RY ST U DY 41 greater than 3 meters for an extended duration structurally intact during past cyclones such as certainly requires the evacuation of affected resi- Sidr. In contrast, thatch, tin and kaccha houses in dents.56 The shelter capacity needed under the affected areas have been severely damaged. They two scenarios is estimated based on the popula- can serve as single/multi-family cyclone shelters tion exposed to inundation depth of more than during storm surges. The census data indicate 3 meters. that people with annual incomes greater than $470 live in pucca houses, while poorer resident In coastal Bangladesh, 8.9 million people were live in tin, thatch, or other less permanent struc- exposed to inundation risk of greater than 3 tures. Most rural households will have sufficient meters in 2007 under the baseline scenario. Pop- income by 2050 to afford to live in pucca houses. ulation growth increases the exposed population by 4.7 million to 13.6 million by 2050 under the The need to construct additional cyclone shelters baseline scenario, or nearly a fivefold increase in in areas exposed to low inundation risk can be the cyclone shelter capacity compared to what is reduced by (a) instituting suitable building designs currently available.57 The current deficit will likely and codes to make houses cyclone resistant, and be eliminated with the extensive shelter construc- (b) putting in place a revolving fund for subsidiz- tion efforts that are planned or already under ing construction material and extending hous- way. These efforts will need to be sustained in the ing credits. Consultations with local architects future to keep up with the increasing population and civil engineers indicate that a $200 mil- and will cost an estimated $628 million (about lion revolving fund would be sufficient to 2,930 shelters with an average capacity of 1600). encourage construction of pucca houses in accordance with appropriate building The population exposed to inundation risk rises codes. These steps can be justified as a cost- further by another 9.1 million to 22.6 million effective means of protecting the poorest rural under the climate change scenario. This repre- households in low inundation risk areas in lieu sents a 67 percent increase in the cyclone shelter of constructing additional shelters. As with any capacity needed by 2050 compared to the base- subsidy program, its effectiveness and fiscal pru- line scenario, or an additional 5,702 shelters dence hinges on the structure and design of the with an average capacity of 1600. The con- program. struction cost for the additional shelters needed to accommodate people that are Early warning and evacuation system: The exposed to the additional inundation risk effectiveness of the early warning and evacua- from climate change in 2050 is estimated tion system can be enhanced through improved at $1,219 million. geographic precision of warnings and the expan- sion of the cyclone preparedness program to Cyclone resistant private housing: Cyclone reach the additional inundation risk zones under resistant private housing is an effective alternative the climate change scenario. Consultations with to cyclone shelters, particularly in areas exposed to experts at the relevant agencies identified specific low inundation risk. Pucca houses have remained actions necessary to achieve these objectives and their costs. 56 Multi-story houses may temporarily protect residents from drowning as they move to higher heights. They can be substi- The geographic precision of warnings can be tutes for an extended duration only if affected residents have improved through improved monitoring of adequate supplies of essentials. 57 The deficit is slightly smaller if the PDEP II school facilities cur- weather systems and finer scale modeling of rently being used as shelters are also included. storm surges and inundation depths. Officials at
  • 68.
    42 E C O N O M I C S O F A D A P TAT I O N T O C L I M AT E C H A N G E the Meteorology Department identified the need an adequate number of these are assumed to be to (a) upgrade and expand its network of obser- already under construction or have been planned. vatories, (b) expand the number of radiosonde These investments prevent damages from the stations,58 and (c) modernize the existing work- average cyclone with a 10-year return period, as shop, laboratory, and training facilities. In addi- has been experienced during the past 50 years. tion, the Institute of Water Modeling indicated The potential damages from a single such storm the need to acquire finer scale topographic data currently are $1,802 million and are expected to covering 23,500 sq km of the coastal region, as rise to $4,607 million by 2050. On average, four well as upgrade the mathematical modeling to such storms can be expected over the next 40 better utilize the new data. These improve- years. The potential benefits exceed the invest- ments require an initial investment of $39 ment costs by several times, even when the future million and annual recurrent costs of $5 benefits and costs are discounted. million, as itemized in Table 3.14. Under the climate change scenario, addi- The effectiveness of the early warning system tional investments of $2,426 million, or depends critically on the awareness and coop- approximately $60 million per year, and eration of residents, the community, local and annual recurrent costs of $50 million are central government agencies, and volunteer orga- required to counter the additional risks nizations. Under the climate change scenario, 19 from more severe future cyclones. Assum- additional coastal districts are exposed to inun- ing the investments are phased in over the next 40 dation risk. The Red Crescent Society estimates years, the cost to adapt to the additional risks from that $3 million per year is required to expand the climate change average $85 million, gradually ris- annual awareness promotion program to these 19 ing from $60 million to $110 million by 2050. new districts.59 Total adaptation cost Implications for Table 3.15 summarizes the investment cost of Adaptation Strategy adapting to climate change that would prevent damages from cyclone-induced storm surges under the two scenarios. Under the baseline sce- Cyclones hit the coastal regions of Bangladesh nario, all of the total investment costs of $2,462 every year. The risk from cyclones and the storm million are for upgrading polders. The costs for surges they induce spans the entire coastline. additional cyclone shelters are not included since Public investments in protective infrastructure measures such as polders, cyclone shelters, early 58 The radiosonde is a balloon-borne instrument platform with warning systems (complemented with aware- radio transmitting capabilities. It contains instruments capable of ness raising), and disaster preparedness systems making direct in-situ measurements of air temperature, humidity, and pressure with height, typically to altitudes of approximately have reduced damages and losses from these 30 km. These observed data are transmitted immediately to the ground station by a radio transmitter located within the storms. Despite these investments, an average instrument package. The ascent of a radiosonde provides an severe cyclone with a 10-year return period cur- indirect measure of the wind speed and direction at various levels throughout the troposphere. Ground-based radio direction rently can result in damages of around 2.4 per- finding antenna equipment track the motion of the radiosonde cent of GDP. Most of the damages result from during its ascent through the air. The recorded elevation and azimuth information are converted to wind speed and direction the cyclone-induced storm surges that inundate at various levels by triangulation techniques. coastal areas. Economic expansion is expected 59 The awareness raising program costs approximately Tk 10 to expose additional assets to inundation risk by million ($142,857) per district and an additional Tk 20 million ($285,714) for coordination annually. 2050, nearly doubling the damages and losses
  • 69.
    BA N GL A D E S H CO U N T RY ST U DY 43 Table 3.14 Cost to increase geographic precision of cyclone and surge warnings Investment Upgrades Investment for Expansion Annual O & M Cost Cost Cost Items Quantity (Million USD) Quantity (Million USD) (Million USD) BMD observatories 35 6 30 12 3 BMD radiosonde stations 3 - 5 2 2 BMD workshop and 1 7 - laboratory BMD training institute 1 3 - facilities Topographic survey, 23,500 5 - LIDAR & RTK GPS survey sq km Mathematical modeling 1 3 - Total cost 24 14 5 Table 3.15 Cost of adapting to climate change by 2050 ($ millions) Baseline Climate Change Additional Cost due Adaptation Option Scenario Scenario to Climate Change Investment Investment Annual Investment Annual Cost Cost Recurrent Cost Cost Recurrent Cost Polders 2,462 3,354 18 893 18 Foreshore afforestation 75 75 Cyclone Shelters 1,219 24 1,219 24 Cyclone Resistant Housing 200 200 Early Warning & 39 8+ 39 8+ Evacuation System Total 2,462 4,888 50+ 2,426 50+ in real terms from a similar storm. Damages some uncertainty about the magnitude of these and losses account for around 0.3 percent of the changes, estimates based on plausible scenarios in 2050 GDP, due to expected structural shifts in the the scientific literature indicate that areas at risk economy away from climate sensitive sectors and of inundation over 3 meters will increase by 69 due to private adaptation as households are able percent and up to 1 meter by 15 percent. Addi- to afford cyclone-resilient housing. tionally, the increased severity of the cyclone will also span a larger proportion of the at-risk areas. Climate change is expected to further increase the As a result, damages and losses from an aver- risk of inundation-related damages. A warmer age severe cyclone with a 10-year return period ocean is likely to intensify cyclone activity and in 2050 are expected to double due to climate increase the height of storm surges, resulting in change to around 0.6 percent of GDP. greater inundation depths and inundation of areas further inland. Surges will be further ele- To address the added risks from climate change, vated by a rising sea level as thermal expansion the starting point for an adaptation strategy is and ice cap(s) continue to melt. While there is the significant public investment made over the
  • 70.
    44 E C O N O M I C S O F A D A P TAT I O N T O C L I M AT E C H A N G E Table 3.16 Sequencing of adaption options for tropical cyclones/ storm surges Near term Short term Medium term Long term Early warning Upgrade equipment and Expand observatories and system observatories; Improve equipment to cover new geographic precision of areas forecasts and warnings Relief operations Strengthen decentralized Update programs to Extend awareness raising operations communicate existing programs to new areas and new risks at risk Polders: All existing Fully fund O&M, Under- polders take maintenance Polders: at risk of Assess polder-specific Strengthen polders in overtopping base- avoided damages and order of priority, building line scenario human toll; prioritize in flexibility to account for polders for strengthening added risk with climate change Polders: at risk of Assess polder-specific Strengthen polders in Reassess risk of overtopping climate avoided damages and order of priority, building overtopping; change scenario human toll; prioritize in flexibility to account for strengthen polders based on avoided added risk with climate polders as damages and costs change appropriate Cyclone shelters: All Fully fund O&M; Adapt shelters to better existing shelters undertake maintenance match resident needs Cyclone shelters: at Take stock of shelters Construct multipurpose Reassess gaps in capacity risk of overtopping under construction and cyclone shelters, prioritiz- to meet long-term future baseline scenario planned construction; ing areas with large exist- capacity needs; add capac- assess location-specific ing gaps in shelter capacity ity as needed shelter capacity gaps Cyclone shelters: Assess location-specific Construct multipurpose Reassess gaps in at risk of overtop- gaps in shelter capacity cyclone shelters, prioritiz- capacity to meet ping climate change ing areas with large exist- long-term future scenario ing gaps in shelter capacity capacity needs; add capacity as needed Cyclone-resistant Research in innovative Identify areas where Implement CRH housing housing designs and finan- program can substitute program in lieu cial mechanisms for additional shelter con- of constructing struction; develop CRH cyclone shelters program with effective targeting and minimized leakages Foreshore Prioritize areas to be Implement afforestation afforestation afforested; pilot program afforestation program; develop institutions arrangements Land use planning Set up institutions to Implement institutional and zoning promote settlements arrangements away from high-risk areas
  • 71.
    BA N GL A D E S H CO U N T RY ST U DY 45 past 35 years in disaster risk mitigation measures, The sequencing presupposes sound development which have included construction of polders and policies that promote growth and reduction in cyclone shelters, and the establishment of early poverty that enables increasing number of people warning and evacuation systems. They have been to afford climate-resilient housing. A no-regrets protecting virtually all of the populated areas in strategy to make Bangladesh climate resilient the coastal regions of Bangladesh from tidal waves would start by addressing the existing adapta- and storm surges. While these investments have tion deficit expeditiously first through adequate protected populations and assets during numer- funding of operations and maintenance costs for ous cyclones, experience from Cyclone Sidr indi- existing infrastructure. This needs to be accom- cates that the existing measures are not sufficient panied by efforts to reduce the uncertainties sur- to fully protect coastal areas even against histori- rounding the added risks due to climate change cal risks, much less the added risks under climate research to improve the temporal and spatial change. Toward this end, the government of resolution of forecasts. Pending the availability Bangladesh, development partners, and NGOs of added information, a localized assessment are already undertaking the construction of hun- of damages can be taken to assess the poten- dreds of new cyclone shelters to partially address tial damages from inaction or delayed action. the existing adaptation deficit. Specific adaption measures can be expedited for actions that have sufficiently high avoided Moving forward, the detailed polder level infor- damages-per-cost ratios. Upon addressing the mation available on the overtopping risks and existing risks, actions can be taken to address the the cost of strengthening them enables a finer added risks from climate change. These invest- level of sequencing as summarized in Table 3.16. ments have to also be accompanied by institu- The prioritization recognizes (a) the certainty of tional mechanisms that address any perverse the existing inundation risk; (b) the uncertain- incentives that it may create in attracting popu- ties around the magnitude of the impacts due to lation and activities toward areas of higher risk. climate change; and (c) the manifestation of the Stronger institutional capacity is also essential to added risks due to climate change gradually over reduce uncertainties through improvements in the next 40 years and beyond, and (d) the lack of the knowledge base, and in turn to adjust the localized damage assessment that is directly com- selection and sequencing of adaptation actions parable to the costs. in response to changes in knowledge.
  • 72.
    46 FO UR E C O N O M I C S O F A D A P TAT I O N T O C L I M AT E C H A N G E
  • 73.
    BA N GL A D E S H CO U N T RY ST U DY 47 Inland Flooding Historical Vulnerability of Development Board has designated areas of Inland Flooding Bangladesh vulnerable to various categories of flood (see Annex 10). Mirza (2002) has classified floods in terms of impacts (see Table 4.1, Annex Bangladesh is one of the most flood-prone coun- 11). About 21 percent of the country is subject to tries in the world. The literature on floods in the annual flooding and an additional 42 percent is country is extensive.60 Due to its location in the at risk of floods with varied intensity (Ahmed and low-lying deltaic floodplains at the convergence Mirza 2000). Annual regular flooding has tradi- of three Himalayan Rivers, heavy monsoon rain- tionally been beneficial, providing nutrient-laden fall concomitant with poor drainage often results sediments and recharging groundwater aquifers, in annual flooding. These river systems drain a while low frequency but high magnitude floods catchment area of about 1.7 million km2. The can have adverse impacts on rural livelihoods and intensity of the floods depends on the magnitude production. and pattern of precipitation in the three river sub-basins. At the peak discharge of the three A classified list of all floods in Bangladesh since rivers, the Brahmaputra contributes the great- 1954, together with the extent of inundation, is est volume (58 percent), while the Ganges and shown in Annex 12. There have been above-nor- Meghna contribute about 32 percent and 10 mal floods in 22 of 54 years, of which four were percent, respectively. These floodplains are home exceptional and two catastrophic (Figure 4.1).61 to a large population (most of which is rural and Annex 13 contains a more extended chronology poor) whose life is intricately linked to the flood- and brief descriptions of the above-normal floods ing regime. since 1781. Floods in Bangladesh can be classified into four Table 4.2 summarizes key statistics for the excep- categories based on their origin: flash floods, tional and catastrophic floods since 1954 (see also river floods, rainwater floods, and coastal floods, Annex 13). The exceptional flood of 1998 was as described in Annex 9. The Bangladesh Water the worst on record and lasted from the first week 61 Since 1954, Bangladesh has had a normal flood on average every 60 For an excellent historical discussion of floods in Bangladesh two years. There have been no floods in only 6 of the last 54 please refer to Hofer and Messerli (2006) years.
  • 74.
    48 E C O N O M I C S O F A D A P TAT I O N T O C L I M AT E C H A N G E Table 4.1 Flood classification in Bangladesh Types of Flood Flooded area range (km2) Inundated area range (%) Probability Normal 31,000 21 0.50 Moderate 31,000–38,000 21–26 0.30 Severe 38,000–50,000 26–34 0.10 Catastrophic 50,000–57,000 34–38.5 0.05 Exceptional > 57,000 > 38.5 0.05 Source: Mirza (2002). Table 4.2 Impacts and losses for recent exceptional or catastrophic floods Year 1974 1987 1988 1998 2004 2007 Affected area (‘000 sq km) 53 57 90 100 56 62 Affected (million) 30 30 47 31 33 14 Fatalities 28,700 1,657 2,379 918 285 1,110 Houses damaged (‘000s) na 989 2,880 2,647 895 1,000 Roads damaged (km) na na 13,000 15,927 27,970 31,533 Crops damaged (million ha) na na 2.12 1.7 1.3 2.1 Asset losses (million US$) 936 1,167 1,424 2,128 1,860 1,100 GDP current (million US$) 12,459 23,969 26,034 44,092 55,900 68,400 Asset losses as % GDP 7.5 4.9 5.5 4.8 3.3 1.6 Estimated return period (years) 9 13 55 90 12 14 Source: Islam and Mechler (2007), BWDB (2007) of July to the third week of September; it was the damages of 7.5 percent of GDP. In comparison, most severe both in terms of depth and duration the 1998 flood was a 1-in-90-year event, inundat- (see Annex 14) . It inundated nearly 70 percent ing nearly twice the area but resulting in damages of the total land and caused severe damage. This of 4.8 percent of GDP. flood alone caused 1,110 deaths. It flooded nearly 100,000 sq km, which included 6,000 km2 of The increased resilience of Bangladesh to floods is standing crop lands. It affected 31 million people also apparent when recent GDP and agricultural and impacted the property of about 1 million growth rate trends are examined with respect to households. It also damaged 16,000 km of roads the timing of flood events (Figure 4.2). Major and 6,000 km of embankments. flood events are shown in the figure as black dots. Until the 1990s, GDP and agricultural growth The relative severity of the impacts of severe rates sharply declined following major flood floods in Bangladesh has decreased substantially events. However, the relative effects of major since the 1970s as a result of improved macro- floods have diminished after 1990.62 Growth economic management, increased resilience of rates actually remained positive after the excep- the poor, and progress in disaster management 62 Despite several major disasters, Bangladesh remains among the and flood protection infrastructure. The 1974 few countries that have avoided a single year of negative growth flood was a 1-in-9-year event, which resulted in since the 1990s.
  • 75.
    BA N GL A D E S H CO U N T RY ST U DY 49 Figure 4.1 Extent of above-normal flooding in Bangladesh, 1950–2009 INUNDATED AREA 70% 60% 50% 40% 30% 20% 10% 0 1954 1956 1961 1963 1965 1967 1969 1971 1973 1975 1977 1980 1983 1985 1987 1989 1991 1993 1995 1998 2000 2002 2004 2006 Source: CEGIS Figure 4.2 Growth trends in total GDP and agricultural GDP in relation to major flood events 15% 100% 90% ANNUAL GDP GROWTH RATE 10% 80% SHARE OF TOTAL GDP 70% 5% 60% 50% 0 40% 30% -5% 20% 10% -10% 0 1975 76 77 78 79 1980 81 82 83 84 85 86 87 88 89 1990 91 92 93 94 95 96 97 98 99 2000 01 02 03 04 05 06 07 08 AGRICULTURAL GDP GROWTH TOTAL GDP GROWTH AGRICULTURAL GDP SHARE Source: Yu, W.H. et al. (2010)
  • 76.
    50 E C O N O M I C S O F A D A P TAT I O N T O C L I M AT E C H A N G E tional 1998 flood, which resulted in damages of services. The adaptation costs are determined in nearly 4.8 percent of GDP. Changes in cropping the following four steps. patterns (the shift from deepwater aman rice to boro rice), adequate reserves of food grains, and 1) Demarcate inundation risk exposure zones an increase in rice imports by both the public and from monsoon floods under the baseline and private sectors have all contributed to diminishing climate change scenarios. the relative impact of major flood events. 2) Demarcate additional inundation risk due to These recent gains may be at risk if the severity of climate change. floods increases with climate change, as predicted by the GCMs for the fourth assessment report of 3) Identify assets and activities in the risk expo- the Intergovernmental Panel on Climate Change. sure zones. As discussed in Chapter 2, flooding in Bangladesh depends on the rainfall in the entire GBM basin 4) Determine additional inundation risk due to due to the location of Bangladesh at the tail end climate change and estimate costs necessary of the basin. to mitigate additional inundation risk. Economic Development Baseline: The analy- Estimating Adaptation Cost sis is based on the projected development baseline as used in the coastal chapter.64 Table 4.3 summa- Adaptation options and costs for inland flooding rizes the key relevant changes in the Bangladesh are more difficult to determine than for storm economy between now and 2050. surges, since flooding can have beneficial impacts as well as adverse impacts. This analysis is limited Inundation risk exposure zones to what was tractable within the time and resources Inundation risk exposure in an area is character- available—specifically, options and costs for cli- ized by the highest inundation that is expected mate proofing key infrastructure against the addi- to occur during the year under a scenario. Two tional risks due to climate change from a 100-year scenarios are developed—a climate change sce- flood. These steps would also protect against risks nario and a baseline scenario, which is used as a form smaller floods. Infrastructure accounted for counterfactual to determine the additional risk of about one-third of the damages and losses in the exposure due to climate change. 1998 flood,63 mostly from damaged roads, rail- ways, embankments, drainage, and soil erosion. Baseline Risk Scenario: The 1998 exceptional The limited scope of the analysis implies that the flood event with a return period of 100 years is the cost estimates are likely to be a fraction of the baseline scenario. It is the counterfactual against total cost of adapting to inland flooding. which future climate change risk is measured. Adaptation costs to protect the selected assets are Climate Change Risk Scenario: Flood risk in estimated using a consistent economic develop- 2050 is expected to change from the baseline sce- ment baseline for 2050, which includes a much nario levels due to changes in temperature and larger economy together with structural changes precipitation levels and increases in the sea level. away from agriculture toward industry and Changes in monthly precipitation and temperature 63 The economic impacts (crores taka) of the 1998 flood consisted 64 The development baseline builds on recent economic trends and of: agriculture (crop 3,675; livestock/fishery/forestry, 288); infra- extends them to 2050 based on normal economic development structure including telecom (5,023); industry (5,000), other (230). patterns.
  • 77.
    BA N GL A D E S H CO U N T RY ST U DY 51 Table 4.3 Growth trends in total GDP and agricultural GDP in relation to major flood events Current Indicators Indicators in 2050 Indicator Value Year Source/ Comments Value Source/comments Population (million) 130 2001 BBS 228 BBS Population average 1.58 1991-01 State of the Coast, 1.15% BBS (replacement fertility annual growth rate 2006 in 2021) GDP (billions of constant $75 2007 WDI 2009 $1,614 Projected with growth 2009 USD) rates in the following row. GDP Avg. Annual growth 5.9% 2001-09 Ministry of Finance, 7.5% Various government rate GOB announcements Per capita GDP (constant $470 2007 WDI 2009 $6,395 Implied 2009 USD) Road length (km) 272,487 2007 BBS 340,609 Assumed 25% expansion Share of paved roads 30% 2007 BBS 100% Assumed Railway track (km) 2,460 2006 BBS 3,415 Planned doubling of Dhaka & Chitagong districts Embankment (km) 9,943 2006 BWDB, 2006 9,943 No change Water regulating 13949 2006 BWDB, 2006 16,199 Engineering estimate Structures based on increased drain- age requirement Drainage canals (km) 5111 2006 BWDB, 2006 5111 No change Rice Production (million 27 2006 BBS 75 Yu et al. 2010, Exist- metric tons) ing Climate Variability Scenario Notes: Current per capita GDP in Comparator countries: Brazil($5,860), Malaysia($6,420), Lebanon($5,800) and Uruguay($6,390). Source : World Development Indicators, World Bank predicted by the global circulation model (GCM, 300 m by 300 m grid point under each scenario.65 MIROC 3.2 under the A2 emission scenario All of the simulations include the existing flood between 1998 and 2050 for each 50km by 50 km protection measures, such as flood embankment, grid) are applied to the corresponding observed flood control, and drainage infrastructure in monthly averages for 1998 over the entire GBM Bangladesh. Second, the daily inundation depth basin. The MIROC 3.2 results are used for this results are synthesized to determine the highest analysis, as it results in the largest increase in runoff inundation depth for each grid point during the among the five GCMs and two emission scenarios monsoon period. Finally, for the subsequent eco- examined as part of the food security study by Yu nomic analysis, risk exposure zones are formed by et al. (2010) (see Chapter 2). The rise in sea level of grouping grid points into flood risk zones. 27cm by 2050 is based on UK DEFRA (2007). 65 Detailed descriptions of the models are provided in Annex 15. The simulations do not include urban flooding, flash floods, and Inundation risk exposure for each scenario is changes in the course of rivers due to difficulties in modeling them and have the effect of underestimating the cost of adapta- determined in three steps. First, the Ganges Brah- tion. Modeling urban floods requires the integration of urban maputra Meghna (GBM) model is used to simulate drainage and sewer systems and the outfall rivers. Rivers in Bangladesh frequently change course during monsoon floods. the transboundary flows, while the Super model This results in long-term submergence of newly inundated lands, is used to generate the daily extent and depth of but reclamation of the prior river bed as char land. Increased peak season flows resulting from climate change may increase the inundation during the monsoon period for each incidence of rivers changing course.
  • 78.
    52 E C O N O M I C S O F A D A P TAT I O N T O C L I M AT E C H A N G E Figure 4.3 Flood map – 24 Hour Duration Flood (baseline scenario)
  • 79.
    BA N GL A D E S H CO U N T RY ST U DY 53 Figure 4.4 Flood map – 24 Hour Duration Flood (climate change scenario)
  • 80.
    54 E C O N O M I C S O F A D A P TAT I O N T O C L I M AT E C H A N G E Table 4.4 Flood land classes (based on 24 hour duration inundation) Climate Change Change in Land Type Baseline Scenario Scenario Inundated Area (sq.km) % (sq.km) % (sq.km) % FF (flood free) 69,820 52 64,905 49 (4,915) 4 F0 (0.1m-0.3m) 2,953 2 2,256 2 (697) - F1 (0.3m-0.9m) 14,062 11 11,967 9 (2,095) 2 F2 (0.9m-1.8m) 19,014 14 20,609 15 1,595 1 F3 (1.8m-3.6m) 21,965 16 25,900 19 3,934 F4 (>3.6m) 5,708 4 7,886 6 2,177 2 Total Flooded area 60,750 45 66,362 50 5,612 4 (F1+F2+F3+F4) Table 4.5 Rural Population Exposed to Inundation risk Baseline Scenario Baseline Scenario Climate change Percent change 2001 (a) 2050 (b) Scenario 2050 (c) 100 * (c - b) / (b) F0 (0.1m-0.3m) 1,009,898 843,729 681,031 -19 F1 (0.3m-0.9m) 6,721,555 5,615,588 4,566,517 -19 F2 (0.9m-1.8m) 8,490,523 7,093,488 8,108,952 14 F3 (1.8m-3.6m) 7,105,158 5,936,072 7,543,397 27 F4 (>3.6m) 669,027 558,945 899,066 61 Exposed Rural Population 22,986,263 19,204,093 21,117,932 9 (F1+F2+F3+F4) Figure 4.3 and Figure 4.4 show the flood risk scenario, 45 percent of land is under at least 0.3 exposure map of Bangladesh, as measured by m of water. The total flooded area increases by the highest inundation levels for a 24-hour dura- 4 percent, exposing more assets and activities to tion from the simulations, under the baseline and risk under the climate change scenario. More the climate change scenarios respectively. While importantly, the inundation depth increases in the duration of a flood is an important metric for most flooded areas, correspondingly increasing determining its impact, models to reliably deter- the level of risk in these areas. Areas inundated mine the duration of a flood beyond a few days to depths greater than 0.9m increase from 34 per- are not currently available.66 The choice of 24 cent of the total area under the baseline scenario hours duration is based on the potential severe to 40 percent under the climate change scenario, damages that road infrastructure, flood embank- or an increase of about 17 percent. The distri- ments, and rural houses usually are subject to bution of land based on inundation levels at the from floods of such duration.67 peak period is approximately the same as those for the 24-hour duration flood. The flood risk exposures under the two scenarios are summarized in Table 4.4 Under the baseline The number of people exposed to inundation risk of different depths under the two scenarios is 66 Construction of flood maps of longer duration was not feasible estimated by overlaying the inundation risk maps within the resource constraints of the study. 67 Urban floods and flash floods are not accounted for in this with the population map for 2001 using geo- analysis. graphic information system (GIS) software. About
  • 81.
    BA N GL A D E S H CO U N T RY ST U DY 55 Table 4.6 Rural population density by flood land class (people per sq km) Climate change Scenario Baseline Scenario 2001 (a) Baseline Scenario 2050 (b) 2050 (c) F0 (0.1m-0.3m) 342 286 302 F1 (0.3m-0.9m) 478 399 382 F2 (0.9m-1.8m) 447 373 393 F3 (1.8m-3.6m) 323 270 291 F4 (>3.6m) 117 98 114 Exposed Rural Population 378 316 318 (Average (>0.3m) 23 million people lived in rural areas with esti- 19 percent decrease in the population living in mated inundation depths greater the 0.3 meter in areas inundated by less than 0.9 meter. 2001 (Table 4.5).68 Urban migration is expected to offset most of the increase in population in These estimates are based on expected growth these areas, resulting in a decline in the number rates in the rural and urban populations applied of rural inhabitants exposed to inundation risk to uniformly across the country. However, rural 19.2 million by 2050. An additional 1.9 million residents have historically avoided higher inunda- live in the newly inundated areas under the cli- tion risk areas through their location choices, as mate change scenario in 2050, resulting in a total evidenced from the lower population density in of 21.1 million rural inhabitants that are exposed higher risk areas (Table 4.6). Assuming rural resi- to risk of inundation greater than 0.3 meter by dents appropriately perceive the additional inun- 2050.69 This represents a 9 percent increase rela- dation risk from climate change, location choices tive to the 2050 baseline scenario, but a decrease made autonomously by residents can be expected of about 9 percent relative to the population cur- to decrease the number of people at risk as they rently at risk. move away from higher risk areas. The decrease in the number of people exposed Additional inundation risk due to climate change to inundation risk, however, does not necessarily Figure 4.5 shows a map of the areas with addi- imply an absolute reduction in total risk. Most tional inundation risk determined by taking the people living in inundated areas are exposed difference in inundation depth under the baseline to higher inundation depths under the cli- and climate change scenarios using geographic mate change scenario. The population in areas information system (GIS) software (for each 50 by with inundation depths greater than 0.9 meter 50 km grid). Climate change increases inunda- increases from 13.6 million under the baseline tion depth in about half of the country, but the scenario to 16.6 million under the climate change inundation depth increases are less than 15 cm for scenario, or an increase of 22 percent due to cli- most areas. Increases in inundation depths larger mate change. Correspondingly, this is offset by a than 15 cm occur in only 544 sq km, or less than 0.5 percent of Bangladesh (Table 4.7). 68 The exposed population count is estimated at the thana level, which is the lowest administrative unit, using the population density and the total area that falls into each risk zone. The total Assets and activities exposed to exposed population count is the sum of the exposed population additional inundation risk across all thanas. 69 The rural and urban population growth rates to 2050 are applied The current spatial distribution of assets and uniformly to existing rural and urban areas respectively. activities are projected forward to 2050 based on
  • 82.
    56 E C O N O M I C S O F A D A P TAT I O N T O C L I M AT E C H A N G E Table 4.7 Areas with changes in inundation depth due to climate change Additional Inundation Depth due to climate change (cm) Area (sq km) Share of total area (%) No Change 70,249 52.6 01–05 cm 56,102 42.0 05–10 cm 5,841 4.4 10–15 cm 786 0.6 More than 15 cm 544 0.4 Total 133522 100.0 Figure 4.5 Change in inhundation depth due to climate change
  • 83.
    BA N GL A D E S H CO U N T RY ST U DY 57 expected changes in the Bangladesh economy70 a. Height enhancement applied uniformly across the country. The addi- b. Additional cross-drainage facility tional inundation exposure risk due to climate 2) Transport (railways)—height enhancement change is overlaid on the projected assets and 3) Embankments—height enhancement activities map using geographic information 4) Coastal polders—additional cross-drainage system (GIS) software to determine the extent facility of exposed assets and activities. The assets and 5) High-value assets—strengthen erosion con- activities considered for the analysis include trol programs national highways, regional highways, feeder roads (type A), feeder roads (type B), railways, In each case, the costs are for adaptation only bridges, embankments, and drainage systems. and not for the associated base investments. For The assets and activities exposed in each inun- instance, the base costs of expanding the road dation risk zone for most assets (e.g. culverts) is network are not included, but the costs of adapt- a count of the number of assets located in that ing the entire future network (existing as well as risk zone. For assets with a large spatial extent, new roads) are included. the exposure estimate is measured by the spa- tial extent of the assets (land surface in square Transport (roads) kilometers; road, railways, and embankments in kilometers). All national and regional roads in Bangladesh were previously designed to lie above the highest The best available spatially disaggregated maps flood level (HFL) with a return period of 50 years, and data for these activities are available from and feeder roads were constructed to lie above various public sources, including Bangladesh normal flood levels (NFL) (Siddiqui and Hossain Railways, the Bangladesh Water Development 2006). These standards have not been sufficient Board, the Local Government Engineering to prevent large losses in recent major floods. Department (LGED), the Center for Environ- Road damages accounted for 15 percent of the mental and Geographic Information Services total damages, or about 0.7 percent of GDP dur- (CEGIS), the Public Works Department, the ing the 1998 flood (Islam and Mechler 2007). The Roads and Highways Department, the Water increase in inundated area and inundation depths Resources Planning Organization, and the due to climate change increases the flooding risks World Bank. of roads. Detailed tables of assets exposed to different lev- The length of roads (km) exposed to additional els of additional risk are presented together with inundation risk due to climate change for differ- the cost estimates in the next section. ent types of roads is determined based on GIS overlays of the maps of additional inundation Additional adaptation costs risk zones with the existing road maps for each The adaptation costs are estimated for climate category. By 2050, the road network is expected proofing the following assets from the additional to expand by 25 percent, a less than proportional inundation risk due to climate change: increase compared to population or GDP. Bangla- desh already has one of the densest road networks 1) Transport (roads) in the world, leaving little room for extensive growth in the road network. As a result, most new 70 These include population and income growth and structural shifts in the economy away from agriculture and toward industry investments in the road infrastructure are likely and services. to be for upgrading roads to higher standards, for
  • 84.
    58 E C O N O M I C S O F A D A P TAT I O N T O C L I M AT E C H A N G E Table 4.8 Length of road by type at additional inundation risk from climate change in 2050 (km) Feeder Feeder Additional Inundation Depth Road- Road Share of (m) Type A -Type B National Regional Rural Total Total (%) 0–0.5 6,175 4,203 998 587 11,065 23,027 87 0.5–1.0 734 515 194 86 1,315 2,844 11 1.0–1.5 72 68 11 6 189 346 1 1.5–2.0 24 19 1 3 89 137 1 2.0–2.5 7 4 0 1 17 30 - 2.5–3.0 8 2 1 0 8 19 - All exposed 7,020 4,810 1,205 683 12,683 26,402 100 Share of all exposed (%) 27% 18% 5% 3% 48% 100% instance by paving unpaved roads rather than for Cross-Drainage Facility for roads72 expansion. The assumed 25 percent expansion of the road network is applied uniformly across the The natural flow of flood water currently is existing network. obstructed due to an inadequate number of culverts and regulators to allow cross-drainage Table 4.8 summarizes the total length of roads for roads. The increased volume of flood water that are subject to various degrees of additional under a changing climate requires the construc- inundation due to climate change. Less than 2 tion of additional drainage structures. Addition- percent of roads in 2050 are subject to more than ally, some existing culverts need to be raised to 1 meter of additional inundation due to climate facilitate the free flow of water. Climate change change, while almost all (87 percent) roads are is expected to increase the deeply inundated expected to be inundated by up to 0.5 meters due areas (greater than 0.9 meters) by an additional to climate change. 7,736 sq km.73 Each drainage structure—about 1.5m X 1.8m in size—can drain a 10 sq km Table 4.9 provides the total cost to raise the entire area and costs Tk. 15 million.74 As a result, road network to offset the additional inundation 775 additional drainage structures are risk due to climate change for different types of required to drain the additional deep roads.71 National and regional roads account for inundated areas due to climate change about 12 percent of the total costs of Tk 149 bil- at a total cost of Tk. 11,625 million, or lion, while the remaining 88 percent is required $166.07mn. A total of 315 additional culverts for rural and feeder roads. The cost for elevat- need to be raised to avoid additional inundation ing the entire road network to offset addi- from climate change at a cost of Tk. 1 million tional risk due to climate change is Tk 72 The cost of cross-drainage for railways was not estimated for 148.56 billion, or $2.12 billion. several reasons. First, unlike road culverts, most railway bridges are currently located well above ordinary flood levels. Second, the height of specific bridges and culverts in relation to ordinary 71 The total cost of raising roads to avoid further inundation due flood levels was not available. Third, the added risk of flooding to climate change is calculated using the following: DBS-wearing due to climate change is concentrated in a limited area, making it course 50 mm thick on average (Taka 8,350 per m3), DBS-base difficult to ascertain when additional cross-drainage facilities are course 50 mm thick on average (Taka 7,899 per m3), aggregate warranted. base Type I-100 mm (Taka 2,819 per m3), aggregate base type 73 These are areas with the F2-F4 classifications. II-100mm (Taka 2,232 per m3), roadway excavation (Taka 184 per m3), and earth fill from borrow pit (Taka 124 per m3). 74 Experts from IWM
  • 85.
    BA N GL A D E S H CO U N T RY ST U DY 59 Table 4.9 Adaptation cost for roads by type of road (Tk millions) Feeder Feeder Additional Inundation Depth Road- Road Share of (m) Type A -Type B National Regional Rural Total total 0–0.5 51,169 21,647 10,093 6,883 47,292 137,084 92% 0.5–1.0 3,298 1,459 776 579 3,349 9,461 6% 1.0–1.5 440 208 154 35 594 1,432 1% 1.5–2.0 73 - 5 11 88 178 0% 2.0–2.5 76 38 5 9 107 235 0% 2.5–3.0 87 14 7 7 55 171 0% All exposed 55,144 23,366 11,040 7,525 51,486 148,560 100% Share of all exposed (%) 37% 16% 7% 5% 35% 100% Table 4.10 Railway track at risk of additional inundation due to climate change by 2050 (km) Additional Inundation Depth (m) Railway track (in km) 0–0.5 0.5–1.0 1.0–1.5 1.5–2.0 2.0–2.5 2.5–3.0 >3.0 Total Meter gauge 173.3 10.8 2.4 1.7 - - - 188.1 Broad gauge 205.8 35.0 7.0 - - 0.4 0.3 248.5 Meter gauge double 224.7 43.0 2.6 0.5 0.3 0.4 - 271.4 Total track 603.8 88.8 11.9 2.1 0.3 0.8 0.3 708.1 each.75 The total for raising culverts is Tk. there are a few tracks that can be used for either 315 million, or $4.5 million. broad gauge or meter gauge trains. Railways Table 4.10 summarizes the total kilometers of railway tracks subject to various degrees of addi- The length of railways (km) exposed to additional tional inundation risk due to climate change. Less inundation risk due to climate change for differ- than 2 percent of railway tracks in 2050 are sub- ent types of rail tracks is determined based on ject to more than 1 meter of additional inunda- GIS overlays of the maps of additional inunda- tion due to climate change, while almost all tracks tion risk zones with existing railway maps. The (85 percent) are expected to be inundated by up rail network has not changed significantly in the to 0.5 meters due to climate change. Nearly all of past fifty years. Aside from doubling the railway the tracks that are at additional risk from climate track between Dhaka and Chittagong in the next change are meter gauge tracks. few years, Bangladesh Railways does not have any other plans for changing its network for the Raising rail tracks entails the following six tasks: foreseeable future. The rail network in 2050 is (1) remove and replace ballast, (2) remove and assumed to be the same as now with this planned replace rail and other heavy iron works, (3) dis- expansion. Railway tracks in Bangladesh are mantle and re-lay track, (4) earth work with sand, either broad gauge or meter gauge. Additionally, (5) procure 15 percent ballast and spreading, and (6) mechanical temping at four stages. The cost 75 Rebuilding the flat part cost Tk. 700,000 on average, and other per kilometer for raising railway tracks 0–0.5 remodeling costs are Tk. 300,000. meter for different gauges of track are shown in
  • 86.
    60 E C O N O M I C S O F A D A P TAT I O N T O C L I M AT E C H A N G E Table 4.11 Cost per kilometer to raise different railway tracks up to 0.5 meters ($/km) Description of cost component Meter gauge Broad gauge Double gauge CARRIAGE COST Remove and replace ballast 741 892 892 Remove and replace rail &other heavy iron works 463 498 498 PERMANENT WAY Dismantle and Re-lay of track 12,745 17,039 17,039 Earth work with sand 5,607 6,846 6,846 Procure 15% ballast & spreading 6.786 10,143 10,143 Mechanical temping at four stages 2,871 3,468 3,468 Total cost 75 29,212 38,886 38,886 Table 4.12 Cost of earthwork ($ per km) by type of rail track and inundation depth (m) Additional Inundation Depth (m) Railway track 0 - 0.5 0.5 - 1.0 1.0 - 1.5 1.5-2.0 2.0-2.5 2.5-3.0 >3.0 Meter gauge 5,607 16,821 28,036 39,250 50,464 61,679 67,286 Broad gauge 6,846 20,539 34,232 47,925 61,618 75,311 82,517 Meter gauge double 6,846 20,539 34,232 47,925 61,618 75,311 82,517 Table 4.13 Adaptation cost for railways ($ millions) Additional Inundation Depth (m) Railway track 0 - 0.5 0.5 - 1.0 1.0 - 1.5 1.5-2.0 2.0-2.5 2.5-3.0 >3.0 Total Meter gauge 5 0 0 - - 0 0 6 Broad gauge 8 2 0 0 - - - 10 Meter gauge double 9 2 0 0 0 0 - 11 All tracks 22 4 0 0 0 0 0 27 Table 4.14 Embankments exposed to additional inundation risk due to climate change (km) Additional Inundation Depth (m) 0–0.5 0.5–1.0 1.0–1.5 1.5–2.0 > 2.0 Total Length of embankment (km) 5,088 304 25 4 0 5,421 76 76 The cost of removing and replacing ballast, cost of removing and replacing of rail and other heavy iron works, and cost of dismantling and re-laying of tracks have been counted twice because during the construction work another diversion track will be required to sustain continuous movement of trains.
  • 87.
    BA N GL A D E S H CO U N T RY ST U DY 61 Table 4.15 Itemized cost for raising embankments ($ millions) Additional Inundation Depth (m) 0–0.5 0.5–1.0 1.0–1.5 1.5–2.0 > 2.0 Total Earthwork 55 9 1 0 0 65 Compaction 26 4 1 0 0 31 Turfing 0 - 0 - - 0 Total cost (million Taka) 81 13 2 0 0 96 Table 4.11. The cost for broad gauge and double embankments in 2050 are subject to more than gauge are $38,886 per km, while the cost for meter 1 meter of additional inundation due to cli- gauge is somewhat lower at $29,212 per km. mate change, while almost all (94 percent) are expected to be inundated by up to 0.5 meters Earthwork is the only cost component that due to climate change. increases when rail tracks have to be raised more than 0.5 m. The cost of earthwork per km of rail The total cost of raising embankments to avoid track by type of track and inundation depth is further inundation due to climate change is cal- shown in Table 4.12. The estimated total cost culated using cost estimates available from the of raising railway track is $27 million BWDB for earth work (Taka 125/ m3), compac- (Table 4.13). tion (Taka 60/ m3) , and turfing (Taka 25/ m2). Table 4.15 provides the total cost to raise the Embankments affected embankments to offset the additional inundation risk due to climate change by cost Structural measures such as embankments and component and additional inundation depth. water regulating structures have dominated Most of the costs are for earthwork. The total water and flood management practices in Ban- cost for raising embankments to offset gladesh. The Bangladesh Water Development the additional risk due to climate change Board (BWDB) maintains a total of 9,943 km is $96 million (or Tk 6,727 million). of embankments, 5,111 km of drainage canals, and 13,949 flood control/regulating structures Drainage within Coastal Polders77 (BWDB 2006). Embankments are used to protect agricultural land, major cities, and small towns Water regulators are used to prevent drainage con- from 10-year, 15-year, and 50-year return period gestion in coastal polders. Not all existing water floods respectively. regulators are currently operational. Reliable sta- tistics are not available on the quantity or quality The length of embankment (km) exposed to of existing regulators. The costs of rehabilitating additional inundation risk due to climate change existing structures or adding new ones to meet the is determined based on GIS overlays of the drainage needs under the baseline scenario are maps of additional inundation risk zones with not part of adaptation cost. The higher precipita- the map of existing embankments. The length tion level and rising sea levels under the climate of embankments is not expected to expand fur- ther through 2050. Table 4.14 summarizes the 77 Additional upgrades to drainage systems within coastal polders in total kilometers of embankments that are sub- response to storm surges are not needed if (a) the embankments ject to various degrees of additional inundation are raised sufficiently to ensure polders are not overtopped, and (b) the congestion from inland flooding is larger than the conges- due to climate change. Less than 1 percent of tion that would occur in case there is some overtopping.
  • 88.
    62 E C O N O M I C S O F A D A P TAT I O N T O C L I M AT E C H A N G E
  • 89.
    BA N GL A D E S H CO U N T RY ST U DY 63 change scenario are expected to increase drain- Lacey’s formula is used to predict local scour age congestion in coastal polders. A total of 1,475 depths. Increases in scour depth increase the additional vents—each costing Taka 20 million— yearly operation and maintenance cost due to the are required to drain the affected polders78 that additional requirement of launching apron. The are likely to face increased drainage problems additional cost is a function of the increased dis- under the climate change scenario. The total charge, silt factor, and nature of location of scour cost of additional drainage regulators in sites. Increases in the expected peak discharge the coastal areas is Taka 29,500 million, will result in a 6.8 percent increase in the annual or $421.4 million. operation and maintenance cost of the existing bank protection project for providing additional Scour Control protection against scour. Increases in the maximum discharge is directly BWDB’s average annual operation and main- correlated with increased erosion of unprotected tenance costs for scouring during the last three river banks (CEGIS 2009) and scour depth for pro- years (2007–09 to 2009–10) were Tk. 1,045 mil- tected river banks. More than 60 towns and cities lion ($14.9 million). Increased discharges due to are currently under the erosion control program. climate change are expected to increase annual While additional towns are likely to encounter scour costs by 6.8 percent (Tk. 71 million), or $1.0 erosion and scour concerns, the adaptation cost million per year. estimates only include the additional costs for the existing protected towns due to availability of Adaptation cost for inland flooding data. Similarly, lack of data has also precluded Table 4.16 summarizes the costs of protecting estimation of the cost of protecting unprotected selected infrastructure against the additional risk river banks from erosion. The only cost estimates of inundation from the inland monsoon result- are for the influence of discharge on scour depth ing from climate change by 2050. They provide for currently protected banks. Three case stud- a lower bound on the actual costs of adaption ies on bank protection on the Brahmaputra, the as they do not include additional adaptation in Ganges, and the Meghna basins found that cli- urban areas. Over four-fifths of the total adapta- mate change would induce likely increases in the tion cost is required to raise the height of roads. maximum discharge of 17 percent in the Ganges, Additional drainage structures in coastal areas 20 percent in the Brahmaputra, and 8 percent in account for an additional 14 percent of costs, the Meghna, which would increase scour depths while the remaining measures account for less by 1.87 m, 0.96 m, and 1.13 m respectively than 5 percent of the total cost of adaptation for (BWDB 2003). inland flooding. 78 An increase in the water level inside a polder creates drainage congestion in the polder. Trial simulations were conducted with Implications for four polders to determine the average number of additional vents needed per overtopped polder. Each simulation consisted Adaptation Strategy of adjusting the length of opening under the climate change scenario to reduce the water depth inside each polder to the level under the baseline scenario. The adaptation measure is the additional length of opening needed to ensure the same drainage Rural households have adapted their farming conditions under both scenarios. Additional numbers of vents are computed by dividing the length of opening with 1.52 m systems to the normal inundation by switch- (i.e. width of each vent). The four trials indicate 7, 17, 24, and ing to high-yielding rice crops instead of low- 51 additional vents are needed to reduce water levels under the climate change scenario down to the levels under the baseline yielding deepwater rice. As a result, agricultural scenario. Details of this estimate are in Annex 8.
  • 90.
    64 E C O N O M I C S O F A D A P TAT I O N T O C L I M AT E C H A N G E Table 4.16 Total adaption cost for inland flooding ($ millions) Description of cost component Investment Annual Recur- rent Transport – Road height enhancement 2,122 42 Transport – Road cross-drainage 5 - Transport – Railway height enhancement 27 1 Embankment – height enhancement 96 2 Coastal Polders – cross drainage 421 8 Erosion Control Program 1 Total Costs 2,671 54 production has actually risen over the past few damages from flooding in the agriculture sec- decades. Severe flooding, however, has resulted in tor and for the overall economy are estimated significant damage to the Bangladeshi economy in Chapter 5.79 Damage estimates from the in terms of crop losses, destruction of roads and agriculture and food security component of this other infrastructure, disruption to industry and study indicate that climate change increases the commerce, and injuries and loss in human lives existing damages by about one-third, with com- from severe inland monsoon floods once every mensurate increases in economy-wide losses as three to five years. well. Similar comparisons were not completed for other sectors. Increased monsoon precipitation, higher trans- boundary water flows, and rising sea levels While the cost of protecting against the existing resulting from climate change are expected to risks of severe inland monsoon flooding were not increase the depth and extent of inundation. estimated, the incremental cost to climate proof The impacts of climate change are measured (a) road networks and railways, (b) river embank- based on simulations that compare inunda- ments and embankments to protect highly pro- tion levels under the climate change scenario ductive agricultural lands, (c) drainage systems, with the 1998 floods. With climate change, the and (d) erosion control measures for high-value total flooded area increases by 4 percent, expos- assets such as towns are substantial (estimated at ing more assets and activities to risk. While the $2,671 million in investment costs and $54 mil- inundation depth increases in about half of the lion in annual recurrent costs). Full protection in county, the increases compared to the baseline 2050 will also require addressing the existing risks scenario are greater than 15cm in only 544 km2, of flooding, which are likely to be of the same of or less than 0.5 percent of the country. Since order of magnitude or larger. these areas also have a higher density of assets and activities than the remainder of the country, A prudent no-regrets strategy would begin by the damages will be larger than the small areal strengthening existing flood embankments, sup- share may suggest. The rural population exposed plemented by improvements in the spatial and to flooding, however, is expected to decline from current levels due to the rural-to-urban migra- 79 The flooding results in Chapter 5 are based on the average severe flood, which is useful for determining average effects over time. tion that is projected to occur by 2050. While The risk and cost estimate in this chapter is measured against a significant, these increases are a small fraction baseline level created from the 1998 flood and is useful for exam- ining extreme events. Adaption costs estimated in this chapter of the existing risks of inland flooding.The will also protect against the less severe floods.
  • 91.
    BA N GL A D E S H CO U N T RY ST U DY 65 temporal resolution of flood forecasting and early Finally, given the location of Bangladesh at the warning systems as indicated in the BCCSAP. tail end of the GBM basin, a longer term adapta- Once existing risks have been addressed, the tion strategy has to also include the development adaptation strategy would either relocate the of institutions and mechanisms for the sharing assets and activities in the at-risk areas, or target of water resources with neighboring countries them for climate proofing. located in the GBM basin.
  • 92.
    66 F IV E E C O N O M I C S O F A D A P TAT I O N T O C L I M AT E C H A N G E
  • 93.
    BA N GL A D E S H CO U N T RY ST U DY 67 Agriculture and Food Security Background of livelihood and employment.81 An important determinant of the overall magnitude of flooding Agriculture is a key economic sector in Bangla- is the timing of the peaks of the three major river desh, accounting for nearly 20 percent of GDP systems (Ganges, Brahmaputra, and Meghna). His- and 65 percent of the labor force. The achieve- torical data reveals that climate variability plays a ment of food self-sufficiency remains a key devel- critical role in observed erratic agricultural growth opment agenda for the country and is the first despite some evidence of diminishing variability. of six pillars in the Bangladesh Climate Strategy Overall production declines during major flood 2009 (GOB 2009). Prior to the start of the EACC events are primarily driven by area changes for the study, the World Bank had initiated a separate aman (monsoon season rice) and aus (inter-season multiyear study on climate change and food secu- rice) crops; these losses have increasingly been off- rity in Bangladesh. Given the significant overlap set by increased boro production (dry season rice). in the objectives and methods between the two As a result, agricultural GDP has become less sen- studies, the food security study was augmented sitive to current climate variability compared to with additional analyses focused on adaptation. pre-1990 levels. The relevant portions of the enhanced study have been incorporated into the EACC study as sum- In addition to floods, the livelihoods of much marized in this chapter.80 of the rural population are also threatened by droughts, salinity, storm surges, cyclones and The performance of the agriculture sector is heav- other natural disasters. Regional droughts and ily dependent on the characteristics of the annual coastal inundation from sea level rise can have flood. Regular flooding of various types (e.g. flash, consequences for agriculture production as large riverine, coastal) has traditionally been beneficial. as those from floods. However, low frequency but high magnitude floods can have adverse impacts on agricultural produc- Despite these climate hazards, rice and wheat tion and rural livelihoods, especially of the poor, production have tripled from about 10 million for whom the agriculture sector is a critical source 81 Between 1991 and 2000, 93 major disasters were recorded in Bangladesh, resulting in billions of dollars in losses, much of 80 The augmented study is now complete and is available separately which were in the agriculture sector. The 1998 flood resulted in as Yu et al. 2010. crop losses of over 2 million MT.
  • 94.
    68 E C O N O M I C S O F A D A P TAT I O N T O C L I M AT E C H A N G E metric tons (Mmt) in the early 1970s to almost Projected Future 30 Mmt by 2001, partly due to the rapid expan- sion of surface and groundwater irrigation and Climatic Conditions the introduction of new high-yielding crop varieties. The challenge for Bangladesh is to The direct impacts of climate on crop yields continue the productivity enhancements of are estimated based on climate predictions from the past few decades, which ensures that the sixteen different Global circulation models for expected rise in demand for food (resulting three emission scenarios for the 2030s, 2050s, from increased population and higher income and 2080s. These are compared to counter- levels) can be met despite the increasing pres- factual scenarios based on the historical past sures on available land and water resources (1970–99) for the respective models. The median from overuse, droughts, and quality changes model predictions are a warmer (1.55 °C) and (e.g. salinity). wetter (annual precipitation increases of 4 per- cent) climate by the 2050s, with greater contrasts Climate change poses additional challenges to between the wet and dry seasons. Greater model agriculture beyond the existing risks from cur- uncertainty (in terms of magnitude and direc- rent variability. Long-term changes in tempera- tion) exists with future precipitation than future tures and precipitation have direct implications temperature. Simulated future temperature on evaporative demands and consequently changes significantly separate from the back- agriculture yields. Moreover, the changing ground temperature variations. Precipitation is hydro-characteristics (e.g. onset, duration, and subject to large existing inter-annual and intra- magnitude) of extreme events may affect agri- annual variations. Simulations of future rainfall culture production significantly. Finally, sea do not significantly separate themselves from the level rise may have important implications on historical variability for any month or season. the sediment balance and may alter the pro- file of the area inundated and salinity in the Primarily driven by increased monsoon precipita- coastal areas. tion in the GBM basin, models on average demon- strate increased future flows in the three major rivers This study examines the impacts of climate into Bangladesh (as much as 20 percent).82 Larger change on agricultural yields, cropping pat- changes are anticipated by the 2050s compared to terns, and production, both from a sectoral per- the 2030s. Larger changes are observed on average spective as well as in the context of the overall for the Ganges. The exact magnitude is dependent economy. The key innovations introduced by on the month. Given that most GCMs project both the study are (a) improved characterization of the changes in climate using a comprehensive 82 A Ganges-Brahmaputra-Meghna (GBM) regional model and set of climate projections, (b) use of agricul- national hydrologic model are developed to simulate discharges tural impact functions developed from coun- and water levels into/in Bangladesh under various climate change scenarios for the flood monsoon months from May try-specific data, (c) integration of agricultural to September. Annex 15. Models used for flood hydrology a detailed description of these models. Bangladesh is divided into model results into a macroeconomic (CGE) sixteen subregions to capture agro-ecological variations. Eleven framework to examine both direct and indirect are used for hydrologic modeling purposes. A delta approach is used to model future changes. The delta between the baseline impact and responses, and (d) examination of a and future time period for the climate parameter of interest range of climate risks, including the changing (i.e. percentage change in precipitation and absolute change in temperature) is applied directly to the historical time series. characteristics of floods, droughts, and poten- This preserves the differences across subregions and maintains tial sea level rise. the day-to-day and year-to-year variability that is not captured accurately in the GCM historical outputs. A subset of five GCMs and two emissions scenarios were selected as model experiments.
  • 95.
    BA N GL A D E S H CO U N T RY ST U DY 69 an increasing trend of monsoon rainfall and greater (Figure 5.1). Considering only temperature, precip- inflows into Bangladesh, it follows that the flooding itation, and CO2 changes, aus and aman median intensity would worsen. On average, models simu- production increases by 2 percent and 4 percent by late increases in flooded area in the future (over 10 2030 and 2050 respectively across the model simu- percent by 2050). This is primarily in the central lations. Wheat also increases, reaching a maximum part of the country at the confluence of the Ganges of 4 percent by 2050. and Brahmaputra rivers and in the south. These distributions range approximately +/- 2 Increases in yearly peak water levels are pro- percent. Boro production declines— around 8 jected for the northern subregions and decreases percent by 2080—under climate change scenarios. are projected for the southern subregions. Not These changes are conservative, as it is assumed all estimated changes are statistically significant. that farmers have limitless access to irrigation. More models demonstrate changes that are sig- Mean shifts in floods are estimated to reduce nificant by the 2050s. In general, changes are production of aus and aman between 1 percent less than a half meter from the baseline. Fur- and 4 percent. The narrow model distribution of thermore, across the subregions, most GCMs flood impacts projected by different GCMs sug- show earlier onset of the monsoon and a delay gest a robust change, although changes are small in the recession of flood waters. in comparison to year-to-year variability. The study also draws upon prior results using the Production changes due to flood damages only are MIKE21 two-dimensional estuary model (DEFRA presented in Figure 5.2 for aus and aman rice. Boro 2007), which indicated that the total flooded area in and wheat are assumed to be unaffected by floods. the coastal districts would increase by 6 percent, 10 Flood damages are projected to increase in most percent, and 20 percent under three scenarios—15 scenarios, particularly for the 2050s time period cm, 27 cm, and 62 cm—of sea level rise. and for the aman crop grown at the height of the monsoon. Median additional losses across all sce- narios are 1 percent and 2 percent in the 2030s Direct Impacts on and 2050s respectively. Maximum median flood Agriculture losses occur in the 2050s A2, with national aman production falling 4 percent and national aus pro- duction dropping 2.4 percent. More modest crop Dynamic biophysical crop models are developed (i.e. losses are projected for the B1 scenario, reaching DSSAT) and validated using available information only 1 percent of aus production and 3 percent of on climate, soils, cultivars, and management prac- aman production in the 2050s. The narrow dis- tices. Simulations of changes in crop yield include tribution of flood damages projected by different impacts from climate only (CO2, temperature, and GCMs suggests a robust change, although changes precipitation), mean changes in floods, and coastal are small compared to the year-to-year variability inundation, both separately and in combination. in each time period. These results are likely to be The gap between actual yields and modeled potential optimistic, as changes in inter-annual variability yields is large. Replicating actual yields is secondary between the baseline and future time periods are to estimating the changes from the baseline. Yields likely to produce larger flood damages and several vary from season to season by 10 to 20 percent. sub-regions were not modeled. Elevated CO2 concentrations can have a significant Considering all climate impacts (CO2 fertiliza- positive effect on yields for all crops and locations tion, temperature and precipitation changes, flood
  • 96.
    70 E C O N O M I C S O F A D A P TAT I O N T O C L I M AT E C H A N G E Figure 5.1: Percentage change in national potential production due to temperature, precipitation, and CO2 PERCENTAGE LOST COMPARED TO BASELINE NATIONAL AUS PRODUCTION CHANGE 20% 10% 0 -10% -20% 2030s 2050s 2080s 2030s 2050s 2080s 2030s 2050s 2080s 2030s 2050s 2080s NATIONAL AMAN PRODUCTION CHANGE 20% 10% 0 -10% -20% 2030s 2050s 2080s 2030s 2050s 2080s 2030s 2050s 2080s 2030s 2050s 2080s NATIONAL BORO PRODUCTION CHANGE 20% 0 -20% 2030s 2050s 2080s 2030s 2050s 2080s 2030s 2050s 2080s 2030s 2050s 2080s NATIONAL WHEAT PRODUCTION CHANGE 20% 0 -20% 2030s 2050s 2080s 2030s 2050s 2080s 2030s 2050s 2080s 2030s 2050s 2080s Notes: Potential production of each crop (aus, aman, boro, wheat) is compared relative to the baseline undamaged simulation. Each panel has four sections, each containing the three future time periods and presenting (from left to right) the combination of all emis- sions scenarios, the A1B, the A2, and the B1 scenario. The results of the CO2 impact experiments are displayed as green triangles, while the median of the temperature and precipitation impact experiments is shown as a red triangle. The distribution of undam- aged potential yields projected by GCMs are presented as a box and whiskers diagram, consisting of a red line representing the median value, a box enclosing the inter-quartile range (the middle 50 percent of models), dashed whiskers extending to the furthest model that lies within 1.5x the inter-quartile range from the edges of the box, and red plus symbols for additional models that are perceived as outliers. Source: Yu, W.H., et al. (2010)
  • 97.
    BA N GL A D E S H CO U N T RY ST U DY 71 changes, sea level rise), the median of all rice crop to climate change. For instance, average losses in projections shows declining national production, the Khulna region are -10 percent for aus, aman, with boro showing the largest median losses (Fig- and wheat and -18 percent for boro by the 2050s ure 5.3). However, for aus (-1.5 percent) and aman due in large part to rising sea levels. These produc- (-0.6 percent), the range of model experiments tion impacts ignore economic responses to these covers both potential positive gains and losses and shocks (e.g. land and labor reallocation, price does not separate convincingly from zero. Most effects) which will provide a buffer against the pre- GCM projections estimate a potential decline in dicted physical losses to some degree. boro production with a median loss of 3 percent by the 2030s and 5 percent by the 2050s. Climate change exacerbates the negative impacts of existing climate variability by further reducing Wheat production increases out to the 2050s (+3 rice production by a projected cumulative total of percent). Boro and wheat changes are conservative, 80 million tons over 2005–50 (about 3.9 percent as it is assumed that farmers have limitless access each year), driven primarily by reduced boro crop to irrigation. In each subregion, production losses production. This is equivalent to almost two years are estimated for at least one crop. The produc- worth of rice production lost over the next 45 tion in the southern subregions is most vulnerable years as a result of climate change. Uncertainty Figure 5.2 Percentage change in national potential production from flood damages only PERCENTAGE LOST COMPARED TO BASELINE NATIONAL AUS PRODUCTION CHANGES — FLOOD DAMAGES ONLY 10% 5% 0 -5% -10% ALL 2030s ALL 2050s A2 2030s A2 2050s B1 2030s B1 2050s NATIONAL AMAN PRODUCTION CHANGES — FLOOD DAMAGES ONLY 10% 5% 0 -5% -10% ALL 2030s ALL 2050s A2 2030s A2 2050s B1 2030s B1 2050s Notes: Percentage change in national potential production for each crop (aus and aman) affected by basin floods relative to the baseline flood-only simulation. Boro and wheat are assumed to be flood-free. Each panel has three sections, each containing the two future time periods and presenting (from left to right) the combination of all emissions scenarios, the A2, and the B1 scenario. The distribution of flood-damaged potential yields projected by GCMs are presented as a box and whiskers diagram, consisting of a red line representing the median value, a box enclosing the inter-quartile range (the middle 50 percent of models), dashed whiskers extending to the furthest model that lies within 1.5x the inter-quartile range from the edges of the box, and red plus symbols for additional models that are perceived as outliers. Source: Yu, W.H., et al. (2010)
  • 98.
    72 E C O N O M I C S O F A D A P TAT I O N T O C L I M AT E C H A N G E Figure 5.3 Percentage change in national potential production combined effects PERCENTAGE LOST COMPARED TO BASELINE NATIONAL AUS PRODUCTION CHANGES — ALL IMPACTS 10% 0 -10% ALL 2030s ALL 2050s A2 2030s A2 2050s B1 2030s B1 2050s NATIONAL AMAN PRODUCTION CHANGES — ALL IMPACTS 10% 0 -10% ALL 2030s ALL 2050s A2 2030s A2 2050s B1 2030s B1 2050s NATIONAL BORO PRODUCTION CHANGES — ALL IMPACTS 10% 0 -10% ALL 2030s ALL 2050s A2 2030s A2 2050s B1 2030s B1 2050s NATIONAL WHEAT PRODUCTION CHANGES — ALL IMPACTS 10% 5% 0 -5% -10% ALL 2030s ALL 2050s A2 2030s A2 2050s B1 2030s B1 2050s Notes: Percentage change in national potential production for each crop (aus, aman, boro, and wheat) with the combined effects of CO2, temperature, precipitation, and basin flooding. Each panel has three sections, each containing two future time periods and presenting (from left to right) the combination of all emissions scenarios, the A2, and the B1 scenario. The distribution of potential yields projected by GCMs are presented as a box and whiskers diagram, consisting of a red line representing the median value, a box enclosing the inter-quartile range (the middle 50 percent of models), dashed whiskers extending to the furthest model that lies within 1.5x the inter-quartile range from the edges of the box, and red plus symbols for additional models that are perceived as outliers. Source: Yu, W.H., et al. (2010)
  • 99.
    BA N GL A D E S H CO U N T RY ST U DY 73 about future climate change means that annual Bangladesh economy is characterized by 36 sectors, rice production losses range between 3.6 percent 16 agro-climatic regions, rice split by seasonal vari- and 4.3 percent. Climate change has particularly eties, national labor and capital markets, regional adverse implications for boro rice production and land markets, and three representative households will limit its ability to compensate for lost aus and (marginal, small-scale, and large-scale farms). The aman rice production during extreme climate CGE captures the detailed sector and labor mar- events. This will further jeopardize food security ket structure of the Bangladesh economy—as well in Bangladesh, necessitating greater reliance on as the linkages among production, employment, other crops and imported food grains. Rice pro- and household incomes—and is run forward over duction in the southern regions of Patuakhali and 2005–50 in a recursive-dynamic manner. The Khulna is particularly vulnerable. climate impact channels captured by the CGE model include crop yield changes from the hydro- crop models, additional impacts of low-frequency Economy-wide Impacts extreme events, and sea level rise. and Responses Overall, agricultural GDP is projected to be 3.1 per- cent lower each year as a result of climate change These production impacts ignore economic ($36 billion in lost value-added). Climate change responses to these shocks (e.g. land and labor reallo- also has broader economy-wide implications. This cation, price effects). These economic effects will to will cost Bangladesh $129 billion in total GDP over some degree buffer against the physical losses pre- the 45-year period 2005–50, equivalent to $2.9 bil- dicted. A dynamic recursive computable general lion overall lost each year to climate change, or equilibrium (CGE) model is developed to estimate alternatively an average annual 1.6 percent reduc- the consequences of climate variability and change tion in total GDP. Average loss in agricultural GDP on economic growth and household welfare. The due to climate change is projected to be a third of Figure 5.4 National rice production Figure 5.5 Share of discounted GDP (Metric tons) Source: Yu, W.H., et al. (2010) Source: Yu, W.H., et al. (2010)
  • 100.
    74 E C O N O M I C S O F A D A P TAT I O N T O C L I M AT E C H A N G E the agricultural GDP losses associated with existing multiple climate risks. These areas experience climate variability. Uncertainty surrounding GCMs the largest decline in rice production due to cli- and emission scenarios means that costs may be as mate change. This is for three reasons. First, these high as $5.1 billion per year over 2005–50 under regions already experience significant declines less optimistic scenarios. Additionally, these eco- in aus and aman rice production due to climate nomic losses are projected to rise over time. variability, which is expected to worsen under cli- mate change. Secondly, boro yields are severely These climate risks will have severe implications affected by the effects of changes in mean rainfall, for household welfare. Around 80 percent of total temperature and mean shifts in the flood hydro- losses fall directly on household consumption. graphs. Thus, reductions in boro production limit About 80 percent of the economic losses occur the ability for these regions to compensate for lost outside of agriculture, particularly in the upstream aus and aman rice production during extreme and downstream agriculture value-added process- events. The south is also affected the most by ris- ing sectors. This means that both rural and urban ing sea levels, which permanently reduces culti- households are adversely affected. Per capita con- vable land. The largest percentage declines in per sumption is projected to fall for both farm and capita consumption are projected in these regions. nonfarm households. Finally, the northwest is also vulnerable, as the lost consumption is a large fraction of existing house- The southern and northwest regions are the most hold consumption. Adaptation measures should vulnerable. The south sits at the confluence of focus on these areas.
  • 101.
    BA N GL A D E S H CO U N T RY ST U DY 75 Implications for Adaptation with the probable impacts. Significant additional investments in promoting these types of adapta- Strategy tions are still needed. Some of the key results of the study are that the Second, a no-regrets strategy is to promote net impacts are that climate change will result in activities and policies that help households build losses of about 3.1 percent in agricultural GDP resilience to existing climate risks today. Both and even larger economy-wide losses through processes—adapting to climate change and 2050, with losses increasing over time. These losses stimulating the agriculture sector to achieve rural are not evenly distributed across the country, with growth and support livelihoods—require efforts the southern coastal region and the northwest to diversify household income sources; improve bearing much larger losses. Nearly 80 percent of crop productivity; support greater agricultural the losses are borne by households, with the poor research and development; promote education and the most vulnerable within these communi- and skills development; increase access to finan- ties bearing the greatest burden. While warmer cial services; enhance irrigation efficiency and and wetter climates increase the yields of the pri- overall water and land productivity; strengthen mary rice crops—aman and aus—the impacts of climate risk management; and develop protec- severe floods is expected to result in a net decline tive infrastructure. Moreover, the current large in the total production of these crops. Higher gap between actual and potential yields suggests precipitation and temperatures actually result in substantial on-farm opportunities for growth and lower yields of the dry season boro crop which poverty reduction. Expanded availability of mod- has been used in recent years to offset crop losses ern rice varieties, irrigation facilities, fertilizer use, following severe floods. and labor could increase average yields at rates that could potentially more than offset the cli- While the cost of adaption to climate change in mate change impacts. Significant additional plan- the agriculture sector was not directly estimated ning and investments in promoting these types of due to resource and time constraints. However, a adaptations are still needed. number of implications of the study for adapta- tion cost and a strategy can be inferred and sum- Third, the southern region is the most vulner- marized below. able. The south sits at the confluence of multiple climate risks. These areas experience the largest First, increased investments in adaptation in the decline in rice production due to climate change. agriculture sector are critical to ensuring contin- This is for three reasons: (a) these regions already ued growth and poverty alleviation. Bangladesh experience significant declines in aus and aman will continue to depend on the agriculture sec- rice production due to climate variability, which tor for economic growth. Rural households will is expected to worsen under climate change; (b) continue to depend on the agriculture sector for boro yields are severely affected by the effects of income and livelihoods. Though the government changes in mean rainfall, temperature, and mean has made substantial investments to increase the shifts in the flood hydrographs, so reductions in resilience of the poor (e.g. new high-yielding crop boro production limit the ability for these regions varieties, protective infrastructure, disaster man- to compensate for lost aus and aman rice produc- agement), these variability impacts may, as has tion during extreme events; and (c) the south is been shown, be exacerbated by the long-term affected the most by rising sea levels, which per- effects of climate change. The scale of current manently reduces cultivable land. The largest efforts remains limited and is not commensurate percentage declines in per capita consumption
  • 102.
    76 E C O N O M I C S O F A D A P TAT I O N T O C L I M AT E C H A N G E will be in these regions. Specific focus should be the climatic regime and may be suitable in the placed here. near term. Each of these measures are evaluated based on a set of criteria, including policy and Fourth, while the public sector cost of adapting institutional, socioeconomic, economic, and envi- in the agriculture was not estimated, the relative ronmental. The net revenues to farmers of adopt- merits of a number of short term adaptation ing these strategies are also estimated. These are measures – namely the extension of currently summarized in Figure 5.6. Adaptation measures available options into new areas – are examined to the right and higher up in the graph provide from the farmer’s perspective. These measures larger private payoffs and need to be compared to primarily examine the merits of promoting exist- the social cost of implementing these options. ing crops from one area to another as the climate regimes shifts. The adaptations can focus on Finally, the medium to long term adaptation strat- increasing crop productivity, improving irrigation egy has to include flood control, given the signifi- efficiency or expanding water supply, crop diversi- cant crop damages and losses from severe floods fication and intensification, generating alternative (some of which has been costed in Chapter 4) and enterprises (either farm or non-farm sector) to the development of alternative cultivars particu- diversify household income sources, and expand- larly to the boro crop in the southern region. ing access to training and credit. Sixteen adapta- tion options were identified through consultation Finally, longer run strategies in the agriculture with local officials, NGOs, and farmers to address sector need to examine the development of new the risks of flooding, drought, and salinity to agri- cultivars that are able to better withstand the new culture.83 Many of these measures are already in climate and to control floods. A key aspect of the place in some regions of Bangladesh, or could be latter will be the development of institutional in place with some modification. They provide a mechanisms for the sharing of water resources low cost option for adapting to small changes in with neighboring countries in the GBM basin. 83 These measures are (1) zero or minimum tillage to cultivate potato, aroid and ground nut with water hyacinth and straw mulch; (2) zero tillage cultivation of mashkalai, khesari, lentil, and mustard; (3) modified sorjan system (zuzubi garden) with vegetable cultivation; (4) floating bed vegetable cultivation; (5) cultivating foxtail millet (kaon); (6) parenga practice of t-aman cultivation system; (7) relay cropping of sprouted seeds of aman rice in jute fields; (8) raising vegetable seedlings in poly bags homestead trellises; (9) zero tillage maize cultivation; (10) zero or minimum tillage to cultivate potato with water hyacinth and straw mulch; (11) chickpea cultivation using a priming technique; (12) supplementary irrigation for T aman; (13) year-round homestead vegetable cultivation; (14) pond water irrigation for vegetable cultivation; (15) sorjan system of cropping of veg- etables and fisheries; and (16) raising vegetable seedlings in poly bags homestead trellises.
  • 103.
    BA N GL A D E S H CO U N T RY ST U DY 77 Figure 5.6 Net revenues and overall social preference of adaption measures 60 2.4 55 1.2 2.6 2.1 1.3 3.1 OVERALL RATING SCORE 50 2.3 2.5 2.2 1.1 1.1 45 1.7 3.2 1.4 40 1.6 1.5 1.8 35 0 100,000 200,000 300,000 400,000 NET REVENUE (TK) PER HECTARE FLOOD DROUGHT SALINITY Source: Yu, W.H., et al. (2010)
  • 104.
    78 S IX E C O N O M I C S O F A D A P TAT I O N T O C L I M AT E C H A N G E
  • 105.
    BA N GL A D E S H CO U N T RY ST U DY 79 Local Perspectives on Adaptation Background climate-related hazards (see Figure 4).84 While each ‘hotspot’ was selected for a primary hazard, Bangladesh is exposed to a wide variety of climate many areas are in fact exposed to multiple hazards change impacts and induced hazards including which reinforce the negative shocks of these haz- drought, river floods, flash floods, cyclones and tidal ards on the affected communities. Differentiated surges, salinity intrusion, water-logging and drain- patterns of vulnerability to climate change also age congestion. Current climate variability already emerge from the uneven socio-economic develop- represents a profound threat to the livelihoods of ment of the country. While the sites shown are the poor as they are often collocated in areas of large areas (districts) exposed to various types and highest risk (Figure 6.1) and are directly depen- magnitudes of climate hazards, actual fieldwork dent on climate sensitive sectors of the economy was conducted in particular villages or urban such as agriculture and fisheries. The objective of slums with different socio economic characteris- this component is to examine the determinants of tics (Table 6.1, Figure 6.2). The selected hotpots the adaptive capacity and practices of vulnerable exhibit variation in socioeconomic development, populations, and solicit from local and national resource availability and exposure to natural stakeholders – through participatory scenarios – hazards.85 Experiences with coping strategies the types of public support that would best enable for climate hazards and the people’s preferences the vulnerable population to cope with the poten- for adaptation investments across locations were tial impacts of climate change. The analysis uses determined from fieldwork and participatory a broad assortment of tools including a literature scenario development workshops as described in review, fieldwork consisting of focus groups and Annex 16. sample surveys in eight “hotspots”, and a series of participatory scenario development (PSD) work- shops at the local, regional, and national levels. 84 ‘Hotspots’ refers to those regions already vulnerable to climate variability and likely to suffer substantial impacts in future from climate change, with poverty and vulnerability characteristics also Overview of Hotspots present. 85 Pockets of high poverty incidence generally coincide with eco- logically poor areas of Bangladesh: i. low-lying depression area, Based on a literature review, a total of eight study called haor, in the north-east; ii. drought-prone area on relatively sites or ‘hotspots’ were selected to better under- higher land in the northwest; iii. several upazilas fringing the major rivers, particularly along the Jamuna River; and iv. several stand the impact on the community of different of the south-eastern upazilas, including the Chittagong Hill Tract
  • 106.
    80 E C O N O M I C S O F A D A P TAT I O N T O C L I M AT E C H A N G E Agriculture is the most affected sector in all Livestock also are an important asset for the hotspots since crop cultivation is highly weather- poor, whether the products are consumed by the dependent. In salinity and tidal-flood prone areas, household or sold in the market. These assets are crop cultivation is gradually becoming difficult affected during extreme events: livestock often die due to an increase in salinity. In other areas such in cyclones as people fail to move them to safe as Sirajganj and Sunamganj, people can now grow shelter. An indirect effect of climate change on crops only in the boro season, and in waterlogged livestock is the reduced ability to produce fodder Jessore, farmers cannot cultivate at all in any sea- for livestock due to declining crop cultivation. In son. Trees and vegetation are also severely affected some places, grasses cannot be grown; in others, by climate change in all rural areas; for example, in grazing lands are flooded during the monsoon. water-logged, river, and flash flood prone hotspots, The fisheries sector is highly affected in Bagerhat trees cannot be grown due to excess water. Fre- and Jessore, where cyclones and saline water have quent cyclones in Bagerhot, Satkhira, and Cox’s caused ghers to be damaged and fisheries to die. Bazaar cause trees to be uprooted and soil salin- Infrastructure is also directly impacted by climate ity prevents homestead gardening. Reduced veg- change. Frequent cyclones cause massive destruc- etable and fruit cultivation hurts nutrition levels, tion of embankments, houses, roads, bridges, especially for the poor, who cannot afford to pur- trees, crops and fisheries, as well as loss of human chase these items in the market. and animal lives. Entry of tidal water due to high Figure 6.1 Poverty and climate hazards Source : BBS, World Bank and WFP 2009
  • 107.
    BA N GL A D E S H CO U N T RY ST U DY 81 Table 6.1: Location of eight hotspots selected for based of hazard Hotspot (hazard) Region District Upzilla Union Village Drought NW Naogaon Porsha Nitpur Sadar Nitpur Salinity SW Satkhira Assasuni Protapnagar Sonatankathi Cyclone SW Bagerhat Shorankhola Southkhali Gabtala River Flood NW Sirajganj Kazipur Natuar Para Ghora Gacha Flash Flood NE Sunamganj Tahirpur Dakshin Sreepur Janjail Waterlogging SW Jessore Keshobpur Safalakathi Kalicharanpur Tidal flood SE Cox’s Bazar Cox’s Bazar Sadar Khurushkul Rastarpar Drainage congestion Dhaka Dhaka Mohammedpur Adabor Comfort House FIGURE 4 Figure 6.2 Map of Bangladesh showing the eight hotspots Map of Study Sites in Bangladesh Flash Flood River Floods Drought Drainage Congestion (Urban) Waterlogging Salinity Cyclones Cyclones & Tidal Floods L IST OF SITE S 1. Porsha Upazila, Naogaon District, 5. Tahirpur Upazila , Sunamganj District 2. Assasuni Upazila , Satkhira District 6. Keshobpur Upazila , Jessore District 3. Shorankhola Upazila , Bagerhat District 7. Cox’s Bazar Sadar Upazila , Cox’s Bazar District 4. Kazipur Upazila , Sirajganj District 8. Mohamedpur Upazila, Dhaka District
  • 108.
    82 E C O N O M I C S O F A D A P TAT I O N T O C L I M AT E C H A N G E waves and breached embankments leads to inun- decrease people’s mobility and livelihood options dation and salinization of agricultural lands and as in the northeast region, where lack of road water bodies, which severely affects the livelihoods infrastructure also left villages isolated and suf- of the already disaster-displaced populace. fering from underinvestment by government and NGOs. In Cox’s Bazaar, poor communication meant that people could not travel to safe shelter Vulnerability to easily and relief materials did not reach in time. Climate Change Further, just as asset depletion can lead to chronic poverty at the household level, at the area level too repeated hazard events can reduce a region’s Vulnerability was found to stem from exposure adaptive capacity. For example, rising water lev- factors such as physical location and hazard- els can completely sever road links for months proneness (as in the riverine char islands); sensi- at a time, with consequent impacts on regional tivity factors such as economic geography and growth. Diversified structure of the regional levels of regional development; socio-economic economy is important in providing a base for status and degree of economic “power” (e.g., in effective adaptation. For example tourist areas value chains), and social differentiation including offer a broader range of livelihood opportunities gender. Socio-economic factors exacerbating sen- for area households than those solely reliant on sitivity at the household level included: landless- agriculture, therein reducing vulnerability to cli- ness, illiteracy of adults and children, temporary mate impacts. migration status, large family size, and female- headed household status. At the community level, Climatic Shocks and the Effects of Multiple these included latent social conflict and lack of Hazards: Climate hazards subject households political voice (e.g., urban in-migrants). to economic shocks. Natural disasters were men- Social capital and organizational presence are important tioned by more than half of all respondents in inputs to household and area adaptive capacity. Bangladesh as the reason for sudden loss of Urban respondents expressed more concern than household income, while illness or death of fam- rural residents about leaving assets unattended ily members named by only 12 percent of house- during floods, suggesting that urban households holds. It is important to consider the temporal may take dangerous risks (i.e., not evacuating) scale of climate-related shocks i.e., rapid-onset due to a heightened sense of social insecurity. (such as cyclones) or slow-onset (e.g., floods and Fieldwork revealed that NGO presence was waterlogging), and also their frequency. Multiple highly unequally distributed, with an overwhelm- extreme events arriving one after another do not ing presence in cyclone-prone Bagerhat district allow households sufficient time to recover their (rebuilding houses, providing radios and deliver- earlier asset base. Further, hotspots investigated ing cyclone warnings) but no presence in saline were found to be doubly- or triply-exposed to Satkhira district that also suffered, secondarily, hazards. For instance, river bank erosion leads from cyclones. Here, failure to consider the role to agricultural land loss in cyclone-prone areas, of overlapping hazards meant that neither disas- further reducing household ability to cope with ter response infrastructure, nor the social learning frequent disasters. The compound effect of these that accompanied it, as in Bagerhat were present events was often enough to tip households into in the saline area. chronic poverty status. None of the hotspots had particularly strong adaptive capacity given their Area Asset Status, including infrastructure: poor asset bases that prevented livelihood diver- Poor communication and transport facilities sification in times of crisis. Long-term adaptation
  • 109.
    BA N GL A D E S H CO U N T RY ST U DY 83 planning (beyond short and medium-term mea- their poor asset bases, which prevent asset trans- sures as changing crop types and planting dates) formation in times of crisis. Thus most house- includes the need for economy-wide diversifi- holds interviewed had little room for maneuver in cation, as well as significant improvements in adapting to climate change, due to the low asset human capital levels to allow households to take base level from which they started. Poor urban advantage of risk-prevention strategies at house- dwellers face particularly few options for liveli- hold and area levels. hood diversification and hold low social capital. Poor urban dwellers are typically not competitive on the labor market due to lack of education. Adaptation Practices Housing and health conditions for them remain poor, and access to services weak. Adaptation practices by households vary accord- ing to hazard type, location, and asset base hold- The most common form of rural adaptation is ings. Variations in the self-reported levels of temporary migration for day labor work by adult different types of “capital” for households in dif- men (undertaken by 37 percent of surveyed ferent hotspots are show in Figure 6.3. None of households, mainly to other rural areas). Storage the hotspots had strong adaptive capacity given of food and drinking water before an extreme Figure 6.3 Livelihood capital assets in eight hotspots HUMAN 5 4.5 4 3.5 3 2.5 2 FINANCIAL 1.5 SOCIAL 1 .5 0 NATURAL PHYSICAL Cyclone prone River flood prone Tidal surge prone
  • 110.
    84 E C O N O M I C S O F A D A P TAT I O N T O C L I M AT E C H A N G E
  • 111.
    BA N GL A D E S H CO U N T RY ST U DY 85 event is also a common coping strategy. Twenty- and their frequency make people vulnerable by five percent of surveyed households reported inhibiting forward planning by households who building livestock platforms to guard animals become more risk-averse. In Sirajganj, those liv- during extreme events. Past adaptation prac- ing on chars do not take longer-term approaches tices also included moving to safe shelters such to adaptation, as the flood-prone nature of the as high roads or cyclone shelters during floods islands makes for a very temporary mindset. In and cyclones. Gender-specific coping strategies cyclone-prone Bagerhat, people are also reluctant in the face of disaster include women changing to repair damaged assets because they are afraid from saris to salwar kameez when cyclone warnings another cyclone may damage everything again at come, to ease physical mobility. any time. Livelihood diversification is a common adaptation While asset level patterns among households are measure. Households dependent on crop agri- difficult to improve, there is evidence of significant culture alone supplement their income through behavioral changes among individuals seeking to production of handicrafts, fishing, homestead cope with climate variability and extreme events. gardening, or sale of livestock products. Poor Women, for example, will change from saris to asset bases of households, however, often limit salwar kameez suits to reduce their risk of drown- livelihood diversification options, and result in ing during cyclones. Some also cut their hair. This overcrowding and resource depletion when large suggests disaster preparedness measures can be numbers of household shift en masse to specific good investments for pro-poor impact. occupations—for example, from agriculture to fisheries—ultimately resulting in push-factor entry into day labor work. Preferred Adaptation Options Migration. Without adequate training, people cannot transition to more reliable employment in the service or manufacturing sectors. Those Adaptation Preferences. Participants in local with some skills migrate to cities and hilly areas to and national PSD workshops identified pre- work as rickshaw pullers, garment workers, car- ferred adaptation options in environmental penters, construction workers, cooks, and shrimp management, water resource management, farm workers. Nonetheless, migration, even in infrastructure, livelihood diversification, social the rural-to-rural unskilled labor form, is not an protection, education, agriculture, fisheries, automatic “release valve” for climate-stressed governance, and gender-responsive disaster risk regions and households. Multiple factors condi- management. Hard adaptation options were tion household decision making about migration. identified with reference to specific areas: for In Bagerhat, Satkhira, and flood-prone areas, example, building embankments to reduce the men feared leaving their families alone due to exposure of a community to floods or storms. the physical risk from river erosion, which could Soft adaptation measures—such as diversify- destroy their houses at any time and leave family ing livelihood opportunities generally—were members highly vulnerable. In low social capi- viewed as necessary across all hotspots and tal areas, men also feared leaving female family closely aligned with local perceptions of good members alone. development practice. Participants in local PSD workshops also emphasized the need to Household decision making, risk, and invest in specific social policies to reduce local behavior. The uncertainties of natural hazards vulnerability, including empowering women
  • 112.
    86 E C O N O M I C S O F A D A P TAT I O N T O C L I M AT E C H A N G E and promoting female education; and ensuring Implications for Adaptation access to social protection. Strategy Participants in local and national PSD workshops identified similar adaptation preferences (e.g., in The poor and the socially most vulnerable are disaster risk management, fisheries support, agri- disproportionately affected by climate hazards, as culture, and governance arenas). However, local they have the lowest capacity to cope with these workshop participants particularly emphasized losses. The most vulnerable population includes the need for social protection, livelihoods diver- those with few assets, the subsistence farmers, sification and gender-specific support. Overall, the rural landless, the urban poor, fishing com- preferred adaptation options were identified in: munities, women, children, and the elderly. They do not have sufficient resources to invest in pre- ■■ Environmental Management (mangrove pres- ventive and protective measures such as flood- ervation; afforestation; coastal greenbelts; resilient housing, making them more vulnerable waste management); to the full effects of these hazards. Their access to public services, which might buffer them from ■■ Water Resource Management (drainage; rain- some of the impacts, is also limited. In addition, water harvesting; drinking water provision, their ability to better prepare themselves in the and flood control); longer term is also often limited by the destruc- tion of their asset base. These effects are further ■■ Infrastructure (roads; cyclone shelters); compounded if vulnerable households suffer from multiple extreme-event shocks one after the other, ■■ Livelihood Diversification; without sufficient time for recovery in between the shocks. To the extent that it increases the fre- ■■ Social Protection (especially for fishers during quency of these events, climate change will only cyclone season); exacerbate these impacts. ■■ Education; Adaptation. The adaptive capacity of house- holds is generally low, with poor urban dwellers ■■ Agriculture (development of salt-tolerant and the most disadvantaged due to the limited oppor- high-yield varieties; crop insurance); tunities for livelihood diversification and low social capital. The most common forms of autonomous ■■ Fisheries (storm-resistant boats; conflict reso- adaptation activities among surveyed households lution between shrimp and rice farmers); are temporary migration of adult men for day labor, construction of platforms to protect live- ■■ Governance (especially access to social services stock, and storage of food and drinking water for urban poor) and; prior to extreme events. ■■ Disaster Risk Management that is gender- The local and national Participatory Scenario responsive (e.g., for separate rooms for women Development process largely reaffirms the impor- in cyclone shelters; mini-shelters closer to vil- tance of the adaptation actions planned under lages; use of female voices in early warning the six themes of the BCCSAP 2009. The pre- announcements; and mobile medical teams in ferred adaptation options identified in the work- Char areas). shops include continued national investment in flood management schemes, flood protection and
  • 113.
    BA N GL A D E S H CO U N T RY ST U DY 87 drainage, coastal embankments, cyclone shelters instrumental outcomes (e.g., of improved employ- (though specifying the need for smaller shelters ment outcomes for those whose livelihoods had located at shorter distances from villages), com- been harmed by climate change such as farmers prehensive disaster management, agricultural or fishers in the case of education, and improved research for drought and saline-resistant crop delivery of urban services in the case of gover- varieties, and coastal and urban greenbelts. Pref- nance). Increased attention to these areas of local erences from the PSD process, however, deempha- governance and education would increase resil- size activities under the research and knowledge ience and decrease vulnerability of poor persons management theme and instead emphasize softer and women to climate hazards. approaches (e.g. governance), include more gen- eral options (e.g. education), and are more directly This component of the study also highlights the targeted toward community-level outcomes (e.g. importance of complementing hard adaptation use of mobile medical teams). measures with soft measures such as improving disaster preparedness by establishing communi- In addition, local and national stakeholders cation in local dialects, constructing redesigned identified education and governance as two cyclone shelters to appeal to those most in need additional areas that were not included in the and upgrading the resilience of roads in the BCCSAP but that could strengthen the adap- hazard-prone areas. Enabling policies and insti- tive capacity of rural and urban households and tutions are essential for putting in these actions communities. These cross-cutting issues also have in place.
  • 114.
    88 S EV EN E C O N O M I C S O F A D A P TAT I O N T O C L I M AT E C H A N G E
  • 115.
    BA N GL A D E S H CO U N T RY ST U DY 89 Limitations of the Study One of the strengths of this study is its use of the study by definition was primarily interested in mathematical tools, which impose intellectual understanding the economics of adaptation, and discipline. Examples of this discipline are the use not all aspects of adaptation to climate change. of a well-defined baseline and the requirement under CGE models that the national income Within the limitations imposed by the modeling accounting identities balance at the end of each frameworks, important limitations of this study year. This mathematical approach is indicated derive from three sources of uncertainty: climate, when the objective of the exercise includes quan- economic growth, and technology. titative and monetary impact evaluation of costs and benefits. Apart from providing estimates of Climate uncertainty. There is no consensus on both, the models indicate the relative importance the extent of severity of future extreme events of some factors compared to others, and also such as cyclones or the rise in the sea level. As the effects of changing certain variables on oth- a consequence, information for helping decision ers. This is important for concretely supporting makers to invest in assets with long useful lives of the decision-making process. By making a choice 20, 30, or even 40 years—such as dams, dykes, for quantitative rigor, however, all the well-known urban drainage, bridges, and other infrastructure limitations of using econometric and other math- is also limited. Adaptation costs are estimated as ematical models apply. if decision makers know with certainty what the future climate will be. In fact the problem deci- A key limitation in the context of the EACC is sion makers face is how to maximize the flexibil- that the models used channel researchers to ask ity of investment programs to take advantage of and answer questions that can be answered by the new climate knowledge as it becomes available. models, when the most important questions may A major finding of the study is that the potential be institutional or cultural, or more likely a com- damages from climate change are a fraction of bination of these plus political factors: for exam- the damages that Bangladesh already faces due to ple, how to influence the location of people away existing climate variability. However, these results from high-risk or increasingly unproductive areas, are conditioned on the specific scenarios chosen, how to improve the allocation of water and land, the worst climate scenarios for extreme weather how to improve the quality of education. In this events. However, these scenarios define what the sense, economics is clearly not sufficient, although climate scientists have explored so far.
  • 116.
    90 E C O N O M I C S O F A D A P TAT I O N T O C L I M AT E C H A N G E To make calculations tractable, the study lim- the country to absorb and defend against climate- its both the breadth of economic analysis and induced changes in productivity and adverse cli- the length of the time horizon: the study inves- mate events. As is evident from events in the past tigates public sector adaptation only, and the decade, predicting economic growth is a fragile sci- investment horizon of the study is to 2050 only. ence. A key contribution of this study is to separate Although climate science tells us that adaptation the costs of adaptation from those of development costs and damages will increase over time, and by defining a development baseline. The study that major effects such as melting of ice sheets assumes just one future development path, based are more likely to occur well beyond this hori- on growth in population, GDP per capita, and zon, uncertainty with regard to both climate and urbanization, which drive the demand for food, economic growth make efforts to analyze adap- investment in infrastructure, benefits of protect- tation beyond this period unproductive. ing coastal zones, and so on. How would the costs of adaptation change with a different trajectory? Growth uncertainty. The second major uncer- The global track analysis indicates that alterna- tainty concerns economic growth. Rapid economic tive assumptions about population and economic growth exposes more assets to risk, but also enables growth have only a slight impact on estimates of
  • 117.
    BA N GL A D E S H CO U N T RY ST U DY 91 the cost of adaptation in 2010–19, so the margins effects of innovation and technical change on of error associated with the development baseline adaptation costs. In effect, these costs are based are not very important in the immediate future, on what is known today rather than what might although they may grow over time. be possible in 20–40 years. Sustained growth in per capita GDP for the world economy rests on Technological uncertainty. Finally, technologi- technical change, which is likely to reduce the cal change over the next 50 years will affect adap- real costs of adaptation over time. This treatment tation in currently unknowable ways. Most parts of technological change also contributes to an of the study do not allow for the unknowable upward bias in the calculated costs.
  • 118.
    92 EIGH T E C O N O M I C S O F A D A P TAT I O N T O C L I M AT E C H A N G E
  • 119.
    BA N GL A D E S H CO U N T RY ST U DY 93 Summary of Findings Given the pervasive impacts of climate-related value of exposed assets, they decline in relation to risks, both public sector investments and private the size of the economy as higher incomes make actions have made Bangladesh more resilient over adaptation actions more affordable to future pop- time. Bangladesh already has an extensive set of ulations. The cost of adaption actions in response adaptation measures—such as early warning sys- to the additional risk from climate change are tems, embankments, and shelters—in place to pro- generally less than the additional cost of adapting tect against climate risks such as tropical cyclones/ to existing risks, which remains substantial. storm surges and flooding. The climate resilience of Bangladesh also derives from the ways house- Further, the impacts of existing climate vari- holds and business and society have adapted to ability are concentrated in areas that also have climate risks. These include, for instance, the adop- higher concentrations of poor and socially vulner- tion of countercyclical cropping patterns immedi- able populations. Climate change is not expected ately following severe floods, and the shift toward to shift these distributions, but just to exacerbate cyclone-resistant housing with rising incomes and them. The rural poor in the Southern region in migration of population and economic activity particular are expected to face the largest declines away from higher risk coastal areas. in per capita consumption. In addition to the direct damage to lives and property from storm surges Despite these investments and actions, damages and cyclones, they are also impacted by declining from recent extreme events have made clear that productivity in the aus and aman rice crops; severe substantial risks remain. A detailed assessment of yield losses in the boro crop from changes in mean the adequacy of costal protective measures indi- rainfall; temperature and mean shifts in the flood cates a significant deficiency in addressing existing hydrographs, which have historically been used as risks from cyclone-induced storm surges. Climate a countercyclical measure against severe floods; change is expected to nearly double these risks. and land losses due to increased salinity brought Further, the aggregate additional costs of the pro- forth by sea level rise. posed adaptation measures needed to mitigate climate change risk from extreme events are gen- Increased investments in adaptation to reduce erally smaller than the expected damages. While the impacts of climatic hazards are important the damages from extreme events rise over time to ensure continued growth. The concentration in absolute terms, in line with increases in the of climate impacts in areas with concentrations
  • 120.
    94 E C O N O M I C S O F A D A P TAT I O N T O C L I M AT E C H A N G E of the poor also means that these investments uncertainties about the magnitude and timing of are essential for poverty alleviation. Rural house- future impacts makes it prudent to appropriately holds will continue to depend on the agriculture sequence adaptation actions to provide essential sector for income and livelihoods. Though the protection without overinvesting in areas where the government has made substantial investments to risks do not materialize. These investments have increase the resilience of the poor—such as new to also be accompanied by institutional mecha- high-yielding crop varieties, protective infrastruc- nisms that address any perverse incentives that it ture, and disaster management—the scale of the may create in attracting population and activities current efforts remains limited and will need to toward areas of higher risk. Stronger institutional be scaled up commensurate with the probable capacity is also essential to reduce uncertainties impacts from climate change. through improvements in the knowledge base, and in turn to adjust the selection and sequenc- In a fiscally constrained environment, with com- ing of adaptation actions in response to changes peting priorities, efforts to address climate related in knowledge. Strengthened regional cooperation risks can easily be seaside. While the adoption of on managing shared water resources in the GBM the Bangladesh Climate Change Strategy and basin also has significant implications for adapta- Action Plan in 2009 recognizes the importance tion actions within the country. of addressing climate change, the commitment of public resources provides a focal point for starting (1) Sequencing of adaption actions: a these actions. However, the available resources necessity in the face of uncertainties are much smaller than the current needs even The fundamental problem of policy making for the limited set areas analyzed and measures in the face of climate change is one of uncer- costed in this study. As a result, it may be neces- tainty with regard to climate outcomes. Shift- sary to sequence adaptation actions based on the ing resources toward more productive uses and degree of certainty and timing of the benefits or away from less productive ones in the context costs of actions. The analyses in this study can of uncertainty is already a principal aim of provide some guidance for developing an adapta- development for a fiscally constrained govern- tion agenda for Bangladesh. ment. Climate change increases the importance of achieving this aim, but it makes the task An adaptation agenda more complex. This uncertainty has impor- for Bangladesh tant effects in any assessment of the impact of climate change and on the selection and rank- Sound development policies provide the foun- ing of adaptation actions. Early investments to dation for any action agenda on adaptation to improve the information base and to reduce climate change. This study presupposes specific the existing uncertainties are also important future development baselines for Bangladesh to guide the evolution of adaptation actions based on a continuation of existing trends and over time. A prudent strategy would phase in patterns, which conditions both the size and types additional actions based on the cost of inac- of potential impacts and the necessity and effec- tion and the certainty of impacts across a wide tiveness of specific adaptation actions. It elabo- range of climate outcomes. Table 1 illustrates rates on the potential impacts and the specific the sequencing of immediate, short-term, and actions in the BCCSAP, providing bottom-up medium- to long-term investments envisioned cost estimates of undertaking these actions, and in the BCCSAP that is consistent with these the potential losses if they are not undertaken. principles, focusing on reducing uncertainty Large existing climate variability and significant in the near term and improving on protective
  • 121.
    BA N GL A D E S H CO U N T RY ST U DY 95 infrastructure for coastal polders near the sea levels and increased intensity of storms. So medium. The risk analysis from this study pro- steps taken to address current risks will even- vides additional spatially differentiated infor- tually also protect populations and activities mation to further refine the sequencing of the against future risks. The aggregate costs of adaptation actions. strengthening existing polders against historical risks are of the same order of magnitude as the (2) Addressing current climate-related aggregate damages of a single severe cyclone. risks: a no-regrets strategy The detailed polder-specific risk assessment Public investments in disaster risk reduction and cost estimate provided in the study should measures over the past 50 years have reduced be combined with the assets and populations the damages resulting from them, yet recent that they would protect to prioritize immedi- experiences indicate that climate-related disas- ate actions to strengthen polders. The effec- ters continue to have significant damages. Cli- tiveness of these efforts can be increased by mate change is only expected to increase the complementing them with efforts to strengthen risks and the associated damages in the future. institutions for managing development in the A no-regrets strategy would address these cur- vulnerable zones. Similarly, the efforts to shore rent climate risks. One clear example concerns up river embankments, elevate roads, or add the impact of cyclones and the storm surges culverts to accommodate drainage require- they induce in coastal areas. Despite the uncer- ments for severe floods that exist today would tainty over future rainfall, there is relative cer- not only provide immediate benefits but also tainty that a warmer climate will lead to rising protect against increased future flood risks.
  • 122.
    96 E C O N O M I C S O F A D A P TAT I O N T O C L I M AT E C H A N G E (3) Research and Knowledge Building: key research activities to reduce the large uncertain- to improved targeting of future actions ties about future climate risks. These efforts can While the direction of future climate risks in provide guidance for the extent of adaptation Bangladesh seems clear, its magnitude and tim- and the prioritization of investments. ing is less certain. Given the high cost of infra- structure investments, and the expected gradual (4) Sound development policies: increase in climate risk over decades, a prudent the foundation for any adaptation agenda strategy would be to focus on improving the Development generates both the resources and spatial precision of current climate-related risks opportunities to adapt to climate change at a rela- forecasting and associated early warning sys- tively low cost. The Bangladesh economy has been tems, which would enable better targeting of growing at over 6 percent during the past decade adaptation actions. These actions not only pro- and is expected to continue to grow at a compa- vide immediate benefits, but also improve the rable pace over the coming decades. Expected capacity to address climate risks in the future. structural changes in the economy—away from This needs to be supplemented with additional climate-sensitive sectors such as agriculture toward
  • 123.
    BA N GL A D E S H CO U N T RY ST U DY 97 industry and services—reduce exposure to climate for inevitable losses, will be essential for improved risks, while urbanization provides new opportu- targeting of adaptation actions. nities for managing them better. Investments to expand the road system and increase the share of 5) Adjustment of design standards for paved roads yield high returns by lowering trans- infrastructure: essential for future port costs and expanding markets. At the same resilience time, they lessen the impact of floods and enhance Infrastructure investments are long-lived and the ability of farmers to respond to changes in expensive and yield large benefits when designed agricultural comparative advantage. Ensuring appropriately. It is essential to develop appropriate that the design and location of new infrastructure, standards commensurate with the likely climate buildings, and other assets consider the effects of risks over the expected lives of the assets and to climate change can extend their useful lives. Simi- update them over time based on new research larly, better management of water resources and results that become available. For example, the pros- an expansion of irrigation should increase agricul- pect of more intense precipitation has implications tural yields and permit the adoption of new agri- for unpaved roads, especially in rural areas, which cultural technologies, as well as enabling farmers to are vulnerable to being washed away by floods cope with greater variability of rainfall. and heavy rainfall. Single-lane sealed roads have a Eliminating poverty is central to both develop- higher capital cost but they provide a more reliable ment and adaptation, since poverty exacerbates all-weather network with lower maintenance costs. vulnerability to weather variability as well as cli- As research makes the risk of flooding in a location mate change. Higher incomes enable households more apparent, the design standards for roads in to autonomously adapt and better cope with these areas need to be increased accordingly. Simi- climate-related disasters, by for instance, making larly, polders need to be strengthened beyond their climate-resilient housing more affordable. Rapid current protective capacity as the added risk from development leads to a more flexible and resilient storm surges becomes more certain. Additional society, so building human and social capital— research may also be necessary in the medium to including education, social protection and health, long term for the development of new varieties of and skills training—are crucial to adaptation. crops and cropping patterns in accordance with In addition, the government has made substan- the changing climatic conditions particularly in the tial investments to increase the resilience of the southern coastal regions. poor through, for instance, the introduction of new high-yielding crop varieties, construction (6) Reducing perverse incentives: of protective infrastructure, and improvements a necessity to increase effectiveness of in disaster management. However, risk reduc- infrastructure investments tions achieved through protective infrastructure As a general rule, investments—such as flood improvements increase ground rents and often embankments or polders—designed to protect result in crowding out the poor. Inevitably, this vulnerable assets should be subjected to careful adverse location selection will increase the con- consideration. Construction of a dyke is followed, centration of the poor in unprotected areas, as almost by definition, by accumulation of physi- can be seen in from the coincidence of poverty cal capital in the shadow of the dyke because and disaster risk maps. Adaptation that directly it is considered “safe.” However, as the tragedy assists the poor, such as early warning and evacu- of New Orleans dramatically illustrated, a suffi- ation services, basic education (particularly for ciently extreme event will breach a polder. The women), and subsidized insurance to compensate combination of an increasing severity of extreme
  • 124.
    98 E C O N O M I C S O F A D A P TAT I O N T O C L I M AT E C H A N G E events, the high costs of providing physical pro- (7) Soft adaption approaches: tection, and the accumulation of capital behind a complement to hard investments such barriers can mean that the expected value The distinction between “hard” (capital-inten- of losses, including human suffering, may not be sive) and “soft” (institutions and policies) adapta- reduced—either at all, or by as much as expected tion is easily exaggerated. The reality is that both by investments in protection. approaches are necessary and complement each other as illustrated above, in terms of potential per- Similar concerns apply to efforts to maintain the verse incentives of investments in coastal embank- welfare of populations in areas where climate ments. This study has focused largely on the costs change alters the comparative advantage of agri- of hard measures. The challenge is thus to get the culture and other resource-intensive activities. balance between hard and soft adaptation right. It Short-term measures to prevent suffering must is much simpler to estimate the costs of upgrading be complemented by long-term measures such as embankments or adding new culverts to protect education, job training, and migration designed against the effects of climate change than it is to to reduce reliance on resources and assets whose estimate the costs of creating new institutions and value may be eroded by climate change. Adapta- implementing better policies. Evaluation of these tion should not attempt to resist the impact of cli- “hard” adaptation investments, however, has been mate change, but rather it should offer a path by done within a framework of appropriate develop- which accommodation to its effects is less disrup- ment policies and efficient institutional arrange- tive and does not fall disproportionately on the ments. Good policies, planning, and institutions poor and the vulnerable. are essential to ensure that more capital-intensive measures are used in the right circumstances and The long-term challenge is to move people and yield the expected benefits. In many cases, the latter economic activity into less climate-sensitive areas costs are zero or negative in the longer run, because and to seek a strategic balance between protect- these changes provide benefits beyond adaptation ing existing populations and encouraging the to climate change and contribute to overall well- mobility of future populations. In 2050, the num- being. But they are much harder to quantify. In ber of people living in cities will triple, while the others, the absence of appropriate complementary rural population will fall by 30 percent. Current institutional arrangements can actually worsen the policies will determine where this urban popula- impacts that the hard investment is designed to tion settles and how prepared it is to adapt to a address. The importance of keeping infrastructure changed climate. Many households have moved and urban development out of harm’s way is a key further inland, partly due to higher perceived risk, illustration of the costs of creating perverse incen- but strengthened embankments may change these tives that encourage behavior and investments that perceptions, leading to increased exposure. Good worsen rather than reduce the prospective impacts policy needs to encourage future populations to of climate change. Equally, however, experience move away from high natural risk areas, avoid- shows that the difficulties of devising and imple- ing perverse incentives to remain in high-risk menting soft measures are often underestimated areas and adopting positive incentives to promote because these may involve changes in expecta- settlements and urban growth in low-risk areas. tions or established (quasi-) property rights that are Strengthened education in rural areas is critical strongly resisted. for rural migrants to be prepared for productive lives in new urban areas. An important component of soft adaptation is the focus on governance and local stakeholder par- ticipation. The effectiveness of hard investments
  • 125.
    BA N GL A D E S H CO U N T RY ST U DY 99 depends on the access to them and their uptake research institutes that develop and test new crop by targeted populations. Reaching women requires varieties to increase national production and gender-sensitive designs of interventions such as the resilience against climate risks. The magnitude provision of separate facilities for women in cyclone of the additional effort and the direction it takes shelters. Pro-poor adaptation investments include will depend on the specific future climate that social protection, livelihoods diversification, and materializes. investments in human and social capital (including training, education and community-based disaster (9) Strengthened regional cooperation: an risk management) in order to strengthen local resil- essential option in the long term ience to climate change. Climate change may greatly increase the need for regional cooperation. Cooperation on the shar- (8) Development of climate-resilient cul- ing of water resources with neighboring countries tivars and cropping: an option for long- in the GBM basin is not a new issue for Ban- term food security gladesh, but it is one whose importance may be Additional research will also be necessary for greatly increased by climate change. As the stakes the development of climate-resilient cultivars rise, effective steps taken now to promote and and cropping patterns that are more suited to strengthen the cooperative management of the the future climatic conditions, particularly in the shared resources can not only provide immedi- southern coastal regions, which are expected to ate benefits to all parties but can also prevent the be affected the most by climate change. Bangla- need for expensive and possibly disruptive solu- desh already has an active network of agricultural tions in the future.
  • 126.
    100 E C O N O M I C S O F A D A P TAT I O N T O C L I M AT E C H A N G E References Ahmed, A.U. and M. M. Q. Mirza. 2000. “Review of causes and Christensen, J.H., et al. 2007. “Regional Climate Projections.” Dimensions of Floods with Particular Reference to Flood In S. Solomon, D. Qin, M. Manning, Z. Chen, M. Marquis, ’98: National Perspectives.” In Q.K. Ahmed et al., eds. Per- K.B. Averyt, M. Tignor, and H.L. Miller, eds. Climate Change spectives on Flood 1998. Dhaka: University Press Limited. 2007: The Physical Science Basis. Contribution of Working Group I to the Fourth Assessment Report of the Intergov- Ahmed, A.U., and M. Alam. 1998. “Development of Climate ernmental Panel on Climate Change. Cambridge, UK, and Change Scenarios with General Circulation Models.” In New York: Cambridge University Press. S. Huq, Z. Karim, M. Asaduzzaman, and F. Mahtab, eds. Vulnerability and Adaption to Climate Change for Bangladesh. Dor- Dasgupta S., B. Laplante, C. Meisner, D. Wheeler, and J. Yan. drecht: Kluwer Academic Publishers. 2009. “The impact of sea-level rise on developing countries: A comparative analysis.” Climatic Change 93 (3): 379–388. Ahmad, Q.K., N. Ahmad, and K.B.S. Rasheed, eds. 1994. Resources, Environment and Development in Bangladesh with Emanuel, K. 2005. “Increasing destructiveness of tropical Particular Reference to the Ganges, Brahmaputra and Meghna Basins. cyclones over the past 30 years.” Nature 436: 686–688. Dhaka: Academic Publishers, Dhaka. Emanuel, K., R. Sundararajan, and J. Williams. 2008. “Hurri- Ali, A. 1999. “Climate Change Impacts and Adaptation Assess- canes and Global warming: Results from Downscaling IPCC ment in Bangladesh.” Climate Research 12: 109–116. AR4 Simulations.” Available at: ftp://texmex.mit.edu/pub/ emanuel/PAPERS/Emanuel_etal_2008.pdf. Allison, I. et al. 2009. The Copenhagen Diagnosis, 2009: Updating the world on the Latest Climate Science. Sydney: The University Goodbred, Steven L., and Steven A. Kuehl. 2000. “Enormous of New South Wales Climate Change Research Centre Ganges-Brahmaputra Sediment Discharge during Strength- (CCRC). ened Early Holocene Monsoon.” Geology 28 (12) Bangladesh Water Development Board (BWDB). 2007. Annual Government of the People’s Republic of Bangladesh. 2007. Flood Report 2007. Dhaka, Bangladesh: Flood Forecasting Consolidated Damage and Loss Assessment, Lessons Learnt from the & Warning Centre Processing & Flood Forecasting Circle, Flood 2007 and Future Action Plan. Report prepared by Disaster Bangladesh Water Development Board. Management Bureau, Ministry of Food and Disaster Management, with the assistance of Comprehensive Disaster BCAS (Bangladesh Centre for Advanced Studies). 1992. Management Programme (CDMP). Dhaka, Bangladesh. “Cyclone ’91 Revisited: A Follow-up Study.” Raana Halder, Ministry of Environment and Forests Government of the ed. Dhaka: BCAS, Bangladesh. People’s Republic of Bangladesh. BWDB (Bangladesh Water Development Board). 2003a. Technical Government of the People’s Republic of Bangladesh. 2008. Evaluation of Some Selected Flood Protection and River Erosion Con- Cyclone Sidr in Bangladesh: Damage, Loss, and Needs Assessment for trol works Already Implemented by BWDB. Dhaka: BWDB. Disaster Recovery and Reconstruction. Dhaka, Bangladesh. Minis- BWDB (Bangladesh Water Development Board). 2003b. Coastal try of Environment and Forests Government of the People’s Embankment Rehabilitation Project, Stage II, Final Report. Vol. I/II. Republic of Bangladesh. Chittagong: BWDB. Government of the People’s Republic of Bangladesh. 2009. Bengtsson, L., K. I. Hodges, and E. Roeckner. 2006. “Storm Bangladesh Climate Change Strategy and Action Plan 2009. Dhaka, tracks and climate change.” Journal of Climate 19: 3518–43. Bangladesh. Ministry of Environment and Forests Govern- ment of the People’s Republic of Bangladesh. CEGIS (Centre for Environmental and Geographic Information Services). 2010. Mid-Term report on Field-Based Research on the Hofer, T., and B. Messerli. 2006. Floods in Bangladesh. History, Impacts of Climate Change on Bangladesh Rivers. Dhaka: ADB, dynamics and rethinking the role of the Himalayas. Tokyo: United Bangladesh. Nations University Press.
  • 127.
    BA N GL A D E S H CO U N T RY ST U DY 101 Hoque, M. Mozzammel. 1992. “Strategies and Measures to IWM (Institute of Water Modeling). 2007a. Improving WFP and Reduce Cyclone Damage.” In Cyclone Disaster Management partners knowledgebase on flood prone areas in Bangladesh. Final and Regional/Rural Development Planning. UNCRD-CIRDAP Report. Dhaka, Bangladesh. Seminar, Phase III, January 27–29, 1992, Chittagong, Ban- IWM (Institute of Water Modeling). 2007a. Improving WFP and gladesh. Nagoya, Japan: UNCRD. partners knowledgebase on flood prone areas in Bangladesh. Final Huq, S., A.U. Ahmed, and R. Koudstaal. 1996. “Vulnerability of Report. Dhaka, Bangladesh. Bangladesh to Climate Change and Sea Level Rise.” In T.E. IWM (Institute of Water Modeling) 2007b. “Real time data col- Downing, ed. Climate Change and World Food Security. NATO lection (July ’05 to December ’06) for FFWC and update & ASI Series, I37. Berlin and Hiedelberg: Springer-Verlag. model validation of General/ National & 6-Regional models IMD (Indian Metrological Department). 2010. Frequently Asked for 2003–06 hydrological years.” Validation Report 2, Vols. Questions on Tropical Cyclones. Available at: <http://www. 1,2,3,4,5, 2007. Dhaka, Bangladesh. imd.gov.in/section/nhac/dynamic/faq/FAQP.htm#q42> IWM (Institute of Water Modeling). 2009a?. Updating Calibration (accessed March 15, 2010). and Validation of Flood Forecasting Model. Final Report. Dhaka, International Workshop on Tropical Cyclones (IWTC). 2006. Bangladesh. Bangladesh Water Development Board, Minis- Statement on tropical cyclones and climate change. Available at: try of Water Resources, Government of Bangladesh. http://www.gfdl.noaa.gov/~tk/glob_warm_hurr.html. IWM (Institute of Water Modeling). 2009b?. Hydrological Modeling IPCC (Intergovernmental Panel on Climate Change). 2000. for the Implication of Climate Change on Food Security of Bangladesh: Special Report on Emissions Scenarios (SRES). Working Group A Menu of Adaptation Responses. Final Report. Dhaka, Bangla- III, Intergovernmental Panel on Climate Change (IPCC). desh: Bangladesh Centre for Advance Studies, the World Cambridge, UK: Cambridge University Press. Available at: Bank. http://www.grida.no/climate/ipcc/emission/index.htm. IWM & DHI (2000) 2nd CERP: 2nd Coastal Embankment IPCC (Intergovernmental Panel on Climate Change). 2001. Rehabilitation Project, Dhaka. Regional Impacts of Climate Change. Third Intergovernmental IWFM (Institute of Water Modeling), CEGIS (Center for Panel on Climate Change. Geneva: IPCC. Environmental and Geographic Information Services). IPCC (Intergovernmental Panel on Climate Change). 2007a. 2008. “Impact of Climate Change on Surface Water Flow Climate Change 2007: Impacts, Adaptation and Vulnerability: Sum- in Bangladesh.” Technical Report of CLASIC. Dhaka, mary for Policymakers. Working Group II Contribution to the Bangladesh. Intergovernmental Panel on Climate Change Fourth Assess- Keim, M. E. 2006. “Cyclones, Tsunamis and Human Health.” ment Report. Geneva: IPCC. Oceanography 19(2): 40–49. IPCC (Intergovernmental Panel on Climate Change). 2007b. Khalil, G. 1992. “Cyclones and Storm Surges in Bangladesh: Climate Change 2007: The Physical Science Basis: Summary for Poli- Some Mitigative Measures.” Natural Hazards 6: 11–24. cymakers. Working Group II Contribution to the Intergovern- mental Panel on Climate Change Fourth Assessment Report. Knutson, T. R., and R. E. Tuleya. 2004. “Impact of CO2- Geneva: IPCC. induced Warming on Simulated Hurricane Intensity and Precipitation Sensitivity to the Choice of Climate Model IPCC (Intergovernmental Panel on Climate Change). 2007c. and Convective Parameterization.” Journal of Climate 17: “Technical Summary.” In S. Solomon, D. Qin, M. Manning, 3477–95. Z. Chen, M. Marquis, K.B. Averyt, M. Tignor and H.L. Miller, eds. Climate Change 2007: The Physical Science Basis. Landsea, C.W., B.A. Harper, K. Hoarau, and J.A. Knaff. 2006. Contribution of Working Group I to the Fourth Assessment “Climate Change: Can We Detect Trends in Extreme Tropi- Report of the Intergovernmental Panel on Climate Change. cal Cyclones?” Science: 313 (5786): 452–54. Cambridge, UK, and New York: Cambridge University Michaels, P. J., P. C. Knappenberger, and R. E. Davis. 2005. Press. “Sea-Surface Temperatures and Tropical Cyclones: Breaking IPCC (Intergovernmental Panel on Climate Change). 2007d. the Paradigm.” Presented at 15th Conference of Applied Technical Summary. A Report of Working Group 1 of Intergov- Climatology, 2005, Washington, DC. Available at http:// ernmental Panel on Climate Change. Geneva: IPCC. ams.confex.com/ams/15AppClimate/techprogram/ paper_94127.htm. IPCC (Intergovernmental Panel on Climate Change). 2007e. Climate Change 2007: Impacts, Adaptation and Vulnerability: Sum- Ministry of Environment and Forest, Government of the mary for Policymakers. Working Group II Contribution to the People’s Republic of Bangladesh. 2005. National Adaptation Intergovernmental Panel on Climate Change Fourth Assess- Programme of Action. Dhaka, Bangladesh. Ministry of Environ- ment Report. Geneva: IPCC. ment and Forests Government of the People’s Republic of Bangladesh. Islam, M.R., M. Ahmad, H. Huq, and M.S. Osman. 2006. State of the Coast 2006. Dhaka: Program Development Office for Mirza, M.M.Q. 2002. “Global Warming and Changes in the Integrated Coastal Zone Management Plan Project, Water probability of occurrence of floods in Bangladesh and impli- Resources Planning Organization. cations.” Global Environmental Change 12: 127–138. Islam, K.M.N., and R. Mechler. 2007. ORCHID: Piloting Mirza, M.M.Q. 2003. “Three Recent Extreme Floods in Ban- Climate Risk Screening in DFID Bangladesh. An Economic gladesh: A Hydro-Meteorological Analysis”, Natural Hazards, and Cost Benefit Analysis of Adaptation Options. Institute 28: 35-64. of Development Studies, University of Sussex, UK.
  • 128.
    102 E C O N O M I C S O F A D A P TAT I O N T O C L I M AT E C H A N G E Mirza, M.Q., R.A. Warrick, N.J. Ericksen, and G.J. Kenny. 1998. SMRC (SAARC Meteorological Research Centre). 2000. The “Trends and persistence in precipitation in the Ganges, Vulnerability Assessment of the SAARC Coastal Region due Brahmaputra and Meghna Basins in South Asia.” Hydrologi- to Sea Level Rise: Bangladesh Case. Dhaka: SAARC Meteo- cal Sciences Journal 43: 845–858. rological Research Centre, SMRC Publication. Mirza, M.M.Q. and A. Dixit. 1997. “Climate Change and Water UK DEFRA (United Kingdom Government Department for Resources in the GBM Basins.” Water Nepal 5 (1): 71–100. Environment, food and Rural Affairs). 2007. Investigating the Impact of Relative Sea-Level Rise on Coastal Communities and their Multi-purpose Cyclone Shelter Project (MCSP). 1993. Summary Livelihoods in Bangladesh. London, Government Department Report. Dhaka: Bangladesh University of Engineering and for Environment, food and Rural Affairs. Technology and Bangladesh Institute of Development Studies. UNDP (United Nations Development Programme). 2004. A Global Report: Reducing Disaster Risk: A Challenge for Development. Murty, T.S., and M.I. El-Sabh. 1992. “Mitigating the Effects of Available at http://www.undp.org/bcpr. Storm Surges Generated by Tropical Cyclones: A proposal.” Natural Hazards 6(3): 251–273. Unnikrishnan A.S., R. Kumar, S.E. Fernandez, G.S. Michael, and S.K. Patwardhan. 2006. “Sea Level Changes along the Nicholls, R. J. 2003. An Expert Assessment of Storm Surge “Hotspots.” Indian Coast: Observations and Projections.” Current Science Final Report (Draft Version) to Center for Hazards and Risk India 90: 362–368. Research, Lamont-Dohert Observatory, Columbia Univer- sity. New York. United Nations and the World Bank. 2010 (forthcoming). UnNat- ural Disasters: the Economics of Reducing Death and Destruction. Nicholls, R.J. and Leatherman, S.P. (1995) ‘The Potential Impact of Accelerated Sea-level Rise on Developing Countries’, WARPO-Halcrow et al. 2004. National Water Management Plan. Journal of Coastal Research, 14(special issue). Dhaka: Water Resources Planning Organization (WARPO), Government of the People’s Republic of Bangladesh (GOB), Pielke, R. A., C. Landsea, M. Mayfield, J. Laver, and R. Pasch. and Sir William Halcrow and Associates. 2005. “Hurricanes and Global Warming.” Bulletin of Ameri- can Meteorological Society November: 1571–75. Webster, P. J., G .J. Holland, J.A. Curry, and H-R. Chang. 2005. “Changes in tropical cyclone number, duration and intensity Quadir, D. A. and Md. Anwar Iqbal. 2008. “Tropical Cyclones: in a warming environment.” Science 309: 1844–46. Impacts on Coastal Livelihoods.” IUCN Working Paper. Dhaka International Union for the Conservation of Nature Woodworth, P. L., and D. L. Blackman. 2004. “Evidence for and Natural Resources. systematic changes in extreme high waters since the mid- 1970s.” Journal of Climate 17(6): 1190–97. Qureshi, A. and D. Hobbie. 1994. Climate Change in Asia. Manila: Asian Development Bank (ADB). World Bank. 2007. Floods 2007: Damage and Needs Assessment Report. Washington, DC: World Bank. Rahmstorf, Stefan. 2007. “A semi-empirical approach to project- ing future sea-level rise.” Science 315: 368–370.Available at: Woth, K., R. Weisse, and H. von Storch. 2006. “Climate change http://www.pik-potsdam.de/~stefan/Publications/Nature/ and North Sea storm surge extremes: An ensemble study rahmstorf_science_2007.pdf. of storm surge extremes expected in a changed climate projected by four different regional climate models.” Ocean Shultz, J. M., J. Russell, and Z. Espinel. 2005. “Epidemiology of Dynamics 56(1): Tropical Cyclones: The Dynamics of Disaster, Disease, and Development.” Epidemiologic Reviews 27: 21–35. Yu, W.H., et al. 2010. Climate Change Risks and Food Security in Bangladesh. London: Earthscan Publishers.
  • 129.
    BA N GL A D E S H CO U N T RY ST U DY 103
  • 130.
    104 E C O N O M I C S O F A D A P TAT I O N T O C L I M AT E C H A N G E Ministry of Foreign Affairs Government of the Netherlands The World Bank Group 1818 H Street, NW Washington, D.C. 20433 USA Tel: 202 473 1000 Fax: 202 477 6391 www.worldbank.org/eacc